
Deep learning-based signal processing for evaluating energy dispersal in bridge structures#
2021-08-25 08:11NhiNGOKIEUThaoNGUYENDAToanPHAMBAOTamNGUYENNHATHungNGUYENXUAN
Nhi NGO-KIEU ,Thao NGUYEN-DA,3 ,Toan PHAM-BAO ,Tam NGUYEN-NHAT ,Hung NGUYEN-XUAN
1Laboratory of Applied Mechanics (LAM),Ho Chi Minh City University of Technology (HCMUT),Ho Chi Minh City,Vietnam
2Vietnam National University Ho Chi Minh City,Ho Chi Minh City,Vietnam
3Ho Chi Minh City Department of Transportation,Ho Chi Minh City,Vietnam
4CIRTECH Institute,Ho Chi Minh City University of Technology (
HUTECH),Ho Chi Minh City,Vietnam
In this paper,we use deep learning to investigate a loss factor function (LF) for measuring energy dispersal in bridge structures in Ho Chi Minh City,Vietnam.The LF is calculated from the power spectral density (PSD) of random vibration signals to account for the mechanical parameters required for detecting structural changes.The LF is applied to many different types of bridge decks such as a prestressed concrete bridge,precast reinforced concrete bridge,and cable-stayed bridge.In addition,to ensure the new parameters are working effectively for the evaluation,a deep learning-based signal processing platform is used along with a convolutional neural network (CNN) to create the training.The training process helps eliminate interference values and errors.This demonstrates that the LF is sensitive to many different real-life structures while previous parameters are sensitive to only particular structures.
One of the dynamical properties,energy dissipation,has been rarely applied for the structural health monitoring (SHM) due to the complexity of the physical mechanism.In order to evaluate energy dissipation in the structure,LF is introduced as a variable with respect to frequencyω(Nguyen et al.,2021):
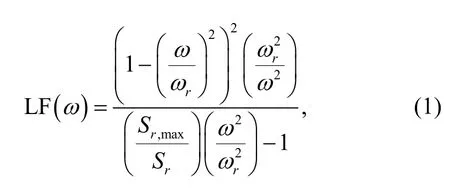
whereSrandωrare the PSD of acceleration and natural frequency of a mechanical system,respectively.In order to determine the LF,only the PSD of the output responseSris required without the input load.Therefore,LF is a potential tool to monitor bridge behavior under ambient load.
This study performs an LF survey for several bridge structures in Ho Chi Minh City.The structural states of the surveyed bridges are evaluated based on the length of service and the measurement of static displacement,stress,and deformation.Accordingly,based on the type of bridge girder,different types of structures with different load-bearing supports will lead to variations in mechanical deterioration rates.We choose three basic types of bridge structures:cable-stayed bridges,prestressed concrete bridges,and precast concrete bridges.To represent these three types of bridges,this study uses the following four structures:Phu My cable-stayed bridge,Giong Ong To 2 bridge,Saigon bridge,and Cong Dap Rach Chiec bridge.These bridges are considered as base structures and they are selected based on the same load conditions,with a clear difference in the time of structure exploitation.Figs.S1–S4 in electronic supplementary materials (ESM) show the pictures of the surveyed bridge structures.The four structural states are classified as good,quite good,medium,and bad.The states are numbered from 1 to 4.This classification of the bridge structures is shown in Table 1.
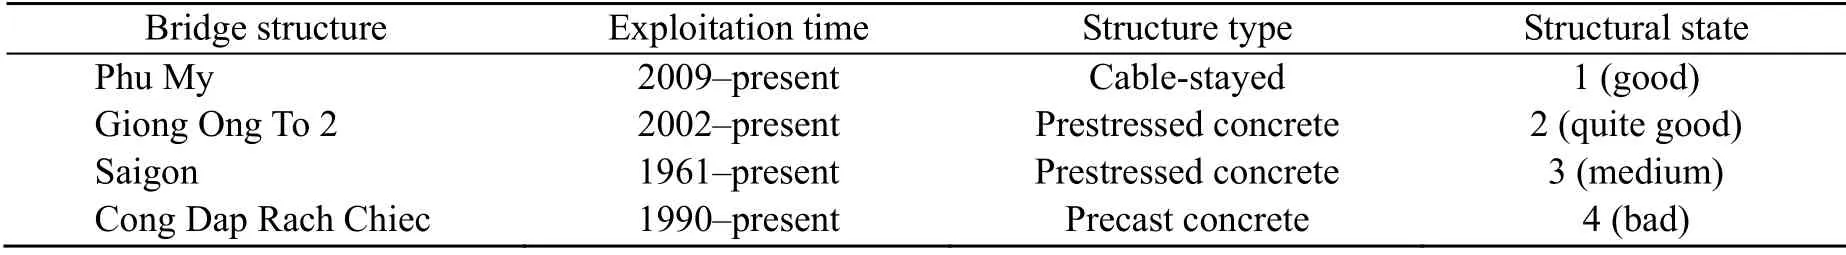
Table 1 Structural states of several bridges in Ho Chi Minh City,Vietnam
The measurement of acceleration signals is conducted with a fixed rule on the span of each bridge.A measuring arrangement is applied and shown in Fig.1.This measuring diagram is used for the four bridges.This measurement process obtains oscillation signals for the points along the span of the bridge.These signals will be processed by autocorrelation and Fourier transform to obtain the PSD.Due to the different mechanical properties of the surveyed bridge structures,each bridge has a relatively different PSD.Fig.2 shows the four normalized PSDs for any span of the four bridges used in the survey.
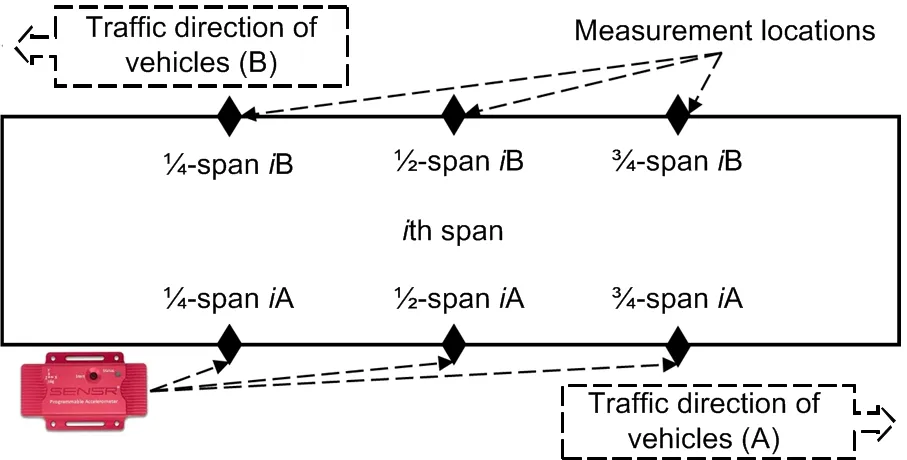
Fig.1 Measurement locations of a bridge’s span
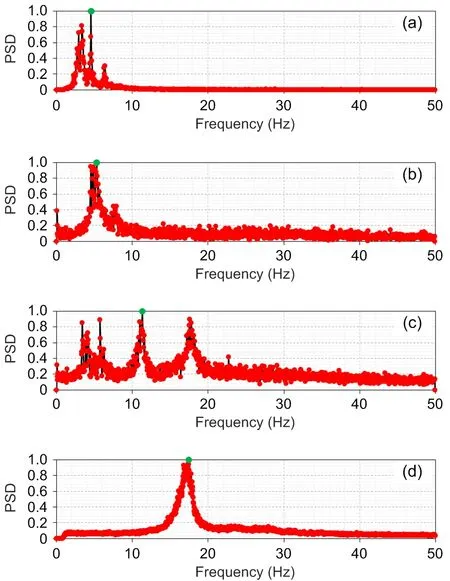
Fig.2 Normalized PSDs of bridges in Ho Chi Minh City,Vietnam in 2017:(a) the 15th span of Phu My cablestayed bridge;(b) the 1st span of Giong Ong To 2 bridge;(c) the 3rd span of Saigon bridge;(d) the 1st span of Cong Dap Rach Chiec bridge
Recently,the use of machine learning to solve boundary value problems in mechanics (e.g.the bending analysis of a Kirchhoff plate (Guo et al.,2019)) and the solution of partial differential equations (Anitescu et al.,2019;Samaniego et al.,2020) has been proposed.In addition,the use of feature extraction and analysis can be improved by machine learning to increase sensitivity to damage(Gao and Mosalam,2018;Yu et al.,2020;Wang and Cha,2021).Finally,we use the CNN (Abdeljaber et al.,2017;He et al.,2021;Lei et al.,2021) to extract features that are sensitive to damage with input LF.
TheLF evaluation method is built based on the survey of this factor’s distribution.The vibration spectrum will be used to calculate LF.A proposed CNN for application to database-based structure classification is the distribution of LF.Specifically,the steps to implement the assessment method are as follows:
Step 1:Measure the vibration signal and process it to obtain a PSD.
Step 2:Use the power spectrum obtained from Step 1 to calculate LF.
Step 3:Represent the distribution of LF according to the power spectrum amplitude;the value axes will be collimated to contain the values from 0 to 1.Collect distributional images obtained from this relationship.
Step 4:Construct a CNN for the structure classification based on the distribution of LF image.Data images are obtained from Step 3.
Step 5:Monitor classification results for SHM application.
Due to the change of force amplitude,LF may have different values.The LF value is determined by factors that influence the random loads,Young’s modulus,and the viscous coefficient.In this study,each random load gave a different set of LF values(Figs.3–6).
It is possible to see the distribution of LF values that are specific to each structure.Most of the LF values are small for the newest bridge,i.e.Phu My bridge,which has the shortest period of use.Only a few LF values have a massive difference (Fig.3).Almost all the values lie below the 0.4 threshold value.
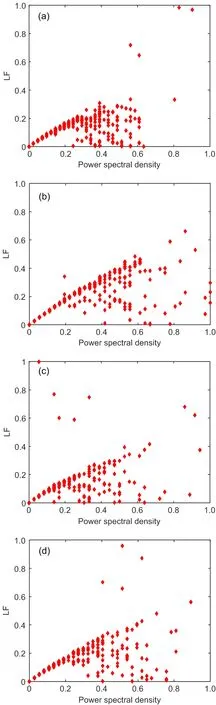
Fig.3 LF values of four points measured in Phu My bridge (2017):(a) point -span 15;(b) point -span 16;(c) point -span 17;(d) point -span 18
The next shortest period of use after the Phu My bridge is the Giong Ong To 2 bridge.This structure’s LF values are relatively evenly distributed and concentrated in areas with low spectral amplitudes,which are normalized spectral amplitudes with values less than 0.6 (Fig.4).These values are distributed roughly over a triangular surface.
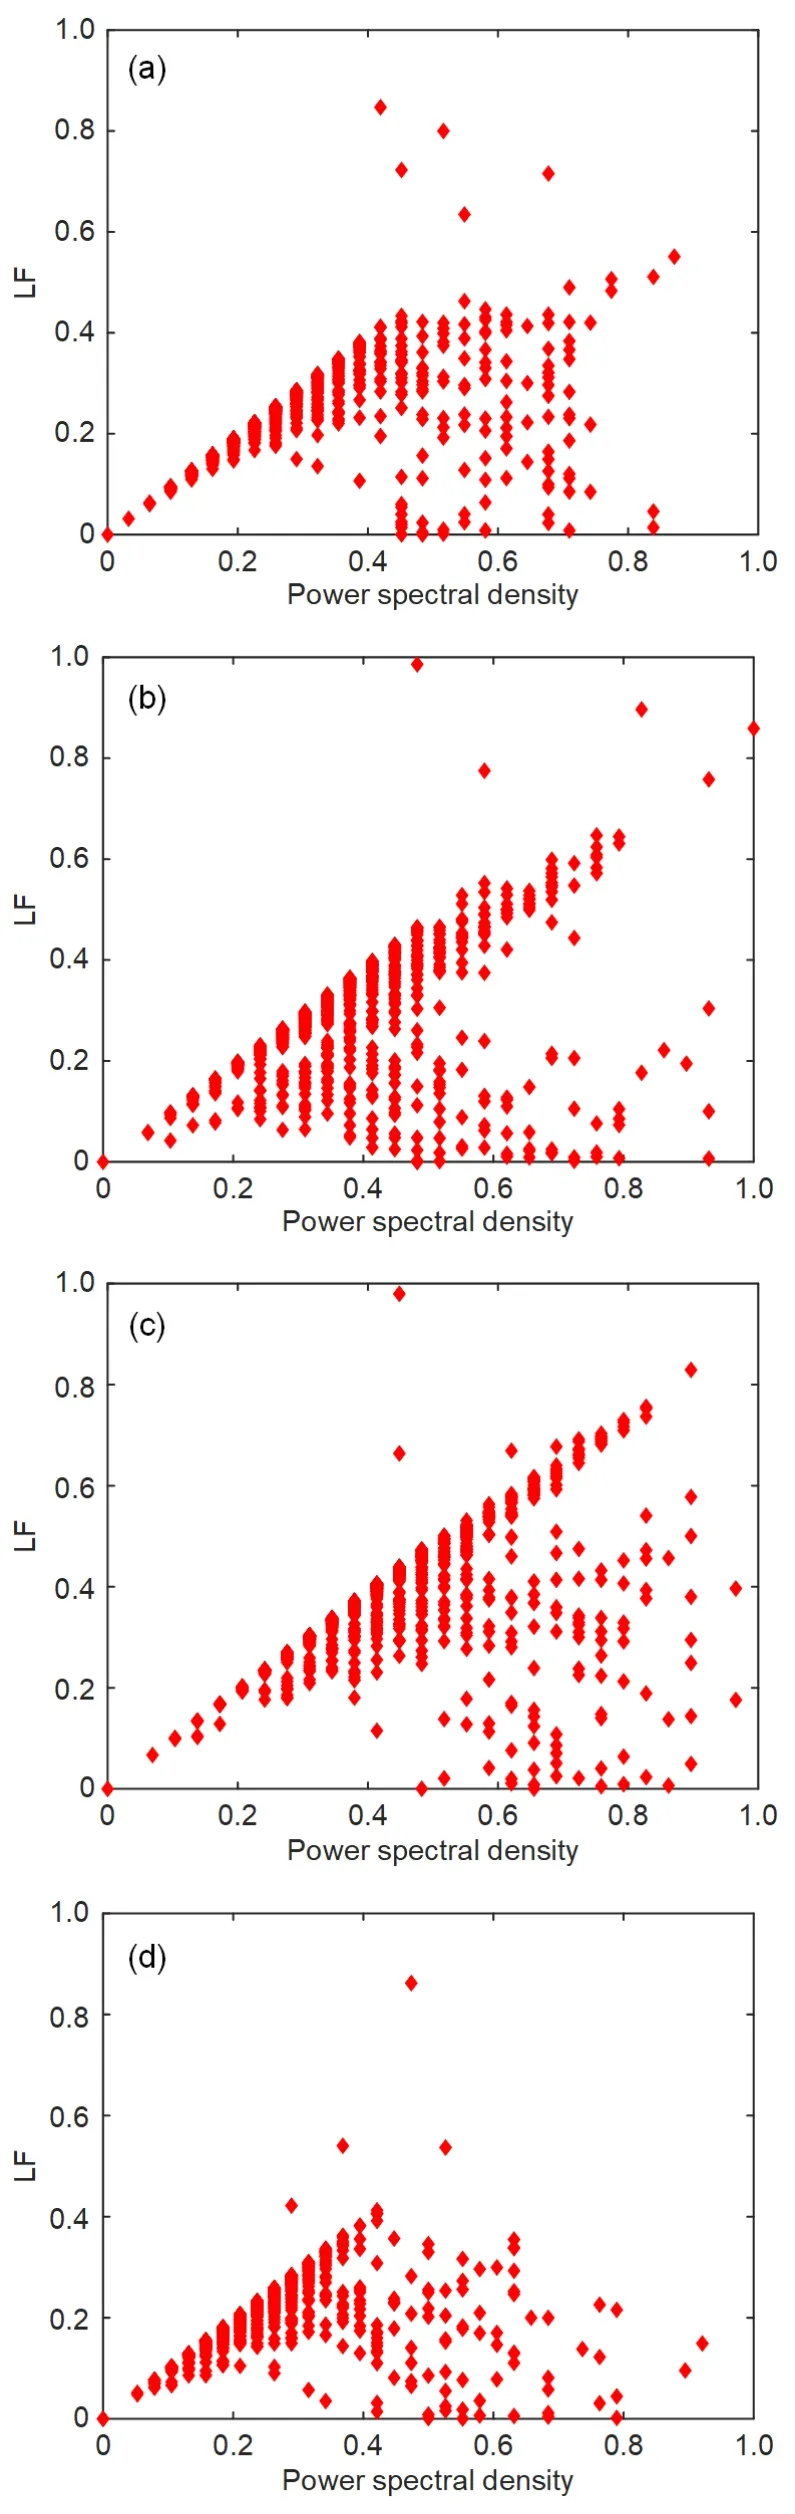
Fig.4 LF values of four points measured in Giong Ong To 2 bridge (2017):(a) point -span 1;(b) point -span 2;(c)point -span 3;(d) point -span 4
The Saigon bridge is the bridge that has been used from 1961 to the present but which had significant maintenance in 2000.This structure’s LF values tend to be evenly distributed and concentrated in regions with higher spectral amplitudes,where normalized spectral amplitudes are greater than 0.4(Fig.5).These values appear to be distributed over a trapezoidal surface.
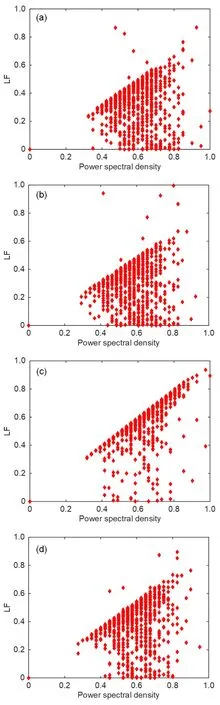
Fig.5 LF values of four points measured in Saigon bridge(2017):(a) point -span 1;(b) point -span 2;(c) point-span 3;(d) point-span 4
Finally,the bridge,which has had a long period of use and shows physical damage,is the Cong Dap Rach Chiec bridge.This structure has a rather unusual distribution of LF.It seems that the LF values are concentrated in a small region of the spectral amplitude;they are distributed here as a vertical line(Fig.6).The values outside this small area have a massive difference from the maximum value of LF.These values are almost zero on the distribution diagram.
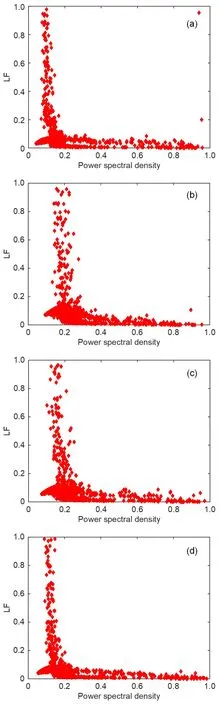
Fig.6 LF values of four points measured in Cong Dap Rach Chiec bridge (2017):(a) point-span 1A;(b) point-span 2A;(c) point -span 3A;(d) point -span 4A
Therefore,during SHM,the length of service is temporarily used to classify the structural states.Life span will lead to a change in the material properties of the structure.This change will consequently lead to a change in the distribution of the LF values.To evaluate and classify the structural states based on images of LF distribution,this study proposes the use of a CNN for image classification.The image size of the CNN input is 227×227×3 (in pixel).
This study uses a CNN architecture (Fig.7) with three pairs,which consist of a convolution layer,a pooling layer for the extractor network,and a fullyconnected layer,to recombine the features and perform classification using a hidden 3-layer neural network.The architecture of CNN is shown in Fig.8.Each convolution layer contains five filters with a kernel size of 10×10.The input image is the distribution of LF values based on the PSD amplitude.In general,the distribution of structural states is quite distinct,so we use convolution layers with large kernel sizes to optimize the quick recognition of distribution features.After each convolution layer,the mean-pooling layer with a kernel size of 6×6 is applied.Dropout layers are also applied to avoid overfitting.The applied dropout rate is 0.5.Feature maps passing through the last pooling layer will be sorted into a new feature matrix containing all of them through a fully-connected layer.
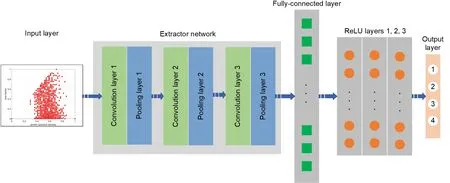
Fig.7 Proposed CNN architecture
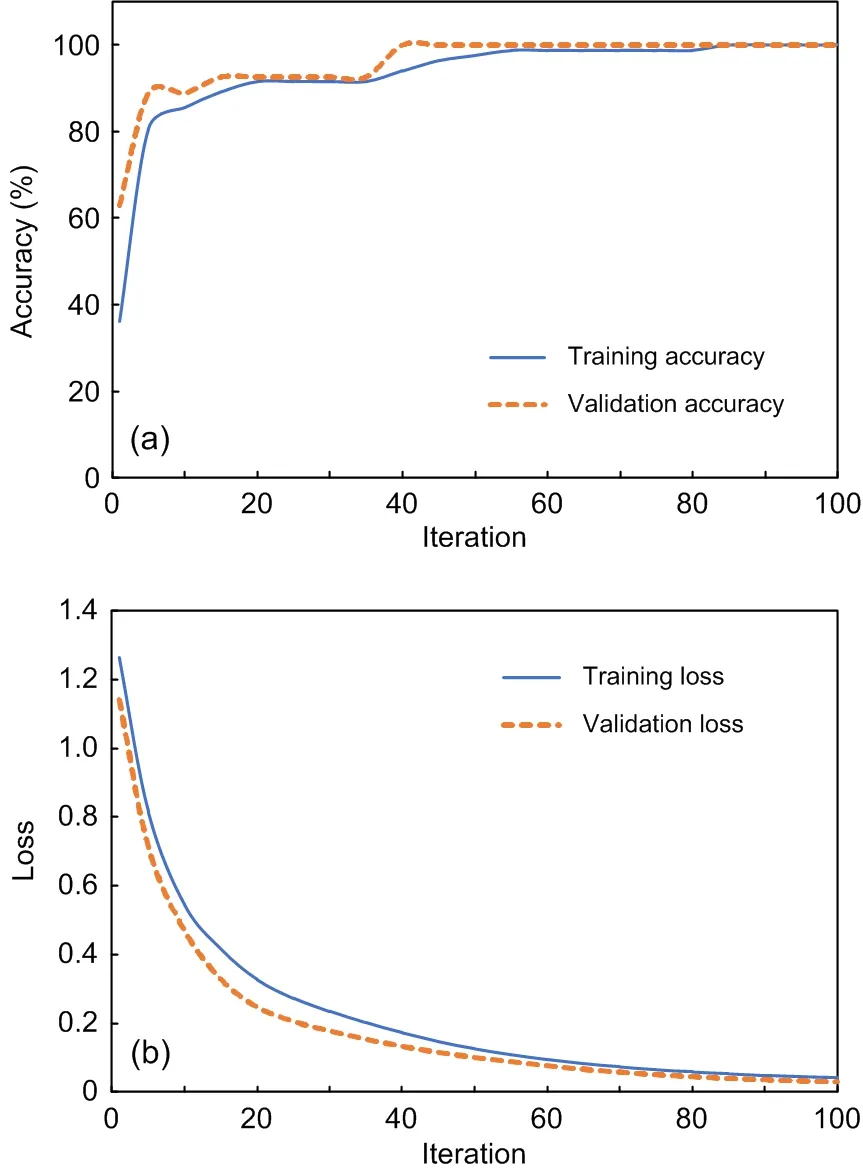
Fig.8 Accuracy (a) and loss (b) results of the training and validation processes of the proposed CNN
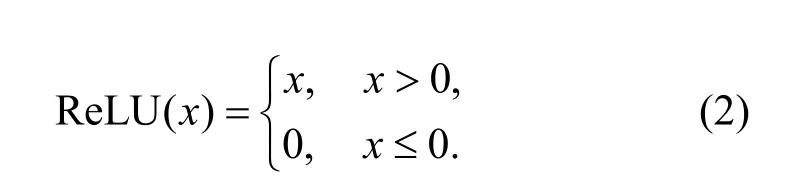
The classification neural network uses the activation function ReLU (rectified linear unit).The study uses three ReLU classes to classify the hidden layers,which are large enough to optimize the category without overloading the computation.The study will predict the percentage of the LF distribution belonging to the structural state.
Therefore,the softmax activation function is used.It is able to convert the result from the real number into a percentageai,where ∑ai=1 and 0≤ai≤1.Therefore,thisaivalue is considered as the probability of the LF distribution belonging to classi.
Or,similarly:

Softmax activation is
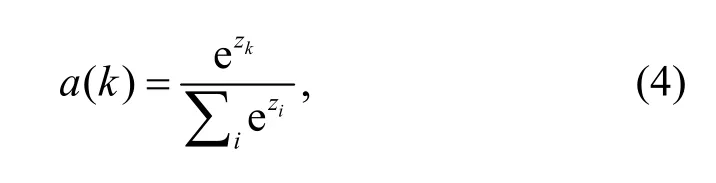
wherezkis thekth output of previous ReLU layer.
The process of updating weights and biases is conducted using the backpropagation method.This method is based on the principle of minimizing the loss function (L) value,which is determined as
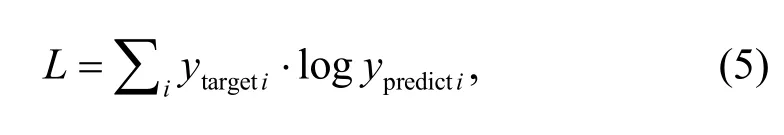
whereytargetiis the true value andypredictiis the predicted probability value of CNN.These values are for classi.
The optimal method used in the training CNN model is the mini-batch gradient descent (MBGD).It is the best among all the variations of the gradient descent algorithm.It is an improvement on both stochastic gradient descent (SGD) and standard gradient descent.It updates the model parameters after every batch.The dataset is divided into various batches,and after every batch,the parameters are updated.In this study,each mini-batch will have a data size of 64.
The data used for training and validation are the observation data from Phu My cable-stayed bridge,Giong Ong To 2 bridge,Saigon bridge,and Cong Dap Rach Chiec bridge in 2017.For each bridge,the measurement took place at three places along the span:¼,½,and ¾.For the Phu My bridge,it was measured at eight spans from span 15 to span 22 on one side of the direction of circulation (A).For each point measured within 32 min,the segment is 20 s in length,so the signal at a point is 96 signals.That is,with eight measuring spans,8×3×96=2304 signals will be obtained.Similarly,the Saigon bridge,measured at all 32 spans in one direction of circulation (A),will have 32×3×96=9216 feature images.Giong Ong To 2 is measured for all 16 spans in one traffic direction;there will be 16×3×96=4608 images.Finally,for the Cong Dap Rach Chiec bridge which has only three spans measured in both directions A and B,there will be 3×2×3×96=1728 featured images.The total number of data of the training and validation processes is 17 856.The data were randomly divided into 80% for training and 20% for validation.This CNN output helps to divide the structures into four structural states corresponding to four actual structures.The accuracy and loss results of the training and validation processes are shown in Fig.8.The proposed CNN model succeeds in classifying the structural states.The accuracy of training and validation data is approximately 100%.
Accuracy of 100% means that the training and validation processes end with confusion in prediction and the real value is zero.Thus,with 2304 data points for Phu My cable-stayed bridge,4608 data points for Giong Ong To 2 bridge,9216 data points for Saigon bridge,and 1728 data points for Cong Dap Rach Chiec bridge,all are determined precisely after the training process.Specifically,the data confusion matrix is shown in Fig.9.
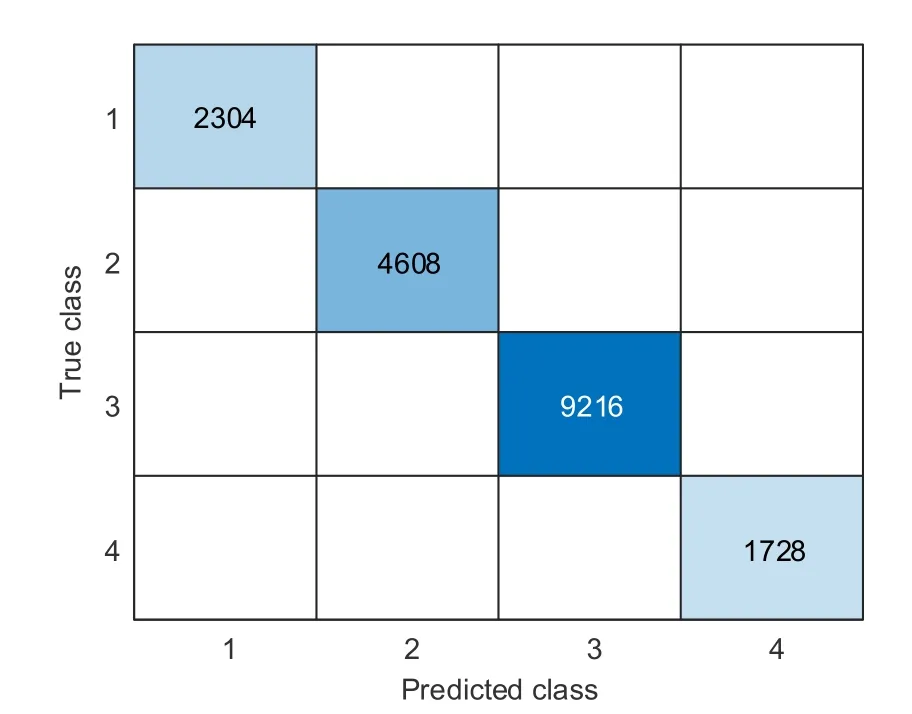
Fig.9 Confusion matrix of the predicted and actual class categories
The testing uses the database measured in 2019,two years after the training and validation data were measured.Pictures of the LF distribution for several spans of bridge structures in 2019 are shown in Figs.10–12.Phu My cable-stayed bridge was only measured at the 17th span,but the measurement was repeated many times.Other bridges were surveyed at some measuring points corresponding to different spans.Cong Dap Rach Chiec bridge was surveyed with 2018 measurement data (Fig.13) (p.680).The proposed CNN was performed with carefully measured data in 2018 and 2019 at some spans of the bridge structures used for the training.In particular,Phu My cable-stayed bridge was measured several times at span 17 in 2019.Giong Ong To 2 bridge was measured from span 8 to span 16,Saigon bridge was measured at spans 12,16–19,26,and 32,and Cong Dap Rach Chiec bridge was measured at all three spans of the bridge.In testing,each span was only measured at point ½,and 96 signals were processed in the frequency domain after the Fourier transform to become PSD to represent the span.In short,there were 26 featured images used for the testing process.
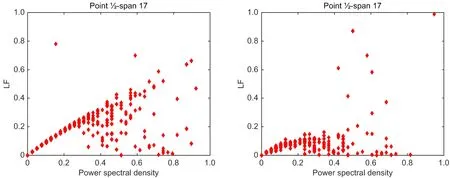
Fig.10 LF values of the 17th span measured in Phu My cable-stayed bridge (2019)
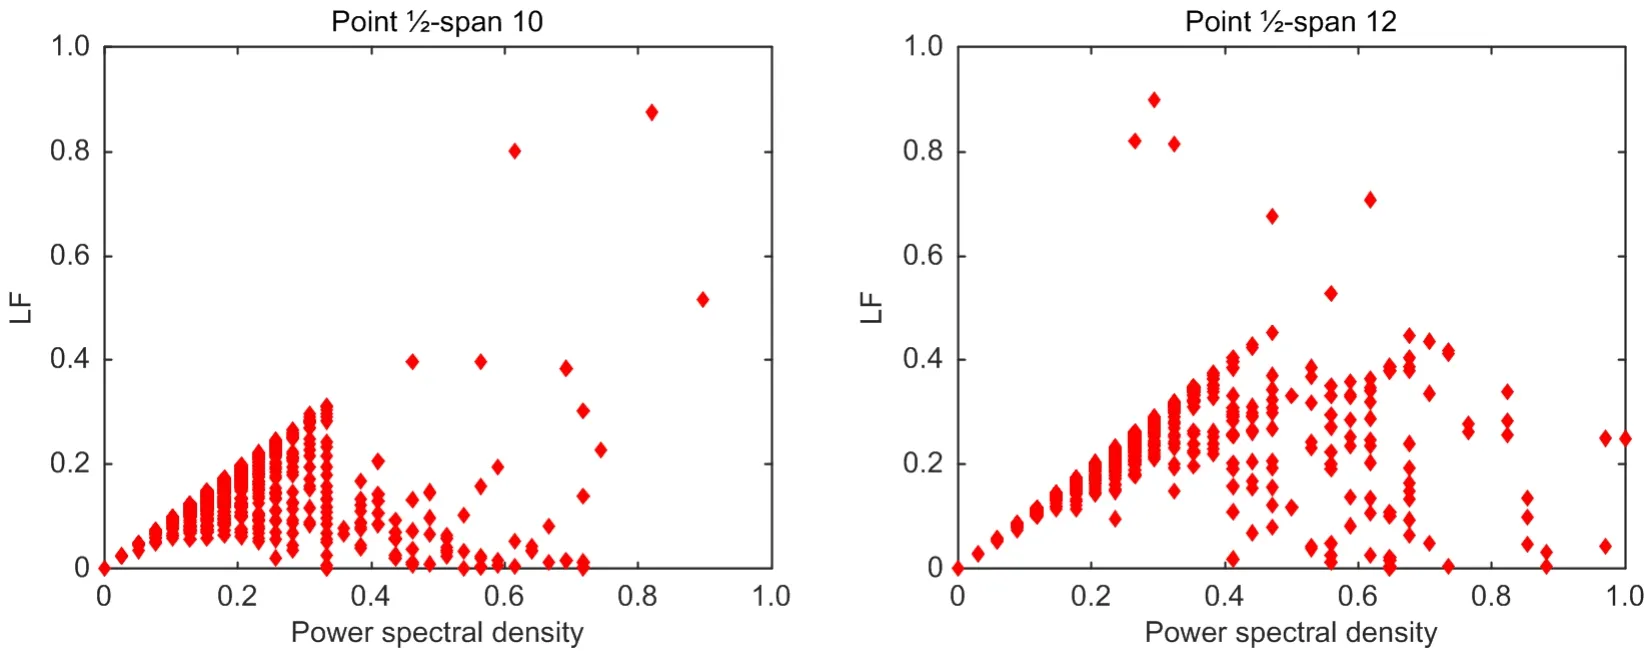
Fig.11 LF values of two points measured in Giong Ong To 2 bridge (2019)
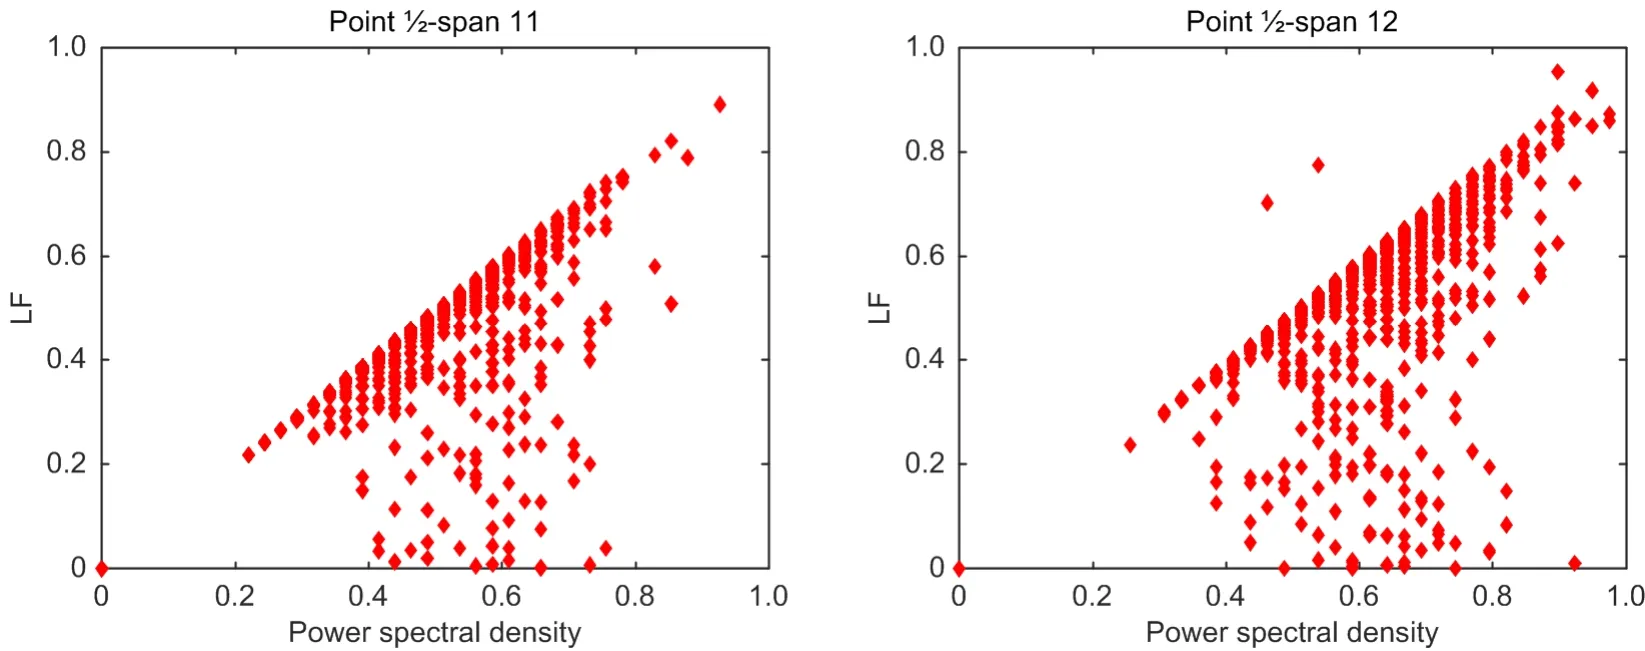
Fig.12 LF values of two points measured in Saigon bridge (2019)
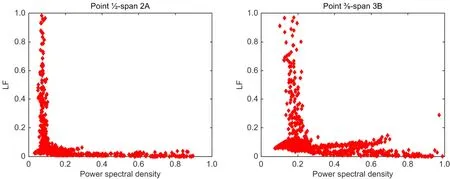
Fig.13 LF values of two points measured in Cong Dap Rach Chiec bridge (2018)
The classification results of CNN show a high level of accuracy.Structures are classified in four different states.Within two years of being measured for training data,the distribution of LF changed a little.Several spans of these bridge structures have major variations that lead to a change in the CNN prediction.The survey results are shown in Table S1 in ESM.
The results obtained from the testing process with observational data of bridges in 2018 and 2019 in Ho Chi Minh City show that the proposed CNN’s level of accuracy is high.The 26 data points treated for noise are normalized to represent 96 individual data points.Results obtained from the proposed CNN for this dataset show 25 correct results and one incorrect result.Thus,the rate of confusion is 1/26,which means the error is 3.85%.Accordingly,the accuracy of the set of 26 representative data points is 96.15%.Specifically,the proposed CNN confusion is shown in the confusion matrix in Fig.14 (p.680).
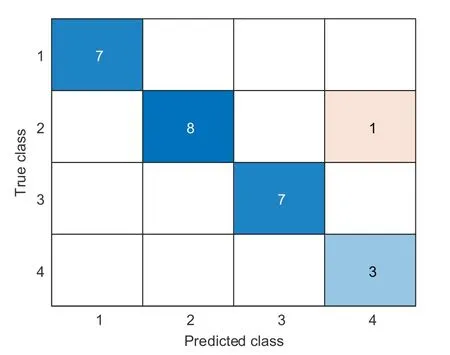
Fig.14 Confusion matrix of testing process
In this study,we considered some typical bridge structures in Ho Chi Minh City,Vietnam.The surveyed structures have differences in construction time,operational lifetime,and bridge structure.The vibration data of these bridges were used to classify structural states for the construction of the CNN.The proposed CNN’s inputs were images of the distribution of LF values.The results obtained from the CNN testing showed a high applicability of the proposed CNN.
The limitation of the proposed method is that CNN can only divide the structure state into four characteristics of the mechanical level of the material.In the fourth state,although damage has occurred in the bridge,it is necessary to carefully determine a threshold change of LF at the onset of failure.However,damage determination is not the focus of this paper;we only focus on investigating the mechanical deterioration of the material.The research will be further developed to serve the purpose of monitoring the structural health of the bridge.
Contributors
Nhi NGO-KIEU designed the research.Thao NGUYENDA,Toan PHAM-BAO,and Tam NGUYEN-NHAT processed the data.Toan PHAM-BAO wrote the first draft of the manuscript.Nhi NGO-KIEU helped to organize the manuscript.Hung NGUYEN-XUAN revised and edited the final version.
Conflict of interest
Nhi NGO-KIEU,Thao NGUYEN-DA,Toan PHAMBAO,Tam NGUYEN-NHAT,and Hung NGUYEN-XUAN declare that they have no conflict of interest.
 Journal of Zhejiang University-Science A(Applied Physics & Engineering)2021年8期
- Journal of Zhejiang University-Science A(Applied Physics & Engineering)的其它文章
- Micro-mechanical damage diagnosis methodologies based on machine learning and deep learning models
- A deep neural network-based algorithm for solving structural optimization#∗
- Physics-informed neural networks for estimating stress transfer mechanics in single lap joints#∗
- Surrogate models for the prediction of damage in reinforced concrete tunnels under internal water pressure