
Surrogate models for the prediction of damage in reinforced concrete tunnels under internal water pressure
2021-08-25 08:11AlirezaBIGDELIAydinSHISHEGARANMohammadAliNAGHSHBehnamKARAMIArshiaSHISHEGARANGholamrezaALIZADEH
Alireza BIGDELI ,Aydin SHISHEGARAN†‡,2 ,Mohammad Ali NAGHSH ,Behnam KARAMI ,Arshia SHISHEGARAN ,Gholamreza ALIZADEH
1School of Civil Engineering,Iran University of Science and Technology,Tehran 16846-13114,Iran
2Institute of Structural Mechanics,Bauhaus-University Weimar,Weimar D-99423,Germany
3School of Civil Engineering,Isfahan University of Technology,Isfahan 8174673441, Iran
4International Institute of Earthquake Engineering and Seismology,Tehran 19537-14453,Iran
5School of Civil Engineering,Islamic Azad University,Tehran 158474331,Iran
Abstract:In the present study,the performance of reinforced concrete tunnel (RCT) under internal water pressure is evaluated by using nonlinear finite element analysis and surrogate models.Several parameters,including the compressive and tensile strength of concrete,the size of the longitudinal reinforcement bar,the transverse bar diameter,and the internal water pressure,are considered as the input variables.Based on the levels of variables,36 mix designs are selected by the Taguchi method,and 12 mix designs are proposed in this study.Carbon fiber reinforced concrete (CFRC) or glass fiber reinforced concrete (GFRC)is considered for simulating these 12 samples.Principal component regression (PCR),Multi Ln equation regression (MLnER),and gene expression programming (GEP) are employed for predicting the percentage of damaged surfaces (PDS) of the RCT,the effective tensile plastic strain (ETPS),the maximum deflection of the RCT,and the deflection of crown of RCT.The error terms and statistical parameters,including the maximum positive and negative errors,mean absolute percentage error (MAPE),root mean square error (RMSE),coefficient of determination,and normalized square error (NMSE),are utilized to evaluate the accuracy of the models.Based on the results,GEP performs better than other models in predicting the outputs.The results show that the internal water pressure and the mechanical properties of concrete have the most effect on the damage and deflection of the RCT.
Key words:Gene expression programming (GEP);Taguchi method;Finite element (FE) analysis;Effective tensile plastic strain(ETPS);Deflection;Damage
1 Introduction
To convey water from the resource to hydropower plants and downstream,a pressure tunnel is used.The reinforced concrete tunnels (RCTs) are built in unstable rock conditions to prevent crack occurrence and water losses (Karami et al.,2019).Concrete lining is a useful method in tunnel engineering because it is a low-cost method and its construction is easy (Simanjuntak et al.,2014;Zhou et al.,2015;Pachoud et al.,2017).Achieving stability of the RCTs and reducing water losses are two principle concerns in designing RCTs (Dadashi et al.,2017).Several studies focused on analytical methods to determine the stress around the pressure tunnels(Bobet and Nam,2007) and the load carrying capacity of the concrete lining (Simanjuntak et al.,2014).Evaluating the stress and strain of concrete tunnels is an important measurement because they are the only way to convey water to hydropower plants;therefore,tunnel engineers need to design concrete tunnels,in which cracks do not occur (Karami et al.,2019).As a result,some studies evaluated the effect of internal water pressure on RCTs (Gong et al.,2014,2015).Brekke and Ripley (1987) proposed the design criterion for minimum principal stress around the RCTs.To avoid the incidence of hydraulic jacking,they suggested that the RCTs should be designed such that the value of the internal water pressure should be 1.3 times less than the minimum principal stress around the RCTs.After the first filling of the pressure tunnel,cracks often happen in the RCTs because of the tensile stress exceeding the tensile capacity of the concrete lining (Simanjuntak et al.,2014;Zhou et al.,2015;Dadashi et al.,2017).When cracks occur in the concrete lining,the water losses increase because of seepage.Ahmadi et al.(2007) developed a finite element (FE) model for simulating pressure tunnels.They showed that increasing the percentage of reinforcement bars and lining thickness has a positive effect on increasing their safety.Zhang et al.(2008)employed the elastoplastic behavior of the surrounding rock mass to simulate and evaluate the performance of the pressure tunnels.They evaluated the cracks and failure modes of the RCTs.Simanjuntak et al.(2012) used the thick-walled porous cylinder theory for evaluating the performance of the concrete lining.
In several previous studies,the effect of the percentage of reinforcement bars,the interaction between the RCTs and the surrounding rock mass,the tunnel size,and the quality of the rock mass on the performance of the RCTs under water pressure loads were evaluated (Parvathi et al.,2013;Zhou et al.,2015).Some investigations employed the finite element method (FEM),especially ABAQUS/Explicit,to simulate the effect of impact loads and water pressure load in the RCTs (Kristoffersen et al.,2018;Chaudhary et al.,2019).Fluid-structure interaction is one of the important parameters in simulating the RCT (Remseth et al.,1999;Leira,2016;Mandara et al.,2016).Colombo et al.(2016) employed a shock tube to evaluate the behavior of a protective layer intended for the RCT.
The prediction models can help to decrease the cost of time in each problem.Several studies used multiple linear regression (MLR) and multiple Ln equation regression (MLnER) in predicting the performance of reinforced concrete (RC) elements (Reza Ghasemi and Shishegaran,2017;Shishegaran et al.,2019).Gene expression programming (GEP) is one of the useful methods for simulating a phenomenon,which was used in predicting the deflection of RC panels,beam,and columns (Ghasemi and Shishegaran,2017;Shishegaran et al.,2020a).Some studies used artificial neural network (ANN) methods in predicting the performance of the RC elements (Erdem,2010;Amani and Moeini,2012;Peng et al.,2012).Although ANNs are strong and useful methods for predicting problems,visible models,such as GEP and MLnER,are more useful because these models present a formula for predicting the output;engineers can therefore employ them easily,and a complex device,like a computer,is not needed (Cheng et al.,2020;Shishegaran et al.,2020a;Zhang et al.,2020).
In the present study,the effect of several parameters,including the compressive and the tensile strengths of concrete,the size of the longitudinal reinforcement bar,the transverse bar diameter,and the internal water pressure,on the percentage of the damaged surfaces (PDS) of the RCT,the maximum deflection at the top of the RCT,and the effective tensile plastic strain (ETPS) of each sample are determined by developing nonlinear FE models.Moreover,principal component regression (PCR),MLnER,and GEP are employed to predict the PDS,the maximum deflection of the RCT,the deflection at the top of the RCT,and the maximum ETPS of each sample.The statistical parameters and error terms,including the coefficient of determination,root mean square error (RMSE),normalized square error(NMSE),mean absolute percentage error (MAPE),and the maximum positive and negative errors,are used to evaluate the accuracy of the models.
2 Methodology
The present study includes two main steps:(1)developing the FE model for simulating the performance of RCT under internal water pressure;(2)employing the linear and nonlinear models for predicting the PDS,the maximum ETPS,the maximum deflection of RCT,and the deflection at the top of the RCT.In the first step,the compressive and tensile strengths of concrete,the longitudinal bar diameter,the transverse bar diameter,and the internal water pressure are considered as the design and operation parameters.Based on the Taguchi method and the selected levels for each parameter,36 samples are simulated by developing the FE nonlinear model.For evaluating the effect of fiber reinforcement polymer(FRP) concrete on the performance of the RCT,12 samples are simulated based on the mechanical behavior of the FRP concrete.As a result,48 samples are simulated by FE nonlinear models in this study.Based on the obtained results from FE nonlinear models,the effect of changes in these parameters on the performance of the RCT is evaluated and compared.In addition,the effect of these parameters on the maximum deflection of the RCT,the deflection of the crown of the RCT,the damaged zone,and the maximum ETPS of each sample is measured through a nonlinear FE analysis.
In the second step,several surrogate models,including PCR,MLnER,and GEP,are employed to predict the maximum deflection of the RCT,the deflection at the top of the RCT,the PDS,and the maximum ETPS.The maximum positive and negative errors,MAPE,and some statistical parameters,including RMSE,NMSE,and coefficient of determination,are determined to evaluate and compare the accuracy of the surrogate models.The following flowchart summarizes the main steps in this study(Fig.1).
3 Finite element model
To investigate the performance of 48 samples of the RCT under internal water pressure loads,the analyses were carried out in the ABAQUS/Implicit package.
3.1 Material properties
In this part,the behaviors of the employed materials in the RCT,including the reinforcement bar and concrete,are explained as follows.
3.1.1 Concrete
To simulate the nonlinear behavior of concrete,the concrete damaged plasticity (CDP) model,which was proposed by Lubliner et al.(1989) and was modified by Lee and Fenves (1998),was employed in this study.The CDP can be used to simulate the behavior of concrete after a crack because of applying the elastoplastic and plastic behaviors of concrete(Rabczuk and Belytschko,2004;Rabczuk et al.,2010;Rabczuk,2013;Szczecina and Winnicki,2016).CDP was used to simulate the nonlinear behaviors of concrete in this study and several previous studies(Rabczuk and Belytschko,2006,2007;Rabczuk et al.,2008).The required parameters to define the CDP model will be given in Section 3.2.
3.1.2 Fracture energy of concrete
To avoid mesh dependent results,the stress-strain curve is scaled,which guarantees the ‘correct’ energy dissipation at post localization.This requires an additional material parameter,i.e.the critical energy release rateGF,which can be obtained experimentally(Chaboche,1992).In this study,due to the lack of the experimental data,GFwas estimated based on Chaboche (1992)’s study.
3.1.3 Steel
Two types of behavior,including elastic and plastic behaviors,should be simulated in nonlinear problems (Fahiminia and Shishegaran,2020;Shishegaran et al.,2020b).We used the elastic and plastic behaviors of the steel bar,which was also used by Dadashi et al.(2017).To account for the nonlinearity of the steel rebars,the isotropic hardening rule with the von Mises yield criterion was employed.
3.2 Pressure tunnel modeling procedure
In this study,the RCT of the upper Gotvand reservoir dam located in the southwest of Iran was considered for the validation of the FE model.The main purpose of the pressure tunnel was to convey water into the hydroelectric power plant.Tunnel excavation was done by Road-Header at a depth of 110 m under the free ground surface.The excavated tunnel has a circular form with a radius of 5.5 m.A composition of consolidation grouted zone and reinforced concrete lining was applied in order to increase the integrity of the construction.
To simulate the pressure tunnel,six steps were considered for obtaining accurate results:initial condition,tunnel excavation,rock settlement,installing reinforced concrete lining,grouted zone modeling,and imposing internal water pressure load.
The initial condition was obtained by defining the vertical and horizontal geostatic stresses distributions.Tunnel excavation was done by model change interaction based on the applied digging method;after the excavation of the tunnel step,the rock settlement step was specified to prevent rock settlement in the existing reinforced concrete tunnel lining.As a result,the concrete tunnel lining does not play any role in bearing loads.Then modeling of the grouted zone was carried out by a model change interaction.The model change interaction was used due to filling the gap between the lining and tunnel boundaries and the rehabilitation of damaged region in the rock.Finally,water pressure was applied to the inner surface of the RCT.
The mechanical properties of the rock mass,concrete lining,and steel reinforcement used in simulating the RCT of the upper Gotvand reservoir dam are shown in Table 1.The CDP model was applied to describe the behavior of concrete under water pressure,which is readily available in ABAQUS(Dassault Systemes Simulia Corp,2010).For the CDP model,the default values of the dilation angle,eccentricity,σb0/σc0,K,and viscosity parameter were used as 35°,0.1,1.16,0.667,and 0.0001,respectively,whereKis the shape of yielding surface,σb0/σc0is the stress ratio,σb0is the concrete strength in the biaxial state,andσc0is the concrete strength in uniaxial strength.
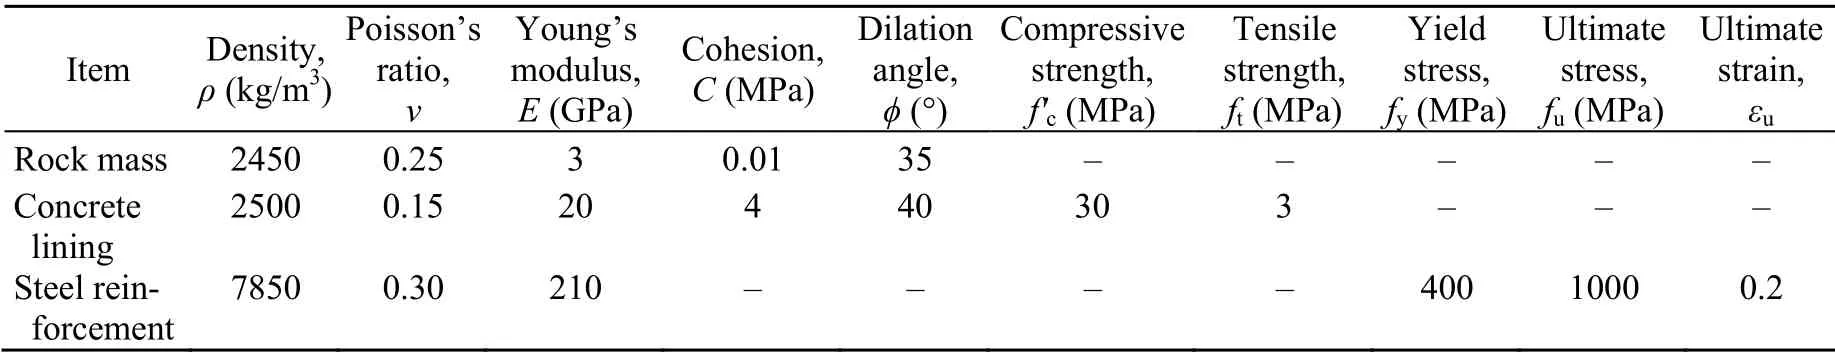
Table 1 Mechanical properties of the rock mass,concrete lining,and steel reinforcement in the RCT of upper Gotvand reservoir dam
Infinite boundary conditions were achieved by attaching three boundary sites to a finite block.For this purpose,a finite block which has 220 m in depth and width was chosen for the rock,and the tunnel length was considered 1 m.The meshed FE nonlinear model is shown in Fig.2.The rock and the concrete tunnel lining were modeled by C3D8R element;the prominent characteristics of this type of element include 8-node linear brick and reduced integration elements with hourglass control.The steel bars were modeled by T3D2,2-node linear displacement.The steel bars were embedded in the concrete element assuming a rigid connection,which is a sufficient assumption for the considered applications here.As can be seen in Fig.2,the boundary conditions of BC1 and BC2 were the same,and the right and left edges of rock were restricted in thexandydirections but were not restricted in thezdirection.The boundary condition of BC3 was restricted in thex,y,andzdirections because it was considered as bedrock.Moreover,there was no boundary condition for BC4 because the ground surface is free.The internal water pressure was applied to the internal surface of the RCT.In the validation specimens,the inner surface of the RCT was subjected to 0.2,0.4,0.6,0.8,and 0.9 MPa internal water pressure,respectively.
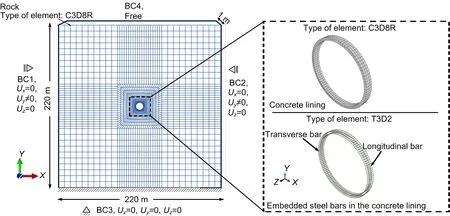
Fig.2 Mesh size of FE nonlinear model and the considered boundary conditions (BCs)
3.3 Validation of the numerical model and mesh sensitivity analyses
The tangential stress values in the concrete lining are one of the prominent considerations in designing pressure tunnels and shafts (Schleiss,1986).If the tangential stress in concrete exceeds its tensile strength,a crack will occur in the concrete lining,and water will seep behind the concrete lining (Schleiss,1986,1988,1997).Considering seepage force,Schleiss (1997) determined the maximum tangential stress in an uncracked concrete lining due to internal water pressure as follows:
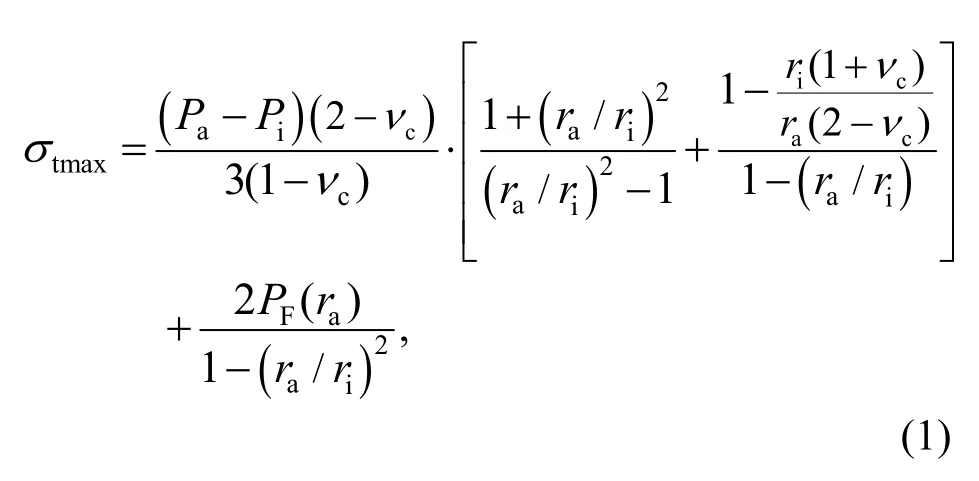
whereσtmaxis the maximum tangential stress in the uncracked concrete lining,Pais the water pressure on the outer side of the concrete lining,Piis the internal water pressure,rais the external radius of the lining,riis the internal radius of the lining,vcis Poisson’s ratio of concrete,andPF(ra) is the boundary pressure between the concrete lining and the rock which is calculated according to Eq.(2) (Schleiss,1997):
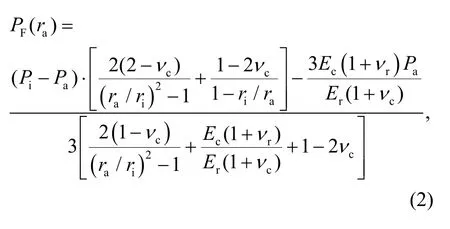
whereEcis Young’s modulus of concrete,Eris Young’s modulus of rock,andvris Poisson’s ratio of rock.To evaluate the accuracy and reliability of FE models,the obtained results from FE models werecompared with that obtained from the analytical formula Eq.(8) proposed by Schleiss (1986).Fig.3 shows the tangential stress changes in concrete lining under various internal water pressures,which were determined by FE model and analytical formula before observing any crack in the RCT.
To ensure convergence of the FE results and to find the optimum mesh size based on a trial-and-error method,mesh sensitivity analyses were conducted to evaluate the validity of the FE model. The mesh sizes,which are used near the tunnel cross-section,were smaller than the mesh sizes near the model boundary conditions,as shown in Fig.2.The mesh sizes of 0.7,0.6,0.5,0.4,and 0.3 m were evaluated in order to find the optimum one.According to Fig.3,the results of the FE model with 0.3 m mesh size were more reasonable than those using other mesh sizes.
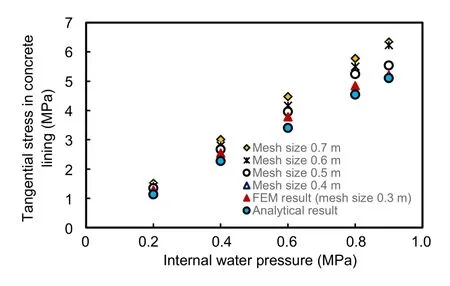
Fig.3 Comparison of the results of analytical method and FEM with different mesh sizes in tangential stress changes in concrete lining under various internal water pressures
4 Parametric study and thermo-mechanical analysis
4.1 Performance of RCT under various internal pressure
In this section,the effect of several parameters,including the compressive and tensile strengths of concrete,the size of the longitudinal reinforcement bar,the transverse bar diameter,and the internal water pressure,and two kinds of concrete,such as ordinary concrete and fiber reinforced concrete (FRC),on PDS,the maximum ETPS,and the deflection of the RCT were evaluated.
The samples are defined using their variables.C means the compressive strength of sample,R defines the longitudinal reinforcement bars used in the sample,V shows the vertical refinement bars used in the sample,and also P shows the applied internal pressure.For example,C30R16V16P23 means a sample with a compressive strength of 30 MPa,a used longitudinal reinforcement bars of 16 mm,a used vertical reinforcement bars of 16 mm,which was subjected to 2.3 MPa internal pressure.
Figs.4a–4d show the PDS of samples with ordinary concrete.Figs.4e and 4f show the PDS of the samples simulated by GFRC and CFRC,respectively.According to the results,the pressure has the most effect on the damage of the RCT;for example,the PDS was increased from 1.58% to 31.98% in the samples with a compressive strength of 25 MPa by increasing the applied pressure from 900 to 2700 kPa.No crack was observed on the samples subjected to 300 kPa pressure.In addition,the compressive strength plays an important role in decreasing the PDS.For example,the PDS of C30R16V16P23 is 21.04%and less than that of C25R16V16P23,and also the PDSs of C40R16V16P23 and C50R16V16P23 are 19.49% and 10.39%,respectively.Based on the comparison of the PDS of these samples,it is clear that increasing the compressive strength decreases the damage of the RCT.
As mentioned above,the compressive strengths of the mix proportions with a compressive strength of 40 and 50 MPa are increased to 57.5 and 62.31 MPa by adding 0.03% GFRP,respectively.Also,the compressive strengths of the mix proportions with a compressive strength of 50 and 60 MPa are increased to 69.9 and 64.45 MPa by adding 0.6% and 1% CFRP,respectively.In addition,the tensile strength of concrete is improved significantly.The tensile strength of various types of concrete was calculated based on previous studies (Li et al.,2009;Chandramouli et al.,2010;Shishegaran et al.,2020c).According to the results of FRC samples,by using the GFRP and CFRP,the PDS is decreased such that no crack was observed in the samples subjected to 300 and 900 kPa pressures.The results show that adding 0.03% of GFRP and 1% of CFRP improved the performance of the RCT because the damage to the RCT was decreased.
Figs.5a–5d (p.639) illustrate the maximum value of ETPS in the samples made from conventional concrete,whereas Figs.5e and 5f show the maximum ETPS in the samples built from the FRP concrete.PEEQT is the equivalent plastic strain of an element under tension.Based on these results,the pressure has the greatest influence on the ETPS of the samples;for example,in all the samples subjected to a pressure of 300 kPa,the maximum ETPS was calculated as zero,which means no yielding occurred in these samples.In contrast,when the pressure was increased from 300 to 900 kPa or 2300 kPa,yielding occurred.According to these results,the compressive strength of concrete has a considerable effect on the maximum ETPS of the RCT.In other words,increasing the compressive strength increases the maximum value of ETPS.
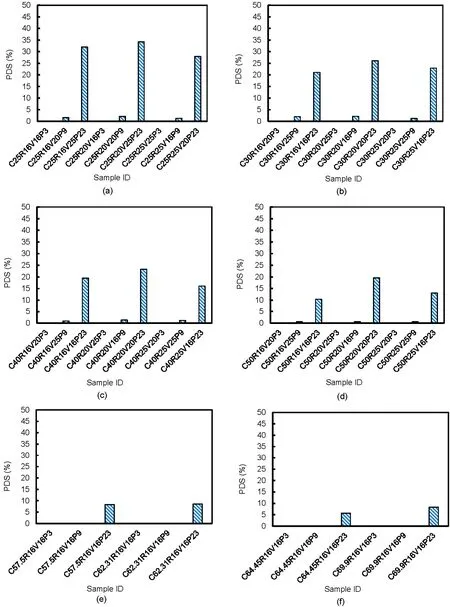
Fig.4 Summation of the area of the damaged zones in each sample
As shown in Fig.5e,using GFRC instead of conventional concrete increases the maximum ETPS of the RCTs;for example,adding 0.03% GFRP increased the maximum ETPS of the samples with a compressive strength of 40 and 50 MPa by 123% and 15.38%,respectively.Moreover,the maximum ETPS of the samples made from CFRC is higher than that of samples made from ordinary concrete.For example,adding 1% CFRP to concrete with a compressive strength of 50 MPa increased the maximum ETPS of the sample by 14.1% approximately.As mentioned above,the applied pressure with a value of 900 kPa results in the yielding of RCTs made from ordinary concrete,although no yielding was observed in the RCTs made from FRC under a pressure of 900 kPa.
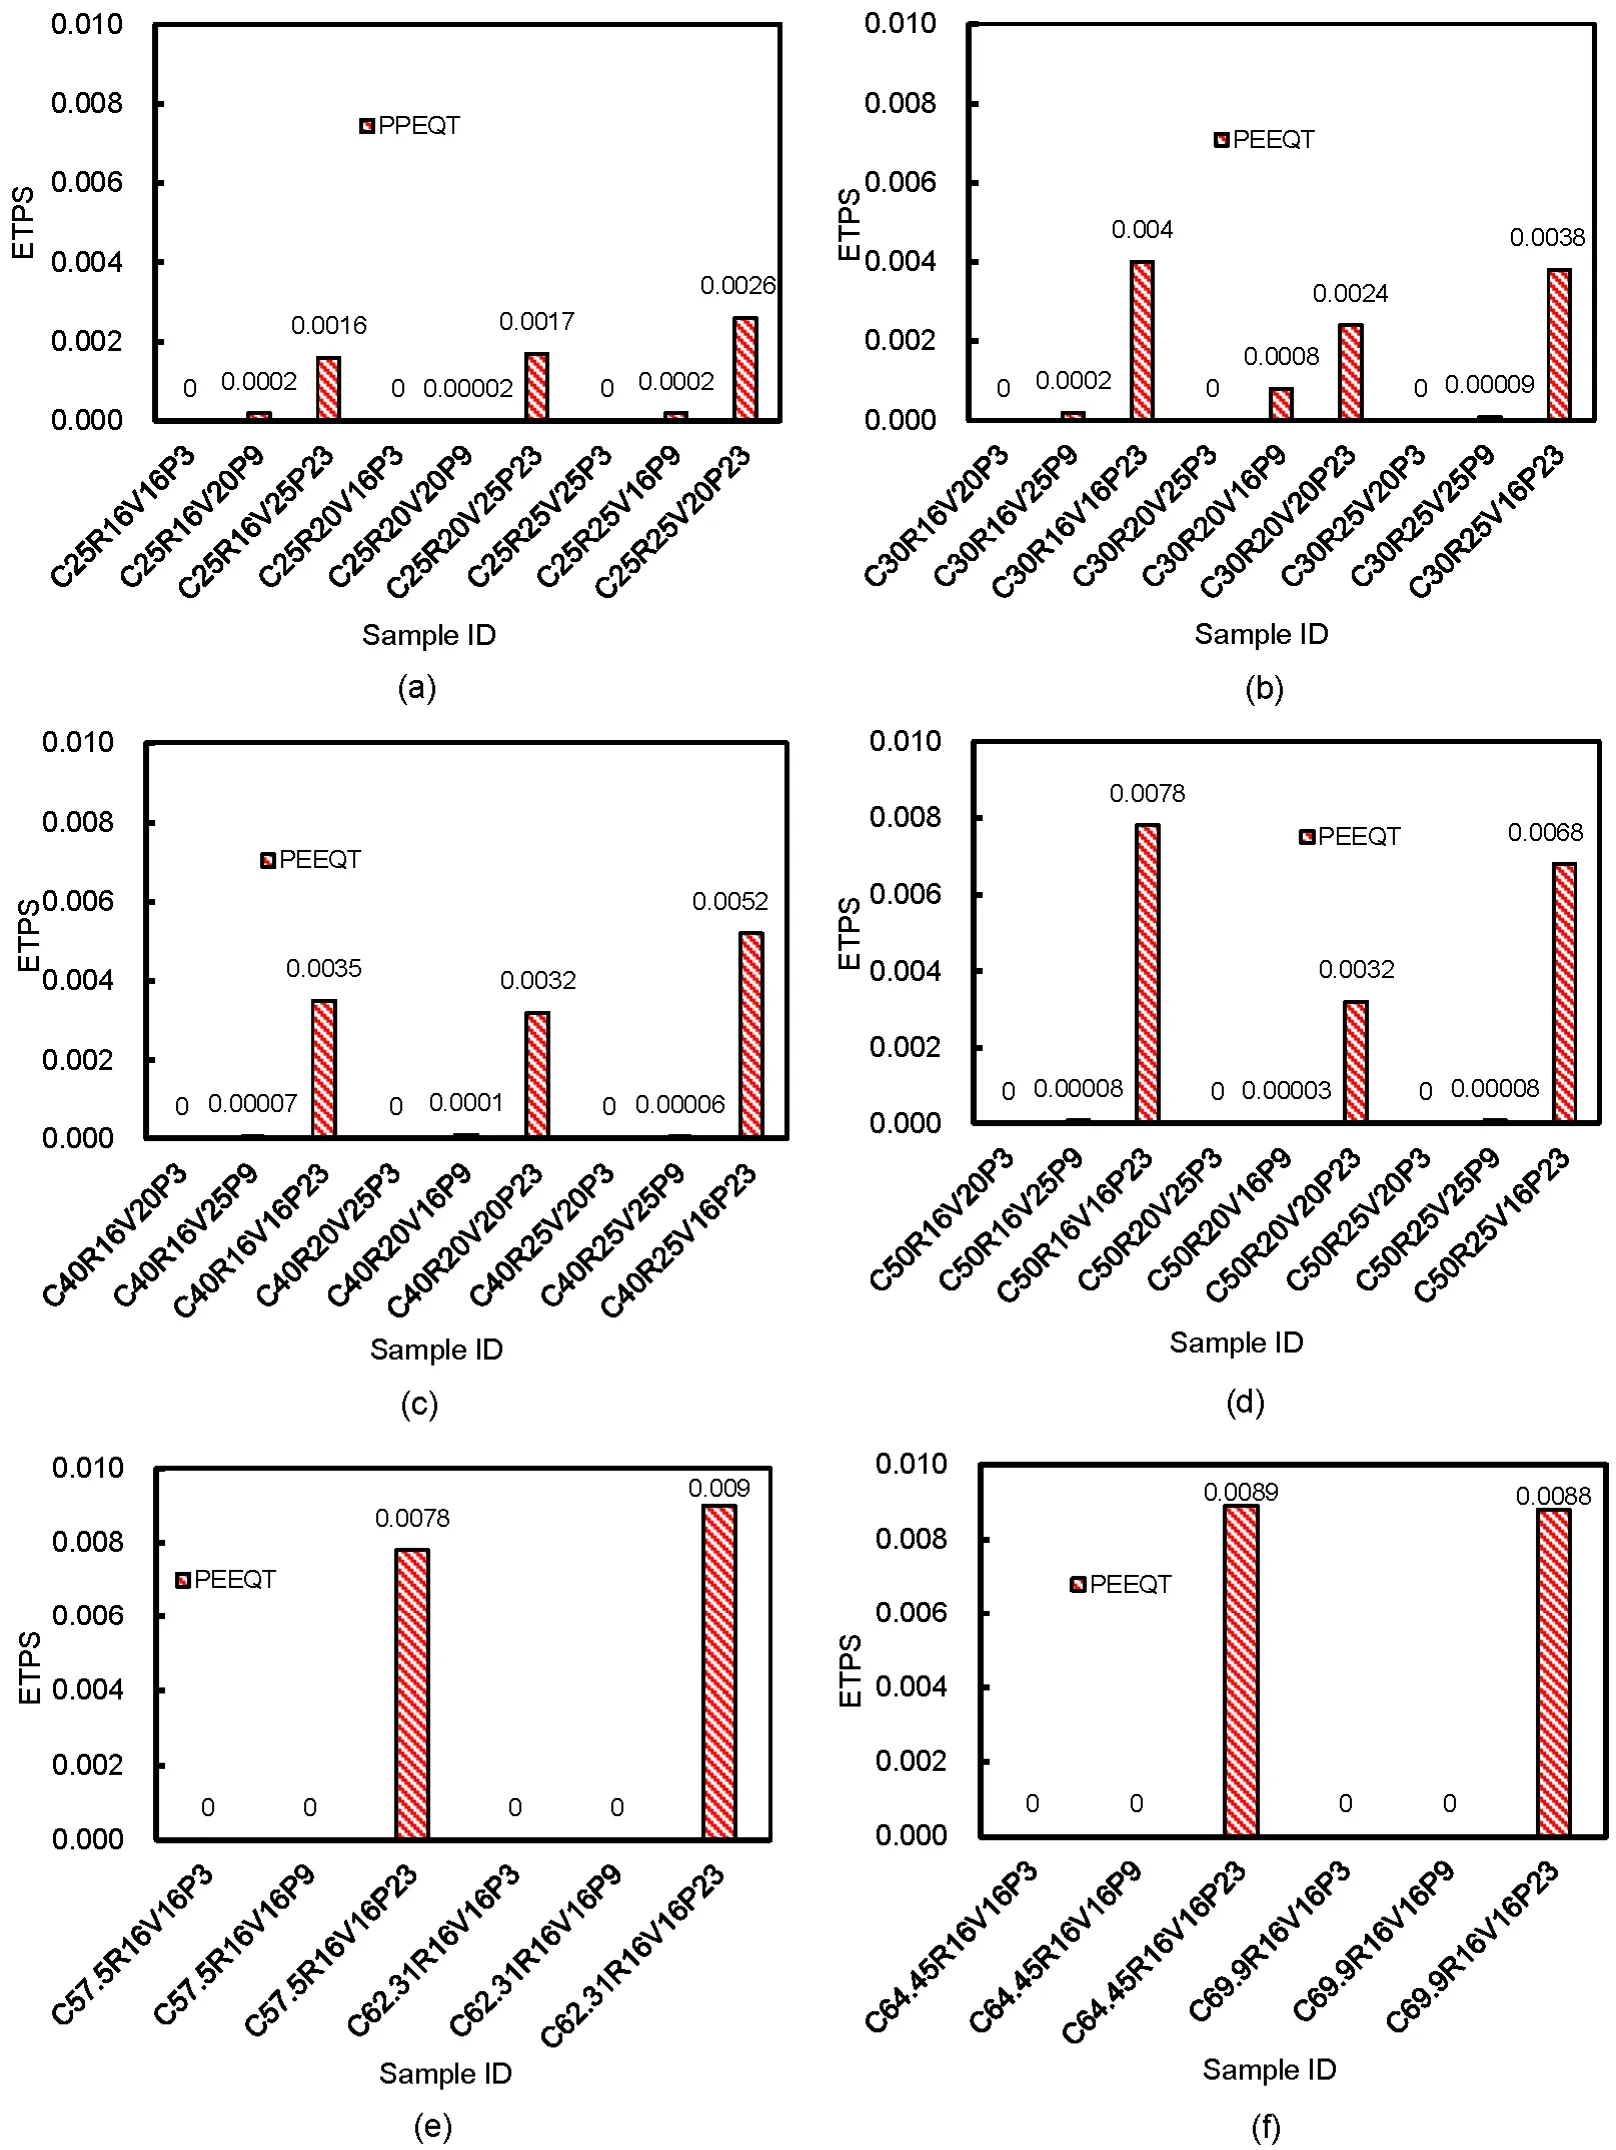
Fig.5 Summation of the maximum ETPS in each sample
The maximum deflection and the deflection at the top of the RCTs made from ordinary concrete are shown in Figs.6a–6d.The applied pressure was found to be the most effective parameter on the deflection of the RCTs such that changing the pressure from 900 to 2300 kPa increased the maximum deflection of all the samples by 60% approximately.Moreover,increasing the applied pressure from 300 to 900 kPa increased the maximum deflection of all RCTs by approximately 19%.As a result,it is clear that decreasing the applied pressure has a significant effect on decreasing the maximum deflections of the RCTs.Based on these results,in all samples subjected to a pressure of 300 or 900 kPa the maximum deflection occurred at the crown of the RCTs;however,there was a slight difference between the maximum deflection and the deflection at the crown of the samples subjected to a pressure of 2300 kPa.According to the results,by increasing the compressive strength of concrete from 25 MPa to 50 MPa,no significant changes were observed in the deflections of the RCTs;thus,the compressive strength of concrete does not have a significant effect on the deflection of the RCTs.
According to Fig.6e,adding GFRP to concrete decreased the deflections of the RCTs slightly;for example,adding 0.03% GFRP to concrete decreased the maximum deflection of the samples made from C40 and C50 concrete by 4.00% and 3.66%,respectively.Similar results were obtained when 1% CFRP was added to the C50 concrete.Therefore,adding GFRP or CFRP to concrete has a slight effect on decreasing the deflections of the RCTs.
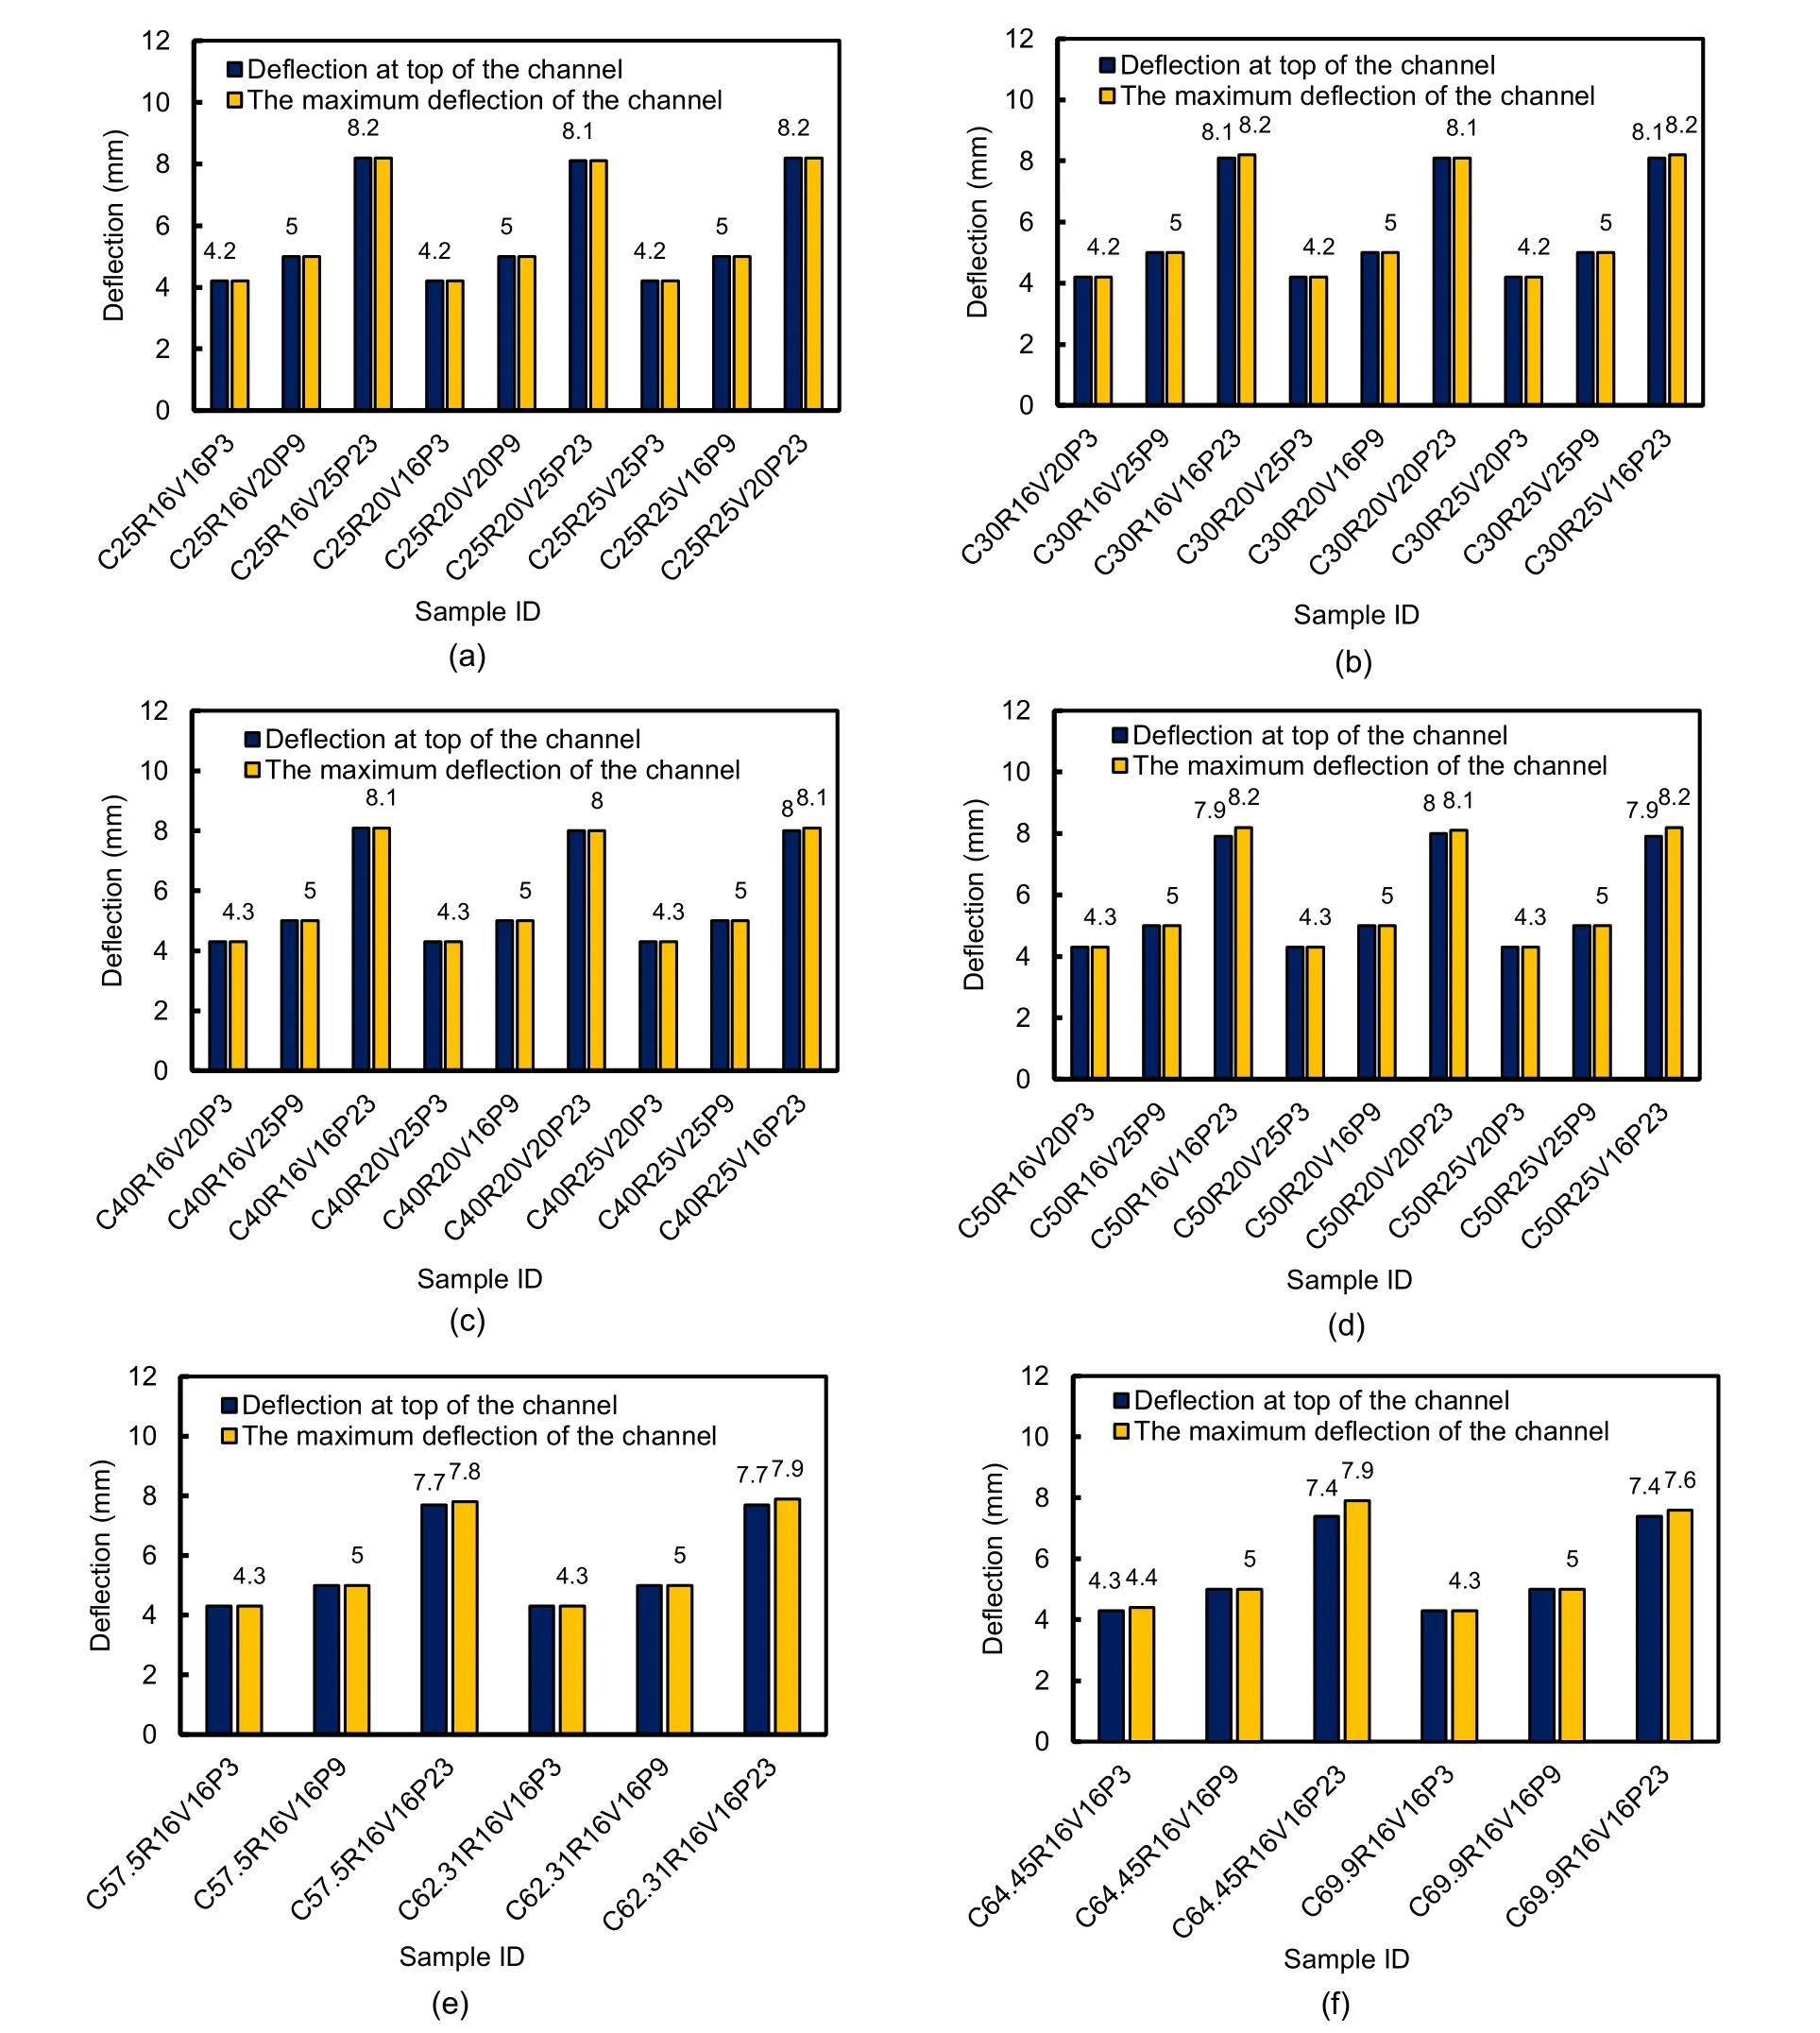
Fig.6 Summation of the maximum deflection and deflection at the top of each sample
4.2 Failure modes
The maximum variations of tensile damage(DAMAGET) for different compressive strengths of ordinary concrete are shown in Fig.7.Overall,the crown and invert of RCTs are two main parts that are susceptible to fracture and crack.Moreover,according to Fig.8,there was some low damage on the sidewall of the RCTs.
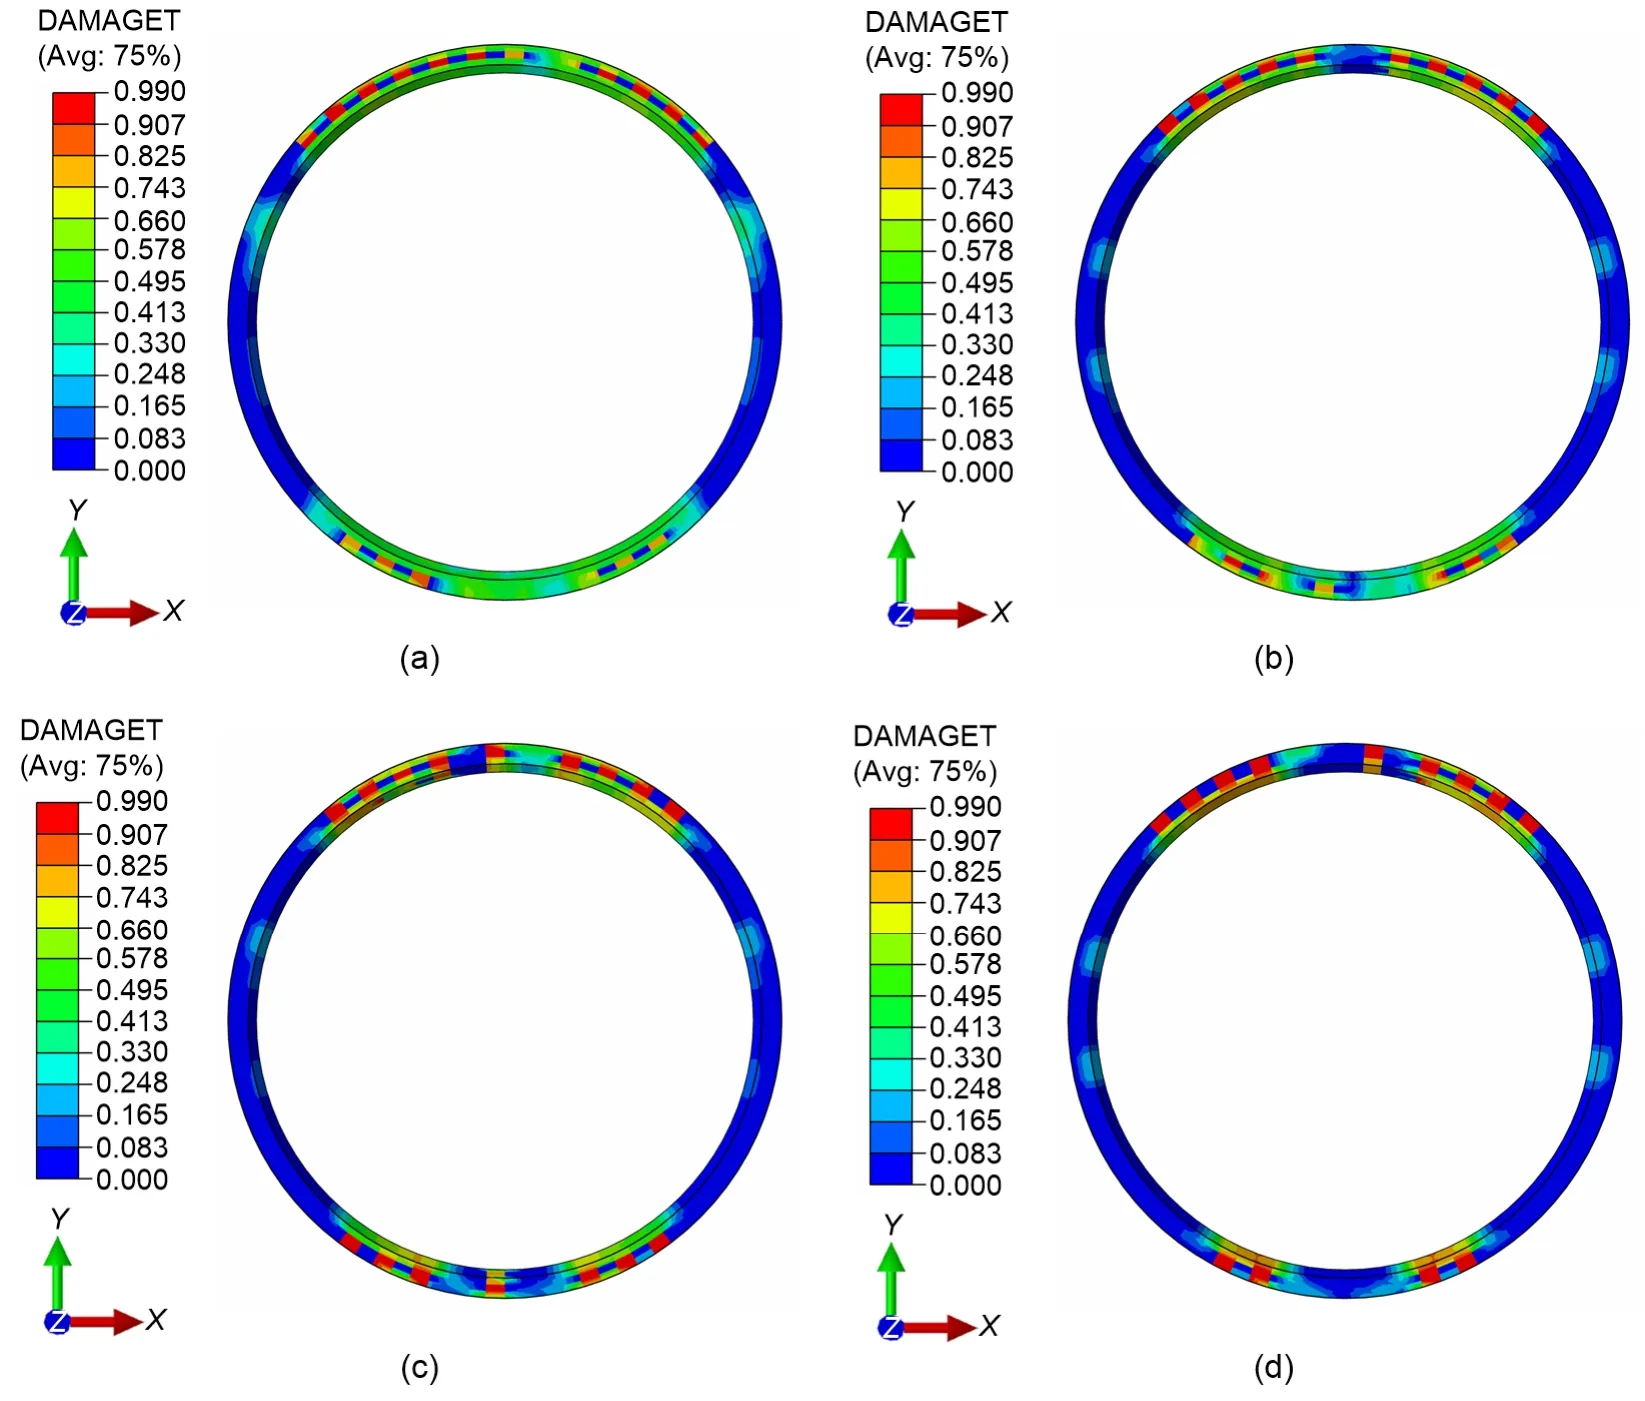
Fig.7 DAMAGET for various compressive strengths of each ordinary concrete under 2.3 MPa of water inner pressure
As can be seen in Fig.7,by increasing the compressive strength of ordinary concrete,the tensile damage distribution decreased but did not prevent crack formation.In designing the pressure tunnel,selecting a suitable concrete with significant compressive strength is important because this factor can reduce the PDS of the RCT.In addition,a suitable mix proportion for concrete with a significant strength can prevent fracture of the RCT.The significant point is that the crown of the RCT is more susceptible to damage than the invert and sidewall of the RCT.On the other hand,the first damage occurs at the crown.
The DAMAGET with various compressive strengths of the FRC are shown in Fig.8.Based on the results,the crown and invert of the RCT are two main parts that are susceptible to fracture and crack.The results show that using FRC instead of ordinary concrete significantly reduces crack.
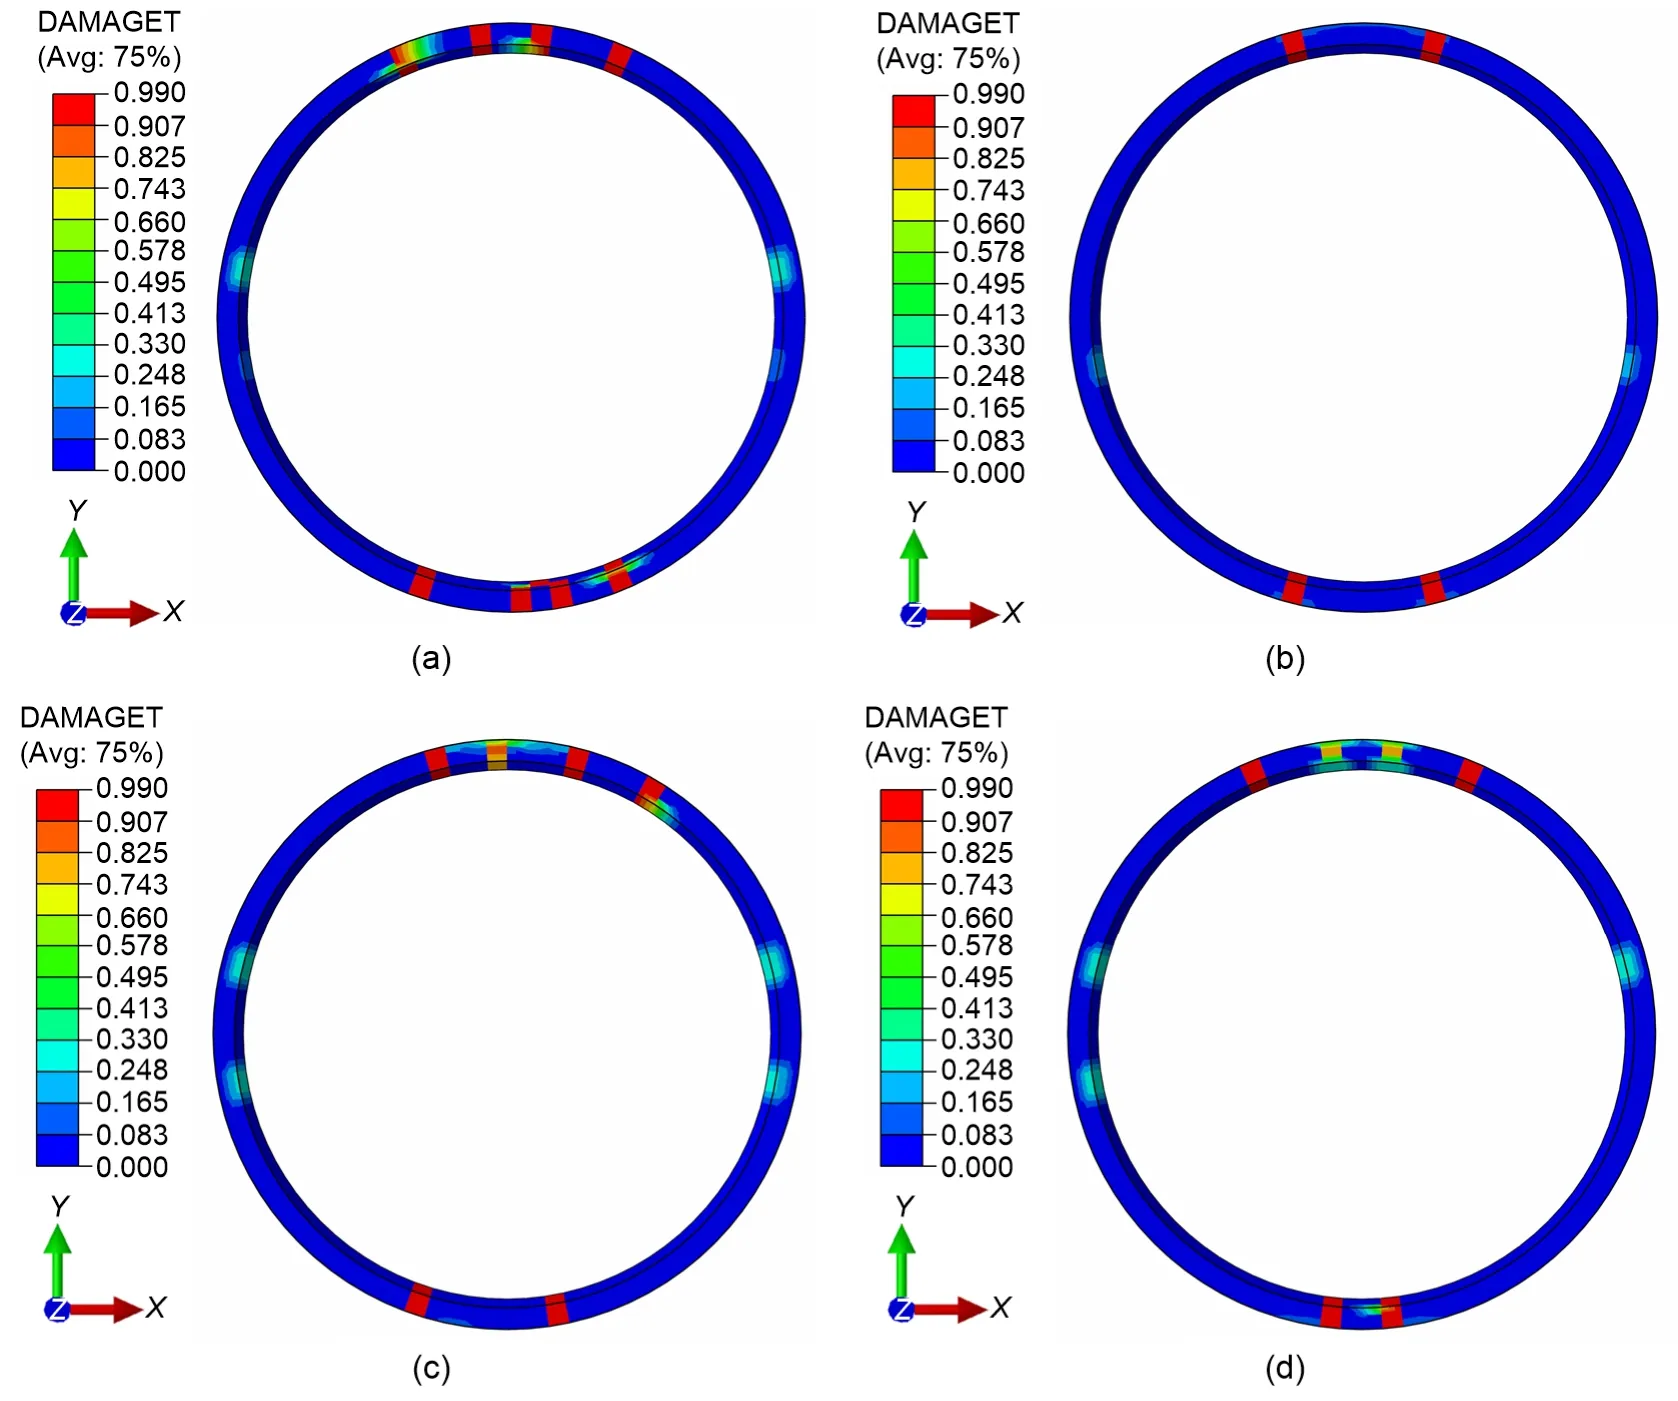
Fig.8 DAMAGET with different compressive strengths of the FRC under 2.3 MPa of water inner pressure
Among the RCTs reinforced with GFRP and CFRP,reinforcing with GFRP is recommended because the cracks of the sample,in which GFRP with a percentage of 0.03% was used,were less than that of other samples.
The distributions of von Mises stress in steel reinforcement of two RCTs,including C25R20V25P23 and C69.9R16V16P23,were compared because the maximum and minimum damages occurred in these samples,respectively (Fig.9).The distributions of von Mises stress in transverse bars of the C25R20V25P23 are more than those of C69.9R16V16P23,while the transverse bar size of C69.9R16V16P23 is less than that of C25R20V25P23.As a result,the transverse bar size has a prominent role in preventing damage in concrete tunnel linings.Based on the results,by reducing the transverse bar size,and adding GFRP to concrete,the tensile strength of the concrete tunnel lining increases because less damage occurs in the concrete due to the stress transfer mechanism between the transverse bar and concrete.It is clear that damage distribution and von Mises stress distributions in transverse bars increase by increasing the transverse bar size,and using ordinary concrete with minimum compressive strength.
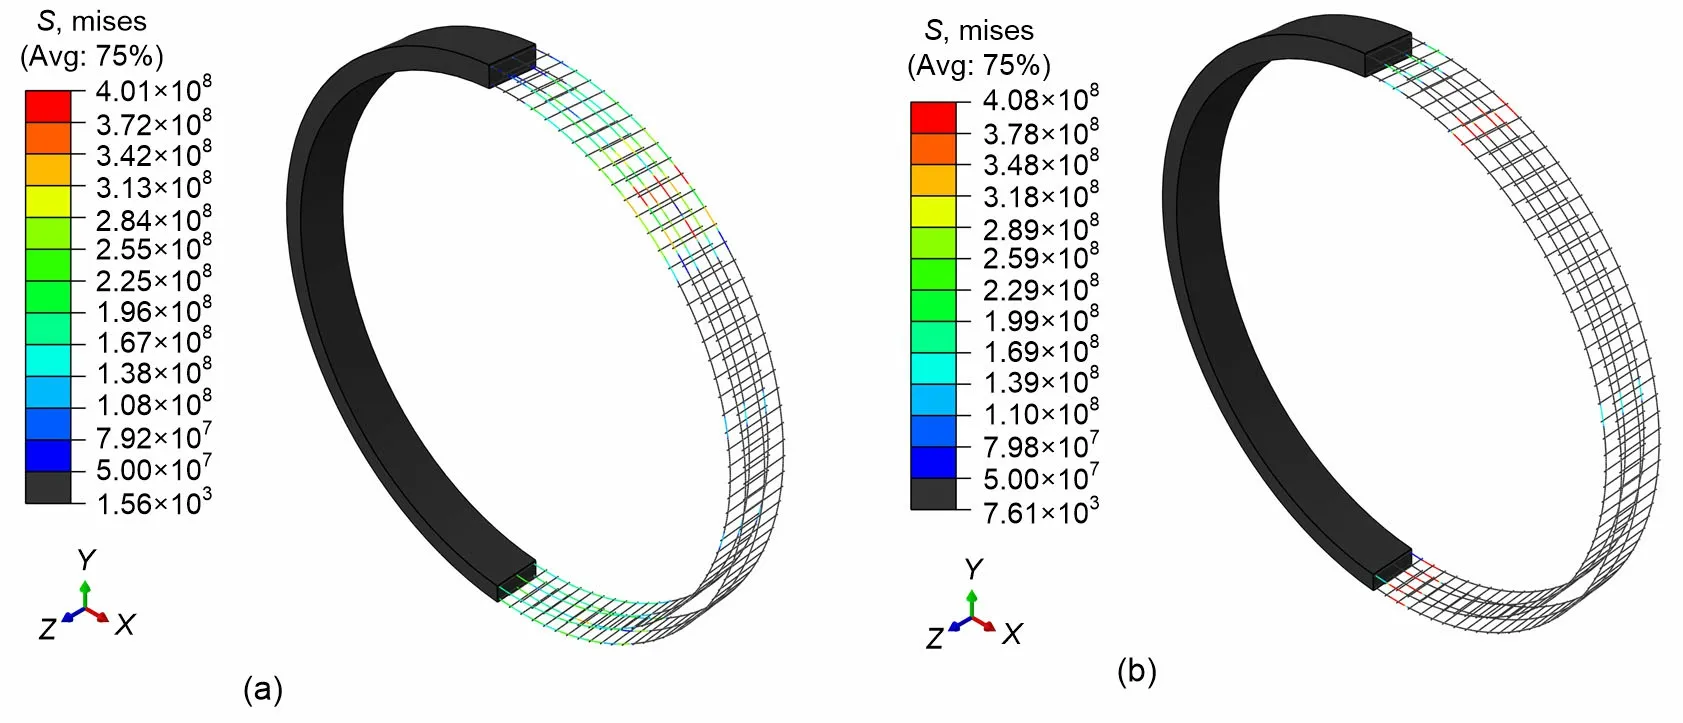
Fig.9 Distributions of von Mises stress (S) in steel reinforcements of two RCTs (unit:N/m2)
Deflection distributions of two selected RCTs as representation of the maximum and minimum damaged samples along theY-axis direction are shown in Fig.10.The failure mode of the samples was evaluated according to the shape of the concrete tunnel lining,as shown in Fig.10.According to previous studies,the damage distribution depends on the coefficient of lateral rock pressure (k0) (Tunsakul et al.,2014;Karami et al.,2019).When the coefficient of lateral rock pressurek0<1,cracks occur in the crown and the invert of the tunnel,and,fork0≥1,they happen at the sidewalls of the RCT.Ifk0is obtained as 1 based on the design report,the cracks occur in the crown,the invert,and sidewalls of the RCT.The scaled deformation shape of the RCTs shows that the deformation variation in they-axis was more than those in thex-axis;therefore,damage distribution in the crown and invert of the tunnel was more significant than that in its sidewalls,as shown in Figs.7 and 8.According to previous studies and the shape of damage distribution in elements of the RCTs,the dominant failure mode in the pressure tunnel was the tensile failure mode (Karakouzian et al.,2019a,2019b).
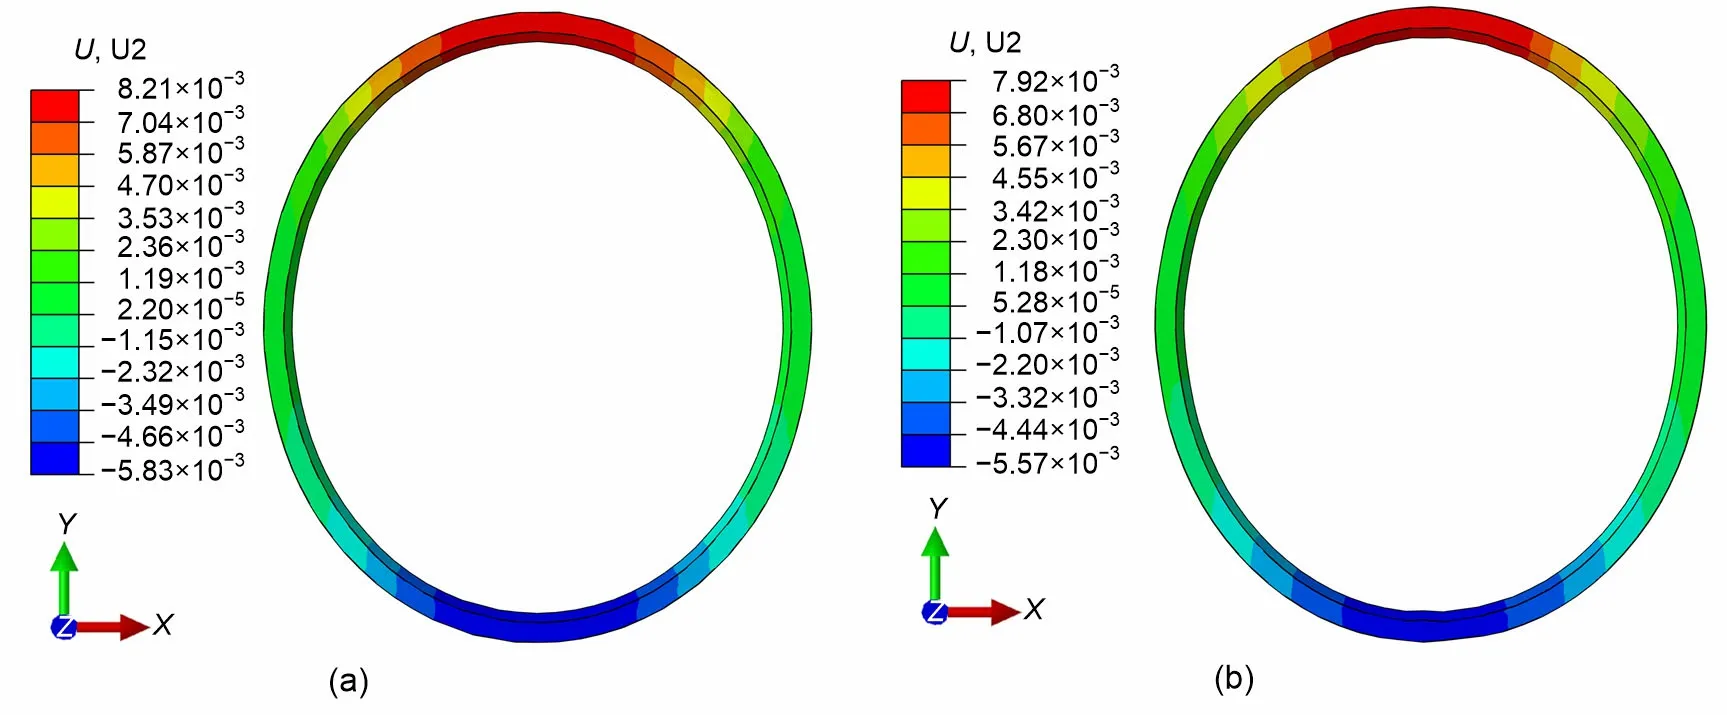
Fig.10 Distributions of deflection along the Y-axis direction in RCT models (unit:m)
5 Prediction model
According to the results of FE models,three surrogate models are used to predict the maximum deflection,the deflection at the top of the RCT,the maximum ETPS,and the PDS.These methods include PCR,MLnER,and GEP.There are two steps in each model,including calibration and validation processes.In the calibration process,75% of the input dataset,taken at random,is used for training the output,and then the remaining dataset is used for the testing or validation process.The same input variables are imported into each model.On the other hand,input variables include the concrete compressive strength,the concrete tensile strength,the longitudinal steel bar diameter,the transverse steel bar diameter,and the internal water pressure.
5.1 Data
As mentioned above,there are five variables in this study,which are summarized in Table 2.Due to the large number of variables and the associated large number of simulations,the Taguchi method was employed to reduce the number of the specimens.The Taguchi method is a statistical method for reducing the number of the samples.It is used for selecting the best level for each variable among all levels of all variables.Its main aim is to specify several mix designs for a study and to reduce the number of mix designs.After determining outputs of the selected mix designs,other mix designs,which were not simulated,can be predicted by the Taguchi method.As can be seen in Table 2,samples 1–36 were selected by the Taguchi method,specimens 37–42 and 43–48 were considered as the extra RCT models,which were simulated by CFRC and GFRC,respectively.
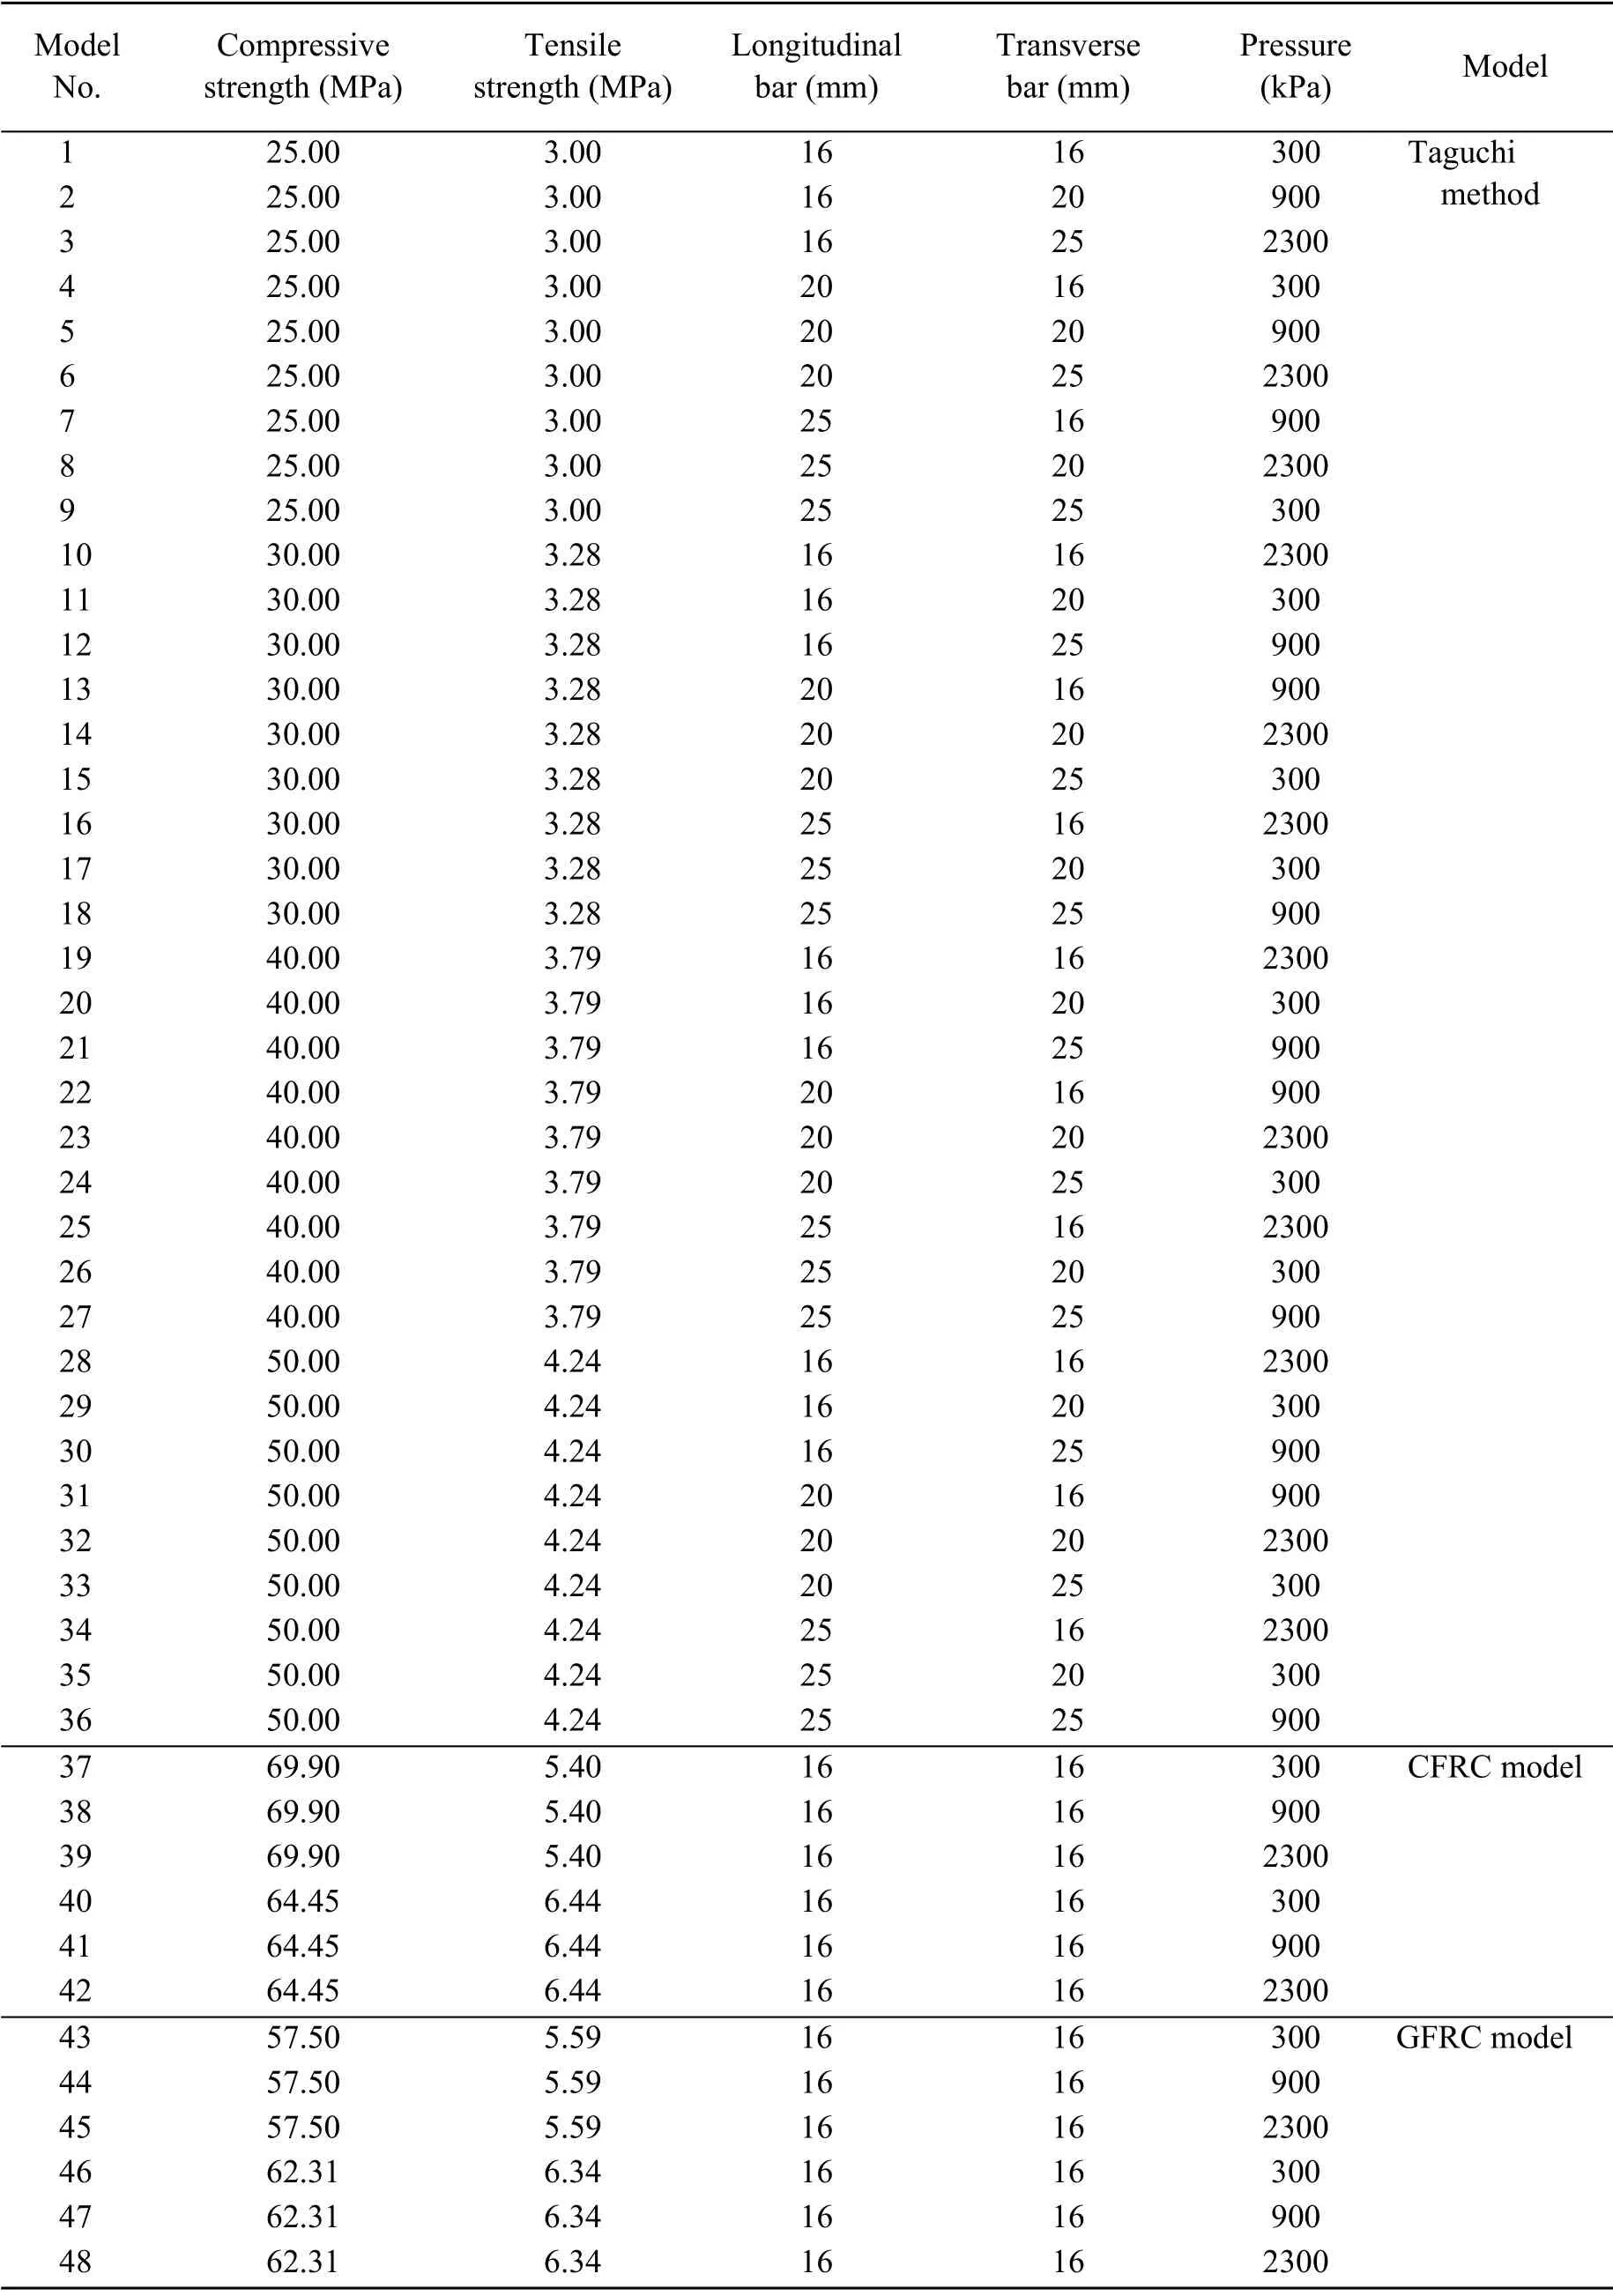
Table 2 Proposed samples and the values of their variables
Table 3 (p.646) shows the value of the correlation coefficient between each output and each input variable.According to the results in this table,the correlation coefficient between the applied pressure and all outputs is significant and greater than 0.80.The correlation coefficients of the transverse bar and the maximum ETPS and the maximum deflection of RCT are considerable.The correlation coefficients between the compressive and tensile strengths of concrete and the maximum ETPS and the PDS are more than 0.27,and their values for using in regression are considerable.
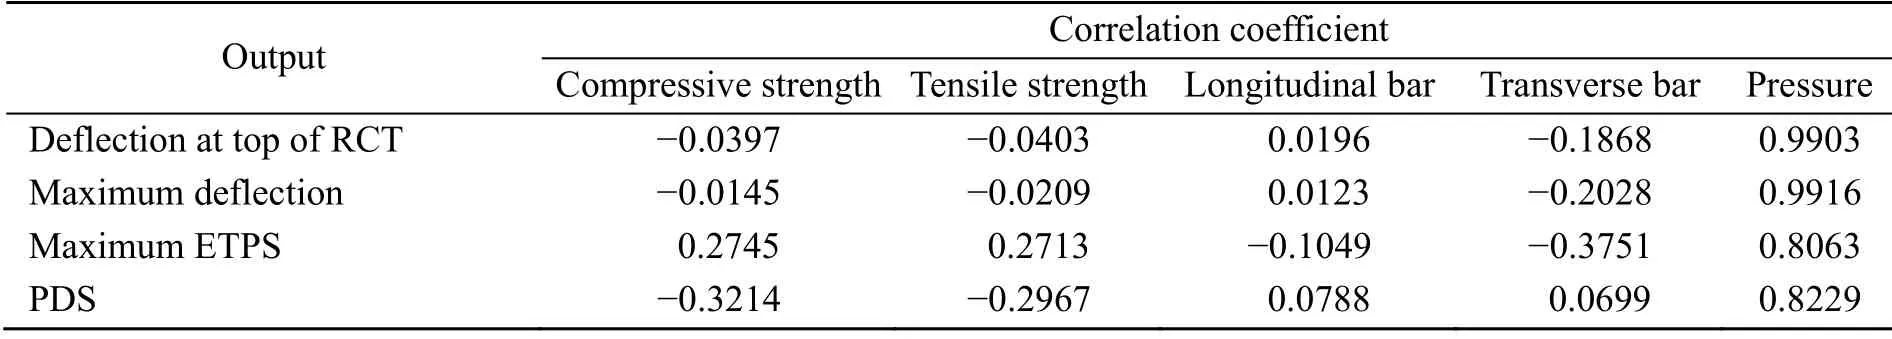
Table 3 Correlation coefficients between output and input variables
5.2 Method
In this study,PCR,MLnER,and GEP are selected as the surrogate models for predicting the PDS,the maximum ETPS,the maximum deflection,and the deflection at the top of the RCT.The dataset and results of 75% of samples are randomly used for the calibration process.The remaining dataset is used for predicting the outputs,as the validation process.The process of each model is explained as follows.
5.2.1 The first model:PCR
In this study,the first model is PCR,which is the hybrid model that includes a technique for deleting unnecessary input variables,for finding effective input variables,and for using the MLR technique.In other words,PCR is defined as the combination of MLR and principal component analysis (PCA).MLR includes one dependent variable,which is predicted by utilizing two or more regressors.The general form of MLR is defined as below:
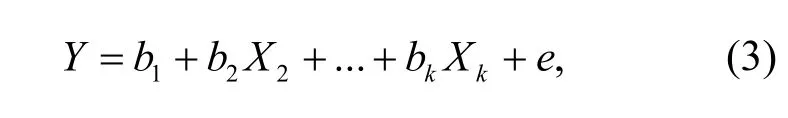
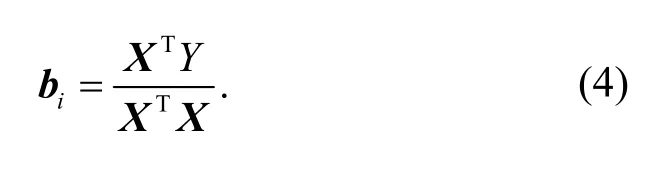
whereX2,X3,…,Xkare defined as independent variables,andb1,b2,…,bkare defined as linear regression parameters.eis obtained from constant variance and normal distribution of independent random sampling with mean zero,which is named the calculated error term.Yis defined as the dependent variable.The role of this technique is to determineb1,b2,…,bk,which can be achieved by employing the minimum square error technique (MSE);thus,b1,b2,...,bkare determined based on the following matrix:
The combination of PCA and MLR results in reducing the collinearity of the datasets that utilized the principal components with a high variance;thus,the most effective regressors are used for predicting the outputs by using PCR.In this approach,the correlation matrix of input variables is employed to calculate the principal components,and also,the eigenvalues of the correlation matrix are employed to calculate eigenvectors.The eigenvalues of the correlation matrixCare determined by
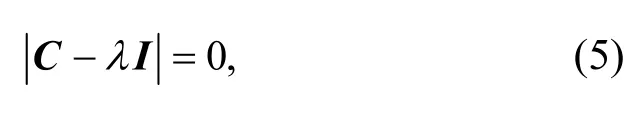
whereλis defined as the eigenvalue andIis defined as the identity matrix.The characteristic vectoreof the correlation matrixCcan be defined as
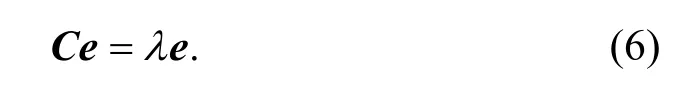
These eigenvalues demonstrate the mutually orthogonal linear composition of the matrix.Their related eigenvalue shows the value of total variance that is demonstrated by each eigenvector.In the first few pairs of eigenvalue-eigenvector,PCs (principal component),a considerable value of aggregate variance is shown.The variance is demonstrated by theith PC that can be calculated by
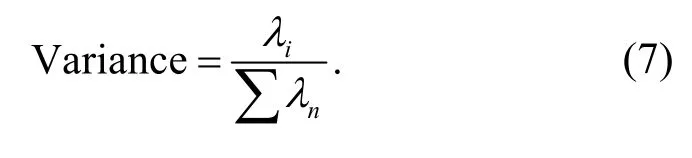
The PC relevant to the best eigenvalue is the first principal component (PC1),which presents the linear composition of the variables for calculating the maximum general variability in the input data.The maximum variability is demonstrated by the second principal component (PC2).It is clear that PC2is not obtained by the first principal component (PC1),and so on.
Moreover,after obtaining PCs,multiplying the eigenvector to the primary dataset transforms the primary dataset into the orthogonal dataset.The converted dataset is imported as input variables to the MLR technique.Therefore,the equation of PCR is formulated as
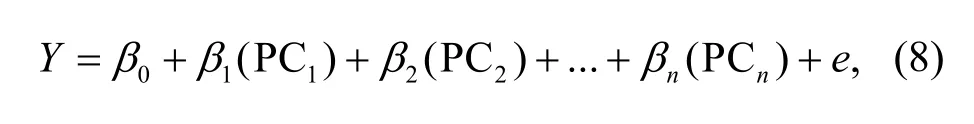
whereβ0,β1,…,βnare defined as the coefficients in Eq.(3),and are determined by employing the least square technique.Moreover,theF-test is employed to specify the relevance that exists between the regressors and the dependent variable.A furthert-test is employed to calculate the potential amount of each regressor in this model.The results of this model are employed for predicting the PDS,the maximum ETPS,the maximum deflection,and the deflection at the top of the RCT.
5.2.2 The second model:MLnER
The MLnER technique is selected as a prediction method in this study,which is developed from the MLR technique.In the MLnER method,there are several Ln equations instead of several linear equations.On the other hand,the MLnER involves several Ln equations,which are integrated for predicting the PDS,the maximum ETPS,the maximum deflection of the RCT,and the deflection at the top of the RCT.The MLnER approach involves one dependent variable and several independent variables,the coefficients for each independent variable,a constant coefficient,and an error term.The general form of this technique is shown as
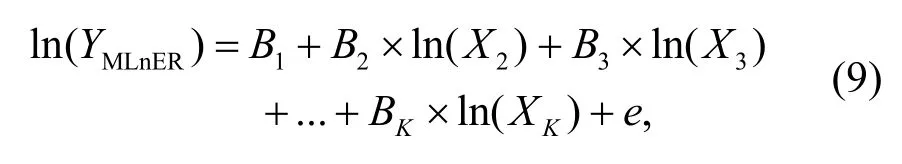
whereB1,B2,…,BKare defined as linear regression parameters,which are the coefficients of each Ln equation,respectively.The role of the regression technique is to determineB1,B2,…,BK,the estimated error term,and the constant coefficient that are calculated using MSE.It is clear thatB1+eis equal to ln(C);thus,Eq.(9) is rewritten as below:
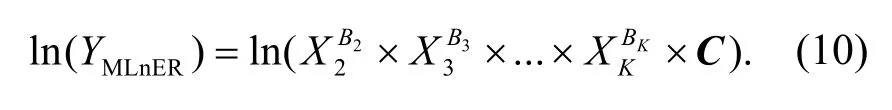
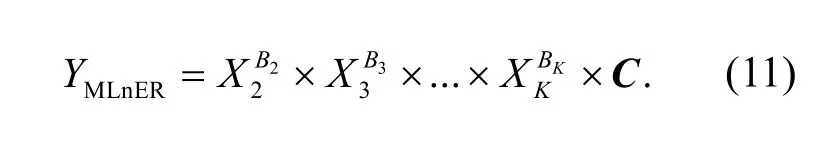
It is clear that Eq.(11) is the simple form of Eq.(10),and they are the same.According to the form of Eq.(11),it can be said that the MLnER method is a nonlinear model.
5.2.3 The third model:gene expression program
For the first time,Ferreira (2002) presented a strong method for simulating and predicting the phenomena,which is named the GEP.This approach is developed by using the combination of a genetic algorithm (GA) and genetic programming (GP).This approach utilizes a set of different functions and terminals.A set of different functions involves userdefined and trigonometric functions,the main mathematic functions,and combination functions that are employed to simulate and predict the PDS,the maximum ETPS,and deflection of the RCT,and the deflection at the top of the RCT.A set of terminals involves a combination of input variables of the problem and constant values.In the GEP approach,GA employs the population of data and selects from them to find a function for predicting the PDS,the maximum ETPS,the maximum deflection of the RCT,and the deflection at the crown of the RCT.In this method,several operators (genes) are employed to perform genetic variations,and the Roulette wheel is used to select data.Data is reproduced simultaneously by employing several genetic operators.As a result,it is clear that the inappropriate data is deleted,and appropriate data is transferred and stored from the present generation to the next generation in duplication operations.The main target of the mutation operator is the internal random optimization of the given chromosomes.All steps of the GEP are demonstrated in the following flow chart (Fig.11).
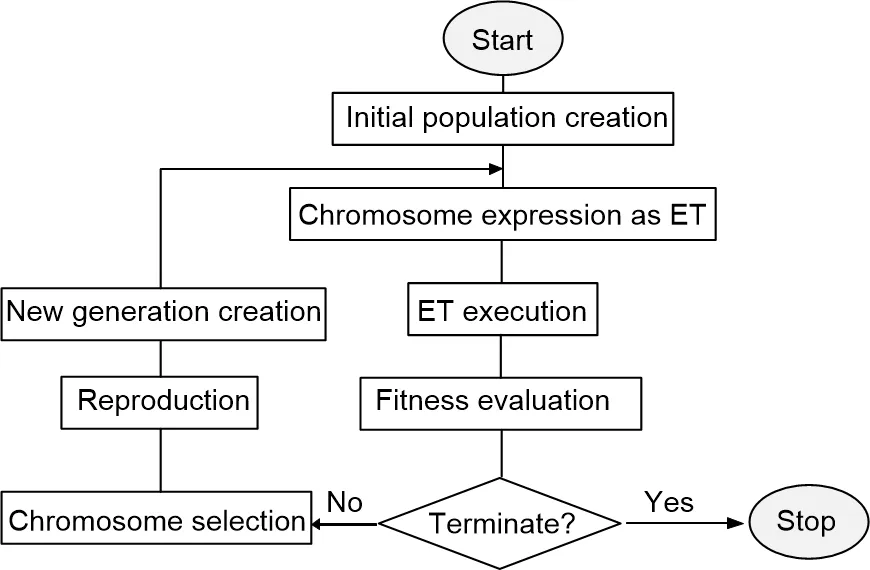
Fig.11 Flow chart of gene expression programing
5.3 Prediction result
The input variables of the present study are presented as
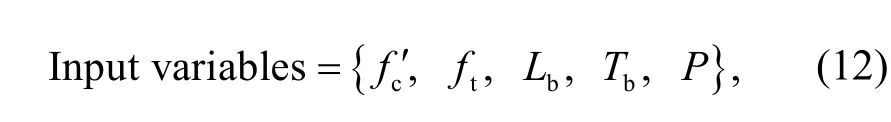
wheref'c,ft,Lb,Tb,andPdenote the concrete compressive strength (MPa),the concrete tensile strength(MPa),the longitudinal steel bar diameter (mm),the transverse steel bar diameter (mm),and the internal water pressure (MPa),respectively.The four outputs of this study are presented as
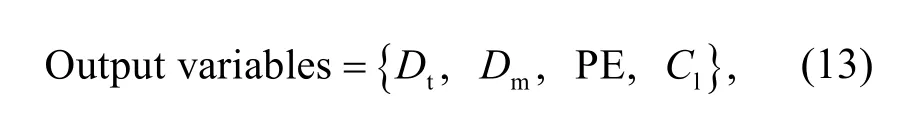
whereDt,Dm,PE,andClare defined as the deflection at the crown of the RCT,the maximum deflection of the RCT,the maximum ETPS of the RCT,and the PDS,respectively.In Section 4,48 samples are simulated by a general-purpose FE software,ABAQUS.Each sample was analyzed in 40 min averagely by utilizing a computer having the configuration:Core(TM)i7-2670QM CPU@2.20 GHz,RAM 8 GB,whereas the prediction models estimate the abovementioned outputs in only a few seconds.In this study,75% of input variables are selected randomly for training the output (their FE results),as the calibration process.According to the calibration process,a formula for each output is obtained from each model.The obtained formulas are used to predict the outputs.On the other hand,the remaining input variables are imported to the obtained formulas to predict the outputs.The predicted outputs and the results of FE models in the remaining dataset are used to evaluate the validity and accuracy of each model.
Eqs.(14)–(16) are obtained from the calibration process to predict the deflection at the crown (top) of the RCT by employing PCR,MLnER,and GEP methods,respectively.
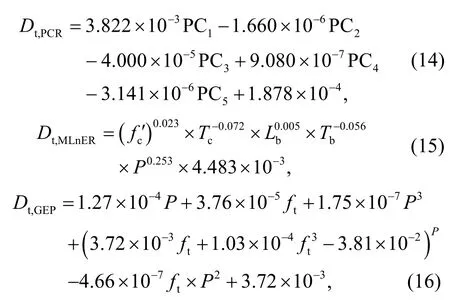
whereDt,PCR,Dt,MLnER,andDt,GEPdenote the displacement at the top of the RCT,which are obtained from PCR,MLnER,and GEP methods,respectively,with the unit of m.The maximum displacement of the RCT can be calculated by Eqs.(17)–(19),which are obtained in the calibration process,and then their results are tested in the validation process.
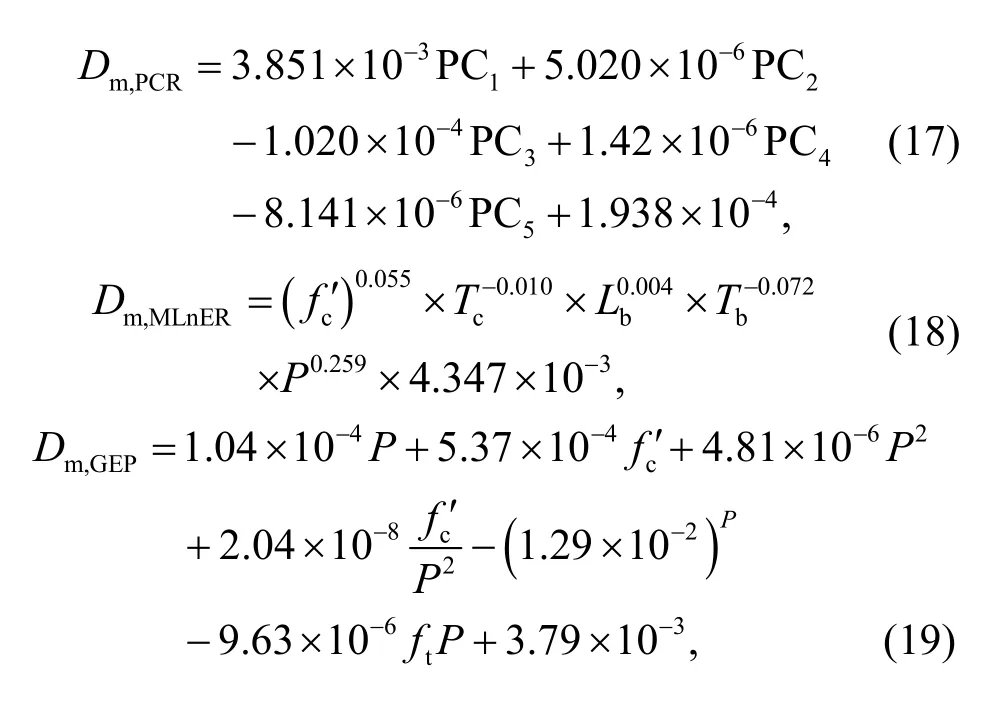
whereDm,PCR,Dm,MLnER,andDm,GEPdenote the maximum displacements of the RCT,which are obtained from PCR,MLnER,and GEP methods,respectively,with the unit of m.The maximum ETPS of the RCT can be calculated by Eqs.(20)–(22) that are obtained in the calibration process,and then their results are tested in the validation process.
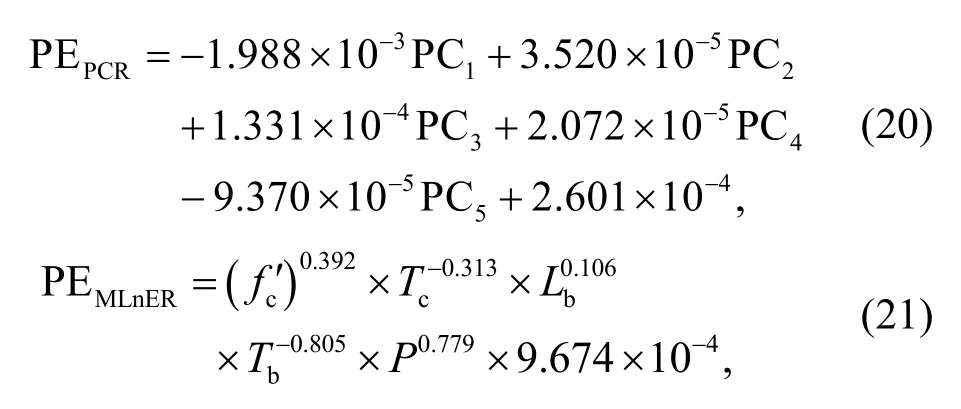
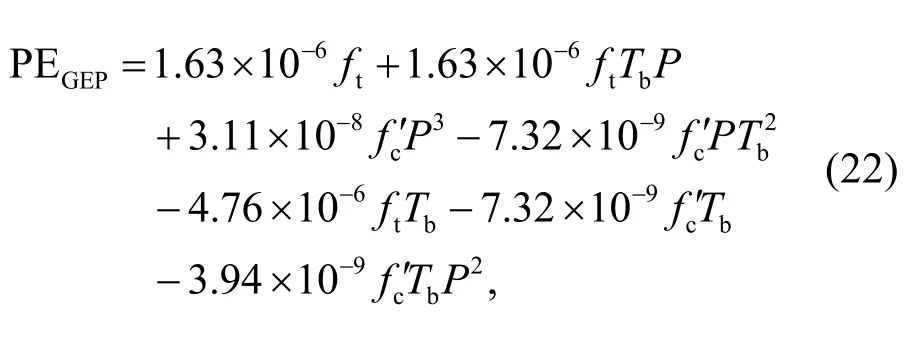
where PEPCR,PEMLnER,and PEGEPdenote the maximum ETPS of the RCT which are obtained from PCR,MLnER,and GEP methods,respectively.It is clear that PE is defined as a strain parameter without a unit.Finally,the PDS of the RCT can be calculated by Eqs.(23)–(25).
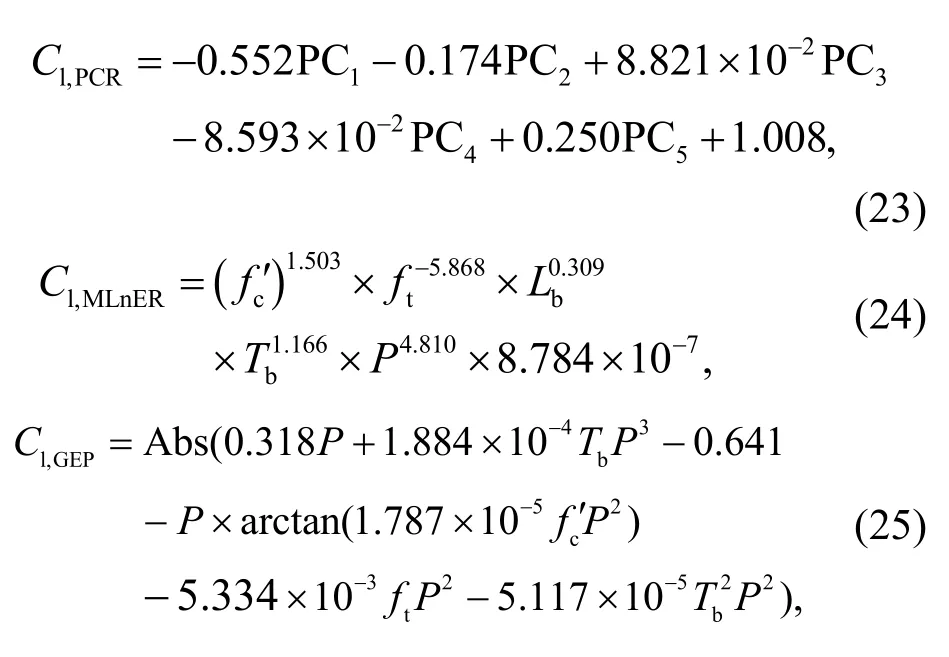
whereC1,PCR,C1,MLnER,andC1,GEPdenote the area of the damaged zones on the RCT as a percentage obtained by PCR,MLnER,and GEP methods,respectively.Three statistical parameters,including RMSE,NMSE,and a coefficient of determination are employed to compare the accuracy of all models in predicting the PDS,the maximum ETPS,the maximum deflection of RCT,and the deflection at the top of RCT.Table 4 shows the values of these statistical parameters for each numerical model and each output.
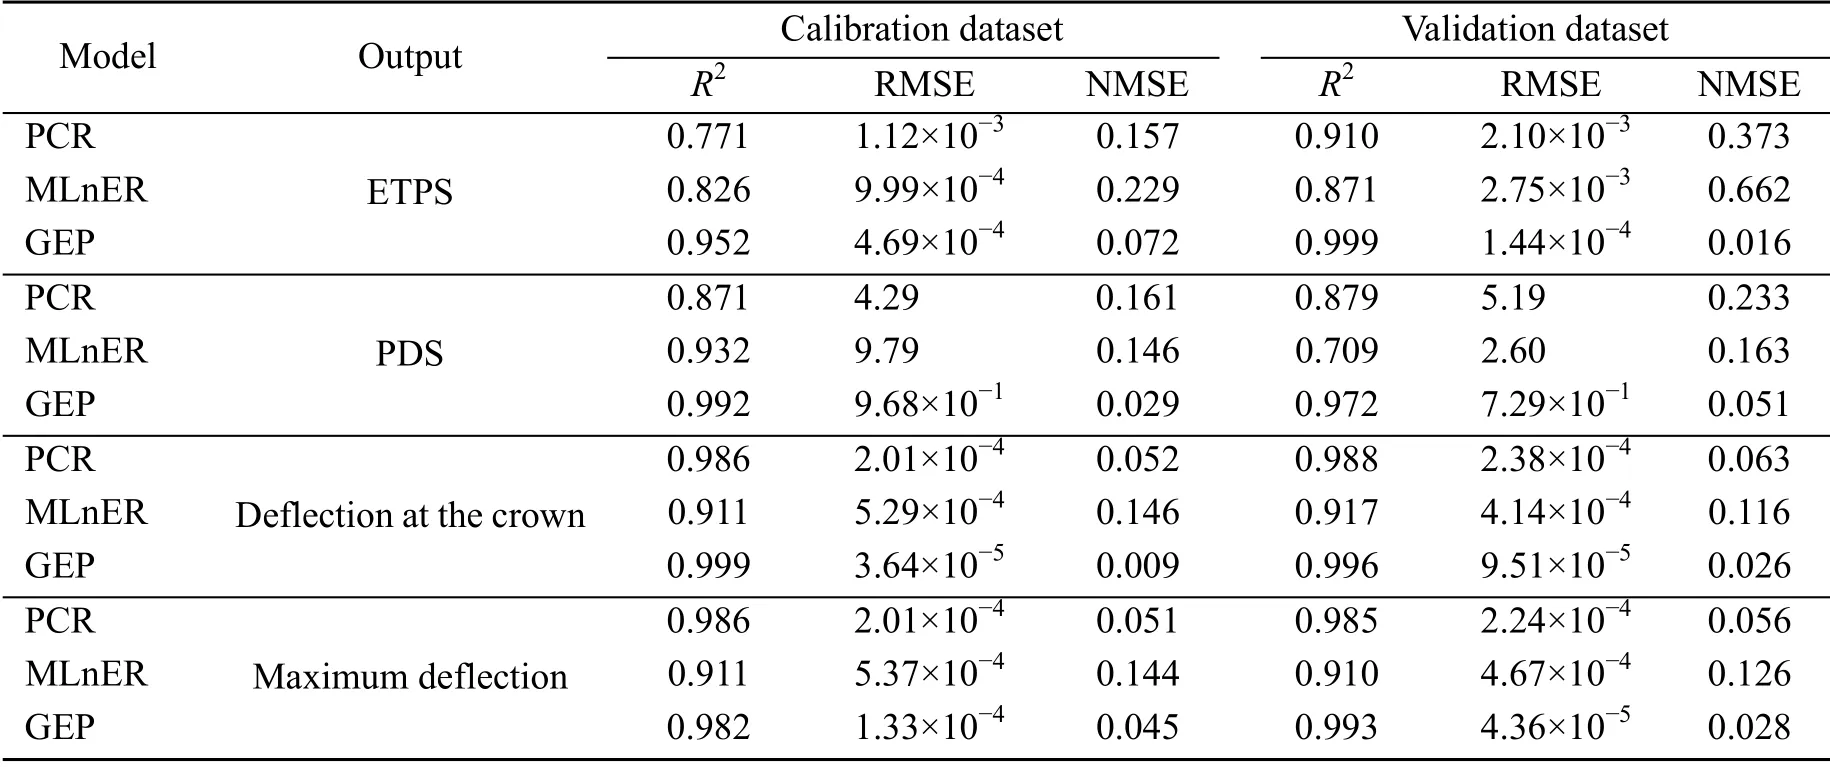
Table 4 Results of statistical parameters in predicting all outputs
According to the results of Table 4,with respect to the values of RMSE,the PCR model performs better than the MLnER model in both training and testing datasets.Furthermore,based on the obtained values of NMSE,the PCR model performs better than the MLnER in calibration and validation datasets.The results of all models are acceptable with respect to the values of the coefficient of determination.Moreover,GEP is more accurate than PCR and MLnER with respect to the values of the coefficient of determination in predicting all outputs.
In both the training and testing processes,the GEP performs better than the PCR with respect to the values of the coefficient of determination.Moreover,in all the datasets,the RMSE and NMSE of the PCR are more than those of the GEP model.Based on all the statistical parameters,the GEP model performs better than PCR and MLnER models.As a result,the GEP has a greater capability to predict the performance of the RCT.In other words,the results of GEP are closer to nonlinear FE results.
Comparing the error terms is another way to evaluate the accuracy of the obtained formulas.In this study,error terms,including the maximum positive error,the maximum negative error,and MAPE are calculated for each prediction model separately,as shown in Table 5.
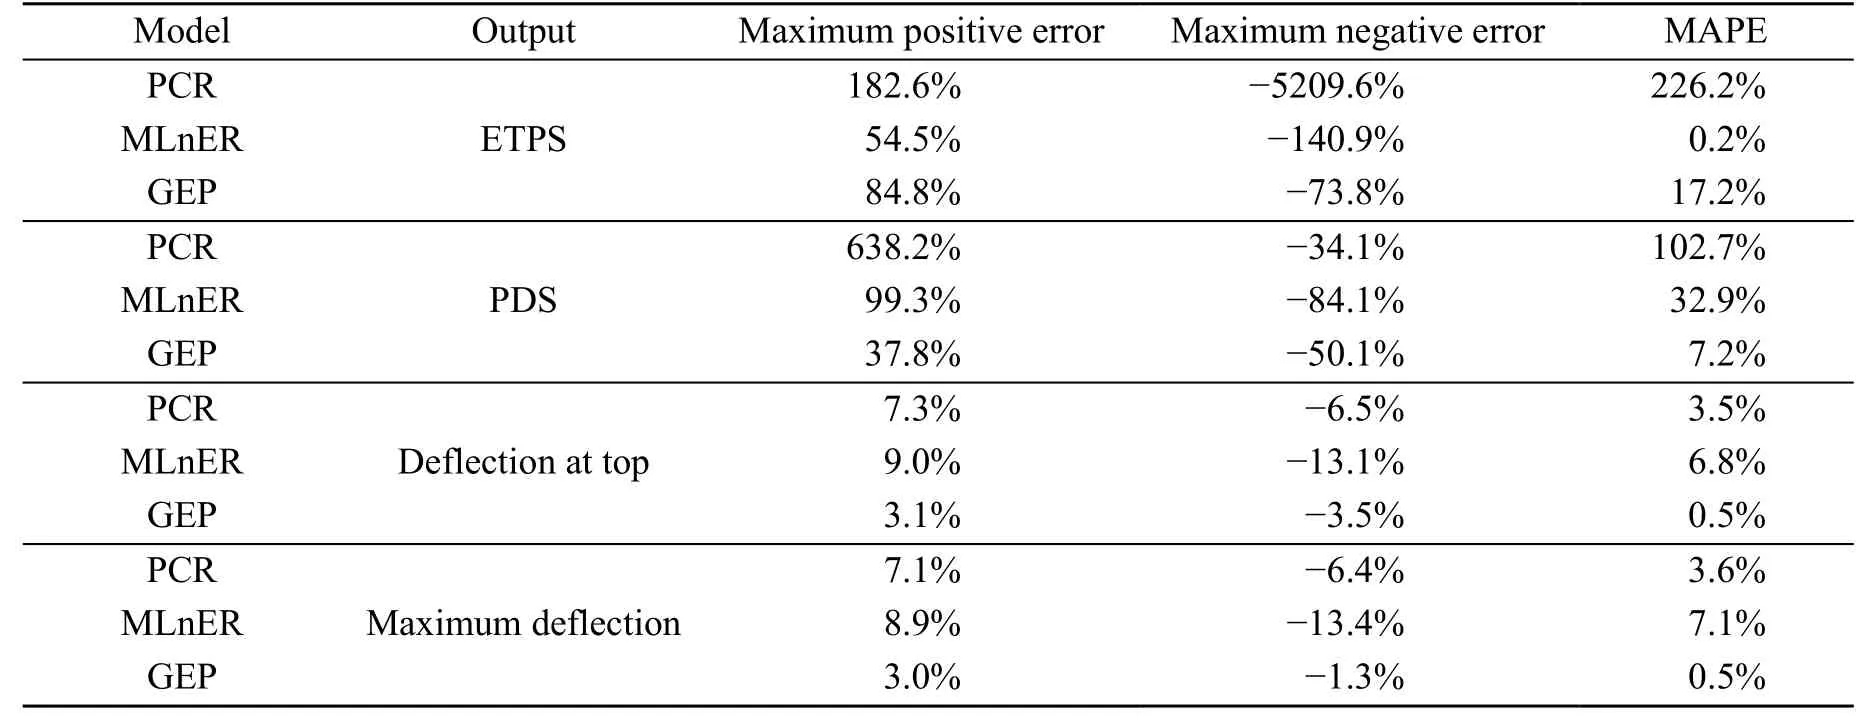
Table 5 Results of error terms in predicting all outputs
According to the results,the MLnER model has the lowest maximum positive error in predicting the maximum ETPS,whereas for predicting the PDS,the maximum deflection,and the deflection at crown of the RCT,the GEP is better than other models with respect to the maximum positive error.With respect to the maximum negative errors,the GEP model performs better than other models in predicting all outputs of the RCT.In predicting the maximum ETPS of the RCT,MAPE of PCR,MLnER and GEP models are obtained as 226.2%,0.2%,and 17.2%,respectively,which indicate that MLnER is the best in predicting the maximum ETPS.Moreover,in predicting other outputs,the GEP model performs better than the PCR and MLnER based on the MAPE.As a result,according to the results of both statistical parametersand error terms,the GEP model can be considered as the best model for predicting the performance of the RCT in this study.The error distribution of the GEP model is illustrated in Fig.12 for justifying the obtained error of the best prediction model.
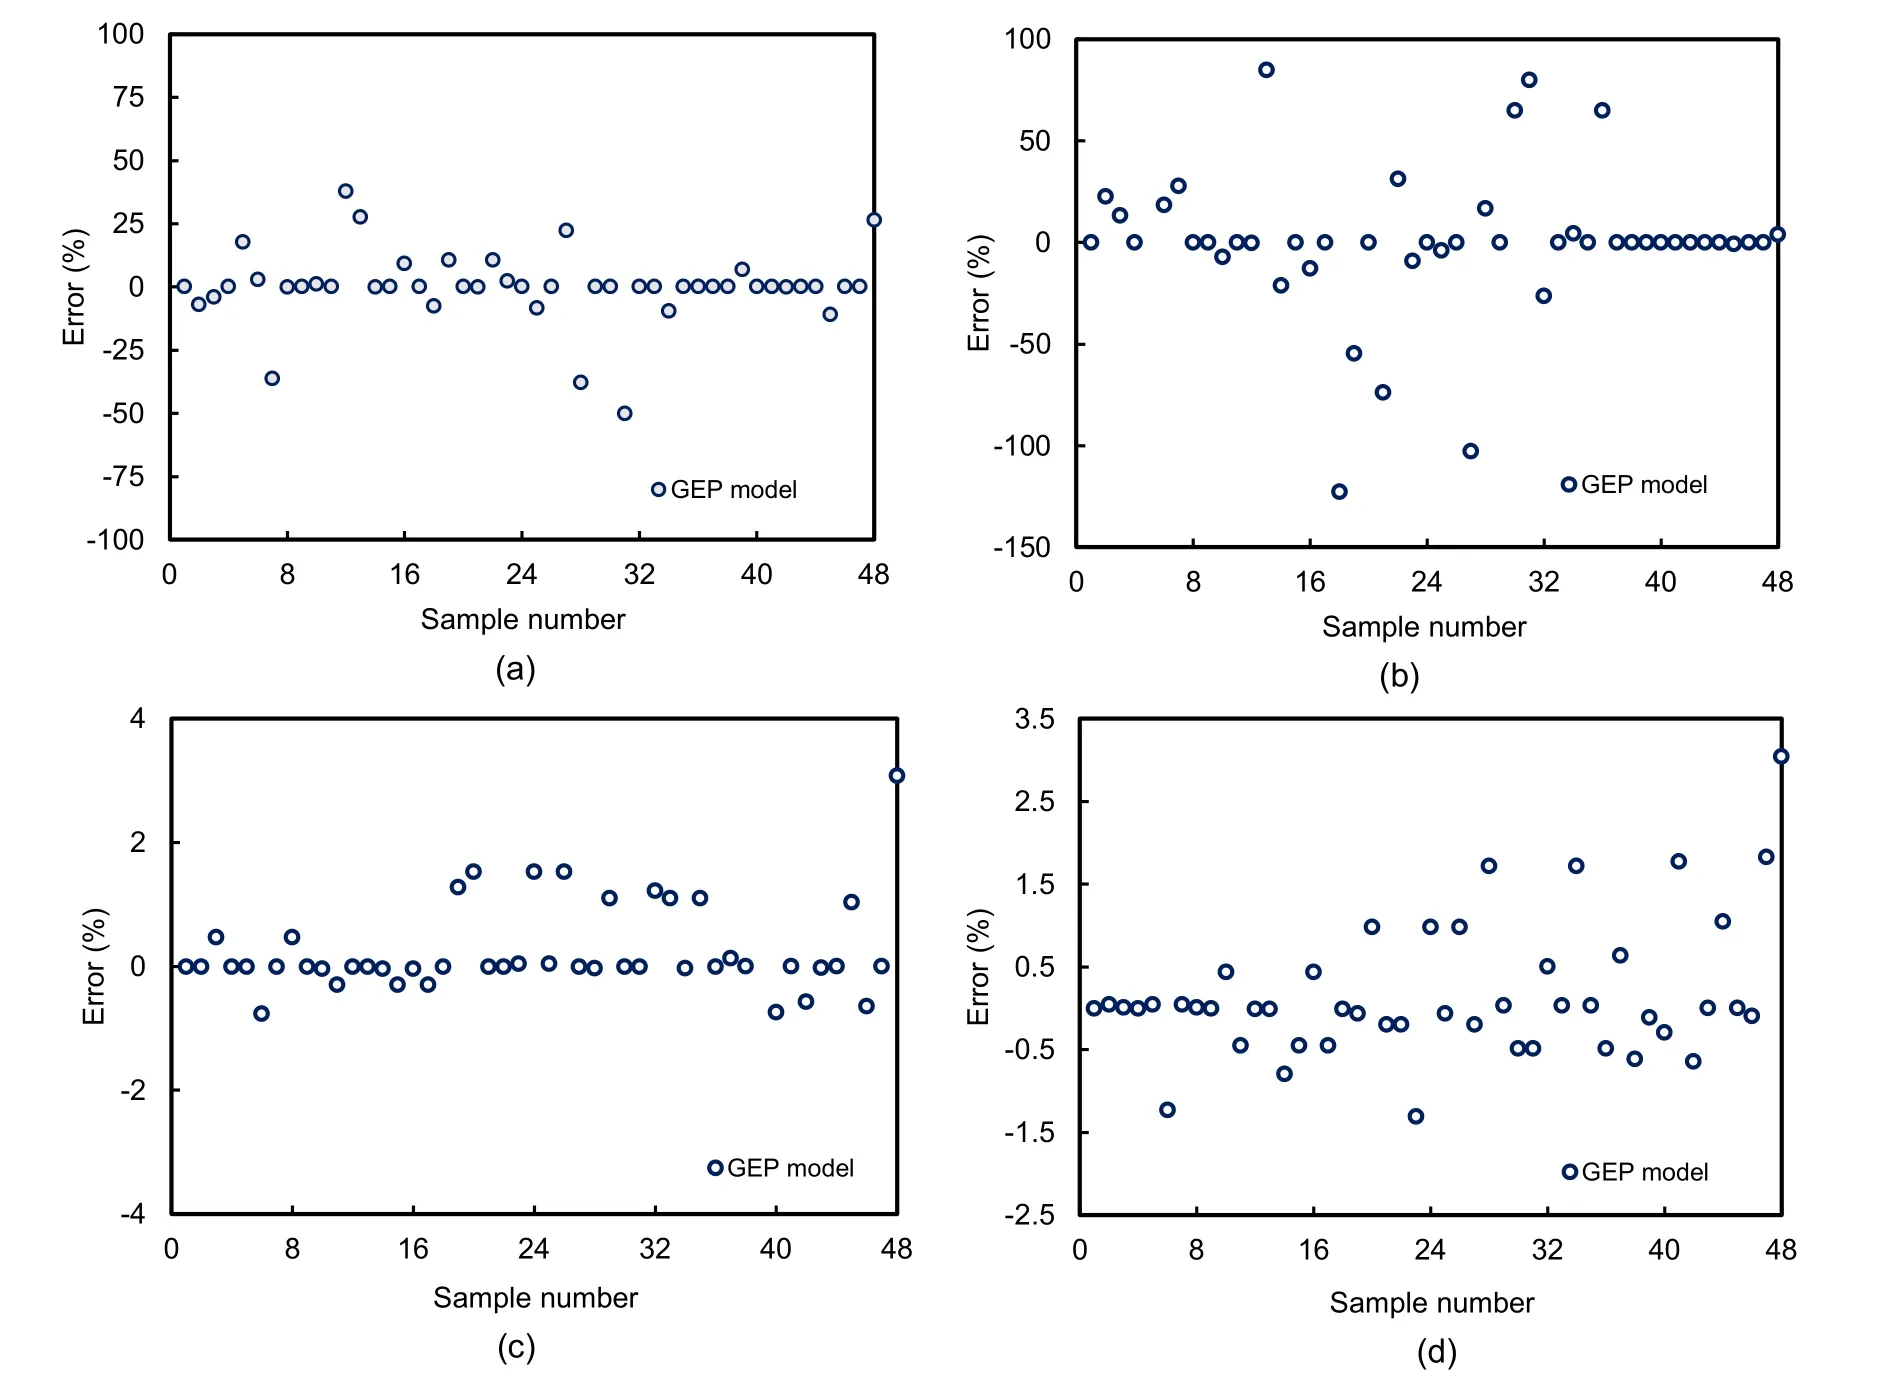
Fig.12 Error distributions of the obtained outputs from GEP
Based on Figs.12a–12d,the absolute errors of 33 predicted values of the PDS,32 predicted values of the maximum ETPS,37 results of the deflections at top of the RCT,and 34 predicted values of the maximum deflection are close to zero.The accuracy of the predicted values of the PDS by GEP is less than 50%.The absolute errors of nine predicted values of the maximum ETPS are more than 50%,whereas the absolute errors of all the deflections,which are predicted by GEP model,are less than 4%.In order to evaluate the results that are predicted with high errors and find a reason for them,the results obtained from the GEP model and nonlinear FE models are compared in Figs.13a–13d.
According to Figs.12a and 13a,if the PDS of the sample is obtained less than 10% from FE nonlinear analysis,the error of the predicted value is more than 25%.In predicting the maximum ETPS,if the obtained error from the GEP is more than 50%,its maximum ETPS is less than 10−5.On the other hand,only a very small difference between the predicted maximum ETPS by GEP and the obtained maximum ETPS from FE nonlinear analysis causes a considerable error.Based on the above-mentioned results,a safety factor should be applied to the GEP model in order to improve the reliability of this model.Considering the maximum positive and negative errors of GEP results,the safety factors are selected as 1.74%and 1.50% for predicting the maximum ETPS and PDS,respectively.where PESFandC1,SFare defined as the modified maximum ETPS and the PDS,respectively.Furthermore,SFPEanddenote the safety factors,which are related to the maximum ETPS and the area of the damaged zones,respectively.
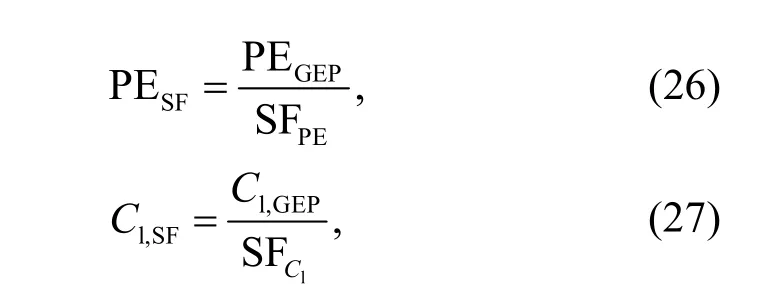
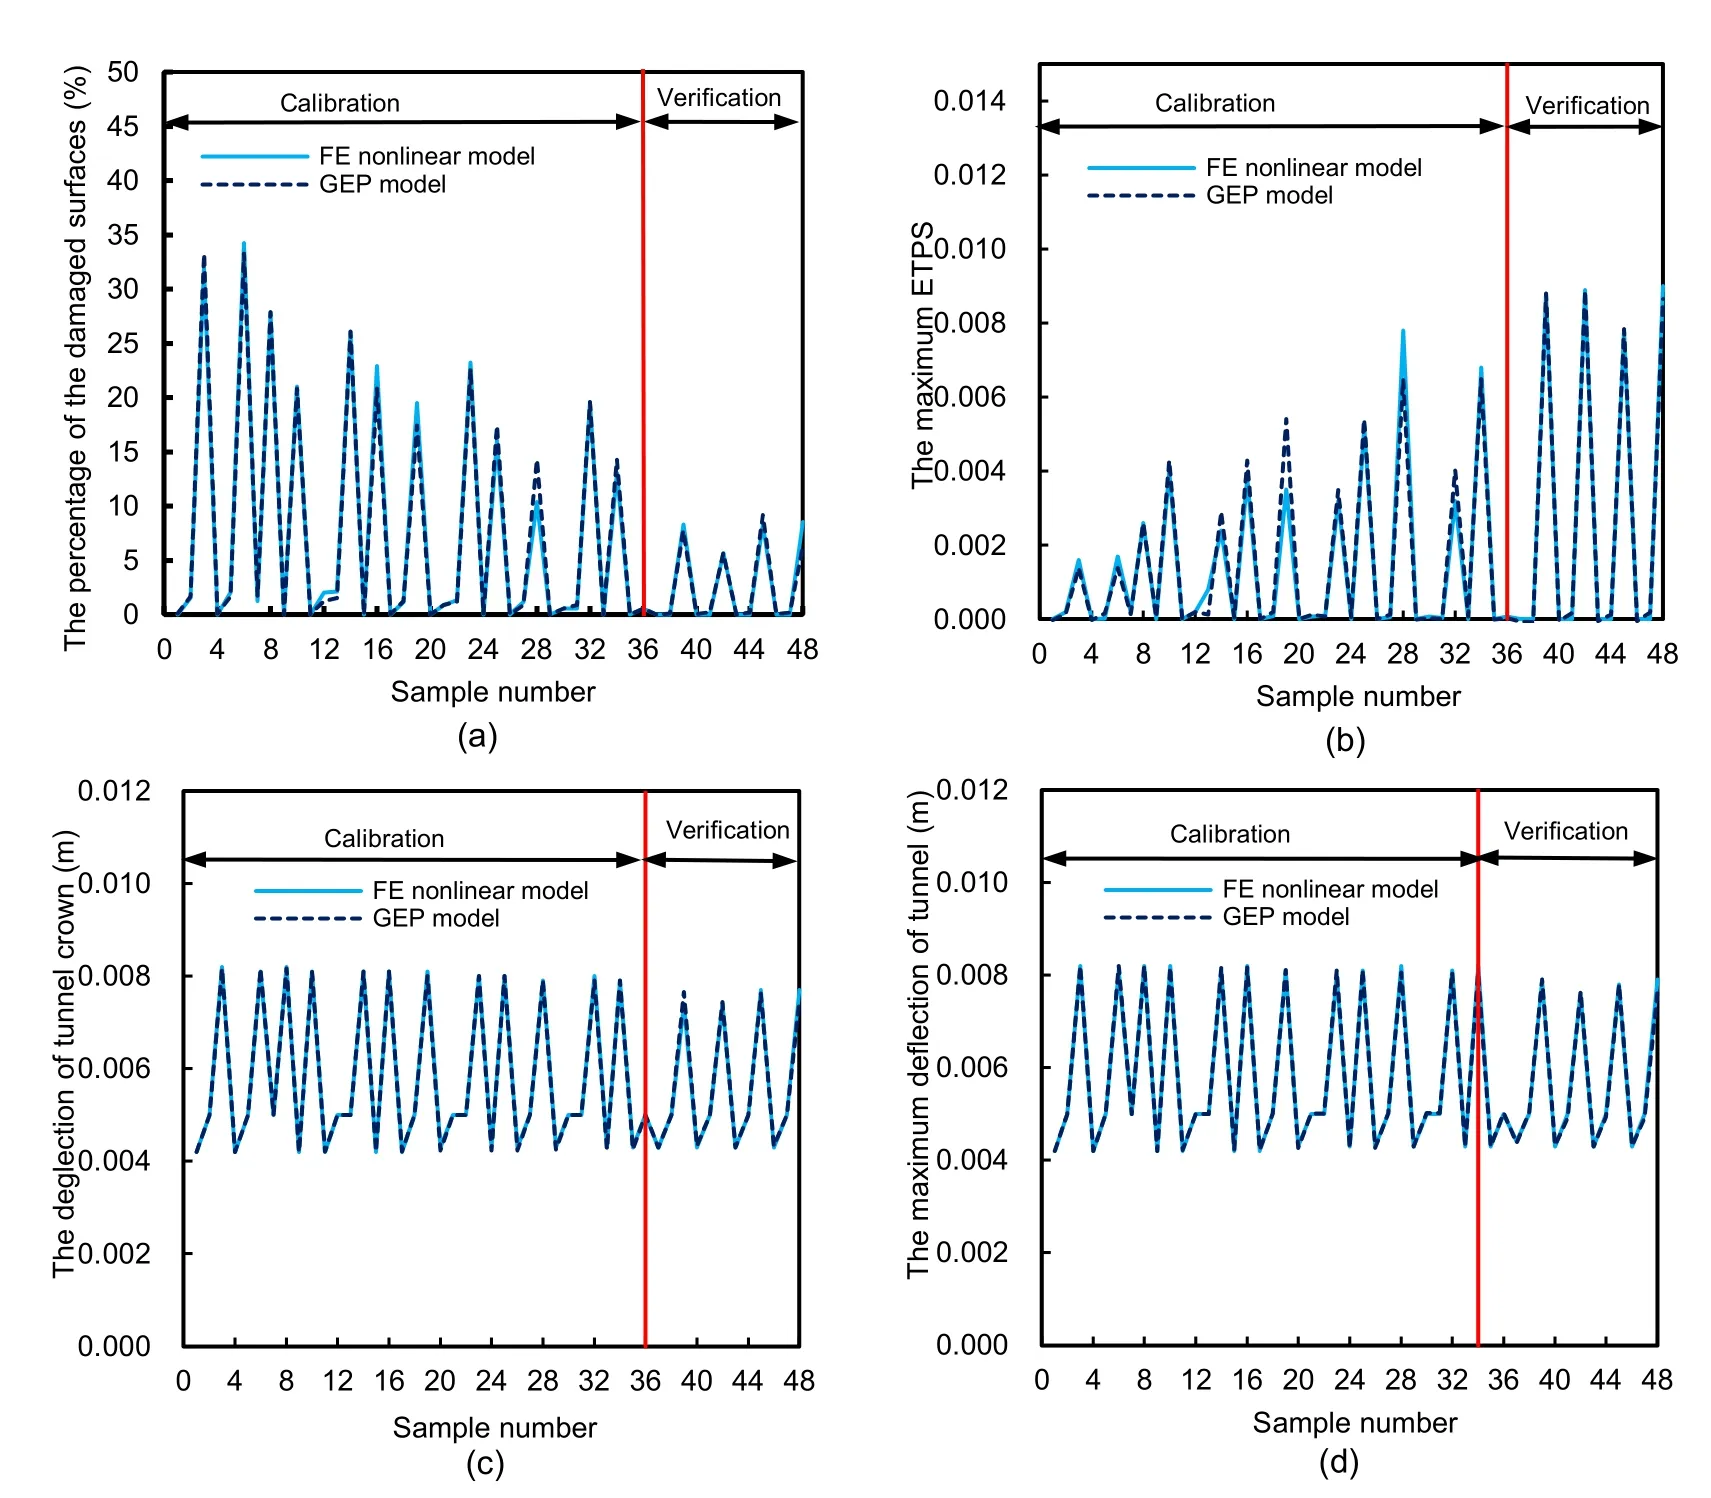
Fig.13 Comparison of predicted values by GEP and the obtained outputs from FE nonlinear model
6 Discussion
Table 6 shows a comparison of the results of the present study and several previous studies.Pendharkar et al.(2007) used an ANN model to predict the inelastic moment ratio of composite beams to determine the crack effects on composite beams.They imported age of loading,stiffness ratio of adjacent spans,load ratio of the adjacent spans,grade of concrete,composite inertia ratio,inelastic moment ratio,cracking moment,inelastic moment,and elastic moment as input variables in the model.The maximum negative and positive errors reported in their study were −6.54% and 51.17%,respectively.Ababneh et al.(2020) utilized ANN to predict the shear capacity of the beam without transverse bars,and compared their experimental results with the values predicted by ANN.They employed compressive strength,shear span-depth ratio,replacement ratio,longitudinal reinforcement ratio,effective beam depth,and beam width as input parameters in their model.They applied the coefficient of variation(COV) to compare the accuracy of the model with the models from the previous studies.The COV of their model was 8.07%.Several studies developed ANN and deep learning (DL) methods to predict imagebased crack detection.Dorafshan et al.(2018) utilized deep convolutional neural networks (DCNN) to predict cracks in concrete panels.The input data of their study were the images of samples.The maximum error in their study was 11%.Elshafey et al.(2013)used two types of ANNs,including a radial basis function neural network (RBFNN) and a feedforward backpropagation neural network (FFBPNN),to predict crack spacing in concrete.They showed that steel bar diameter,steel bar spacing,and concrete cover have a significant effect on the crack spacing.In contrast,the crack spacing does not depend on the element thickness and compressive strength.The coefficient of determination was calculated to compare the models.The results showed that FBBPNN with a coefficient of determination of 0.99 was selected as the best model to predict the crack spacing.Most and Bucher (2007) compared the results of six ANNs and FEM in predicting the crack on the RC beam under static loads.They used the independent Gaussian random variables of the decomposed random field as inputs in their models.The results showed that the best ANN in their study had an error with a value of 1.88%.Rasul et al.(2020) used feed-forward multilayer perceptron neural network(FFMPNN) to predict the maximum crack width of thermal cracking.They divided their dataset based on cold,moderate,and hot weather,and used eight parameters,including thickness,width,lift height,reinforcement ratio,cement content,lift interval,initial concrete temperature,and ambient temperature.Their results showed that their models have an accuracy between 83.78% and 96.3%.The main errors were 0.5%,0.5%,7.20%,and 17.2% for predicting the maximum deflection,the deflection at the crown,the maximum ETPS,and the PDS using the GEP method,respectively.Moreover,this method predicted the outputs with a coefficient of determination between 0.952–0.999.The results showed that the accuracy of GEP in predicting the damage and deflection of RCT is acceptable.
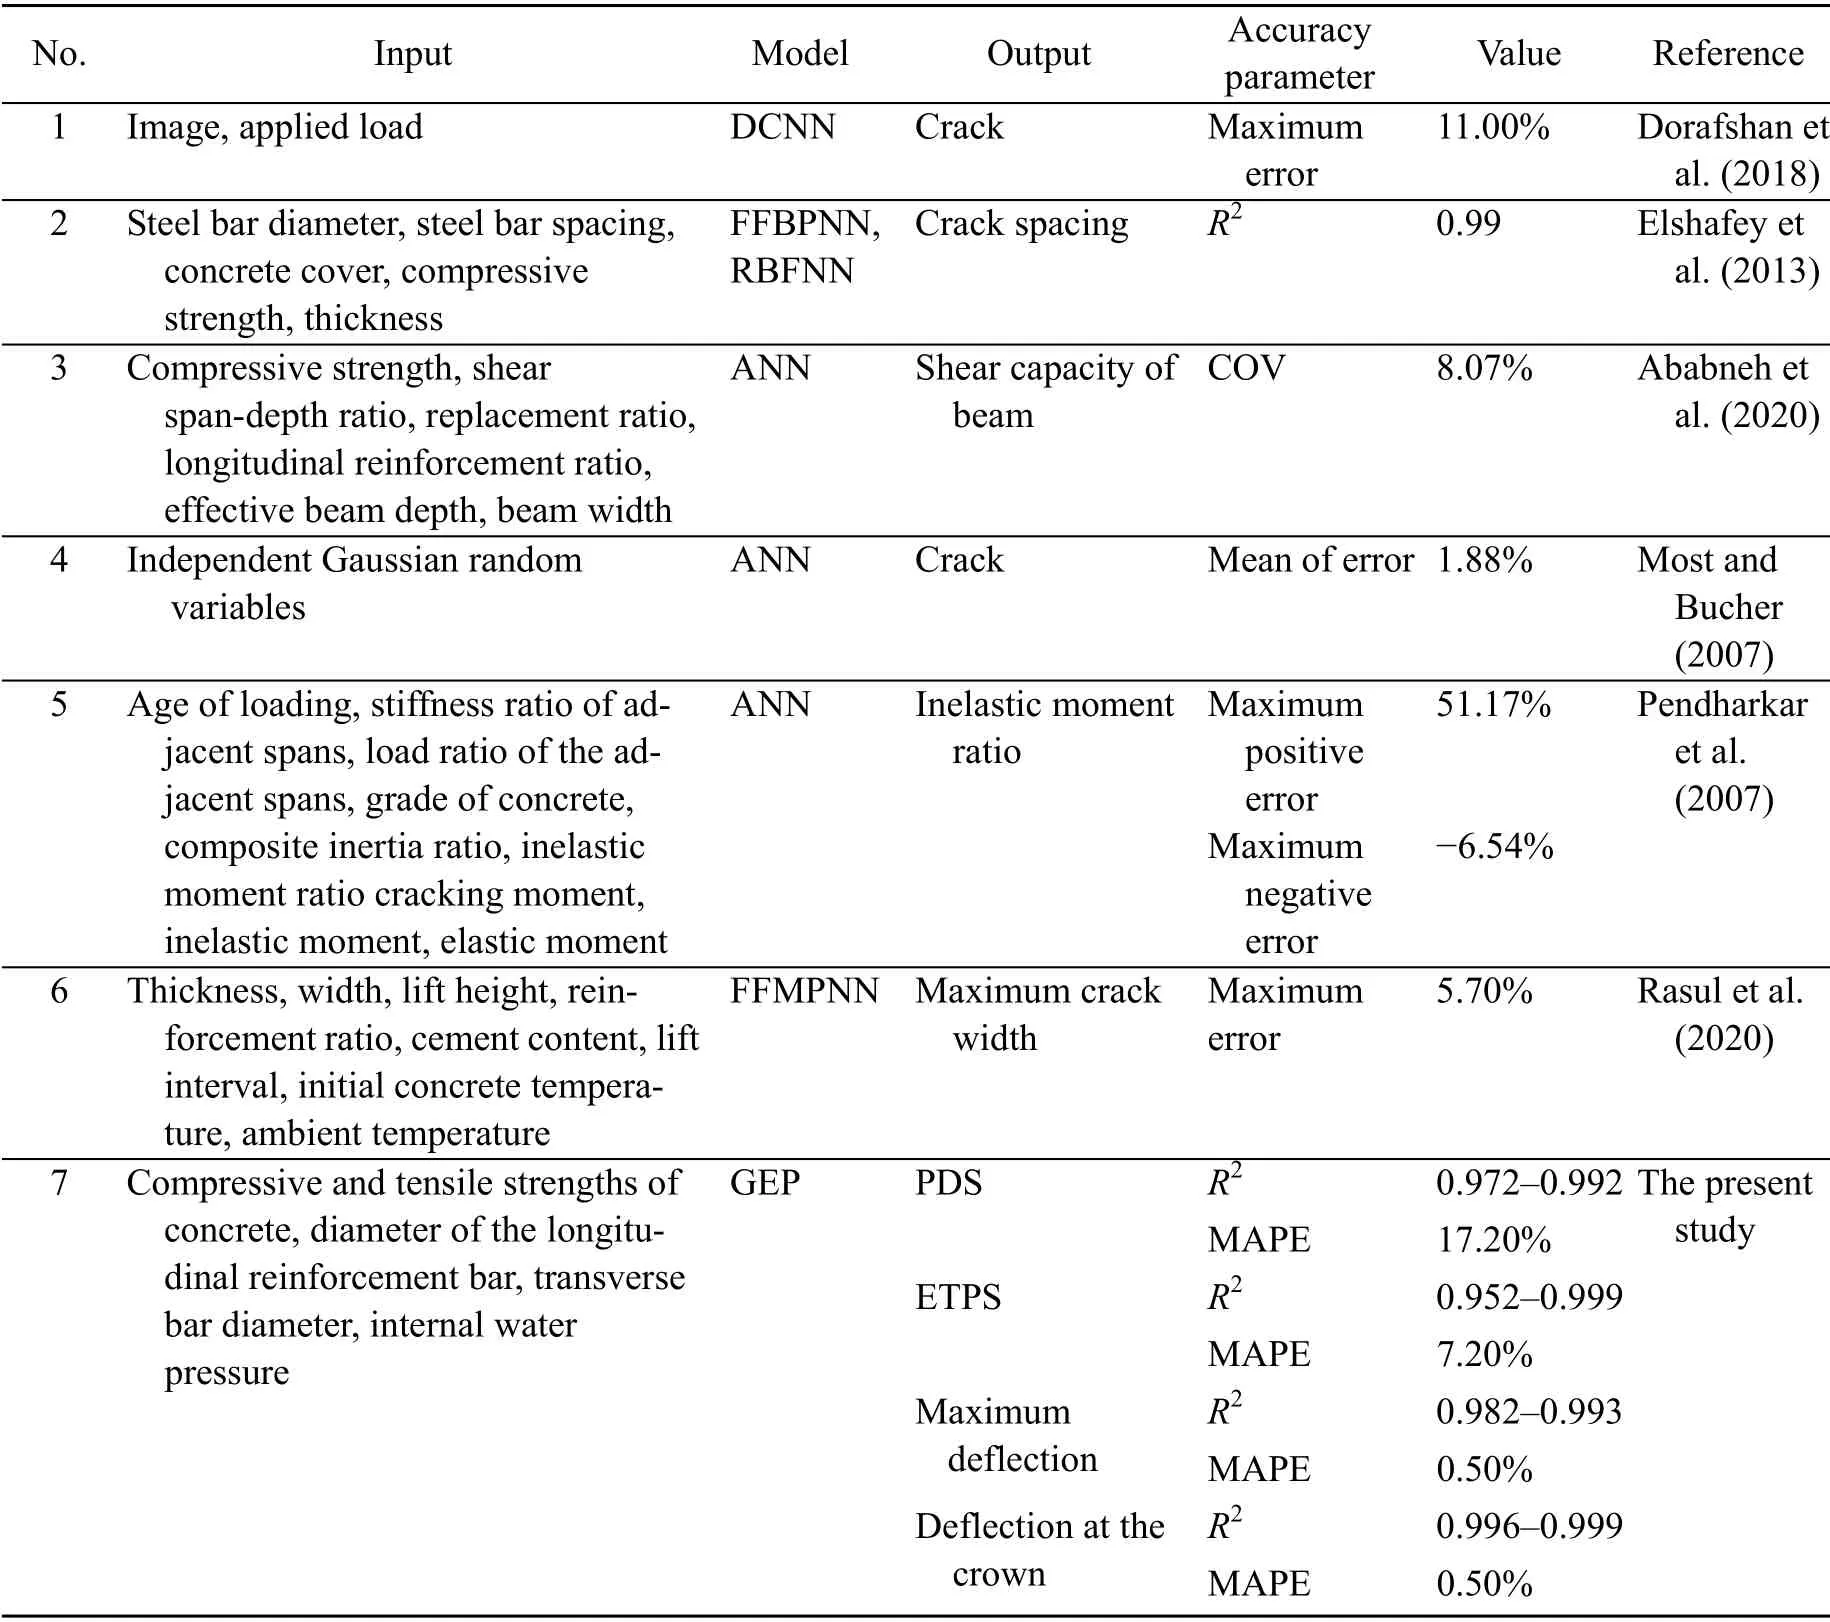
Table 6 Comparison between the results of several previous studies and the present study
7 Conclusions
In this study,a nonlinear FE analysis was used for predicting the performance of RCT under internal water pressure,and then 48 samples were simulated by an FE nonlinear model.There were five input variables in these 48 samples:the compressive and tensile strengths of concrete,the size of the longitudinal reinforcement bar,the transverse bar diameter,and the internal water pressure.The mix design of 36 samples was proposed by the Taguchi method,and then we proposed the mix design of 12 samples,in which GFRC and CFRC were taken as concrete.Three surrogate models,including PCR,MLnER,and GEP,were employed to predict the damage,the maximum ETPS,the maximum deflection of the RCT,and the deflection at the top of the RCT.In this study,75% of the dataset was used randomly for training the outputs,and based on this process,a formula for predicting each output was obtained.The outputs of the remaining samples were predicted by using these formulas.The statistical parameters and error terms were used to evaluate the accuracy of each model in predicting each output.In the following,the results of this study are briefly presented:
1.The internal water pressure has the most effect on the values of the PDS,the maximum ETPS,the maximum deflection of the RCT,and the deflection at the top of the RCT.
2.The compressive and tensile strengths have significant effects on the values of the PDS,the maximum ETPS,the maximum deflection of the RCT,and the deflection at the top of the RCT.
3.GEP predicts the damage,the maximum ETPS,the maximum deflection of the RCT,and the deflection at the top of the RCT with high accuracy.
A safety factor should be applied to the equations of the GEP model to increase the reliability,especially when the PDS and the maximum ETPS are predicted by these formulas.
Contributors
Aydin SHISHEGARAN designed the research,carried out the study,and wrote the first draft of the manuscript.Mohammad Ali NAGHSH wrote the first draft of the manuscript and revised and edited the final version.Alireza BIGDELI simulated the finite element models.Behnam KARAMI,Arshia SHISHEGARAN,and Gholamreza ALIZADEH helped to organize the manuscript.Aydin SHISHEGARAN revised and edited the final version.
Conflict of interest
Alireza BIGDELI,Aydin SHISHEGARAN,Mohammad Ali NAGHSH,Behnam KARAMI,Arshia SHISHEGARAN,and Gholamreza ALIZADEH declare that they have no conflict of interest.
 Journal of Zhejiang University-Science A(Applied Physics & Engineering)2021年8期
- Journal of Zhejiang University-Science A(Applied Physics & Engineering)的其它文章
- Micro-mechanical damage diagnosis methodologies based on machine learning and deep learning models
- A deep neural network-based algorithm for solving structural optimization#∗
- Physics-informed neural networks for estimating stress transfer mechanics in single lap joints#∗
- Deep learning-based signal processing for evaluating energy dispersal in bridge structures#