Improved performance of naringenin herbosomes over naringenin in streptozotocininduced diabetic rats: In vitro and in vivo evaluation
Ruthvika Joshi, Ankit P. Laddha, Yogesh A. Kulkarni, Sarika Wairkar
Shobhaben Pratapbhai Patel School of Pharmacy & Technology Management, SVKM's NMIMS, V.L.Mehta Road, Vile Parle (W), Mumbai.Maharashtra - 400056, India
ABSTRACT Objective:To prepare naringenin herbosome and evaluate its antidiabetic activity.
KEYWORDS:Naringenin; Herbosomes; Blood glucose level;Biochemical parameters; Antidiabetic activity
1. Introduction
Diabetes is a chronic metabolic disorder associated with an increased level of glucose in the blood. This is because of the defect in insulin secretion, insulin action, or both[1,2]. Naringenin, 5,7-dihydroxy-2-(4-hydroxyphenyl)-2,3-dihydrochromen-4-one, is an aglycone of naringin. It is a primary flavanone, frequently detected in orange, grapefruit, tangerine, and raw lemon peels[3,4]. Similar to other flavanones, oral administration of naringenin exhibits potent antioxidant, anti-inflammatory, and antidiabetic activity in addition to its ability to decrease cholesterol and lipid levels[5]. Besides, it has also been reported to reduce the expression of various cytokines like transforming growth factor-β, tumor necrosis factor-α, and IL-6, which are responsible for β-pancreatic cell damage[6]. Thus,naringenin has been of interest to the scientific community because of its variety of pharmacological properties along with its abundance in the diet.
Although naringenin possesses various pharmacological activities,it has very poor aqueous solubility and thus, dissolution is a ratelimiting step in oral absorption. Moreover, it was reported that naringenin possesses only 4% absolute bioavailability when administered orally in rabbit models and that of 5.8% when administered in 6 healthy volunteers[7]. It has a short half-life of 2.31 h and needs frequent dosing to maintain the steady plasma concentration to deliver a therapeutic effect. Therefore, these unfavorable pharmacokinetic characteristics limit the use of naringenin as one of the effective herbal medicine.
Naringenin has been formulated into various delivery systems like liposomes, nanoparticles, self-nano-emulsifying drug delivery systems, solid dispersions, microsponge, etc. to resolve solubility and bioavailability issues to a certain extent[8,9]. Although herbal medicines have been widely recognized and used since ancient times by physicians and patients, phytotherapeutics needs a scientific approach to develop their delivery systems for expected therapeutic outcomes. Herbosomes are recently introduced lipidbased formulations, especially for phytochemicals, which improve absorption and result in enhanced bioavailability comparing with conventional botanicals. Additionally, herbosomes provide better drug loading and prevent drug oozing during storage as compare to other lipid carriers[10,11].
Therefore, the study aimed to prepare and evaluate herbosomes to improve the solubility and bioavailability of naringenin, a waterinsoluble drug. The naringenin herbosomes were prepared using the solvent evaporation technique and evaluated for physicochemical properties, including the particle size, entrapment efficiency,transmission electron microscope (TEM), drug content, in vitro release profile, etc. The optimized formulation was studied in the rat model of diabetes for analysis of pharmacodynamic actions.
2. Materials and methods
2.1. Materials
Naringenin and streptozotocin were purchased from Sigma Aldrich,USA. The gift sample of phospholipid (LECIVA-S70) was received from VAV life sciences Pvt Ltd, India. Diagnostic kits for glucose,total protein (TP), aspartate aminotransferase (AST), alanine aminotransferase (ALT), albumin, blood urea nitrogen (BUN), total cholesterol (TC), triglyceride (TG) were procured from Transasia Biomedicals Ltd., India.
2.2. Preparation of herbosomes
The naringenin herbosome formulation was prepared by the solvent evaporation method wherein naringenin was mixed with phospholipids in 1:0.5, 1:1, 1:2, and 1:3 ratios in dichloromethane in a round bottom flask (Table 1). The solution was then subjected to a rota evaporator at 50 ℃. After the solvent was removed, a thin film was formed on the walls of the round bottom flask. This film was then hydrated with water and subjected to orbital shaking for 3 h,followed by probe sonication at 45% amplitude for 3 min to obtain desired sized herbosomes[12].
2.3. Characterization of herbosomes
2.3.1. Particle size, polydispersity index (PDI), and zeta potential
Herbosome formulations were evaluated for particle size, PDI, and zeta potential by dynamic light scattering technique using particle size analyzer (Zetasizer Nano ZS90, Malvern Instruments, UK),which measures the mean particle diameter and PDI ranging from 0-1 at a scattering angle of 90° at 25 ℃.
2.3.2. Drug content and encapsulation efficiency (EE)
For determining the naringenin content in the herbosomes, a formulation equivalent to 10 mg was added to 10 mL of methanol in a volumetric flask. After suitable dilution, the drug content was measured by a UV-visible spectrophotometer (Lamda 25, Perkin Elmer, USA) at 288 nm[13].
The EE of naringenin in herbosomes was determined by an indirect method, wherein, the herbosome formulation was taken in a centrifuge tube and was centrifuged at 8 000 rpm for 20 min at 4 ℃ using a refrigerated ultracentrifuge. The free naringenin in the supernatant was analyzed with the aforesaid method, whereas the entrapped naringenin was calculated as a difference of total naringenin added and amount of unentrapped naringenin using the following equation:
%EE=(W—W)/W×100……..Eq. 1
Where Wis the total amount of naringenin added; Wis the amount of unentrapped drug obtained in the supernatant.
2.3.3. Fourier-transform infrared spectroscopy (FTIR)
The FTIR study of pure naringenin and naringenin herbosomes(B.No.NGH5) was performed using an infrared spectrophotometer(Spectrum Rx1, Perkin Elmer, USA) in the wavenumber range of 400-4 000 cm. The diffuse reflectance technique was used to record the FTIR spectrum by the KBr pellet method and spectra were analyzed in a reflectance cell at a spectral resolution of ± 4 cm.
2.3.4. TEM
The morphology of the optimized herbosome formulation (B.No.NGH5) was analyzed using a high-resolution TEM (CM-200, Tokyo,Japan). One drop of the formulation was placed on a copper grid coated with a carbon film and dried for 2-5 min over a filter paper. An aqueous solution of 2% tungstophosphoric acid was used as a staining agent. The grid was further dried at room temperature and loaded in the TEM. The areas were scanned and TEM images were taken under low vacuum.
2.3.5. In vitro drug release
In vitro drug release was evaluated using the dialysis bag method with phosphate buffer pH 6.8 as the release medium. The dialysis membrane was soaked in water overnight before use. Naringenin herbosomes (1 mL) of B.No.NGH5 were transferred on the membrane, placed on a modified Franz diffusion cell containing 20 mL medium, and maintained at (37±0.5) ℃, with 300 rpm of magnetic stirrer (n=3). Samples were withdrawn at predetermined time points (0.5, 1, 2, 4, 6, 8 and 12 h) from the sidearm and replaced with the fresh phosphate buffer. Naringenin concentrations were analyzed using a UV-VIS spectrophotometer at λof 288 nm after suitable dilution. Similarly, the study was performed for plain naringenin dispersion. The comparative graphs of percentage drug release versus time were plotted for herbosomes formulation and plain naringenin.
2.4. In vivo study
2.4.1. Experimental animals
Male Sprague Dawley rats (180-220 g) were purchased from National Institute of Biosciences, Pune and housed in an animal facility at a temperature (25±2) ℃, humidity (70±5)%. Animals were kept on a standard nutritional diet and purified water ad libitum and were acclimatized for 7 d.
2.4.2. Induction of diabetes Total thirty-six male Sprague Dawley rats were used in the study.Thirty rats were administered with a single intraperitoneal injection(i.p) of streptozocin (STZ) (55 mg/kg). Glucose was measured after seven days of STZ administration[14]. Animals having blood glucose levels above 250 mg/dL were considered diabetic and were used for further studies.
2.4.3. Treatment
Diabetic animals were randomized into five groups containing six animals per group based on blood glucose and body weight. The treatment was given as follows: GroupⅡanimals were labeled as diabetic control animals and received 0.5% carboxymethyl cellulose suspension as a vehicle for 28 d. Animals in groups Ⅲ and Ⅳreceived a single oral dose of pure naringenin at the dose of 25 mg/kg and 50 mg/kg, respectively. Animals in groups Ⅴ and Ⅵ received a single oral dose of naringenin herbosomes at the dose of 25 mg/kg and 50 mg/kg, respectively[8]. GroupⅠcontaining six animals served as a normal control group, animals in this group received 0.5%carboxymethyl cellulose suspension orally for 28 d. No adverse effects were reported during treatment.
After 28 days of treatment, animals were anesthetized using isoflurane. Blood was collected from retro-orbital plexus from each animal in micro-centrifuge tubes containing 10% disodium EDTA using a pre-heparinized capillary. All samples were centrifuged at 6 000 rpm for 15 min for separation of plasma.
2.4.4. Determination of plasma glucose level
Glucose level was determined using GOD-POD Erba diagnostic kits with the help of a biochemical analyzer (ErbaChem 7,Germany).
2.4.5. Determination of biochemical parameters
Various biochemical parameters like TP, AST, ALT, albumin, BUN,TC, and TG were determined using commercially available diagnostic kits as per manufacturers’ protocol (Transasia Biomedicals Ltd., India)after 28 days of treatment.
2.5. Statistical analysis
All data are expressed as mean ± SEM. Statistical analyses were carried out using Graphpad Prism ver. 5.00 software. Significant differences between different treatment groups were determined using one-way ANOVA followed by Bonferroni’s selected group compression test. P-value 0.05 was considered as a level of significance.
2.6. Ethical statement
The experimental study protocol was approved by Institutional Animal Ethics Committee (Approval Number: CPCSEA/ IAEC/P-69/2017). The study was performed as per the Committee for the Purpose of Control and Supervision of Experiments on Animals guidelines, Govt. of India.
3. Results
3.1. Preparation of herbosomes
Herbosomes were prepared by a simple and reproducible technique of solvent evaporation. All ratios of naringenin: phospholipids yielded herbosomes, which were further characterized to select optimized formulation.
3.2. Characterization of herbosomes
3.2.1. Particle size, PDI, zeta potential, and drug content
The data of particle size, PDI, and zeta potential of herbosomes formulations is given in Table 1. Formulation containing a 1:1 ratio of naringenin: phospholipids showed particle size of 564.4 nm with a PDI of 0.412 and zeta potential of —39.3 mV. As this ratio increased to 1:2 and 1:3, the particle size of herbosomes reduced to 554.4 nm and 380.8 nm, respectively. However, both formulations indicated the uneven size distribution with a high value of PDI>0.5 with distorted peaks, whereas naringenin: phospholipids with a ratio of 1:0.5 showed a very large particle size (1 145.6 nm). Therefore,herbosome formulation with a 1:1 ratio was considered as optimum and a reproducible trial with a higher batch size was taken (B.no NGH5), showing similar product parameters as the initial batch(B.no NGH2). There was no significant difference observed in zeta potential of all batches ranging between —27 to —48 mV.
3.2.2. Drug content and EE
The content of naringenin of all herbosomes batches was in the range of 95.27% to 98.35% w/w. This shows the uniform distribution of drugs and no substantial process loss in naringenin herbosome formulations. Similarly, the EE of optimized formulation was 84.04%, which revealed a sufficient amount of naringenin entrapped in fabricated lipid vesicles.
3.2.3. TEM
The TEM images (B.no NGH5) are depicted in Figure 1, showing the formation of vesicle-like structures at different resolutions.Herbosomes were found to be smooth surfaced, circular or ellipsoidal, well-formed dispersion in TEM study.
3.2.4. FTIR
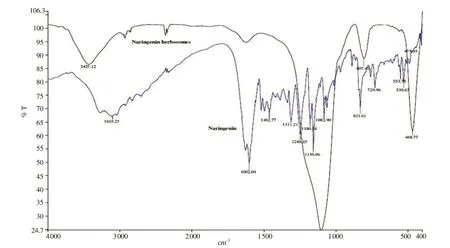
The complexation was further confirmed by FTIR by comparing the spectra of pure naringenin and the formulation (Figure 2). The FTIR spectrum of naringenin showed the characteristic signals at 1 602.04 cm(C=O stretching), 3 103.27 cm(O-H stretching), 1 156.96 cm(C—O—C stretching); whereas the formulation indicated characteristic peaks at 3 427.12 cm(O-H stretching) and 807.43 cm(P-OC+PO2 stretching)[15]. Changes to the stretching frequency of the phenolic O-H of naringenin from 3 103.27 cmto 3 427.12 cmin the herbosomes suggested the weak intermolecular interaction. In addition, the absorption peaks of phospholipids at 807.43 cmwere observed in herbosome formulation.
3.2.5. In vitro drug release study
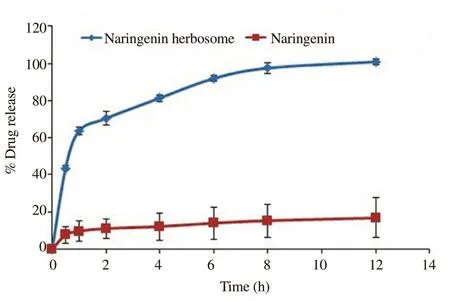
The in vitro drug release study was performed in phosphate buffer pH 6.8. The naringenin herbosome formulation showed rapid release in the initial phase, up to 70% in 2 h and then the complete release was observed in almost 8 h as shown in Figure 3. On the other hand,plain naringenin could not even reach 20% of release during the entire study.
3.3. In vivo study
3.3.1. Effect of pure naringenin and naringenin herbosomes on plasma glucose level
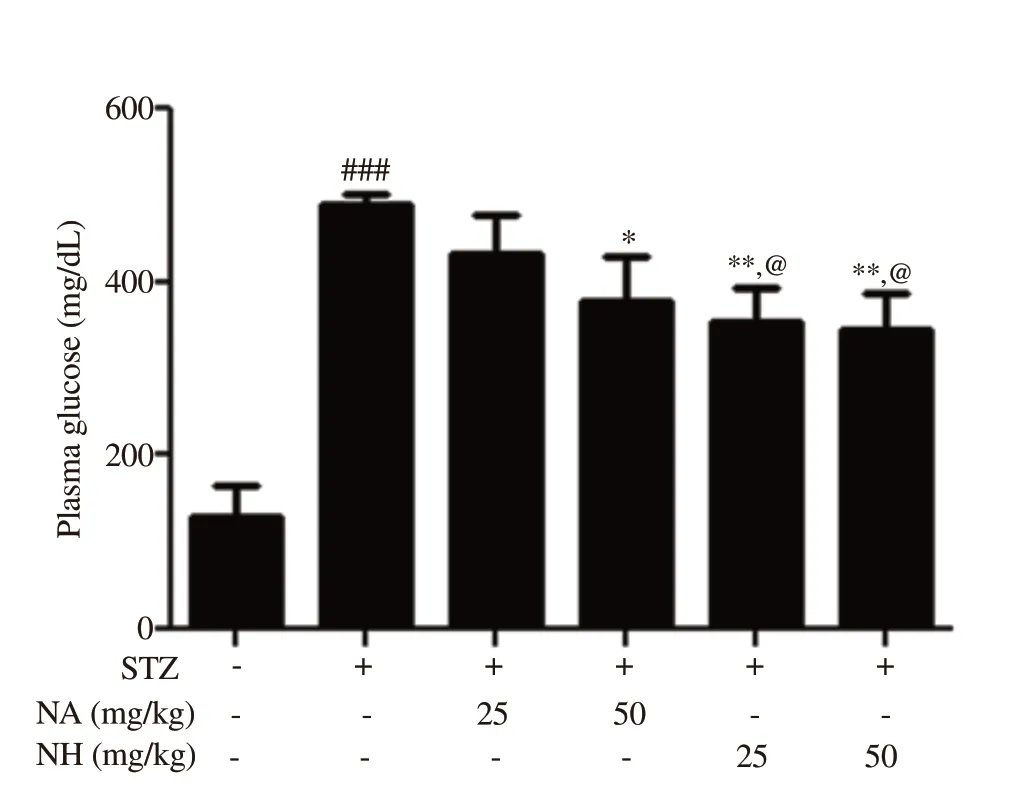
The effect of naringenin herbosomes and pure naringenin on plasma glucose level is shown in Figure 4. The plasma glucose level of diabetic rats was significantly increased (P<0.001) when compared with normal control animals. Treatment of diabetic animals with pure naringenin at 50 mg/kg (P<0.05) and optimized naringenin herbosomes at doses of 25 and 50 mg/kg significantly (P<0.01 and P<0.01, respectively) reduced elevated plasma glucose when compared with diabetic control animals. Naringenin herbosome at 25 mg/kg showed a significant reduction in the plasma glucose level (P<0.05) when compared with the pure naringenin treatment(25 mg/kg) group, but no significant difference was observed whenpure naringenin treatment (50 mg/kg) group was compared with naringenin herbosome treatment (50 mg/kg) group. Naringenin herbosome treatment (50 mg/kg) group showed a significant reduction in plasma glucose when compared with pure naringenin treatment (25 mg/kg) group (P<0.05). The pure naringenin treatment(50 mg/kg) group did not show any significant reduction in plasma glucose when compared with naringenin herbosome treatment (25 mg/kg) group.

Table 1. Composition and characterization of naringenin herbosome batches.

Figure 1. Transmission electron microscope microphotographs of naringenin herbosomes at the scale of (A) 5 µm, (B) 200 nm, (C) 2 µm, (D) 1 µm.

Figure 2. Fourier-transform infrared spectroscopy spectra of pure naringenin and herbosome formulation.

Figure 3. In vitro drug release study of pure naringenin and herbosome formulation.

Figure 4. Effect of naringenin herbosome on plasma glucose level. All values are expressed as mean ± SEM (n=6). *: P<0.05, **: P<0.01 compared with diabetic control group; @: P<0.05 compared with pure naringenin treatment group at 25 mg/kg; ###: P<0.001 compared with normal control animals.STZ: streptozocin, NA: pure naringenin, NH: herbosome formulation of naringenin.
3.3.2. Effect of pure naringenin and naringenin herbosomes on biochemical parameters
Effects of naringenin herbosome and pure naringenin formulation on biochemical parameters are shown in Figures 5, 6, and 7. Diabetic animals showed a significant increase in plasma levels of TC, TG,and BUN when compared with normal control animals (P<0.001).Treatment with pure naringenin and naringenin herbosome at doses of 25 and 50 mg/kg significantly reduced the elevated level of TC (P<0.05 and P<0.01) when compared with diabetic control animals. No significant difference was observed when the naringenin herbosome treatment group was compared with pure naringenin group at both dose levels.

Figure 5. Effect of naringenin herbosome on total cholesterol, triglyceride, and blood urea nitrogen (BUN). All values are expressed as mean ± SEM (n=6). *:P<0.05, **: P<0.01 compared with the diabetic control group; ###: P<0.001 compared with the normal control animals.

Figure 6. Effect of naringenin herbosome on total protein and albumin level. All values are expressed as mean ± SEM (n=6). *: P<0.05, **: P<0.01, ***:P<0.001 compared with the diabetic control group; ###: P<0.001 compared with the normal control animals.

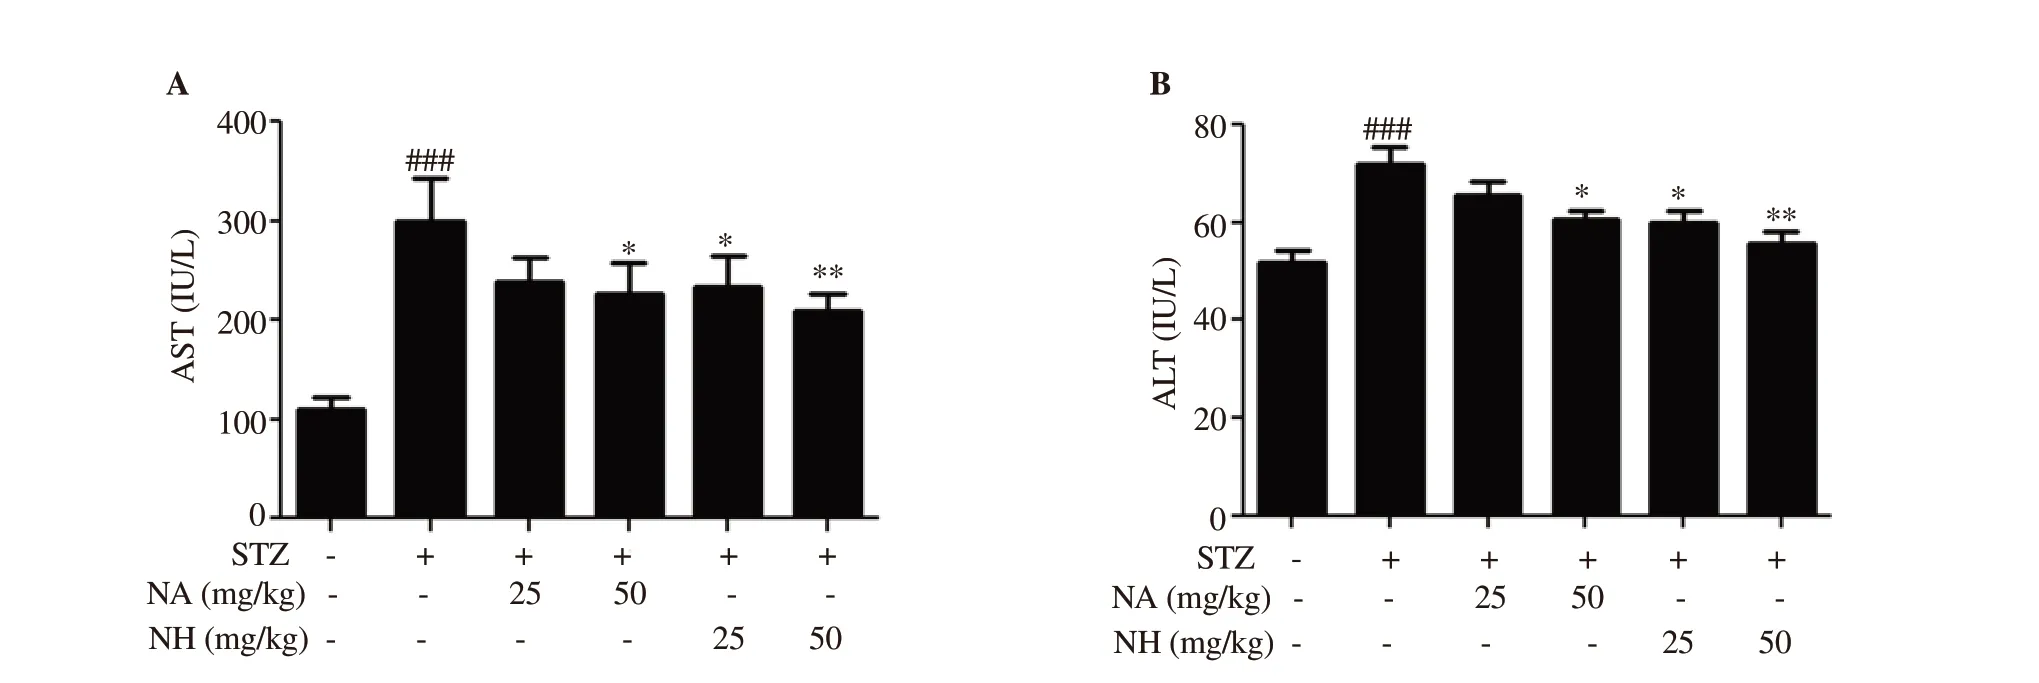
Figure 7. Effect of naringenin herbosome on aspartate aminotransferase (AST) and alanine aminotransferase (ALT) levels. All values are expressed as mean ±SEM (n=6). *: P<0.05, **: P<0.01 compared with the diabetic control group; ###: P<0.001 compared with the normal control animals.
Naringenin herbosome at doses of 25 and 50 mg/kg and pure naringenin at 50 mg/kg significantly reduced (P<0.01) elevated level of plasma TG when compared with diabetic control animals.No significant difference was observed when naringenin herbosome treatment group was compared with pure naringenin treatment group at both dose levels.
Naringenin herbosome at 25 and 50 mg/kg dose also showed a significant reduction in BUN level when compared with diabetic control animals (P<0.05). Diabetic animals treated with pure naringenin did not show a significant reduction in BUN. Also, no significant reduction was observed between naringenin herbosome and pure naringenin treatment groups at both dose levels (Figure 5).
TP and albumin levels were significantly (P<0.001 and P<0.001)reduced in diabetic control animals when compared to normal control animals. Treatment with pure naringenin and naringenin herbosome at doses of 25 and 50 mg/kg significantly (P<0.01 and P<0.001) increased the level of TP when compared with the diabetic control animals. No significant difference was observed between naringenin herbosome and pure naringenin treatment group.
Naringenin herbosome at a dose of 50 mg/kg showed significant improvement in albumin level when compared with diabetic control animals (P<0.05). No significant difference was observed in albumin level when pure naringenin treatment groups (25 and 50 mg/kg) and naringenin herbosome group (25 mg/kg) were compared with the diabetic control group. There was no significant change in albumin level when the naringenin herbosome group was compared with pure naringenin treatment group (Figure 6).
AST and ALT levels were found to be significantly elevated in diabetic control animals when compared with normal control animals(P<0.001). Treatment with naringenin herbosomes at doses of 25 and 50 mg/kg and pure naringenin treatment at a dose of 50 mg/kg significantly decreased (P<0.05 and P<0.01) the elevated levels of AST and ALT when compared with diabetic control animals. Naringenin treatment group (25 mg/kg) did not show a significant reduction in AST and ALT levels. No significant difference was observed in AST and ALT levels when naringenin herbosome treatment group was compared with pure naringenin treatment group (Figure 7).
4. Discussion
Herbosome is a new technology to prepare herbal formulations that incorporate standardized active ingredients of herbal extracts into phospholipids for enhancing the bioavailability of bioactive constituents such as flavonoids, phenolics, and hydrophilic compounds effectively.Naringenin is a bitter, colorless flavanone having potent anti-oxidant,anti-inflammatory, and antidiabetic activity. The present study aimed to study the effect of naringenin herbosomes on the treatment of diabetes.
In herbosome formulation, naringenin was attached to the polar part of the phospholipid to form a drug-lipid complex, and a 1:1 ratio of naringenin: phospholipid was found to be optimum with desired particle size. Zeta potential of herbosomes indicates good stability and its higher value would help reduce aggregation of vesicles during storage. The negative value of zeta potential is attributed to the presence of phosphatidylcholine[16]. Herbosomes showed a high percentage of drug loading due to strong bond formations between the polar choline head of the phospholipids and naringenin. In the optimized formulation,the equivalent quantity of drug and phospholipids provides sufficient opportunity for interaction as phosphatidylcholine provides more than one site. FTIR data demonstrate this intermolecular interaction is responsible for the formation of herbosomes. TEM results confirmed the construction of uniform vesicles of herbosomes with similar particle size to dynamic light scattering data ensuring nanosize of formulation. The substantial higher drug release of naringenin from herbosome formulation compared with a plain drug indicates the sufficient entrapment of the naringenin inside the lipid matrix that leads to maximum drug release.This improved in vitro characteristic would be beneficial to attain desired bioavailability within a short period[17].
STZ, a nitrosourea derivative, is a well-known and well-established drug for establishing the animal model of diabetes. STZ has DNA alkylating property and administration of it to experimental animals at a dose of 55 mg/kg leads to pancreatic β cell cytotoxicity, which results in a defect in insulin secretion[18]. Single intraperitoneal injection of STZ causes damage to β-pancreatic cells that hampers the glucosestimulated insulin release and insulin resistance in diabetic rats. It is also associated with reduced entry of glucose in peripheral tissue and increase in gluconeogenesis, glycogen breakdown, and hepatic glucose production[19]. Naringenin per se has been reported for its beneficial effect in diabetes[20]. Naringenin treatment could reduce plasma glucose significantly in diabetic rats. The results of the present study are also in line with the previous reports[21]. Treatment of diabetic rats with naringenin herbosome for 28 d significantly reduced the elevated level of plasma glucose. The effect of naringenin herbosome treatment was more significant compared with the pure naringenin treatment group.
Single i.p injection of STZ to experimental animals also affects the level of hepatic marker enzymes. Besides, prolonged high glucose level causes necrosis of liver tissue in STZ-induced diabetic rats, which causes a release of AST and ALT from the liver cell into the bloodstream, then increases their plasma level[22]. Naringenin has been reported previously for its effect on increased hepatic markers in diabetic conditions[23]. In the present study, diabetic animals showed elevated levels of AST and ALT, which were significantly decreased by pure naringenin treatment at a dose of 50 mg/kg and naringenin herbosome treatment at the dose of 25 and 50 mg/kg.
Hepatic damage also affects the level of total protein and albumin.Diabetic animals showed a significant decrease in levels of total protein and albumin. Treatment with pure naringenin and naringenin herbosomes significantly prevented the hepatic damage and improved the level of total protein at both the dose level whereas naringenin herbosome at a dose of 50 mg/kg showed a significant increase in the level of albumin. An increase in glucose level is associated with abnormal lipid metabolism. STZ-treated rats showed hyper-triglyceridaemia and hyper-cholesterolemia[24]. A previous study has reported that naringenin treatment has decreased levels of TG and cholesterol in diabetic conditions[25]. Diabetic rats treated with naringenin herbosome showed significant decreases in abnormal lipid markers like TC and TG. Naringenin herbosomes significantly reduced BUN level, but pure naringenin treatment dose did not lead to significant reduction.Naringenin herbosome and pure naringenin treatment were also found to be effective in reducing TC and TG levels.
In conclusion, herbosome showed significant improvement in the release profile of naringenin but did not possess significant changes in biochemical parameters as compared to pure naringenin treatment.Herbosome formulation was found to be superior in reducing elevated plasma glucose levels and also showed a better release profile of naringenin as compared to its pure form. Therefore, it can be concluded that naringenin herbosome formulation may be considered as a better option for the treatment of diabetes.
Conflict of interest statement
The authors declare no conflict of interest.
Acknowledgments
Authors are thankful to VAV life sciences Pvt. Ltd, India for providing gift sample of LECIVA-S70.
Authors
’contributions
The study was designed by SW and YK. RJ performed the samples collection and laboratory experiments. RJ and AL were responsible for the analysis and interpretation of the data. RJ and AL wrote and drafted the manuscript. SW and YK reviewed and edited the manuscript, and then gave final approval of the version to be published. The manuscript has been read and approved by all the authors.
 Asian Pacific Journal of Tropical Biomedicine2021年9期
- Asian Pacific Journal of Tropical Biomedicine的其它文章
- Tylophora hirsuta L. leaf extract attenuates alloxan-induced diabetes in mice by suppressing oxidative stress and α-amylase
- Antibacterial activity and inhibition against Staphylococcus aureus NorA efflux pump by ferulic acid and its esterified derivatives
- In vitro antimicrobial and synergistic effect of essential oil from the red macroalgae Centroceras clavulatum (C. Agardh) Montagne with conventional antibiotics
- Biopeptides of Pyropia yezoensis and their potential health benefits: A review
