
Centrifuge model test on performance of thermosyphon cooled sandbags stabilizing warm oil pipeline buried in permafrost
2021-07-30 01:12GuoYuLiHongYuanJingNikolayVolkovWeiMaPengChaoChen
GuoYu Li ,HongYuan Jing ,Nikolay Volkov ,Wei Ma ,PengChao Chen
1.State Key Laboratory of Frozen Soil Engineering (SKLFSE),Northwest Institute of Eco-Environment and Resources(NIEER),Chinese Academy of Sciences(CAS),Lanzhou,Gansu 730000,China
2.Da Xing'anling Observation and Research Station of Frozen-ground Engineering and Environment,NIEER,CAS,Jiagedaqi,Heilongjiang 165000,China
3.PipeChina North Pipeline Company,Langfang,Hebei 065000,China
4.GEOINGSERVICE LLP(Fugro Group),29 Vernadskogo Avenue,Moscow,Russia
ABSTRACT The thaw settlement of pipeline foundation soils in response to the operation of the first China-Russia Crude Oil Pipeline along the eastern flank of the northern Da Xing'anling Mountains in Northeast China was simulated in a physical model test (with a similitude ratio of 1/73) in a geotechnical centrifuge.Two pipes of a supported and an unsupported section were evaluated over a testing period for simulating 20 years of actual pipeline operation with seasonal cyclically changing oil and ambient temperatures.The results show that pipe settlement of the supported pipe was 45%of settlement of the un‐supported pipe.Settlement for the unsupported section was approximately 35% of the thaw bulb depth below the initial pipe elevation,only 30%of that for the supported pipe due to the influence of the supports.The final thaw bulbs extended approximately 3.6 and 1.6 times of the pipe diameter below the unsupported and supported pipe bottom elevations,respec‐tively.The sandbag supports kept frozen during the test period because of cooling effect of the thermosyphons.The maxi‐mum bending stress induced over the 20 m span length from bearing of the full cover over the pipe would be equivalent to 40% specified minimum yield strength (SMYS).Potential buckling of the pipe should be considered as the ground thaws.This study also offers important data for calibration and validation of numerical simulation models.
Keywords:centrifuge test;oil pipeline;frost heave;thermosyphon;thaw settlement;permafrost engineering
1 Introduction
The 1,030-km-long China-Russia Crude Oil Pipe‐lines (CRCOPs)were designed to transport 30 million tons of Siberian crude oil per year using two parallel buried pipelines,generally 813 mm in outer diameter and 11.9 mm in wall thickness.They passed through 518 km of permafrost and 512 km of seasonally fro‐zen ground from Skovorodino,Russia,to Daqing,China,including 441 km of permafrost territories in Northeast China along the eastern flank of the north‐ern Da Xing'anling Mountains (Jinet al.,2008,2010;Liet al.,2010).The first line of CRCOP (CRCOP-Ⅰ)began to operate in 2011 and the annual throughput was 15 million tons.In 2014,annual throughput in‐creased to 20 million tons by increasing the pumping pressure.The second line of CRCOP(CRCOP-Ⅱ)was built in 2017 and began operation on January 1,2018.Two pipelines together met the requirement of 30-mil‐lion-ton throughput per year signed by China and Rus‐sia governments.Due to climate warming,construc‐tion disturbances and unexpectedly higher oil temper‐atures,permafrost underlying CRCOP has been warm‐ing and thawing.In turn,ground surface subsidence and ponding,pipe settlement,and hydrothermal ero‐sions have occurred (Liet al.,2015,2018;Wanget al.,2016a,2016b;Wanget al.,2018;Chaiet al.,2020),which may potentially lead to pipeline rupture and oil leakage,devastating the pristine environments in boreal forest and wetlands regions in China and Russia.In order to ensure pipeline safety,particular care was given to(differential)thaw settlement of per‐mafrost foundation soils underlying the pipeline,and special designs and construction modes were formu‐lated and adopted,such as cold season construction,thickening pipe wall,coating insulation layer around the pipe,installing thermosyphons and air-ventilated pipes near the oil pipelines during design,construc‐tion and maintenance phases (Jinet al.,2008;Liet al.,2018).
In cold regions,other oil and gas pipelines were al‐so constructed in permafrost and faced major challeng‐es related to thaw settlement,frost heave,slope failure,icing,and frost mounds.Correspondingly,some mea‐sures were adopted for mitigating the adverse impacts to pipeline and fragile environment in a cost-effective manner.Permafrost and active layer characteristics,pipeline parameters,key engineering and geohazard problems and mitigated measures are concisely de‐scribed as follows,which are expected to provide refer‐ences and implications for CRCOP.The Canol pipe‐line,960 km in length and 100 mm in pipe outerwall diameter,was constructed from Norman Wells to Whitehorse in NWT,Canada,and to Fairbanks in inte‐rior Alaska in 1943−1944 as part of a larger Alaska de‐fense strategy.It was laid on wooden timbers on the ground surface,transporting about 175 m3of oil prod‐ucts per day (Williams,1986;Jin and Brewer,2005;Oswell,2011).It generally performed poorly,being too small for the demand and being laid on the ground without consideration of the thermal disturbances and seasonal freeze−thaw cycles.Several pipeline ruptures occurred with significant losses of oil (MacNaughtonet al.,2007).The Canol pipeline operated for about one year before being shut down and abandoned.
The Haines-Fairbanks pipeline in Southeast Alas‐ka,1,000 km in length and 250 mm in pipe outerwall diameter,was constructed also on the ground surface between 1953 and 1955 to carry refined petroleum products to supply the US armed forces.It began to operate in 1956,but was suspended shortly after start-up because the water used to test the pipeline had frozen solid and would not allow petroleum to pass the blockages.It took about six months to resolve(Hollinger,2003).After removing over 120 ice plugs,the pipeline operated without major interruption for 15 years.The permafrost underlying the pipeline degraded and ground surface subsided due to thermal disturbances of the operating pipeline.The subsided sections of pipeline foundation were later filled to protect the pipeline from sagging or damage.It was shut down permanently in 1972.
The Alyeska Pipeline System,1,287 km in length and 1,220 mm in diameter,was completed in July 1977 and began to transport higher temperature(57−63 °C) crude oil at a daily throughput of about 111,000 m3.It passed a wide range of permafrost from continuous to sporadic and marginal.Oil temperatures varied from 63 °C at the northern inlet to 7 °C at the southern outlet (Johnson and Hegdal,2008).Some permafrost-related problems were identified after pipeline operation such as pipeline sagging as a result of thaw settlement of pipeline foundation soils,gas blockage of thermosyphons and failures of insulation system(Johnson,1983).The last 40 years of successive operations and experiences have provided important lessons to those designed for and operated in perma‐frost regions.A total of 676 km pipeline was con‐structed above the ground to avoid the threat from thawing permafrost by completely bridging over it.The thermal vertical support member (VSM) system with thermosyphons was designed to support the pipe‐line under all operating loadings and to protect the un‐derlying permafrost from thawing.A total of nearly 124,000 thermosyphons were used in the construction of the above-ground pipeline support system along the Alyeska Pipeline (Breweret al.,2006;Johnson and Hegdal,2008).Special burial pipeline construc‐tion was adopted at three locations with unstable per‐mafrost,where the above ground mode was thought to interfere with wildlife migration and was not al‐lowed.In this special burial mode,an insulated pipe‐line was designed with mechanical refrigeration to maintain frozen conditions below the pipe (Jinet al.,2008;Johnson and Hegdal,2008).
The Golmud to Lhasa Oil Products Pipeline(GLOPP),1,178 km long and 159 mm in outside diam‐eter with a 6-mm-thick pipe wall,was constructed in 1972 and completed in 1977 from Golmud,Qinghai Province to Lhasa,Tibet Autonomous Region on the Qinghai−Tibet Plateau in Southwest China,almost si‐multaneously with the Alyeska pipeline system (Jin and Brewer,2005;Jinet al.,2008,2010).The designed an‐nual throughput was 90,000 metric tons of gasoline and 60,000 metric tons of diesel.The oil temperature varied from −5 to +9 °C seasonally.Since 1977,more than 30 oil leaks and at least four pipeline ruptures have been reported because of frost hazards and freeze-thaw ac‐tion (He and Jin,2010).There was no special measure adopted for mitigating the thaw settlement,frost heave and ice plugs except for shallow burial.
The Norman Wells to Zama crude oil pipeline in permafrost areas of Canada was constructed between 1983 and 1985,and started operating in April 1985,running 869 km long with a 300-mm outerwall diame‐ter from Norman Wells Oilfield to Zama Lake in Northern Alberta (Williams,1986;Jin and Brewer,2005).The pipeline has a design capacity of 4,800 m3per day.The permafrost encountered along the route necessitated special design features and mitigative ap‐proaches for terrain disturbance and ensure pipe safe‐ty under possible conditions of thaw settlement,frost heave and slope instability (Kayet al.,1983).The main approaches included:1) pre-construction winter right-of-way clearance,maximizing the use of previous cutlines,2) winter construction using temporary access roads,3) shallow burial depth (average 1 m),4) small diameter (324 mm) pipe,5) chilling of the oil to near 0 °C before pumping at Norman Wells for pipeline op‐eration at ambient ground temperature,and 6) wood chip insulation on thaw-sensitive slopes (Nixonet al.,1984;Hanna and McRoberts,1988;Wishart,1988).
The Nadym-Pur-Taz (NPT) gas production com‐plex in northwestern Siberia of Russia is underlain by continuous,discontinuous and sporadic permafrost.From north to south of NPT,mean annual ground tem‐peratures of permafrost range from −7.5 °C to −3 °C.The active layer thickness varies from 0.3 m in peaty soils,to 1.5−2.0 m in silt or sandy soils.Thermokarst,thermal erosion,thermal contraction cracking and frost heave are widespread cryogenic phenomena in the field.Three types of construction modes for gas pipe‐line are used in NPT,i.e.,above-ground feeder pipeline with diameter of less than 520 mm,collecting pipeline buried under the ground or laid on the ground in soil berms and trunk pipeline buried under the ground or laid on the ground in soil berms with diameters be‐tween 1,020 to 1,420 mm.All pump stations and gas processing plants are equipped with air cooling units to cool the gas from +20 °C to +3 °C (Seligman,2000).In permafrost regions,the gas temperature often ex‐ceeds 35 °C after compressor stations,resulting in sig‐nificant thawing of underlying permafrost and visible floating of the pipeline above ground surface in some sections in summer.It decreases along the pipeline,even below 0°C in winter,leading to frost heave.Some ruptures of small diameter (425 mm in diameter,10 mm in wall thickness) buried pipelines occurred due to 50 −60 mm frost heave (Seligman,1999).In ice-rich permafrost territories,the buried pipeline was ballasted by concrete blocks or anchored in frozen ground to prevent it from floating up under the buoyant force.However,some of the pipeline sections performed poorly and exposed to air (jacked up to the ground surface).In some sections,the non-frost-susceptible soil berm was laid over the pipeline to prevent its floatation(Williams,1986;Seligman,2000).
In order to mitigate frost heave and thaw settlement of the permafrost underlying oil or gas pipelines in cold regions,prototype tests in the field,and numerical and physical modelling tests have been carried out to investigate their processes and the performance of vari‐ous mitigative measures.Particularly,centrifuge model‐ling was extensively used because of reduced scaling and accelerated time for testing and cost-effectiveness when modelling gravity-dependent phenomena (Scho‐field,1980;Carlsonet al.,1982;Murff,1996).Centrif‐ugal acceleration is used to simulate increased gravity and allows for correspondence of stress fields between model and full-scale,permitting accurate modelling of geotechnical phenomena.Such modelling has per‐mitted calibration and verification of numerical and theoretical models of full-scale situations (Tayor,1995;Liet al.,2018;Taliet al.,2019).It has also been widely used to predict the frost heave or thaw settlement of cold region pipelines (Phillipset al.,2002;Clark and Phillips,2003;Zhou and Tang,2015).
However,no centrifuge test has been carried out to simulate the thaw settlement of permafrost underly‐ing CRCOP,and some novel and cost-effective miti‐gative measures still need to be developed to tackle the thawing of underlying permafrost due to unexpect‐edly higher oil temperature and complexity of thermal and mechanical interactions between pipeline and per‐mafrost.This is in spite of some adopted mitigative measures,such as thicker pipe-wall,insulation layer around the pipe,thermosyphons,and air-ventilated pipes near oil pipelines.Their performance also needs to be validated through prototype,centrifuge or nu‐merical tests.Of course,the geotechnical centrifuge test is relatively preferable due to its marked advan‐tages as mentioned above.
In this study,a combined mitigative measure,i.e.,thermosyphon cooled sandbags,was proposed to cool and stabilize permafrost foundation soils under CRCOP.Thermosyphons,a highly efficient heat trans‐fer device for removing heat from deeper permafrost to outer atmosphere through phase change of the closed working fluid in winter,were used to cool the foundation soil.Sandbags with higher modulus and lower susceptibility to ground freezing and thawing were used to partially support the pipe.Their inte‐grated effectiveness was verified and thaw settle‐ment of permafrost was simulated by centrifuge test in C-Core,St.John's,NL,Canada.The design,results and interpretation of the physical model tests together with recommendations for the application of these re‐sults to the field are described and provided.The re‐corded data could also be used for calibration and val‐idation of numerical simulation.
2 Methods
2.1 Technical design specification
This study tested two oil pipelines in the centri‐fuge test.One pipe,stabilized by thermosyphon cooled sandbags,was tested to investigate its cooling and support effectiveness.The second was unsupport‐ed and tested to investigate uniform thaw settlement as a reference.Both pipes were of the same material and dimensions,and they were coated in heat-shrink tubing to simulate pipe insulation.
The conceptual mitigative measure is presented in Figure 1 where sandbag supports were kept cold by two thermosyphons.These supports would be spaced at 20-m intervals as required in the permafrost region.Sandbags would be used as a support,and also as an active layer for thawing caused by the heated oil pipe and freezing caused by thermosyphons.In the thaw‐ing season,part of the sandbags would thaw but would not lose their bearing capacity,and the clay lay‐er under the sandbags should remain frozen.In the freezing season,thermosyphons would be used to freeze the sandbags again.
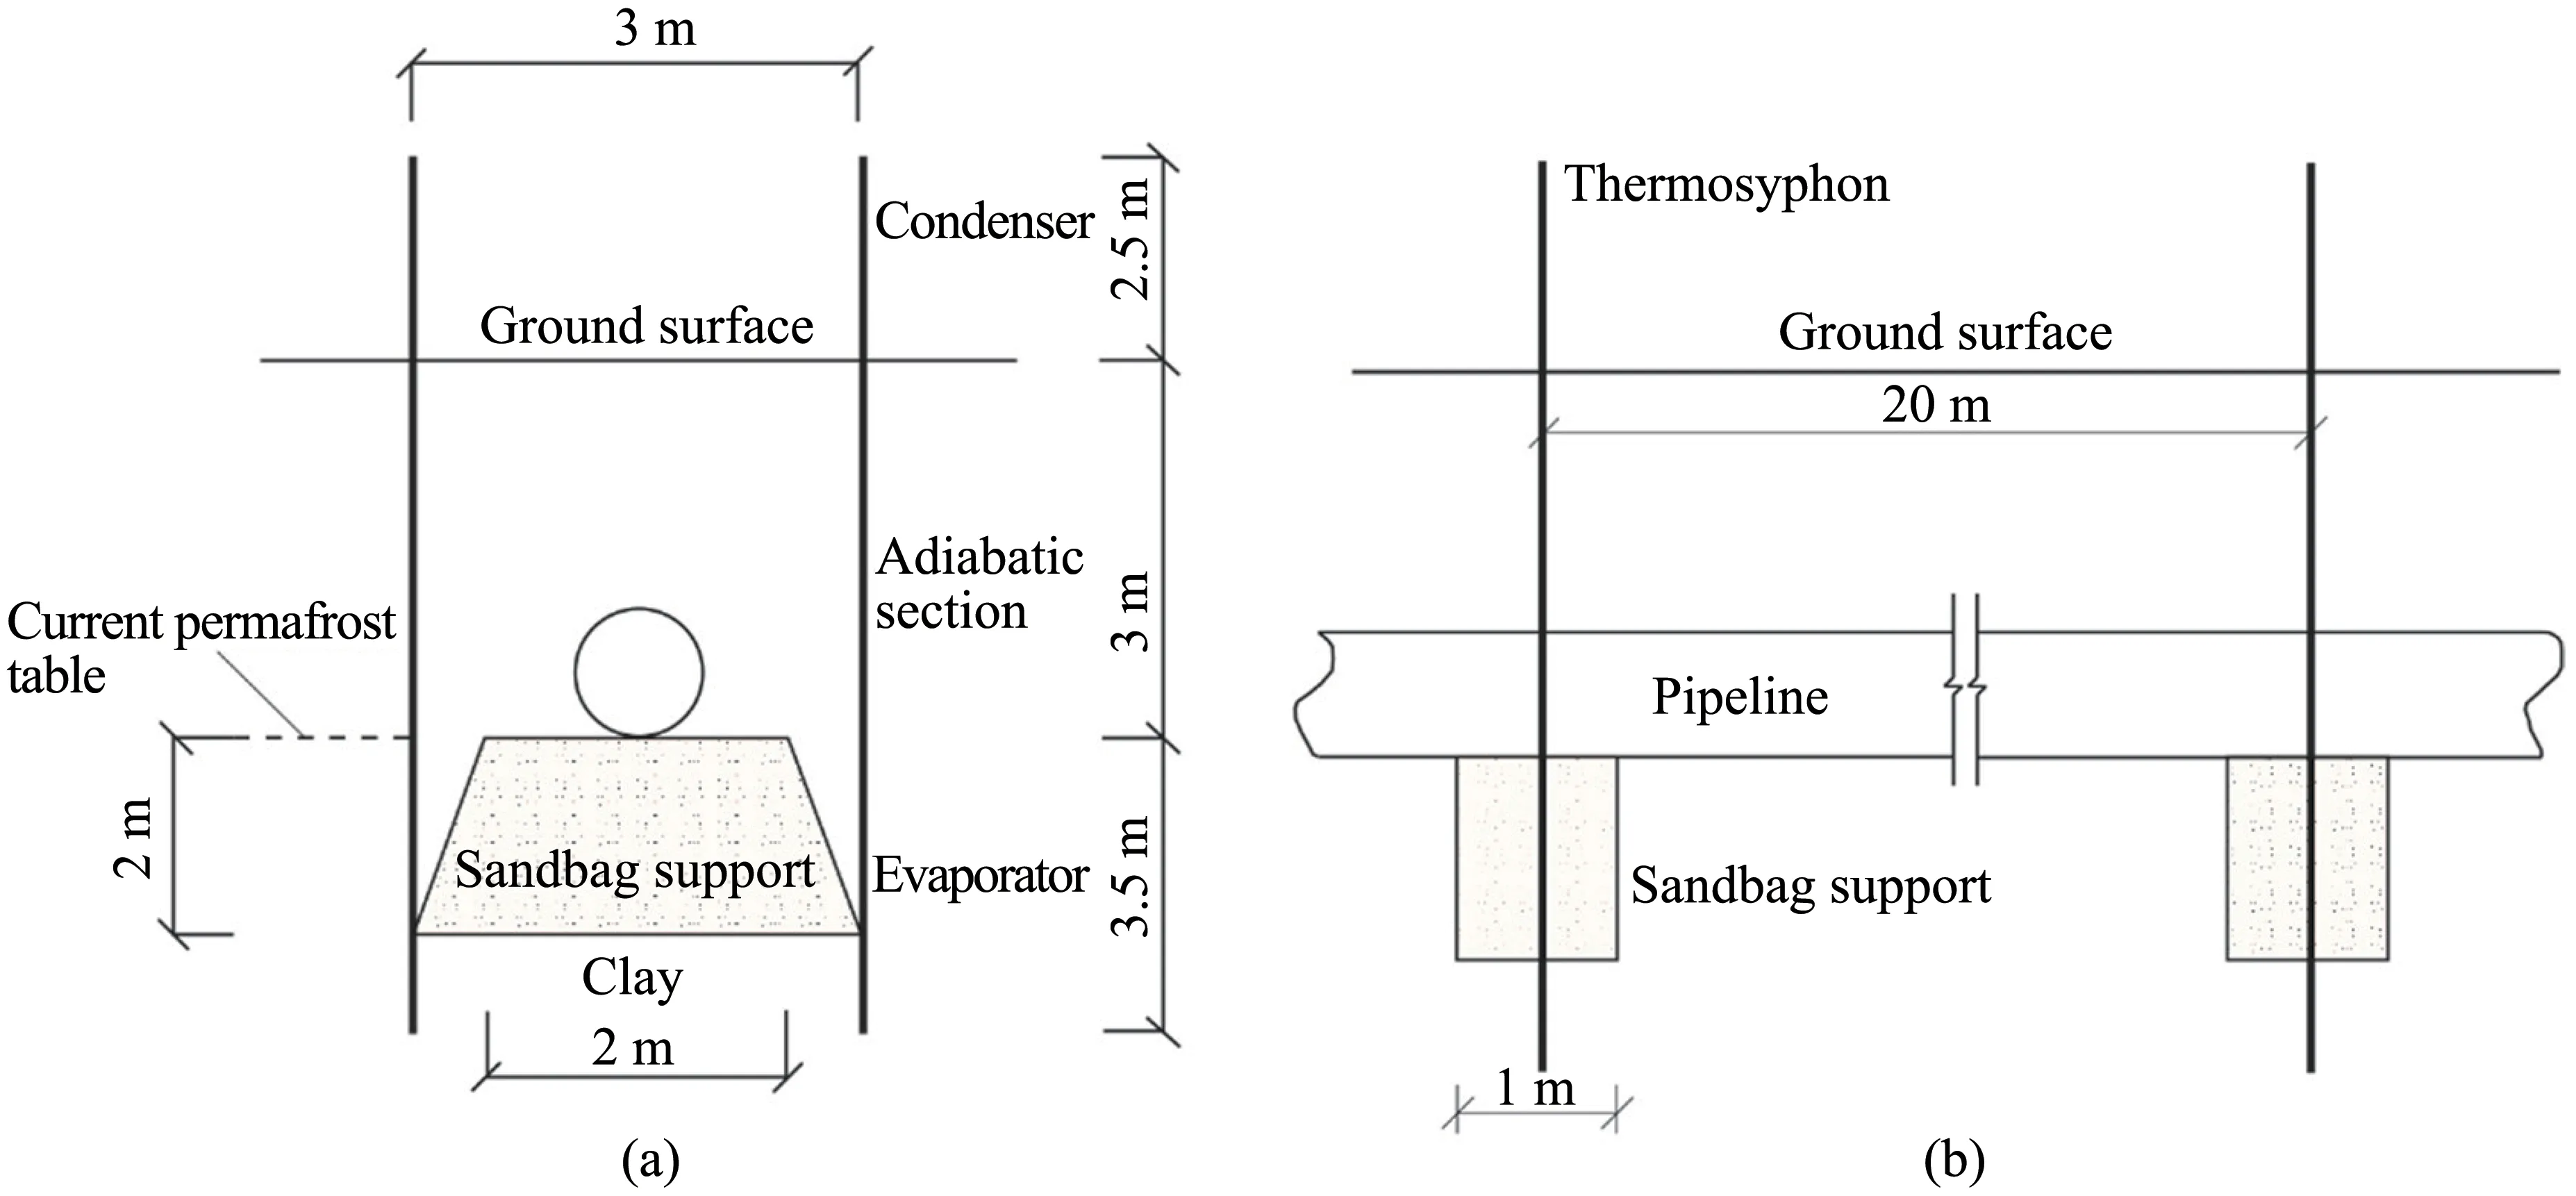
Figure 1 Conceptual figure of the mitigative measure for thaw settlement:(a)cross section,(b)longitudinal section
Field information involving soil type and proper‐ties,pipeline characteristics,thermal insulation char‐acteristics,average oil temperature,monthly air tem‐perature,thermosyphon parameters,and configura‐tions of mitigative measures were determined and pro‐vided by the PipeChina North Pipeline Company,as presented in Tables 1 to 7,which tried to match field conditions as close as possible.Several test conditions were simplified to facilitate a practical test execution,as described below.
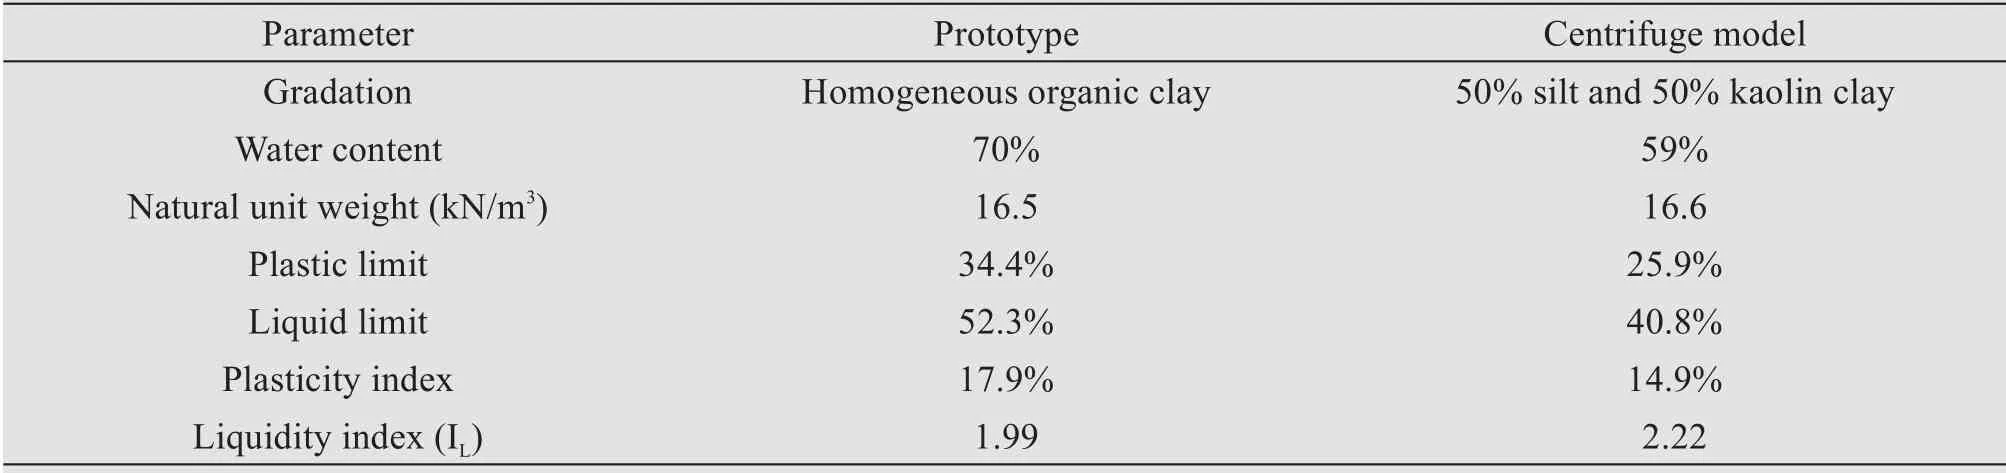
Table 1 Soil type and properties in prototype and centrifuge model test
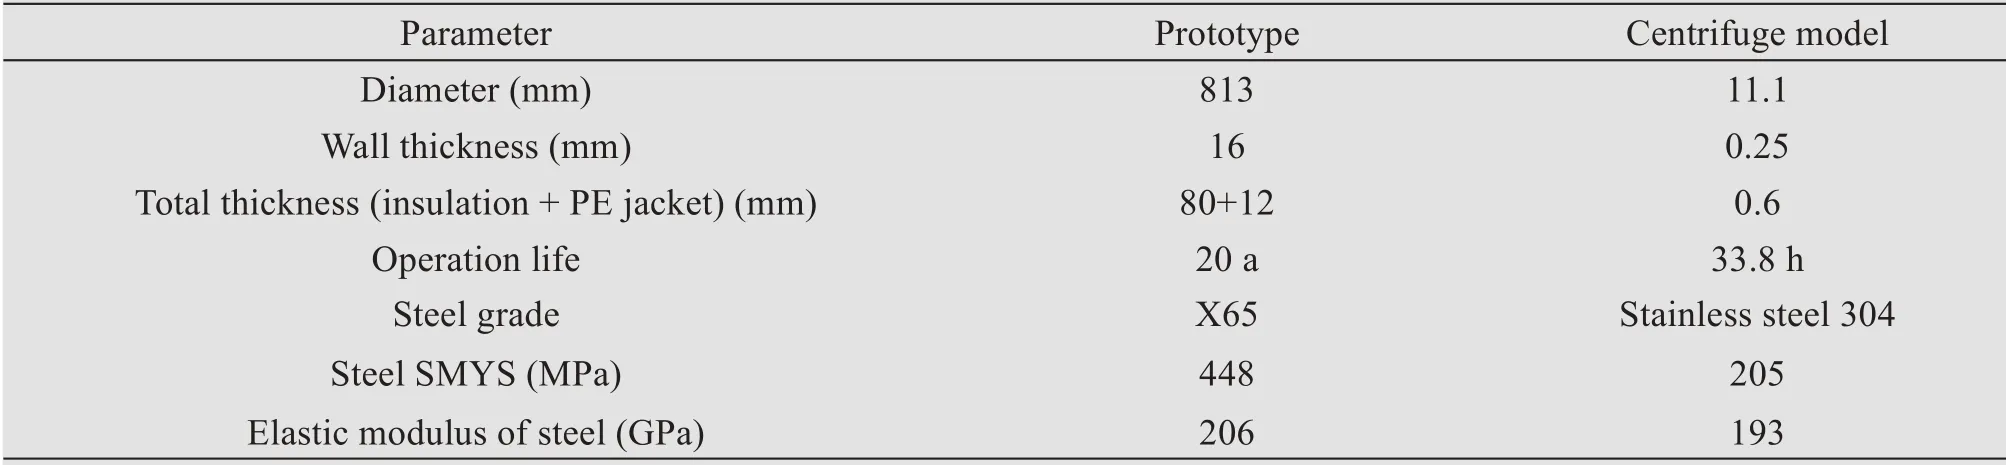
Table 2 Pipeline characteristics
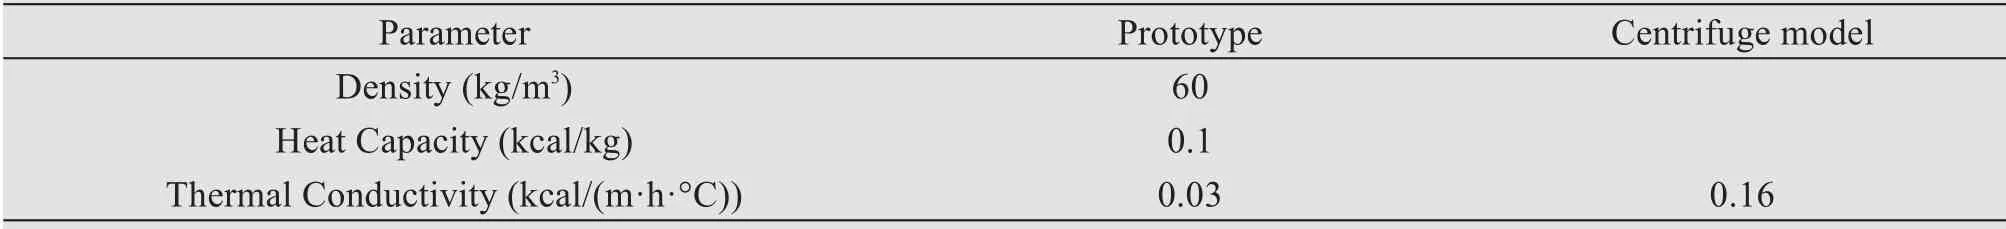
Table 3 Thermal insulation characteristics
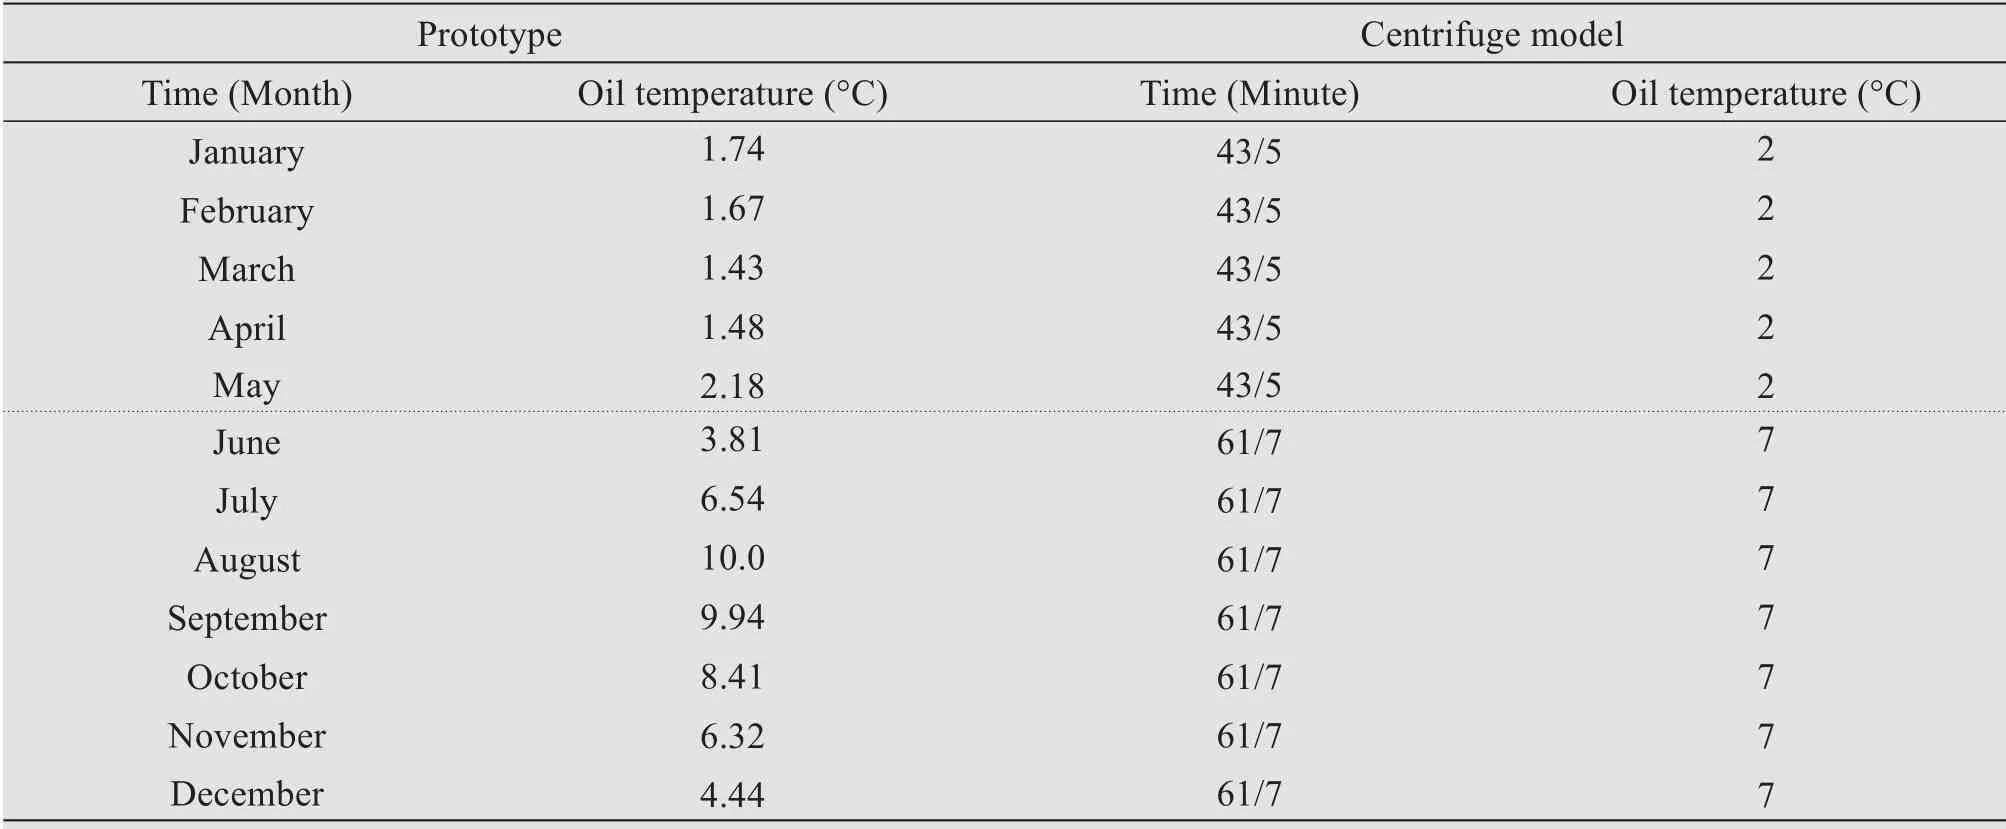
Table 4 Oil temperature
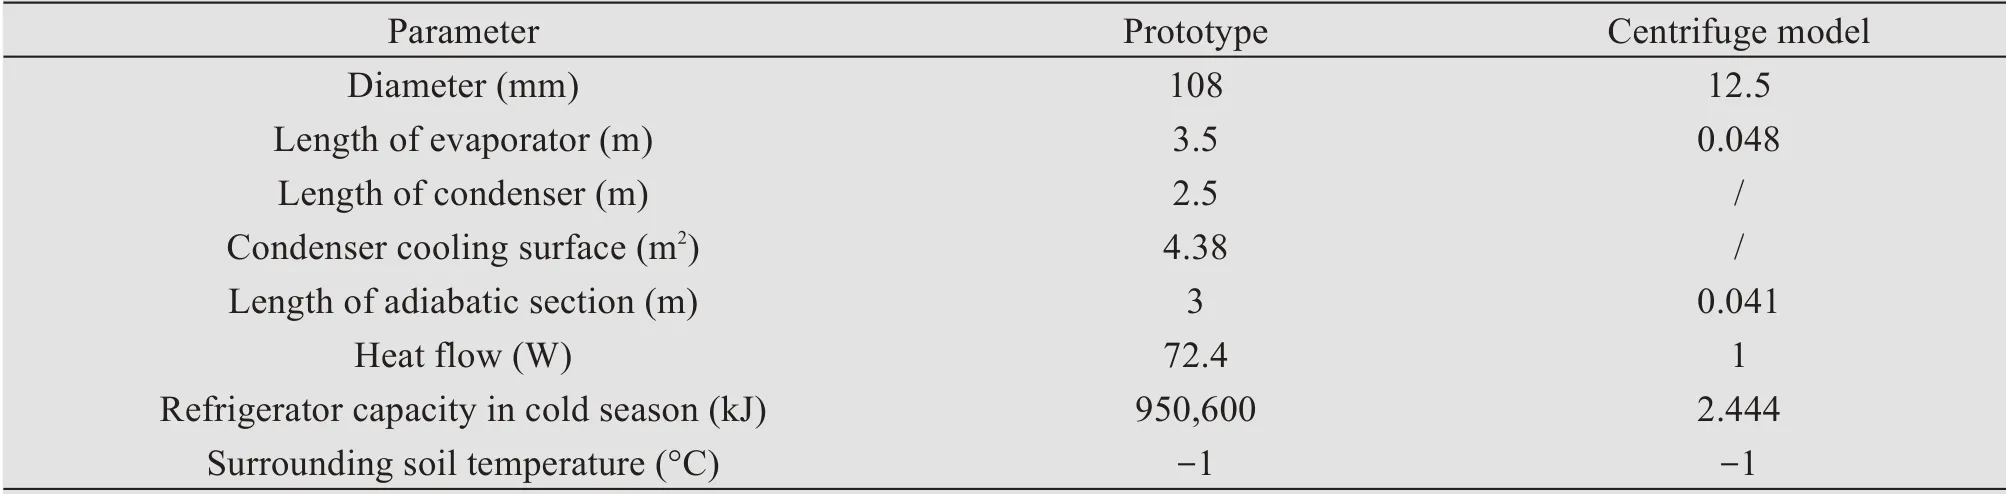
Table 5 Thermosyphon characteristics
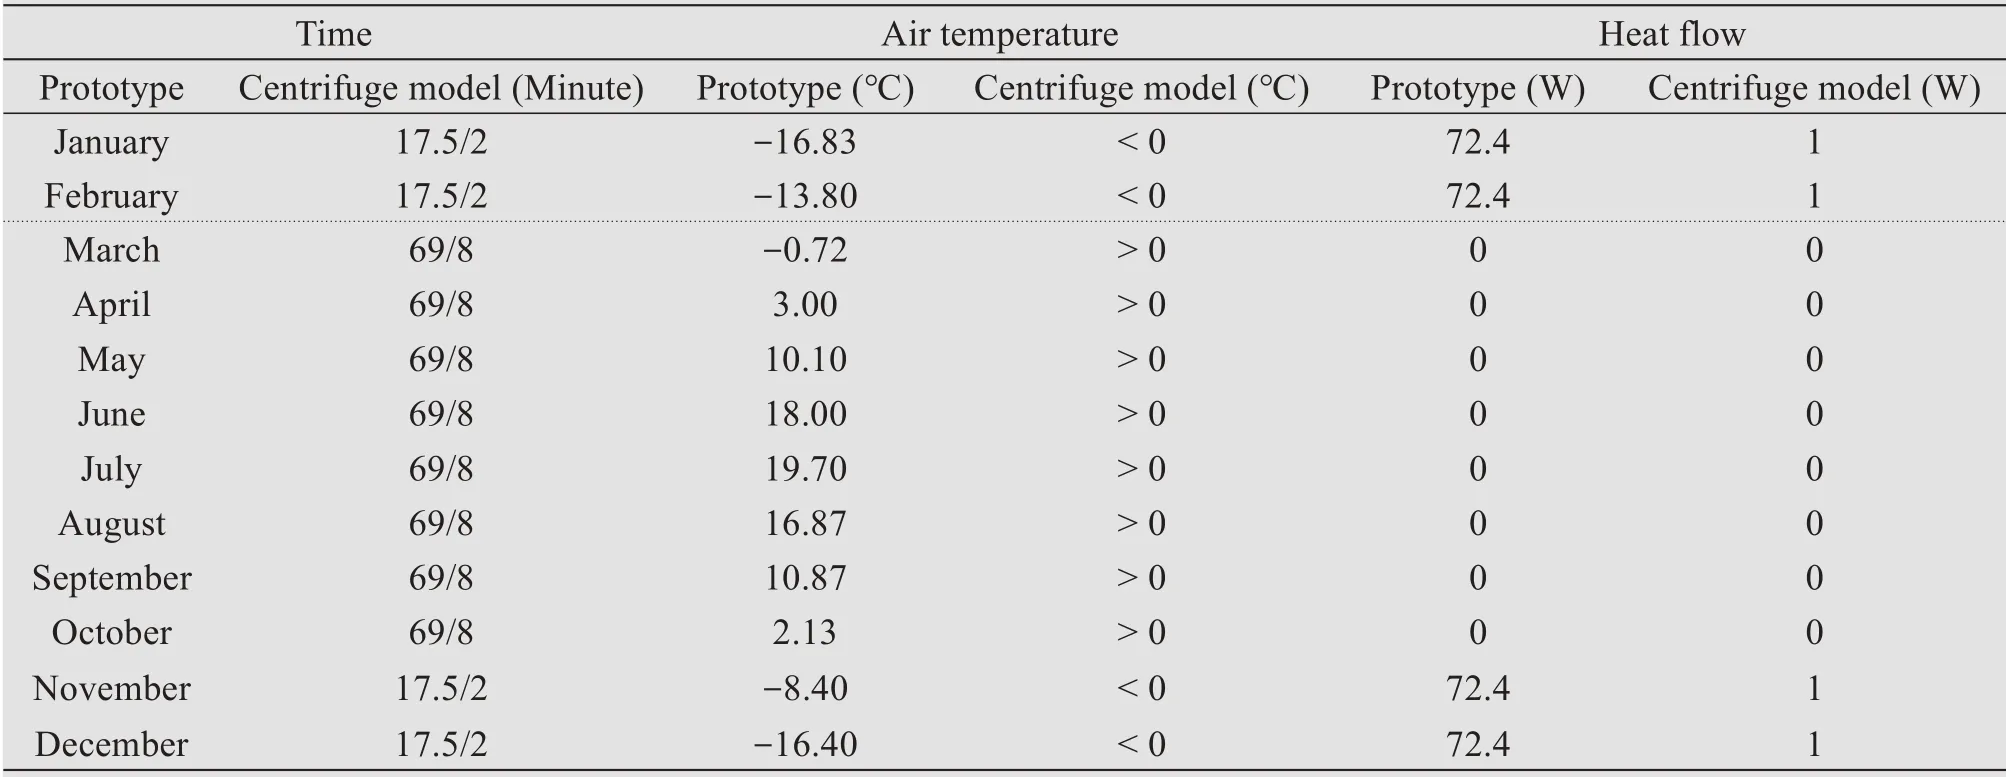
Table 6 Air temperature and heat flow of thermosyphon
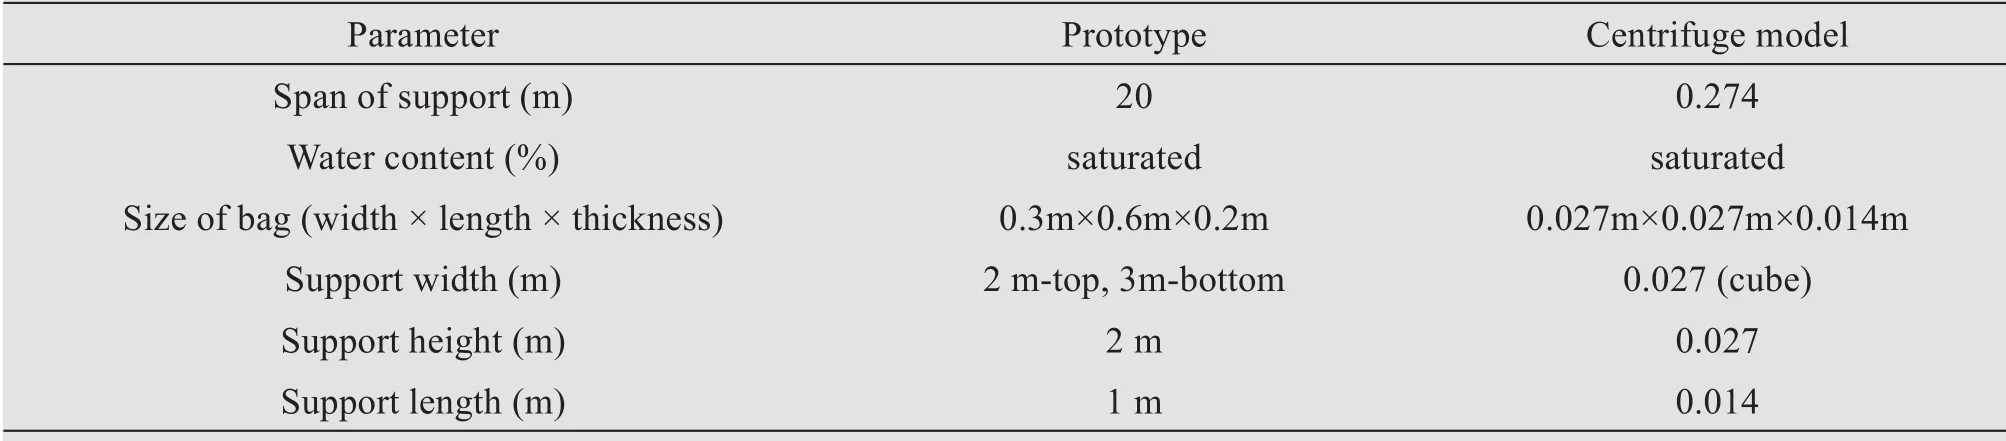
Table 7 Characteristics of sandbag support
The scaling laws (g-level for similitude analysis)used for these tests were determined depending on two key dimensions of pipeline setup,namely pipe span length,20 m,and pipe diameter,813 mm in the prototype model test.In order to accommodate two pipeline spans within the test bed,the maximum mod‐el span length was required to be less than 300 mm.Therefore,the g-level can be calculated based on span length,20 m/0.3 m,to be 67 g.In turn,model pipe di‐ameter should be less than 813 mm/67 or 12.1 mm.A standard pipe diameter,11.1 mm,was selected to sat‐isfy these requirements resulting in a test g-level of 73 g,namely a scaling law of 73,labelledN.As the scaling law for temperature is 1,so thermal boundar‐ies such as air temperature and oil temperature are not downscaled,only simplified,as presented in Tables 4 and 6.Other characteristics of model and prototype are presented in Tables 1 to 7.
The equivalent model pipe insulation was half as thick as,and five times more thermally conductive than,that of the prototype.The model will predict ex‐tra thaw penetration around the pipe.
The centrifuge test duration from reaching the target acceleration to spin-down was approximately 35.5 h,which included 20 thermal cycles of the oil pipeline and the surrounding thermosyphons.Each cycle expe‐rienced 104 minutes and simulated one-year operation of the pipeline.Warming of the oil pipes and cooling of thermosyphons began one hour 20 minutes after the test started and all the equipment was checked.
Temperature profiles below pipe,settlement data of the pipe and the ground adjacent to the pipe,stress distribution of the pipeline,pore water pres‐sure in the thawed bulb,computerized axial tomogra‐phy (CAT) scan images to understand the extent of thaw (post-test),photos and water content profile(post-test) can be obtained through various measure‐ments and tests to investigate sandbag performance during the thawing season (when the thermosyphon is shut off and does not work)and thermosyphon per‐formance during the freezing season (i.e.,thermal impact distance of the thermosyphon and its effect to permafrost).
2.2 Test specifications
Due to unavailability of in-situ soil,a substitute was selected based on soil information in the perma‐frost territory,dominantly peaty clayey silt (Table 1).The strength and compressibility characteristics of the thawed soil were based on the plasticity index correla‐tions developed by Nakaseet al.(1988).A soil con‐sisting of 50% silt and 50% kaolin clay,labeled"50%S+50%K",was used for this test.The 14.9%plas‐ticity index,Ip of this mix,was similar to the 17.9% of the natural material,as presented in Table 1.
The initial water content for the frozen model soil was selected to obtain a similar degree of thaw strain as the natural soil(Luscher and Afisi,1973).The natu‐ral soil has a water content of 70% above its liquid limit (Table 1).The 50%S−50%K mix was therefore prepared at 59% to match this additional water con‐tent,which had a specific gravity of 2.65.Figure 2 presents the gradation curve for the 50%S+50%K and other mix proportions.
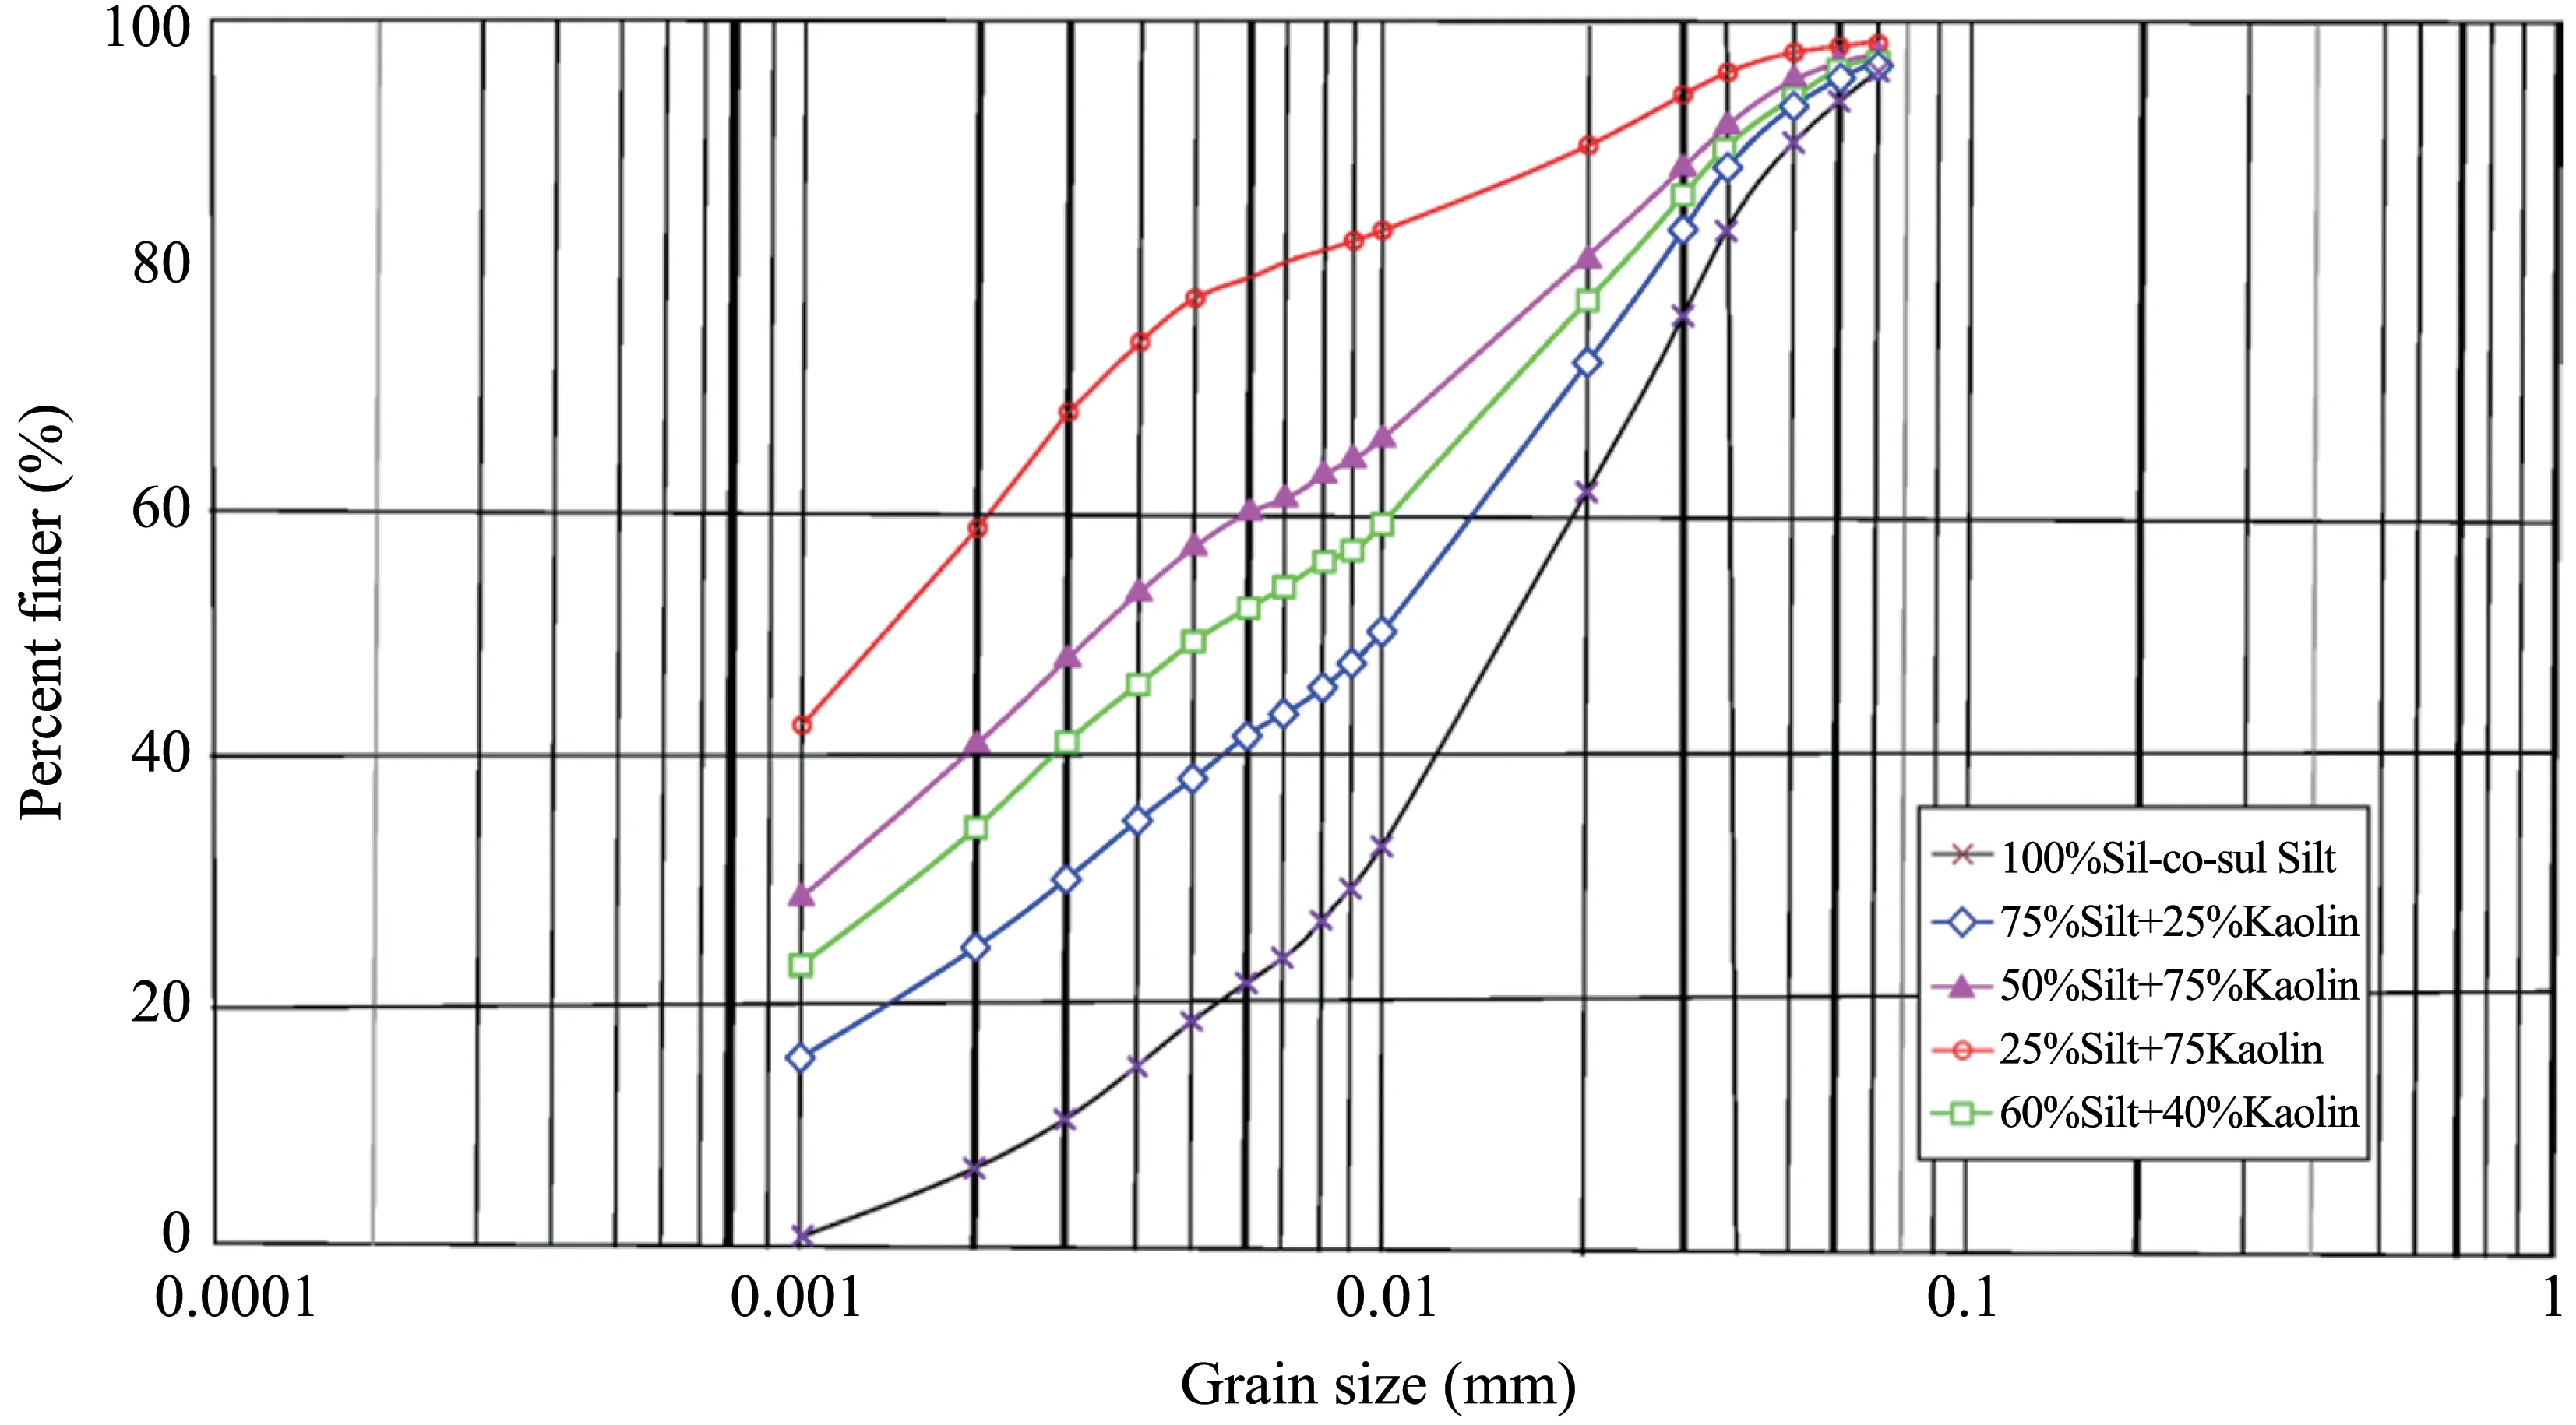
Figure 2 Artificial soil grading curve
Oil temperature was also adjusted to model condi‐tions,and varies continuously in field conditions.The average monthly values are presented in Table 4.Since the scaling law for diffusion time is the g-level squared,N2,the duration of one month at 73 g is equiv‐alent to eight minutes.However,a minimum of 20 min‐utes is required to change the model pipe oil tempera‐ture under a well-controlled condition.Therefore,to best control the thermal regime of the pipe,the oil tem‐perature was averaged for two seasons within one year.During the 43 minute "cold" season the oil tempera‐ture is+2 ℃and during the 61 minute"warm"season the oil temperature is+7 ℃as presented in Table 4.
The dimensions of thermosyphon models are scaled to 73g level as presented in Table 5.The thermal perfor‐mance of thermosyphons was controlled through a heat flow parameter.The scaling law for heat flow isN.Therefore,the model heat flow required was 1 watt(72.4 watts/73).The refrigerator capacity,scaling byN3,during the cold season is 2,444 J (950.6 MJ/73).The heat flow over time of the cold season is then calculated to be 1.16 W (2,444 J/35×60 s) which is in reasonable correlation with 1 W of model flow heat parameter in Table 5.Thus,the thermosyphons were controlled by providing the heat flow of 1 W during 35 minutes and 0 W during 69 minutes as presented in Table 6.
Air temperature and duration of the "winter" and"summer"seasons are provided in Table 6.The winter season is defined by negative air temperatures and ac‐tive thermosyphons (1 W),whereas the summer sea‐son is defined by positive air temperatures and pas‐sive thermosyphons(0 W).
The model of sandbag support was made of satu‐rated frozen sand.The shape of model support was a uniform cube rather than a trapezoidal.The dimen‐sions of prototype and model sandbag support are pre‐sented in Table 7.
2.3 Soil preparation
The following general procedure was followed for the 50%S+50%K model soil preparation.
The silt and kaolin clay were mixed at a water content of 59%.The slurry was prepared in an indus‐trial mixer under vacuum.
The inner test containment box was fitted with components needed to complete the testing require‐ments.A cooling base coil was installed at the bottom of the inner box to maintain the soil bed in a frozen condition during the test.If required,cooling glycol could be circulated through this coil to cool the soil sample.Sand was placed over the base coil,tamped and leveled.An extrusion plate was placed on top of the sand.This plate would be used after the test to al‐low the sample to be lifted from the inner box.A plas‐tic wrap was placed between the extrusion plate and the sand layer to prevent adfreezing.Two insulation plates of two-inch-thick Styrofoam were attached to both sides of the inner box to insulate the soil from the centrifuge and reduce the required soil quantity.A thin wooden plate was installed along the centerline of the inner box forming the two test beds for the two pipes.The two volumes inside the inner box were sealed with plastic wrap to contain the soil slurry.
One layer of 15-mm-thick slurry was placed in the box,leveled and frozen.After freezing,a new layer of slurry was placed and the procedure was repeated.Nine layers of slurry were frozen resulting in a soil block thickness of 133 mm.A trench was formed in each of two soil blocks using a wooden stick that was removed after the freezing process.The dimensions of the trench were 70 mm deep,25 mm wide and 800 mm long.Temperature observations below the pipes were carried out using Resistance Temperature Detectors (RTD).The RTD stack was formed by placing and freezing the RTDs inside a mold,there‐by controlling the location of the sensors to each oth‐er and to the ends of the stack.The stack was placed in a drilled hole at the bottom of the trench and slur‐ry was used to freeze the stack in place.The loca‐tions of RTDs were confirmed with the designed di‐mensions.The Pore Pressure Transducer (PPT) was placed at the pipe A (unsupported pipe) invert.The ceramic filter was saturated with glycol to prevent it from freezing.The gap between the PPT and filter was also filled with glycol.A linear variable differen‐tial transformer (LVDT) was mounted on a bearing plate on top of the soil to measure deformation of the soil block throughout the test.For the pipe settle‐ment measurement,small plastic pipes were used to offer a conduit through the soil for the LVDT rods to pass through and rest on top of the model pipe.These LVDTs measured pipe settlement throughout the test.All sensors have been calibrated before use,and their measuring range and precision have pre‐sented C-CORE(2004).
Sandbags were installed into the holes in the soil bed at designed locations.Gaps between the frozen soil and the sandbags were filled with slurry and frozen.
2.4 Thermal control of test
The model soil was placed in an insulated alumi‐num rectangular box with inner dimensions of 980 mm by 725 mm (Figure 3).This soil box was placed in a strongbox with 50 mm or two-inch insulation between the two boxes to minimize heat transfer between the model and outside environment.An insulated lid and the refrigeration coil were mounted on top of the strongbox.
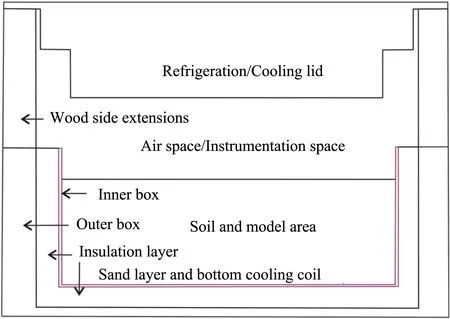
Figure 3 General cross section of centrifuge package
To enable refrigeration of experiments,the C-CORE centrifuge was equipped with a refrigeration unit that circulates glycol from the refrigeration unit in the centri‐fuge motor pit,through the centrifuge rotary joint and into the experiment box.A heat exchanger (refrigera‐tion coil) was mounted on top of the test package to simulate the black sky effect in the model.The black sky effect is a smooth uniform heat-transferring surface that promotes even heat transfer and consistent thermal flow throughout the free-air model height.The air tem‐perature within the insulated test package was con‐trolled by varying the temperature and/or volume flow rate of the liquid refrigerant through the heat exchanger.
The base refrigeration coil was installed in the in‐ner box buried in the sand layer.The coil kept the sand layer frozen through the test.The sand layer tempera‐ture was controlled like air temperature adjustment.
Oil in the pipes was warmed using a wire heater.The heater was placed in the pipe along the entire length.A control RTD was also installed in the pipe so that it could monitor the oil temperature directly.The heater was controlled by an electric supply by ad‐justing the electric current to achieve the required oil temperature.The data acquisition system provided instant monitoring of the test data,including the oil temperature.
Thermosyphons were modeled using a 12.7 mm diameter brass rod attached to a copper pipe (Figure 4).Glycol was pumped through the pipe to speed up heat transfer through the brass rod (thermosyphon),out of the soil and into the glycol.During the periods of time that the thermosyphons were scheduled to be turned off,the flow of glycol to the thermosyphon pipes was stopped.The brass rod was reduced in cross-section in part of its length.This reduction re‐sulted in the correct cross-sectional area of the rod for heat transfer rates required for this test and allowed for more accurate thermosyphon control.Keeping the larger cross section in the soil allowed for a larger ar‐ea for heat to transfer into the rod from the soil.
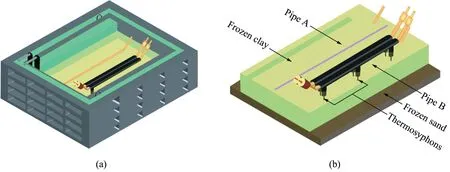
Figure 4 Strong box and inside layout of pipes and thermosyphons:(a)whole view,(b)inside layout
The thermosyphon was required to produce a pre‐scribed amount of heat flow within a prescribed peri‐od of time.Two RTDs were mounted to the thermosy‐phon so that the heat flow could be calculated.The heat flow was controlled by varying the temperature and/or volume flow rate of the liquid refrigerant through the heat exchanger.The data acquisition sys‐tem provided instant monitoring of the test data,par‐ticularly the heat flow function,which allowed adjust‐ments of temperature and/or volume flow rate of the liquid refrigerant to achieve the required thermosy‐phon performance.
2.5 Pipe models
Two stainless steel pipes with the dimensions and properties listed in Table 2 were used in the test.The bending strains in the model pipe were measured at eight locations for the pipe buried with thermosyph‐ons.The strain gages (SGs) were wired in a full Wheatstone bridge bending configuration.These gag‐es were calibrated pre-test using calibrated weights hung from the pipe at two locations.Strains were cal‐culated using the loads applied and the dimensions of the setup and calibration factors (strain/volt) were de‐termined(Phillipset al.,2002).
3 Centrifuge test
3.1 Instrumentation
Instrumentations were used in the test with loca‐tions presented in Figures 5 to 8.Instrumentations used included SGs,LVDTs,PPT and RTDs.The ini‐tial depths of RTD's are presented in Figures 5,7 and 8.The post-test locations changed due to settle‐ment and were determined using CAT Scan images.The RTDs below the pipe were placed into a frozen soil cylinder prior to installation to allow even and controllable spacing.
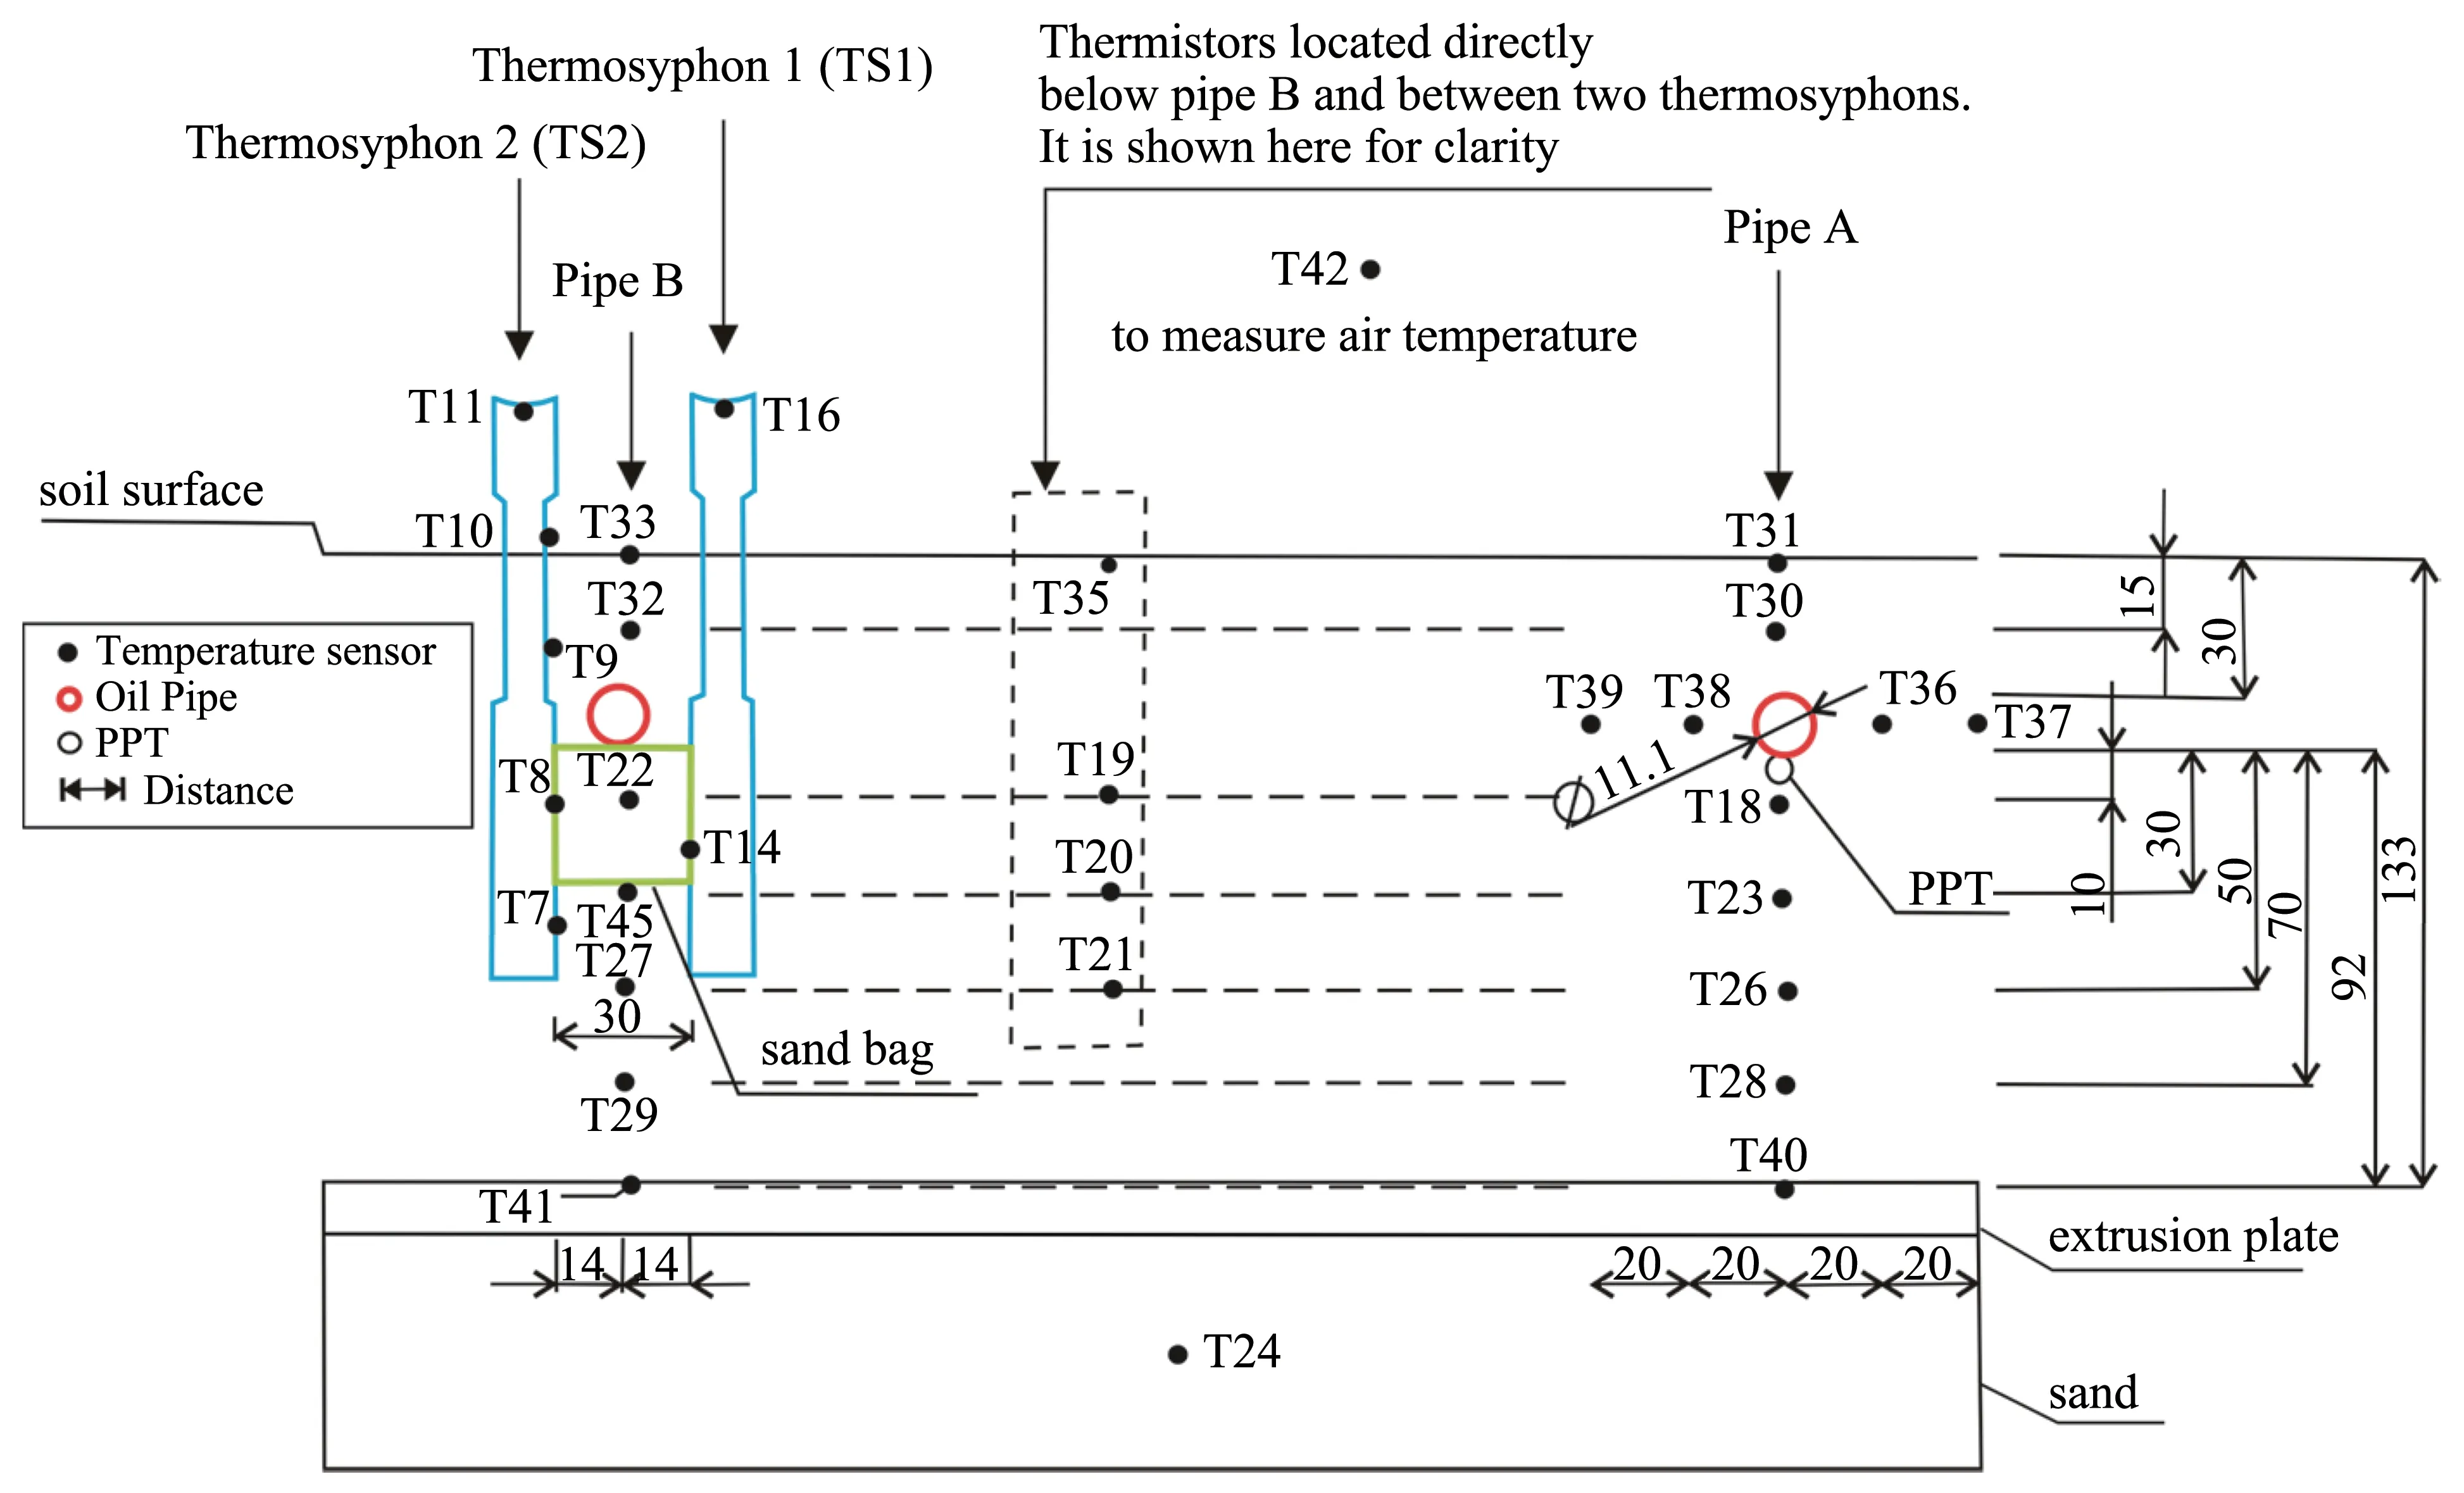
Figure 5 Cross section through pipes A and B center(unit:mm)
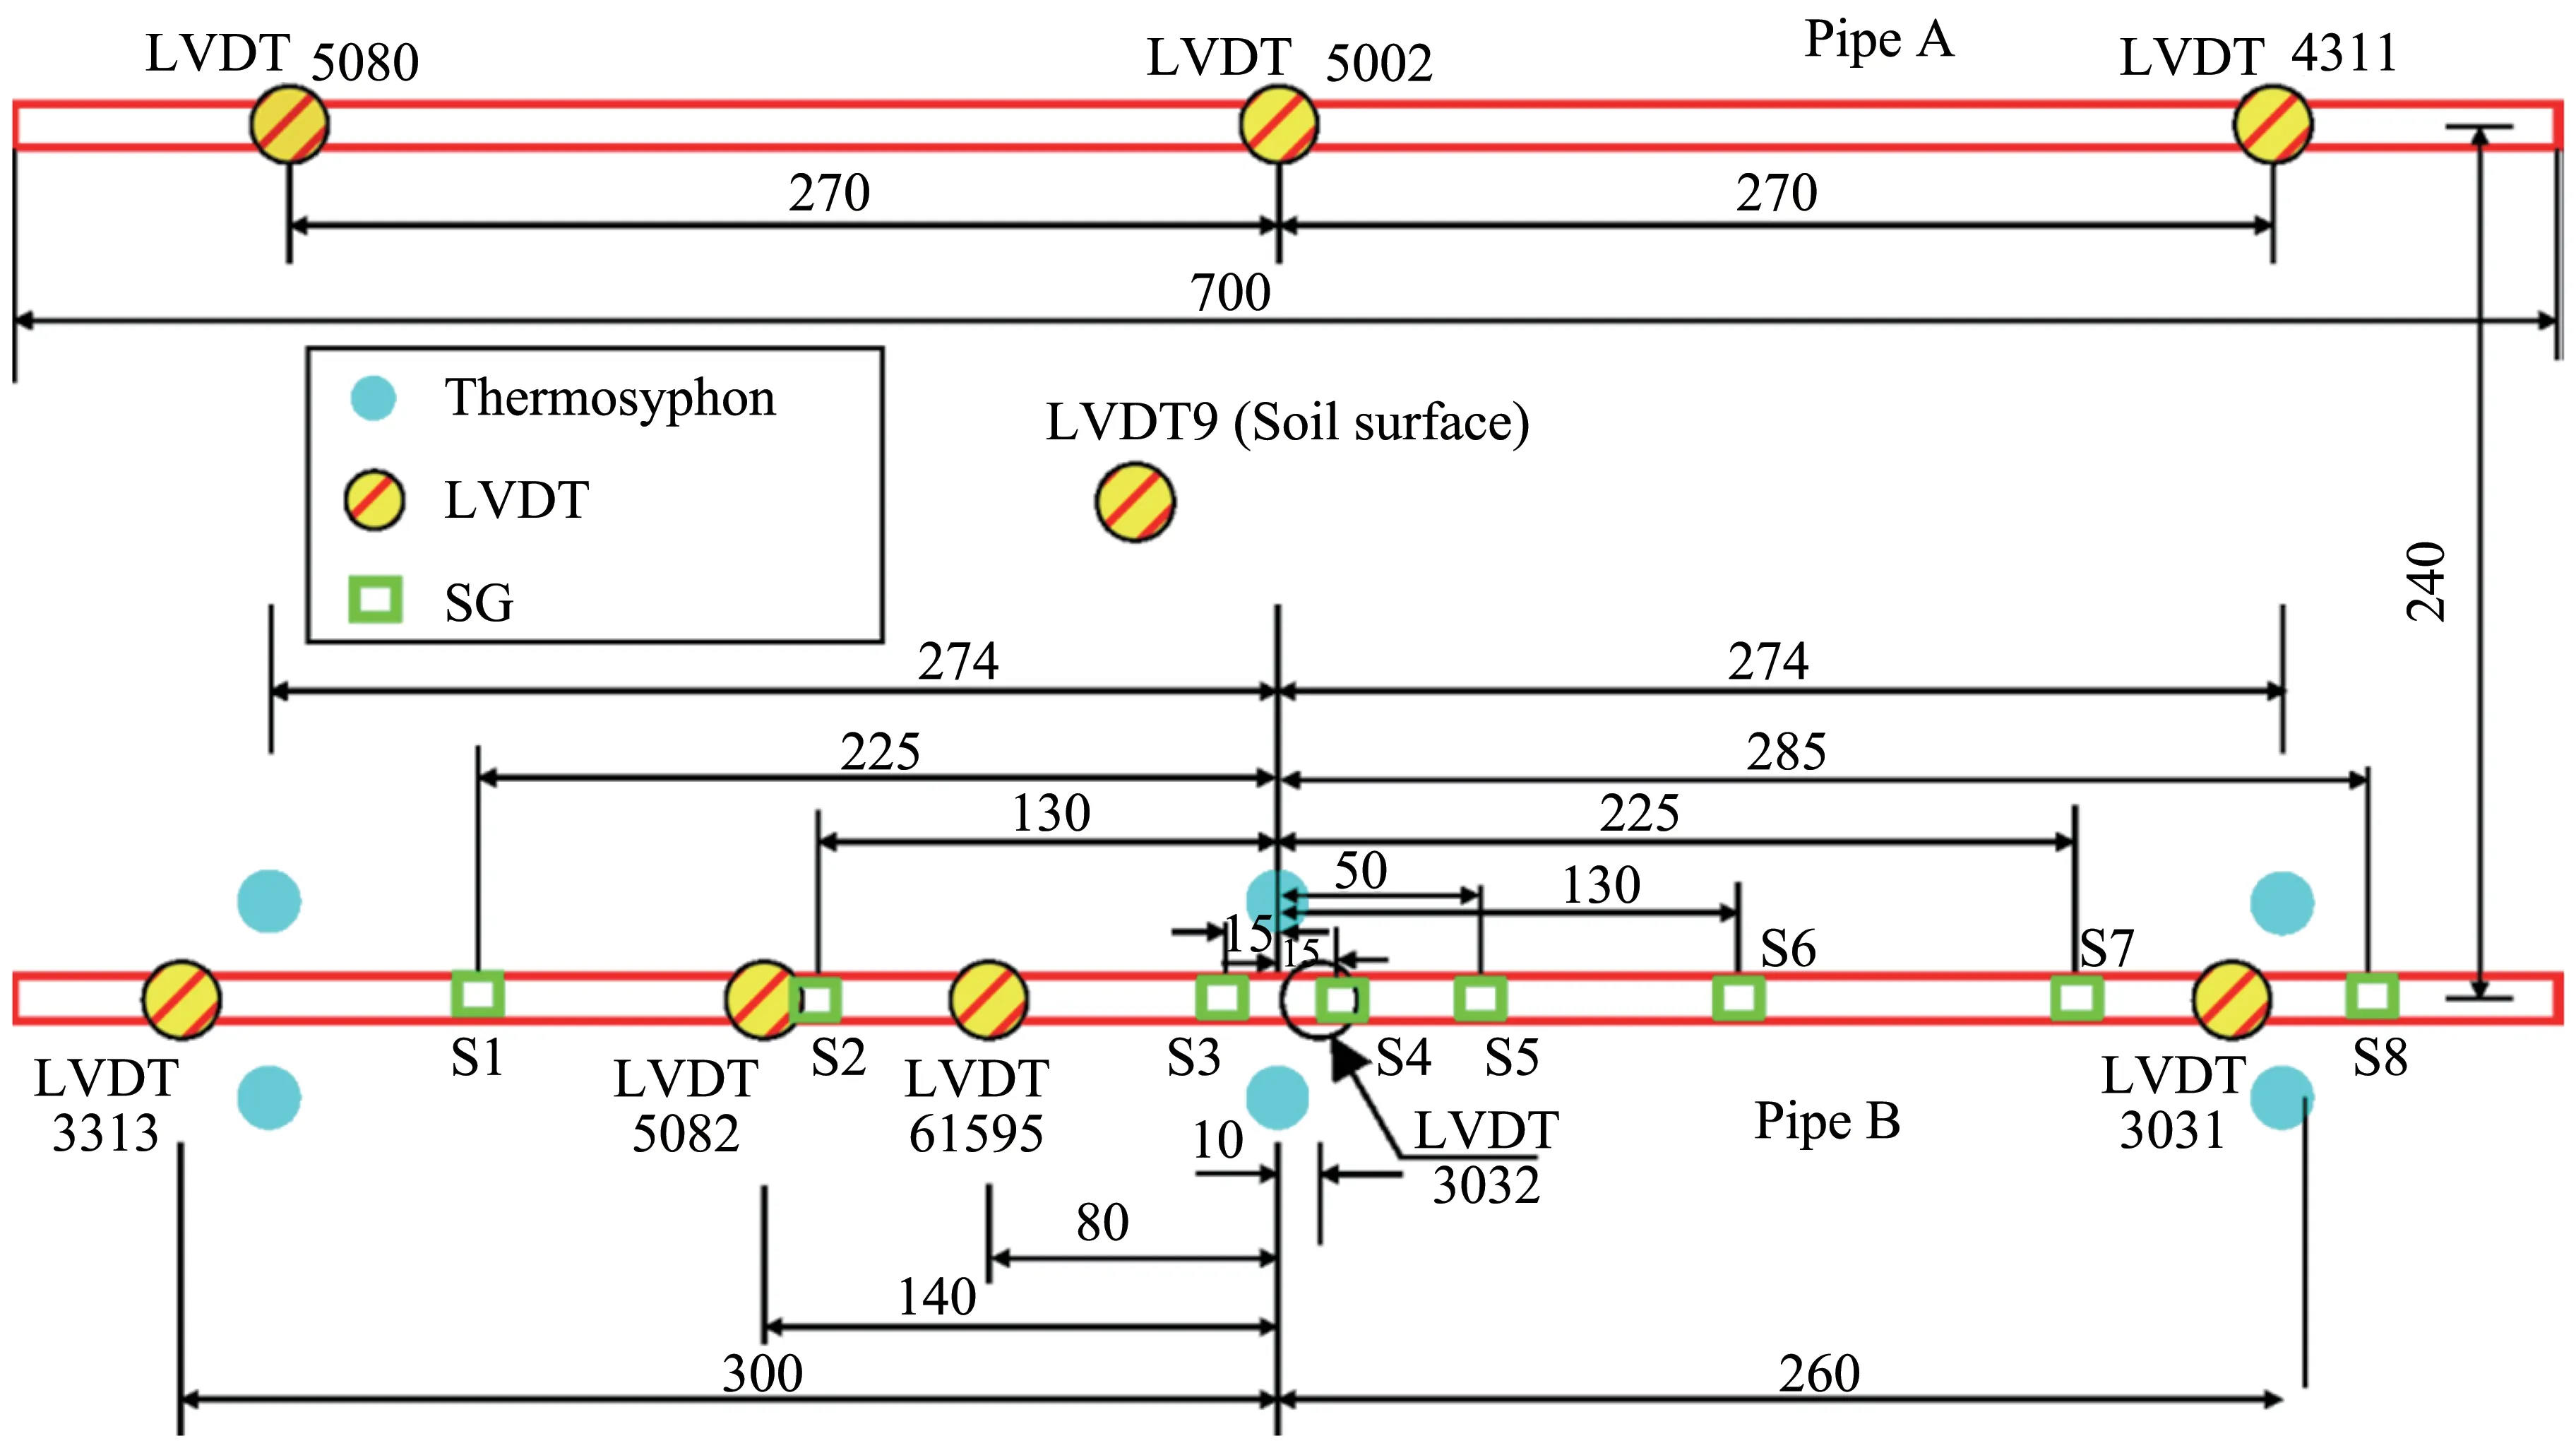
Figure 6 Plan view of experiment setup(unit:mm)
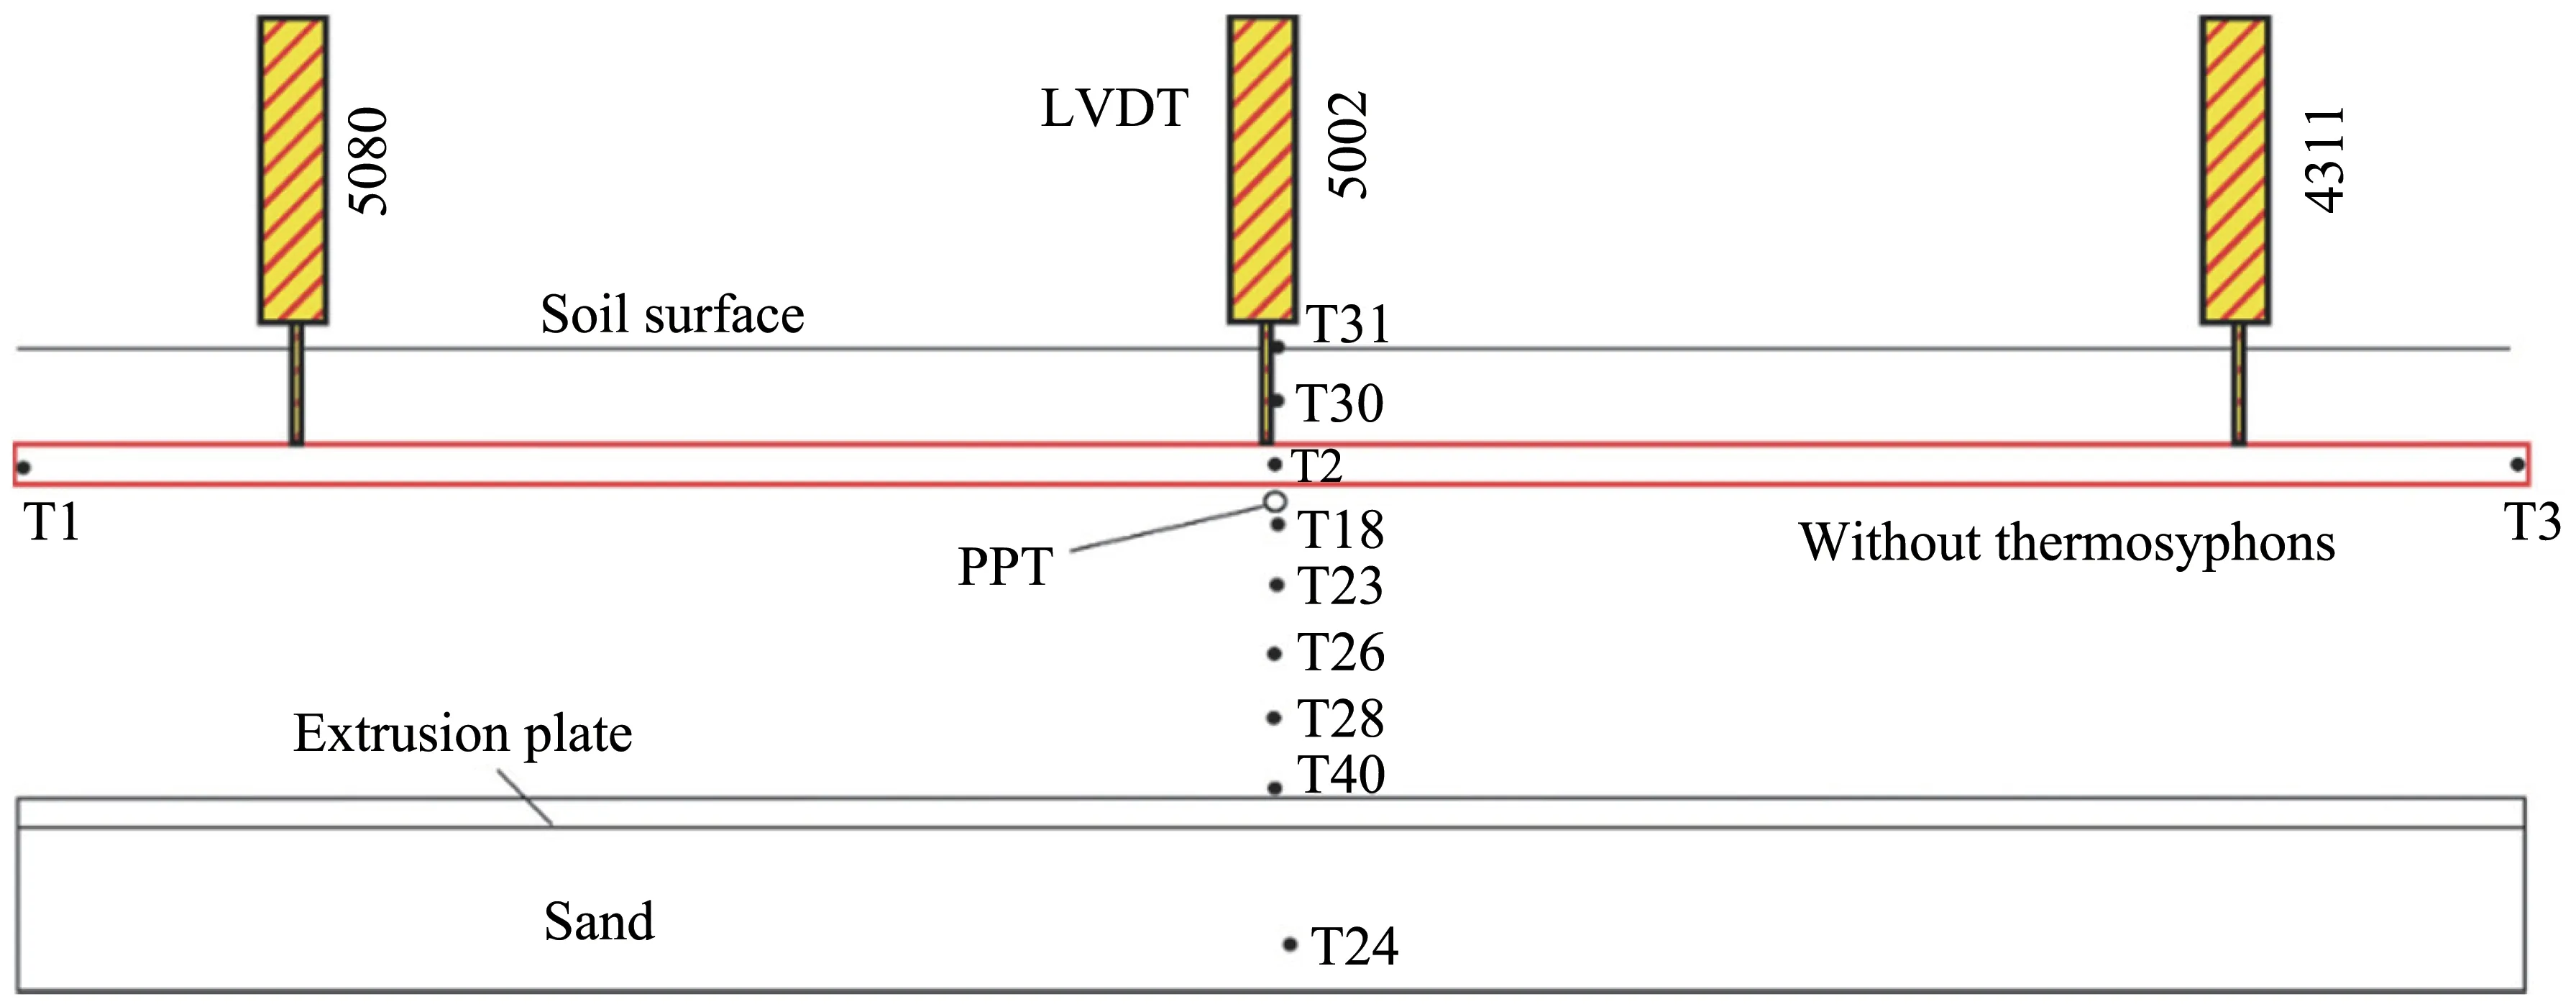
Figure 7 Experiment long section for pipe A
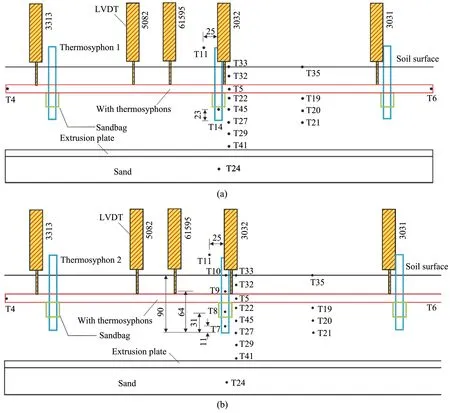
Figure 8 Experiment long section for pipe B(unit:mm).(a)Thermosyphon 1 section,(b)Thermosyphon 2 section
3.2 Test data
The test was successful.Test conditions were well controlled and all the test data,such as temperature,pipe settlement,pore pressure and strains,were re‐corded and stored by the data acquisition system as planned,then were processed using Matlab for facili‐tating plotting the results.
3.2.1 Temperature
Figures 9 to 18 below contain temperature data for the test.In the following figures,the zero location of vertical axis is located at pipe bottom.
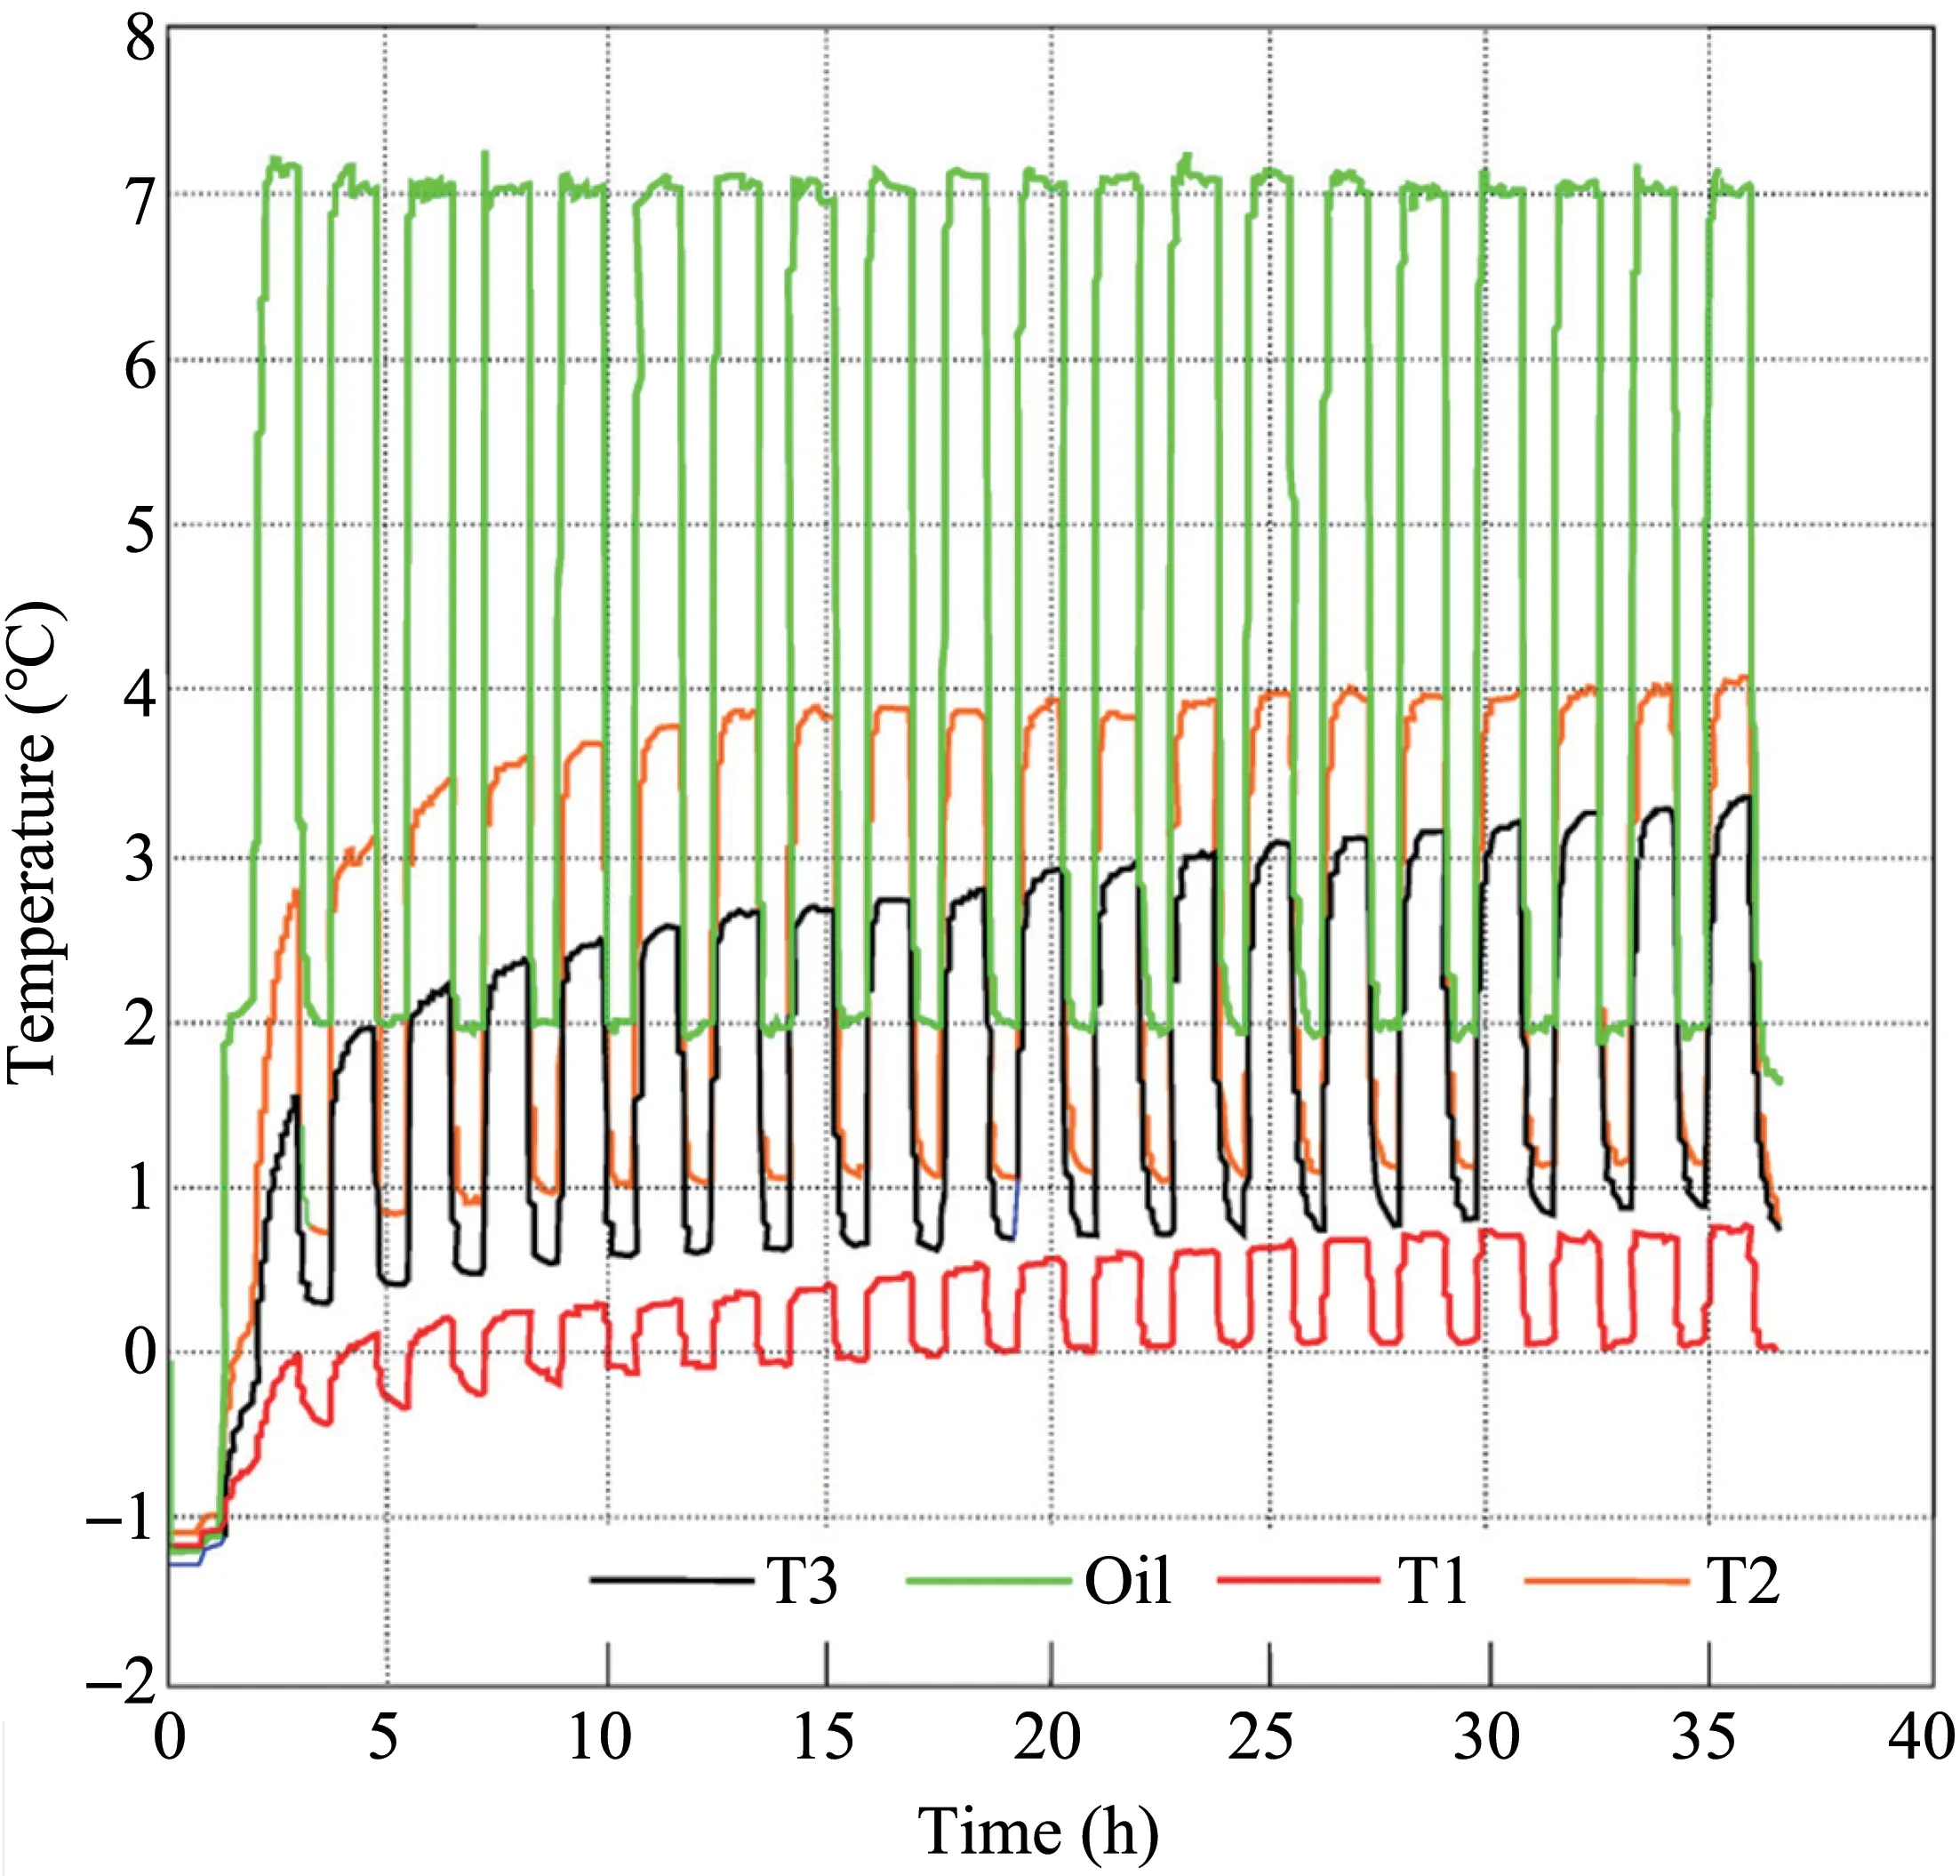
Figure 9 Pipe A temperatures with time
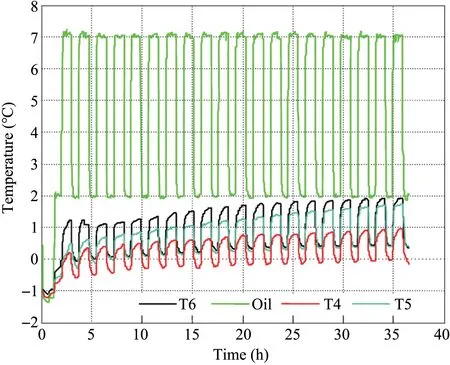
Figure 10 Pipe B temperatures with time
The temperature data with time for the RTDs attached to pipe A and pipe B are presented in Fig‐ures 9 and 10,respectively.The green line shows the temperature of oil inside the pipes which was main‐tained cyclic at +2 °C or +7 °C during the test.The maintenance of oil temperature was very precise and accurate.The temperature of the pipe wall (T1,T2 and T3) was lower than the oil temperature due to thermal resistance of pipe wall and pipe coating.It varied between −0.5 °C and +4 °C in agreement with oil temperature cycles.
Figures 11 and 12 show temperature data with time for the RTD cables under pipes A and B,respec‐tively.The clay was −1°C at the beginning of the test.The cold glycol was circulated through the base coil to prevent frozen soil from warming.Temperature fluctuations measured by RTDs located at depths of 92 mm and 70 mm under pipes confirm this.Tempera‐ture profiles at 6-hour intervals through the test are presented in Figure 13.
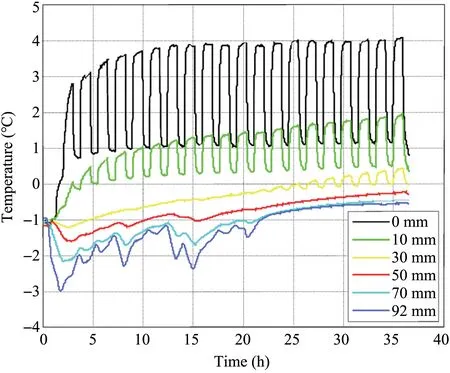
Figure 11 Temperatures below pipe A with time
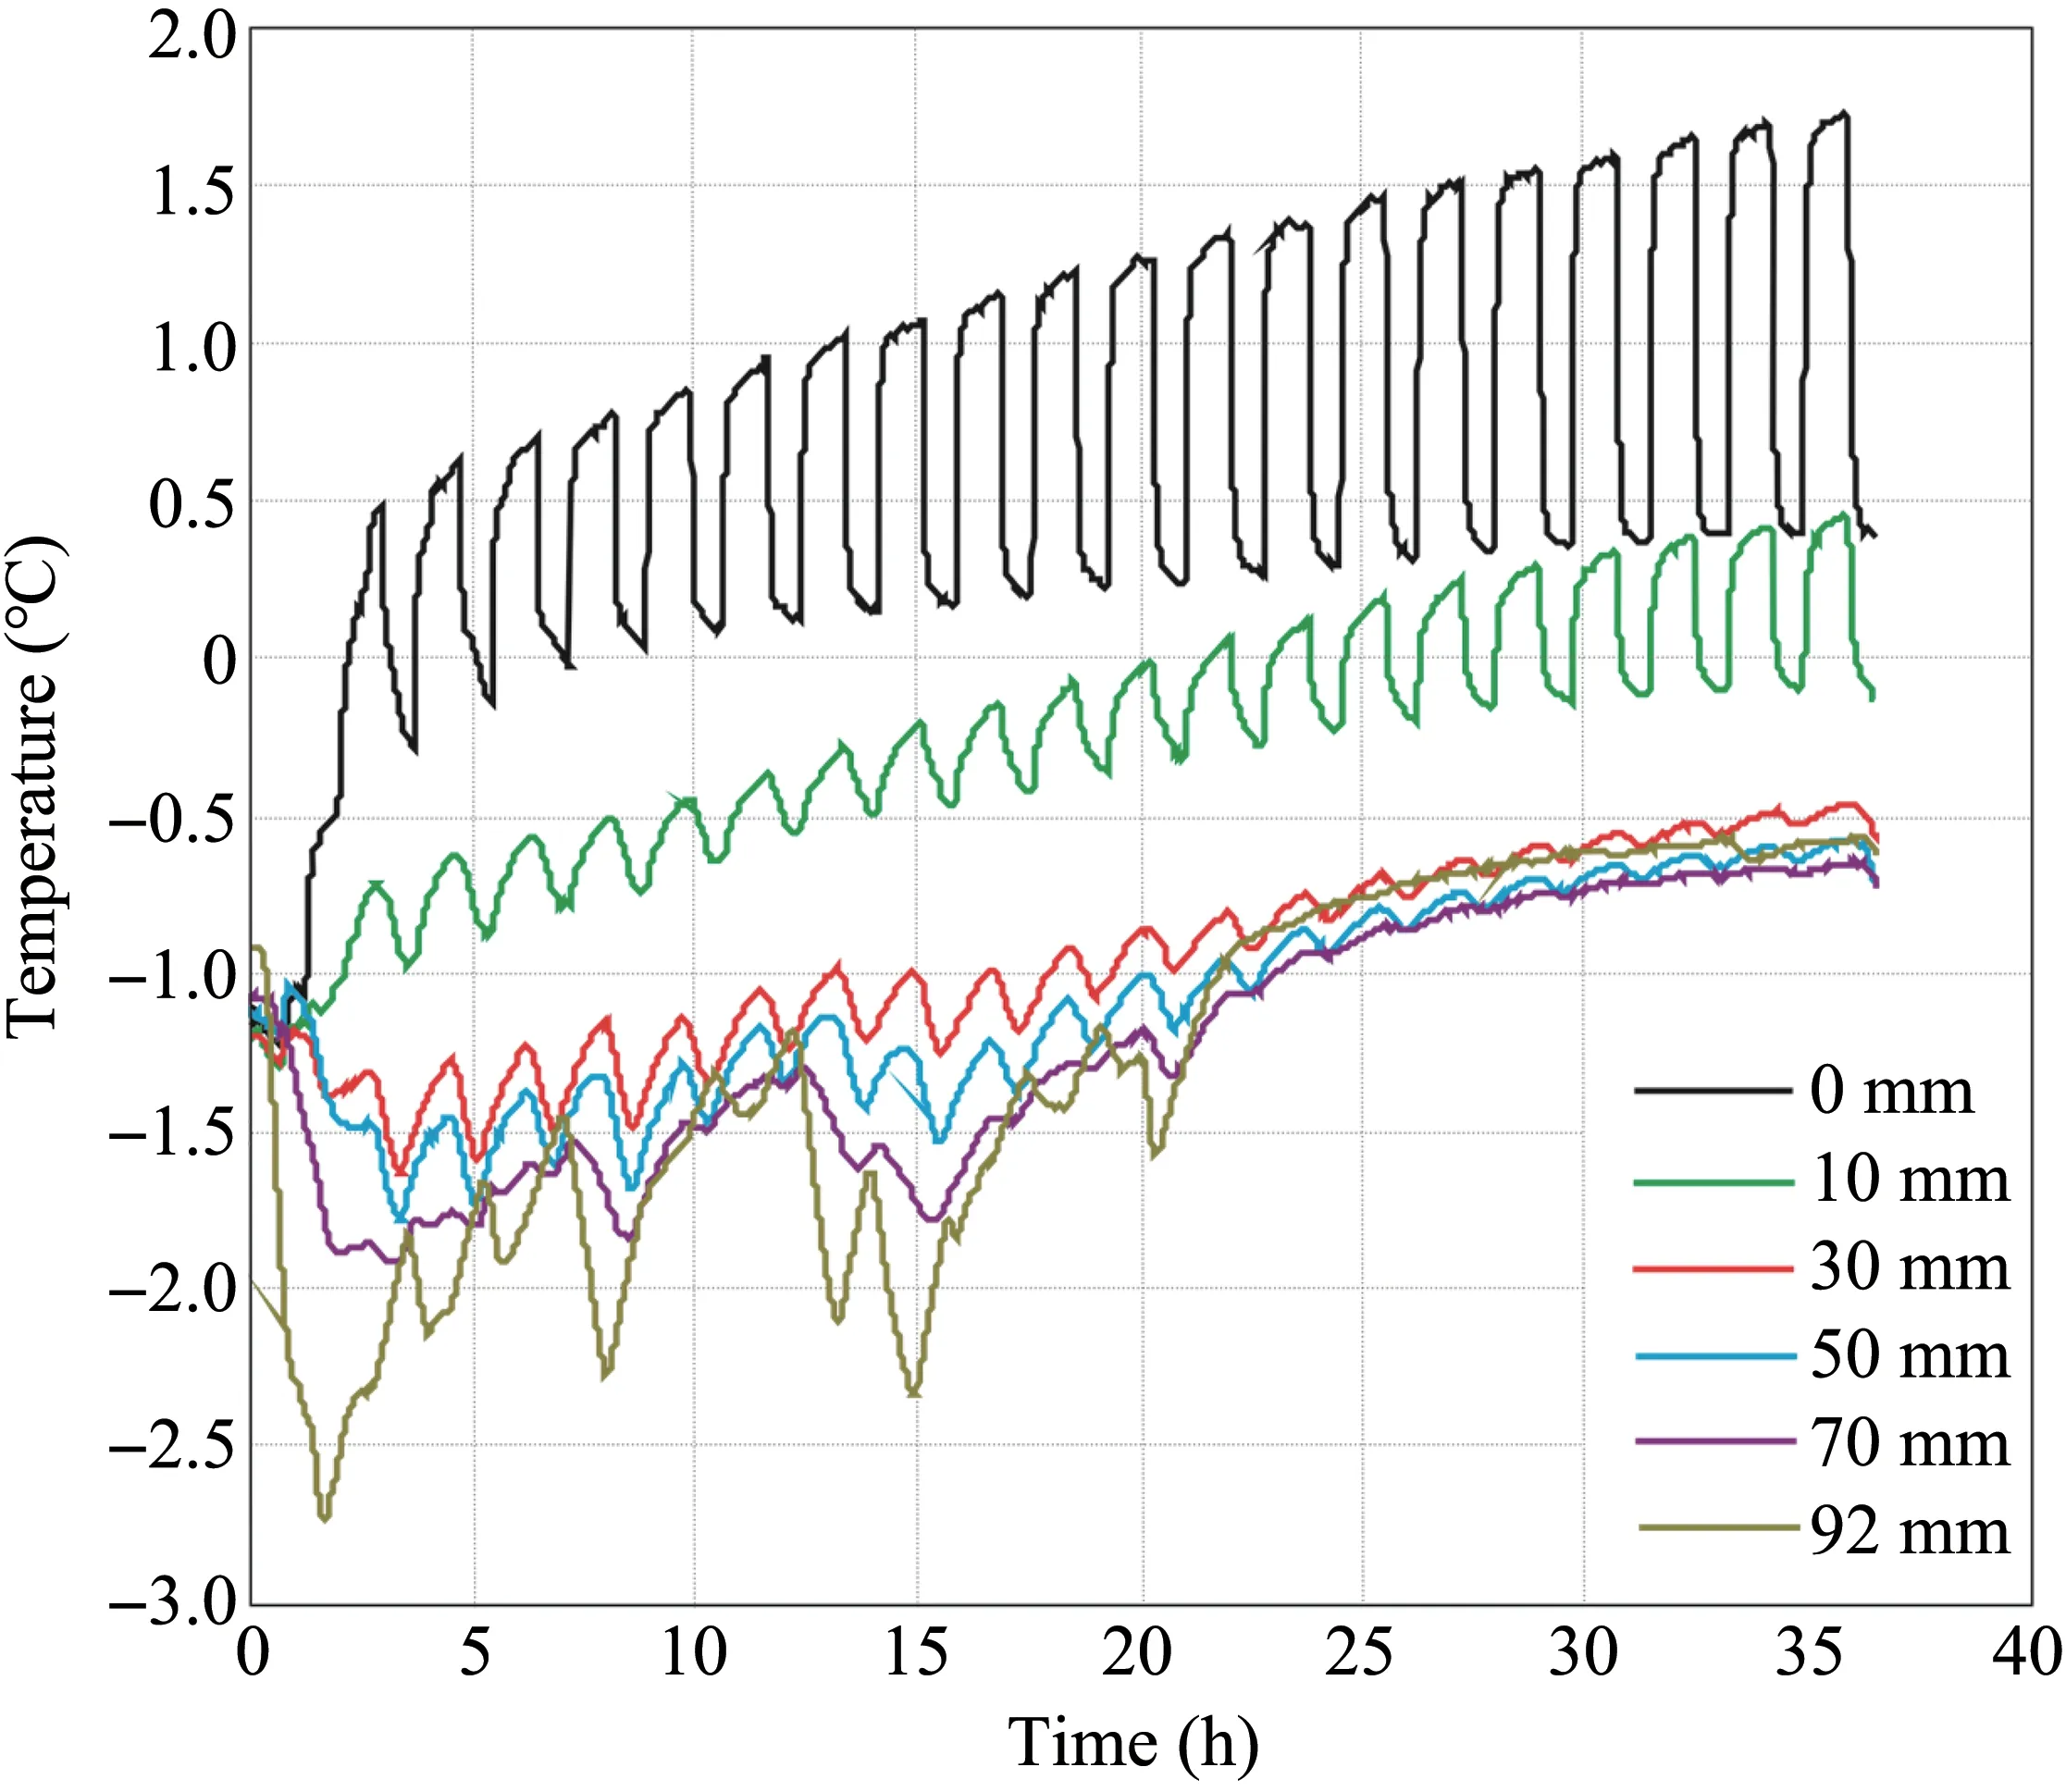
Figure 12 Temperatures below pipe B with time
The RTD located at a depth of 30 mm under pipe A (Figure 11,yellow line) shows that the thaw front passed that RTD at 25 hours.The thaw front performs as a "zero thermal curtain" so temperature fluctua‐tions do not penetrate through the front.From the be‐ginning of the test till 25 hours,temperature fluctua‐tions induced by the pipe thermal regime are not re‐flected in soil temperature below 30 mm.After the thaw front passed the RTD at 30 mm,the soil temper‐ature at 30 mm depth started fluctuating in accor‐dance with the pipeline thermal regime.The RTD lo‐cated 30 mm under pipe B (Figure 12,red line)shows temperature fluctuations through the entire test period possibly caused by the oil temperature regime and thermosyphons.
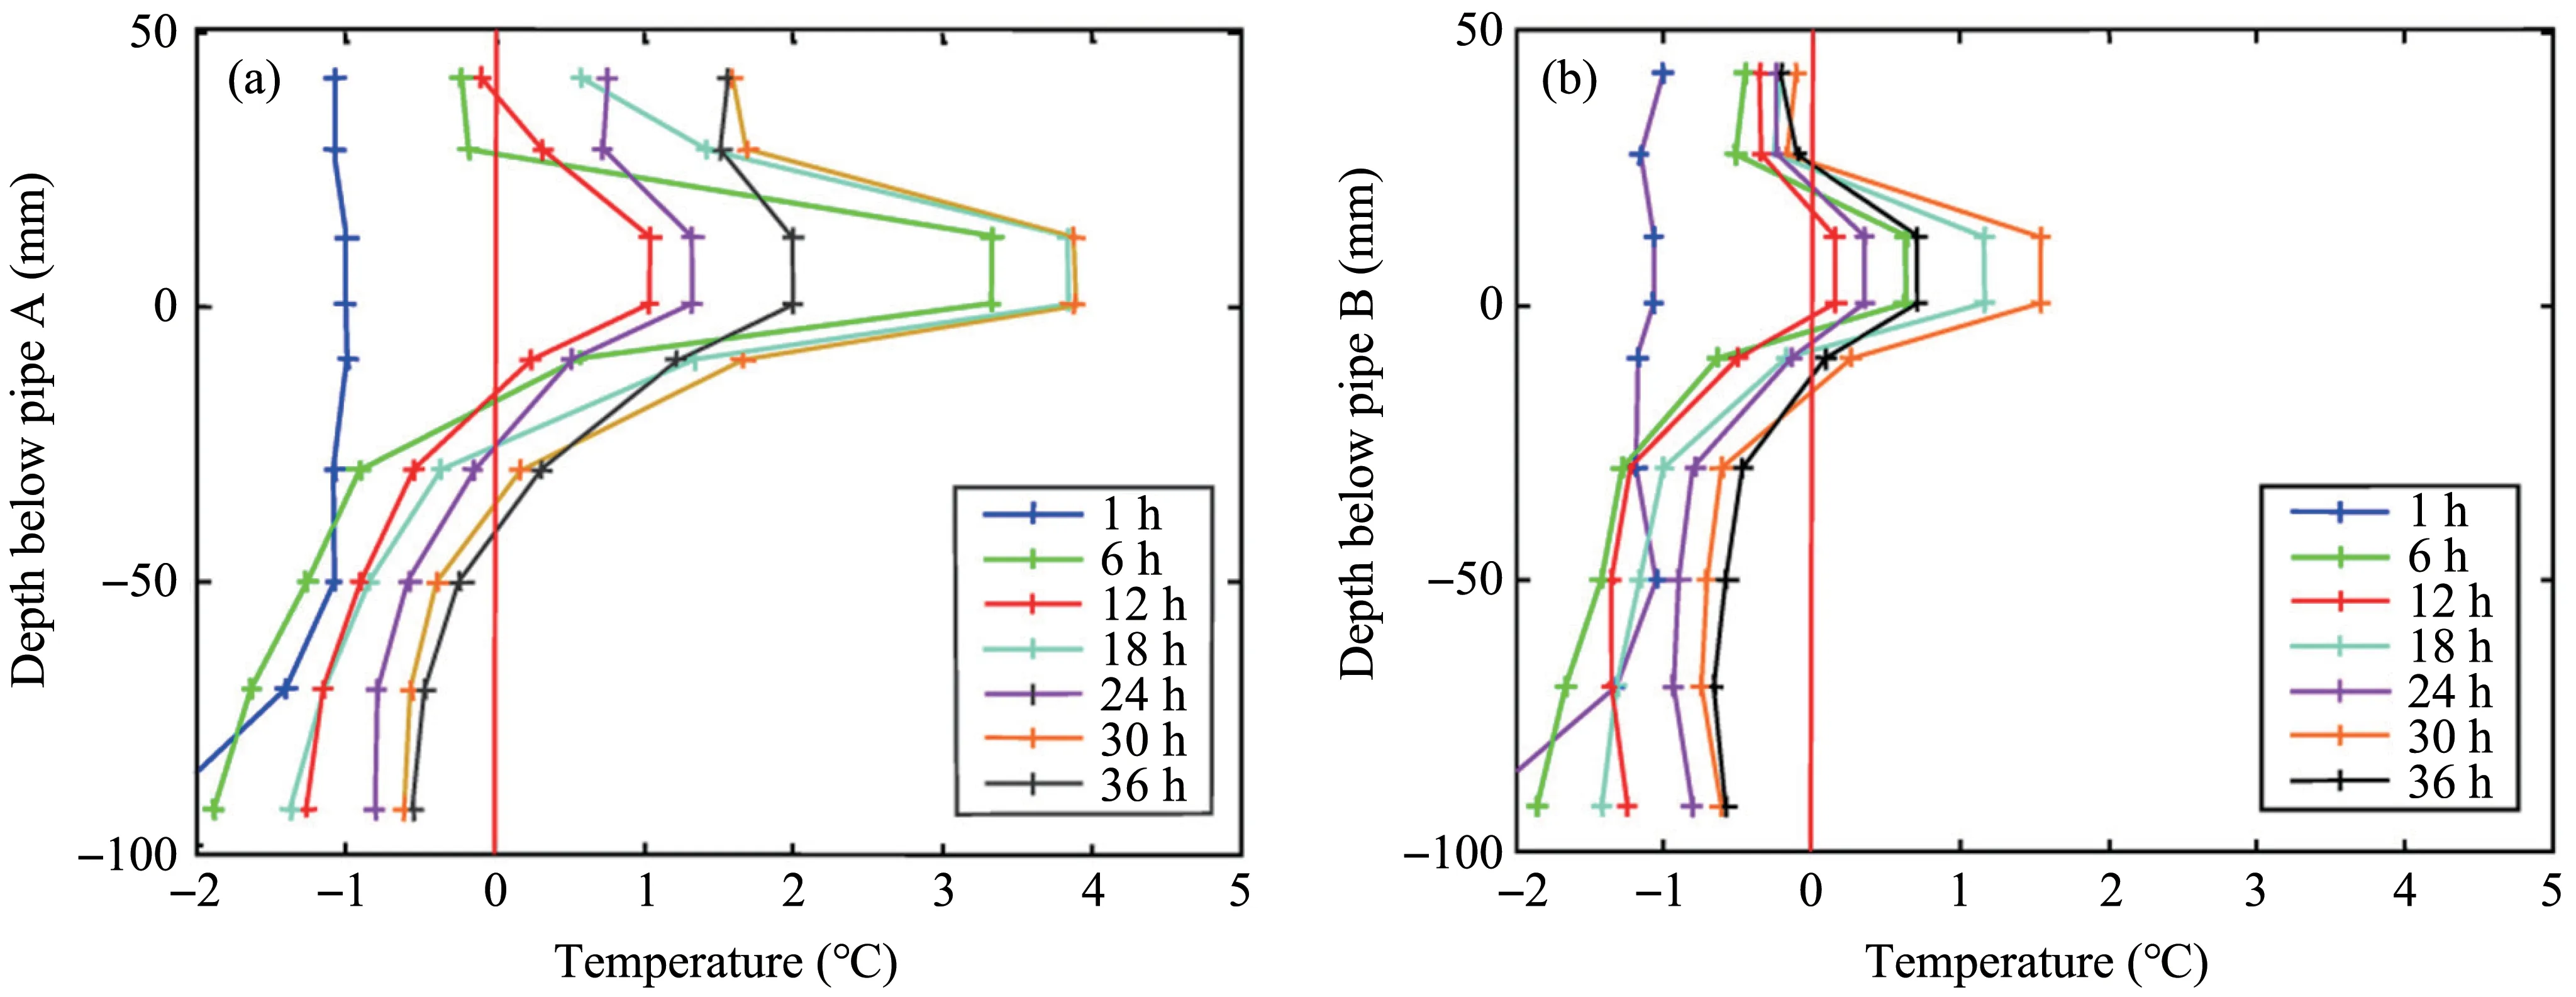
Figure 13 Temperature profiles around pipe:(a)pipe A,(b)pipe B
The thaw front penetration through the test was calculated and is plotted in Figure 14 for both pipes A and B,below the center of the pipe.For pipe B,the thaw front penetration below the mid position was also calculated.The relatively deeper penetra‐tion of the thaw front for pipe A,the maximum of which reaches up to 43 mm,corresponds to the ab‐sence of both sandbag supports and thermosyphon cooling.For pipe B,the maximum of thaw front pen‐etration is only 20 mm.They are also presented in Figure 14.In addition,the thaw front penetrates deeper when it is further from the thermosyphons un‐der pipe B.
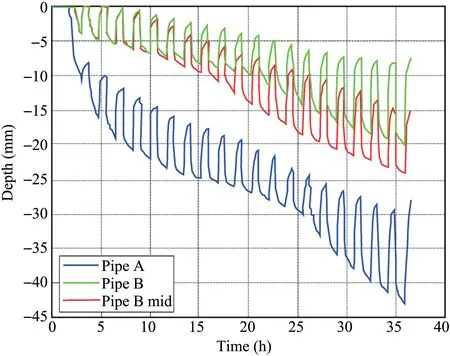
Figure 14 Thaw front penetration,pipe A and B
Figure 15 shows a better correlation of tempera‐ture cycles between thermosyphons and the soil,30 mm below pipe B (green vertical lines).However,temperature cycles between pipe B and the soil,30 mm below it,do not correlate (blue vertical lines).In other words,the temperature regime of the soil 30 mm below pipe B is primarily controlled by thermosy‐phon activity.
Figure 16 shows temperature data with time for the RTDs attached to the thermosyphons.The tem‐perature at the soil-thermosyphon interface (T7,T8 and T14) varied from −3 °C to −0.5 °C.The magnitude of temperature amplitude was 2 °C.The heat flux was monitored through the entire test and the data were recorded (Figure 17).The two tar‐gets for thermosyphon energy exchange,1 watt or 0 watt,had been well realized during the cold and warm seasons,respectively.The thermosyphon performance was controlled by changing the gly‐col temperature and/or flow rate in the cooling system.
Figure 18 shows the temperatures of the soil sur‐face and the air above the ground.Note that the soil surface temperature stayed below 0 °C during the en‐tire test,which prevented frozen soil from thawing.
3.2.2 Measured pipe settlement
The measurements of eight LVDTs on pipes A and B and one on the soil surface are presented in Figure 19,respectively.In Figure 7,LVDTs 5080,5002 and 4311 are located in the left side,center and right side of pipe A,respectively.In Figure 8,LVDTs 3313,3032,3031,5082 and 61595 are located in the left side,center,right side,middle (between LVDT 3313 and 3032),mid middle (between LVDT 5082 and 3032) of pipe B,respectively.LVDT 9,marked as"Soil Surface" on plots,shows the reference level of the soil surface.
3.2.3 Pore pressure measurement
The pore pressure collected from a PPT attached to unsupported pipe A invert is presented in Figure 20.It is not measured under pipe B because sandbags are there and kept frozen by thermosyphons,and the pore pressure is minimal.As can be seen in the plot,PPT in the clay show a general pore pressure increase as the thaw front progresses and the thaw bulb grows,leading to an increase in pressure head (Figure 20a).At the beginning,this head increases to a relative set‐tlement of 3 mm at a similar rate,to that from the hy‐drostatic head (Figure 20b).The rate increases from 3 to 7 mm of settlement indicating excess water pore pressures under the pipe.The rate decreases again to match the hydrostatic gradient from 7 to 10 mm set‐tlement.The water head difference is equivalent to excess pore pressure persisting under the pipe.This excess pressure probably increases downwards to‐wards the "impermeable" thaw front,as an upward seepage gradient is generated to consolidate the thawed material.The excess pore pressure under the pipe also indicates the delay in consolidation of the thawed material,due to the continued advancement of the front.
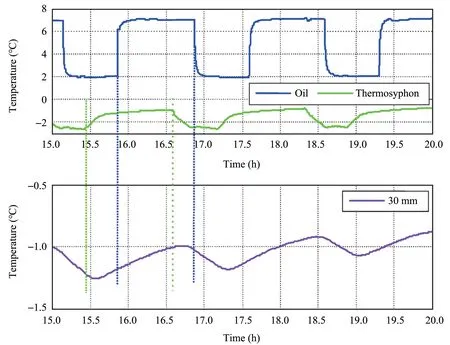
Figure 15 Temperatures of oil,thermosyphon and soil 30 mm below pipe B with time
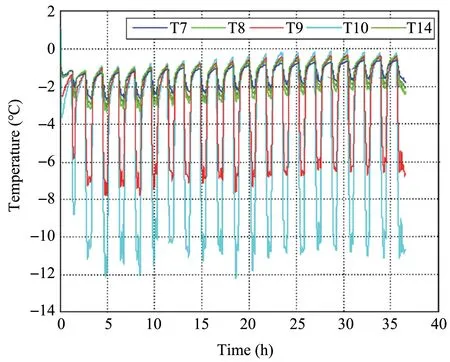
Figure 16 Temperatures of thermosyphons with time
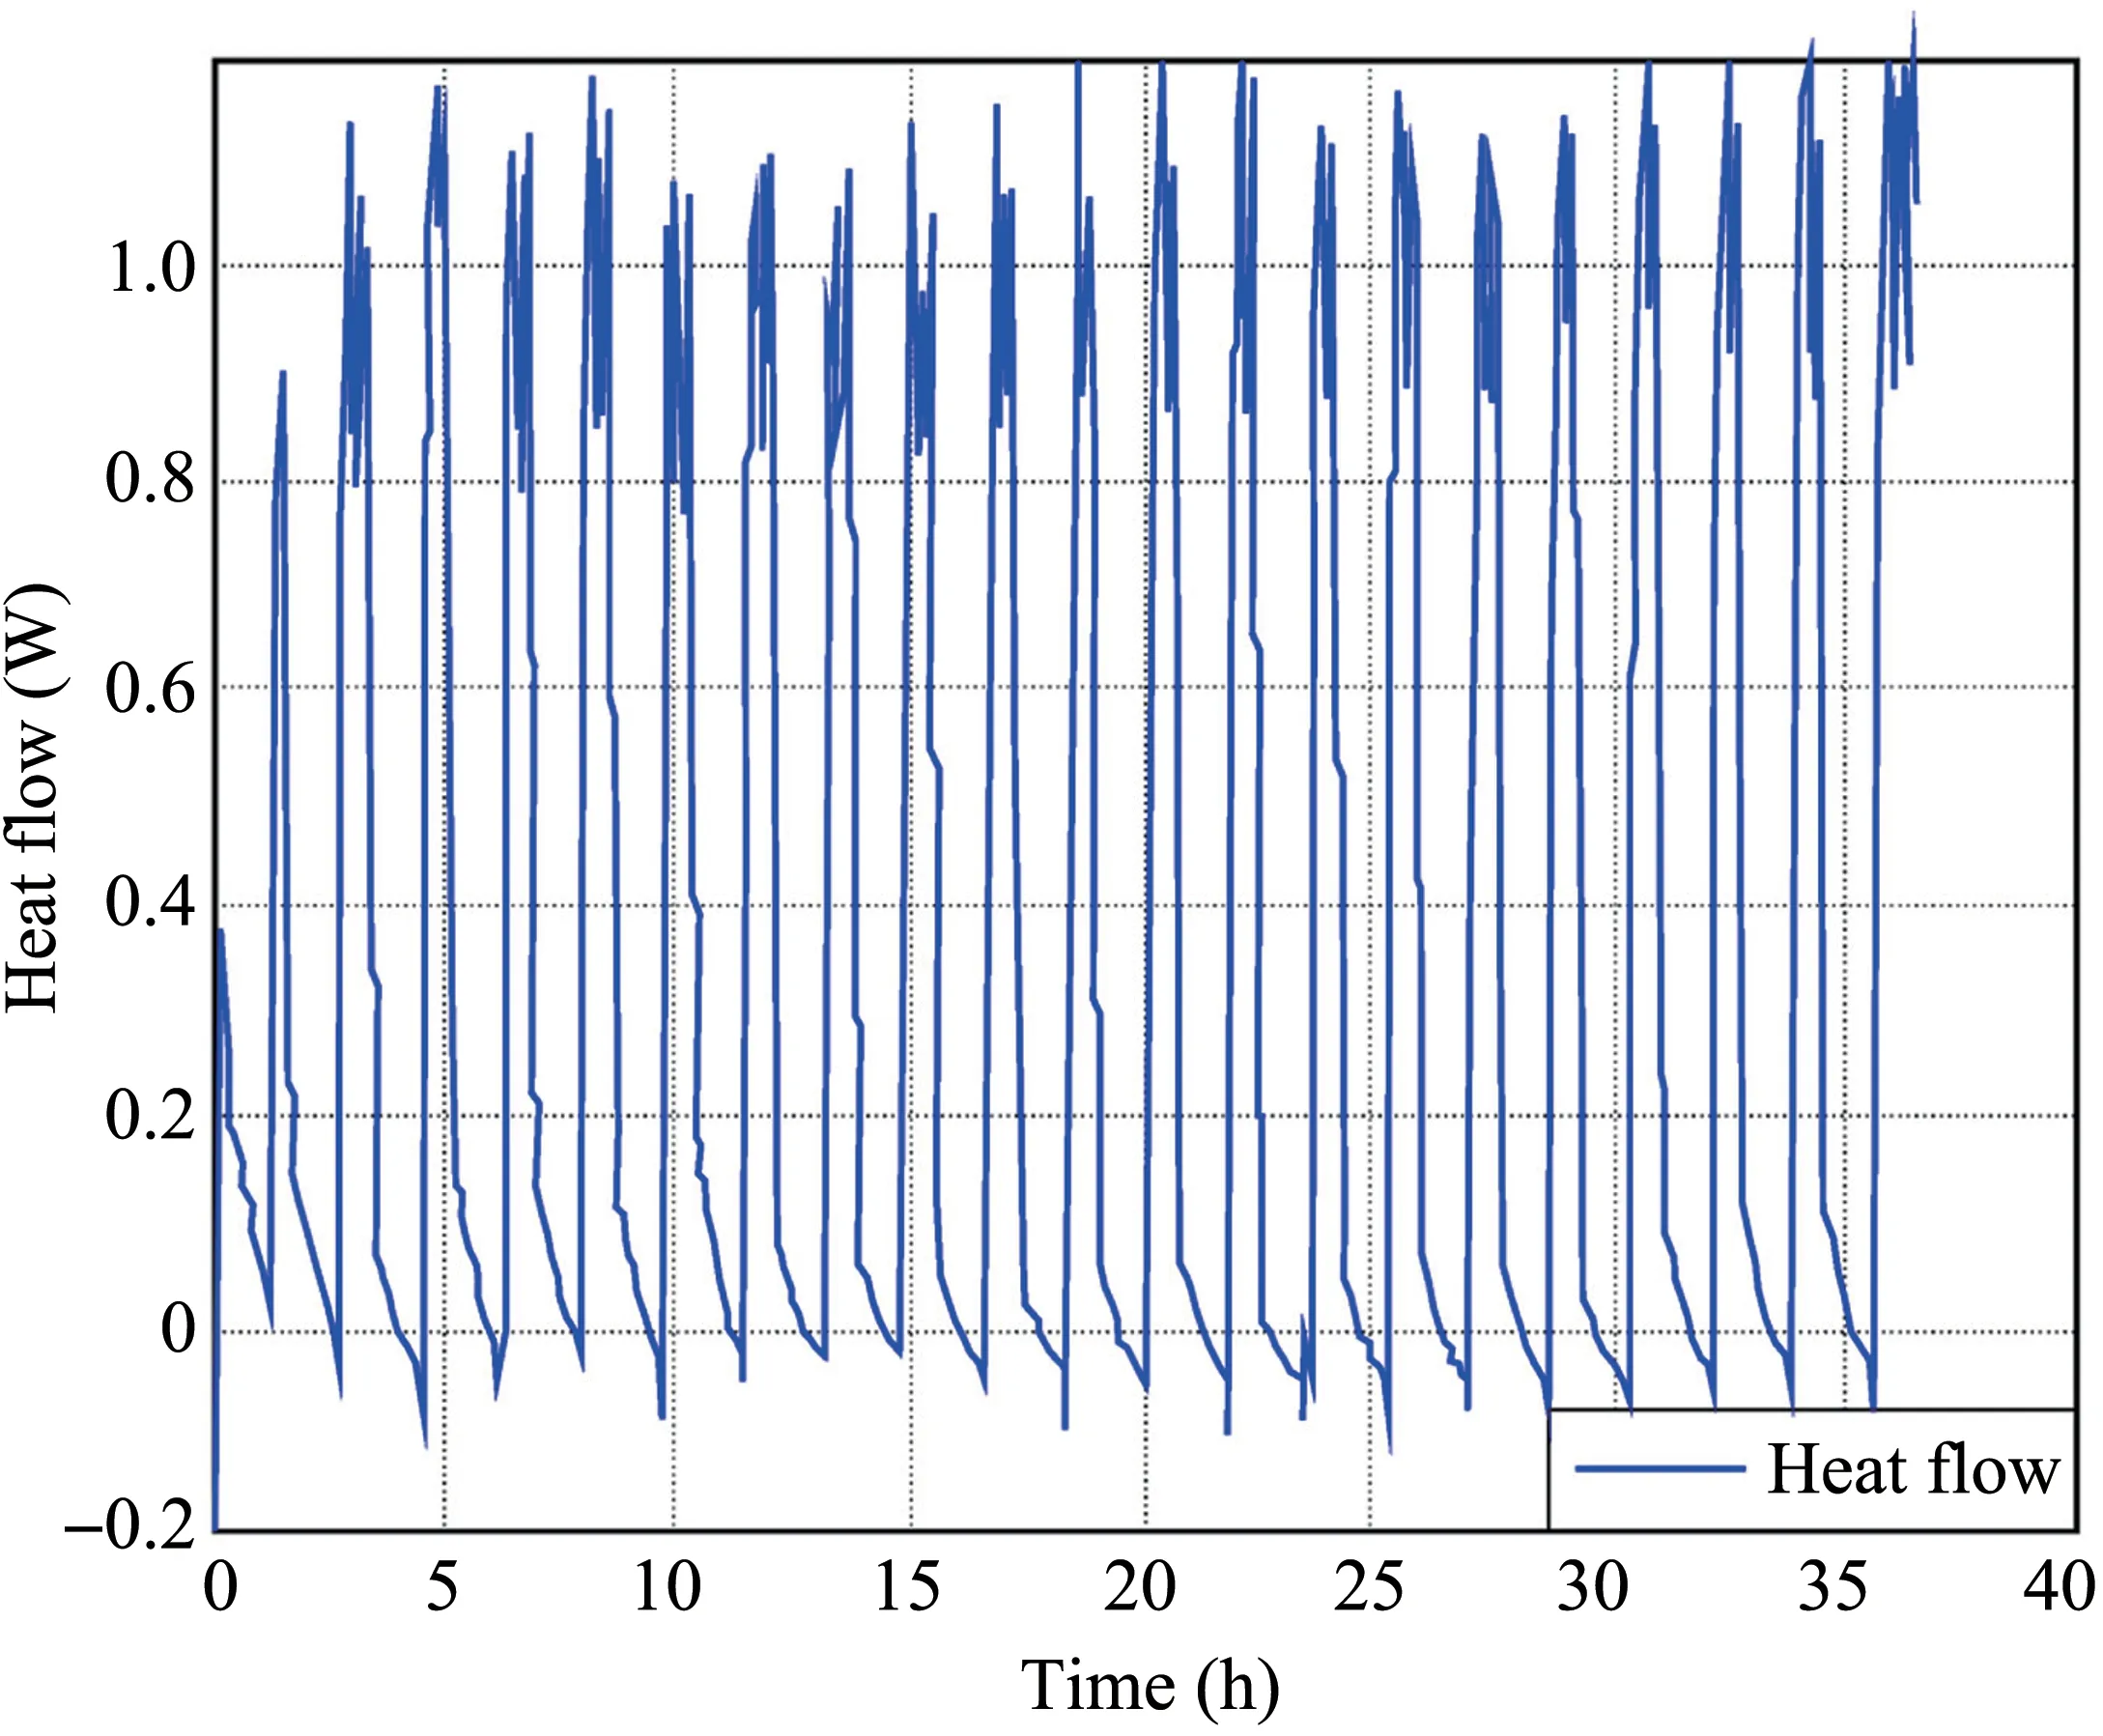
Figure 17 Heat flow in thermosyphons with time
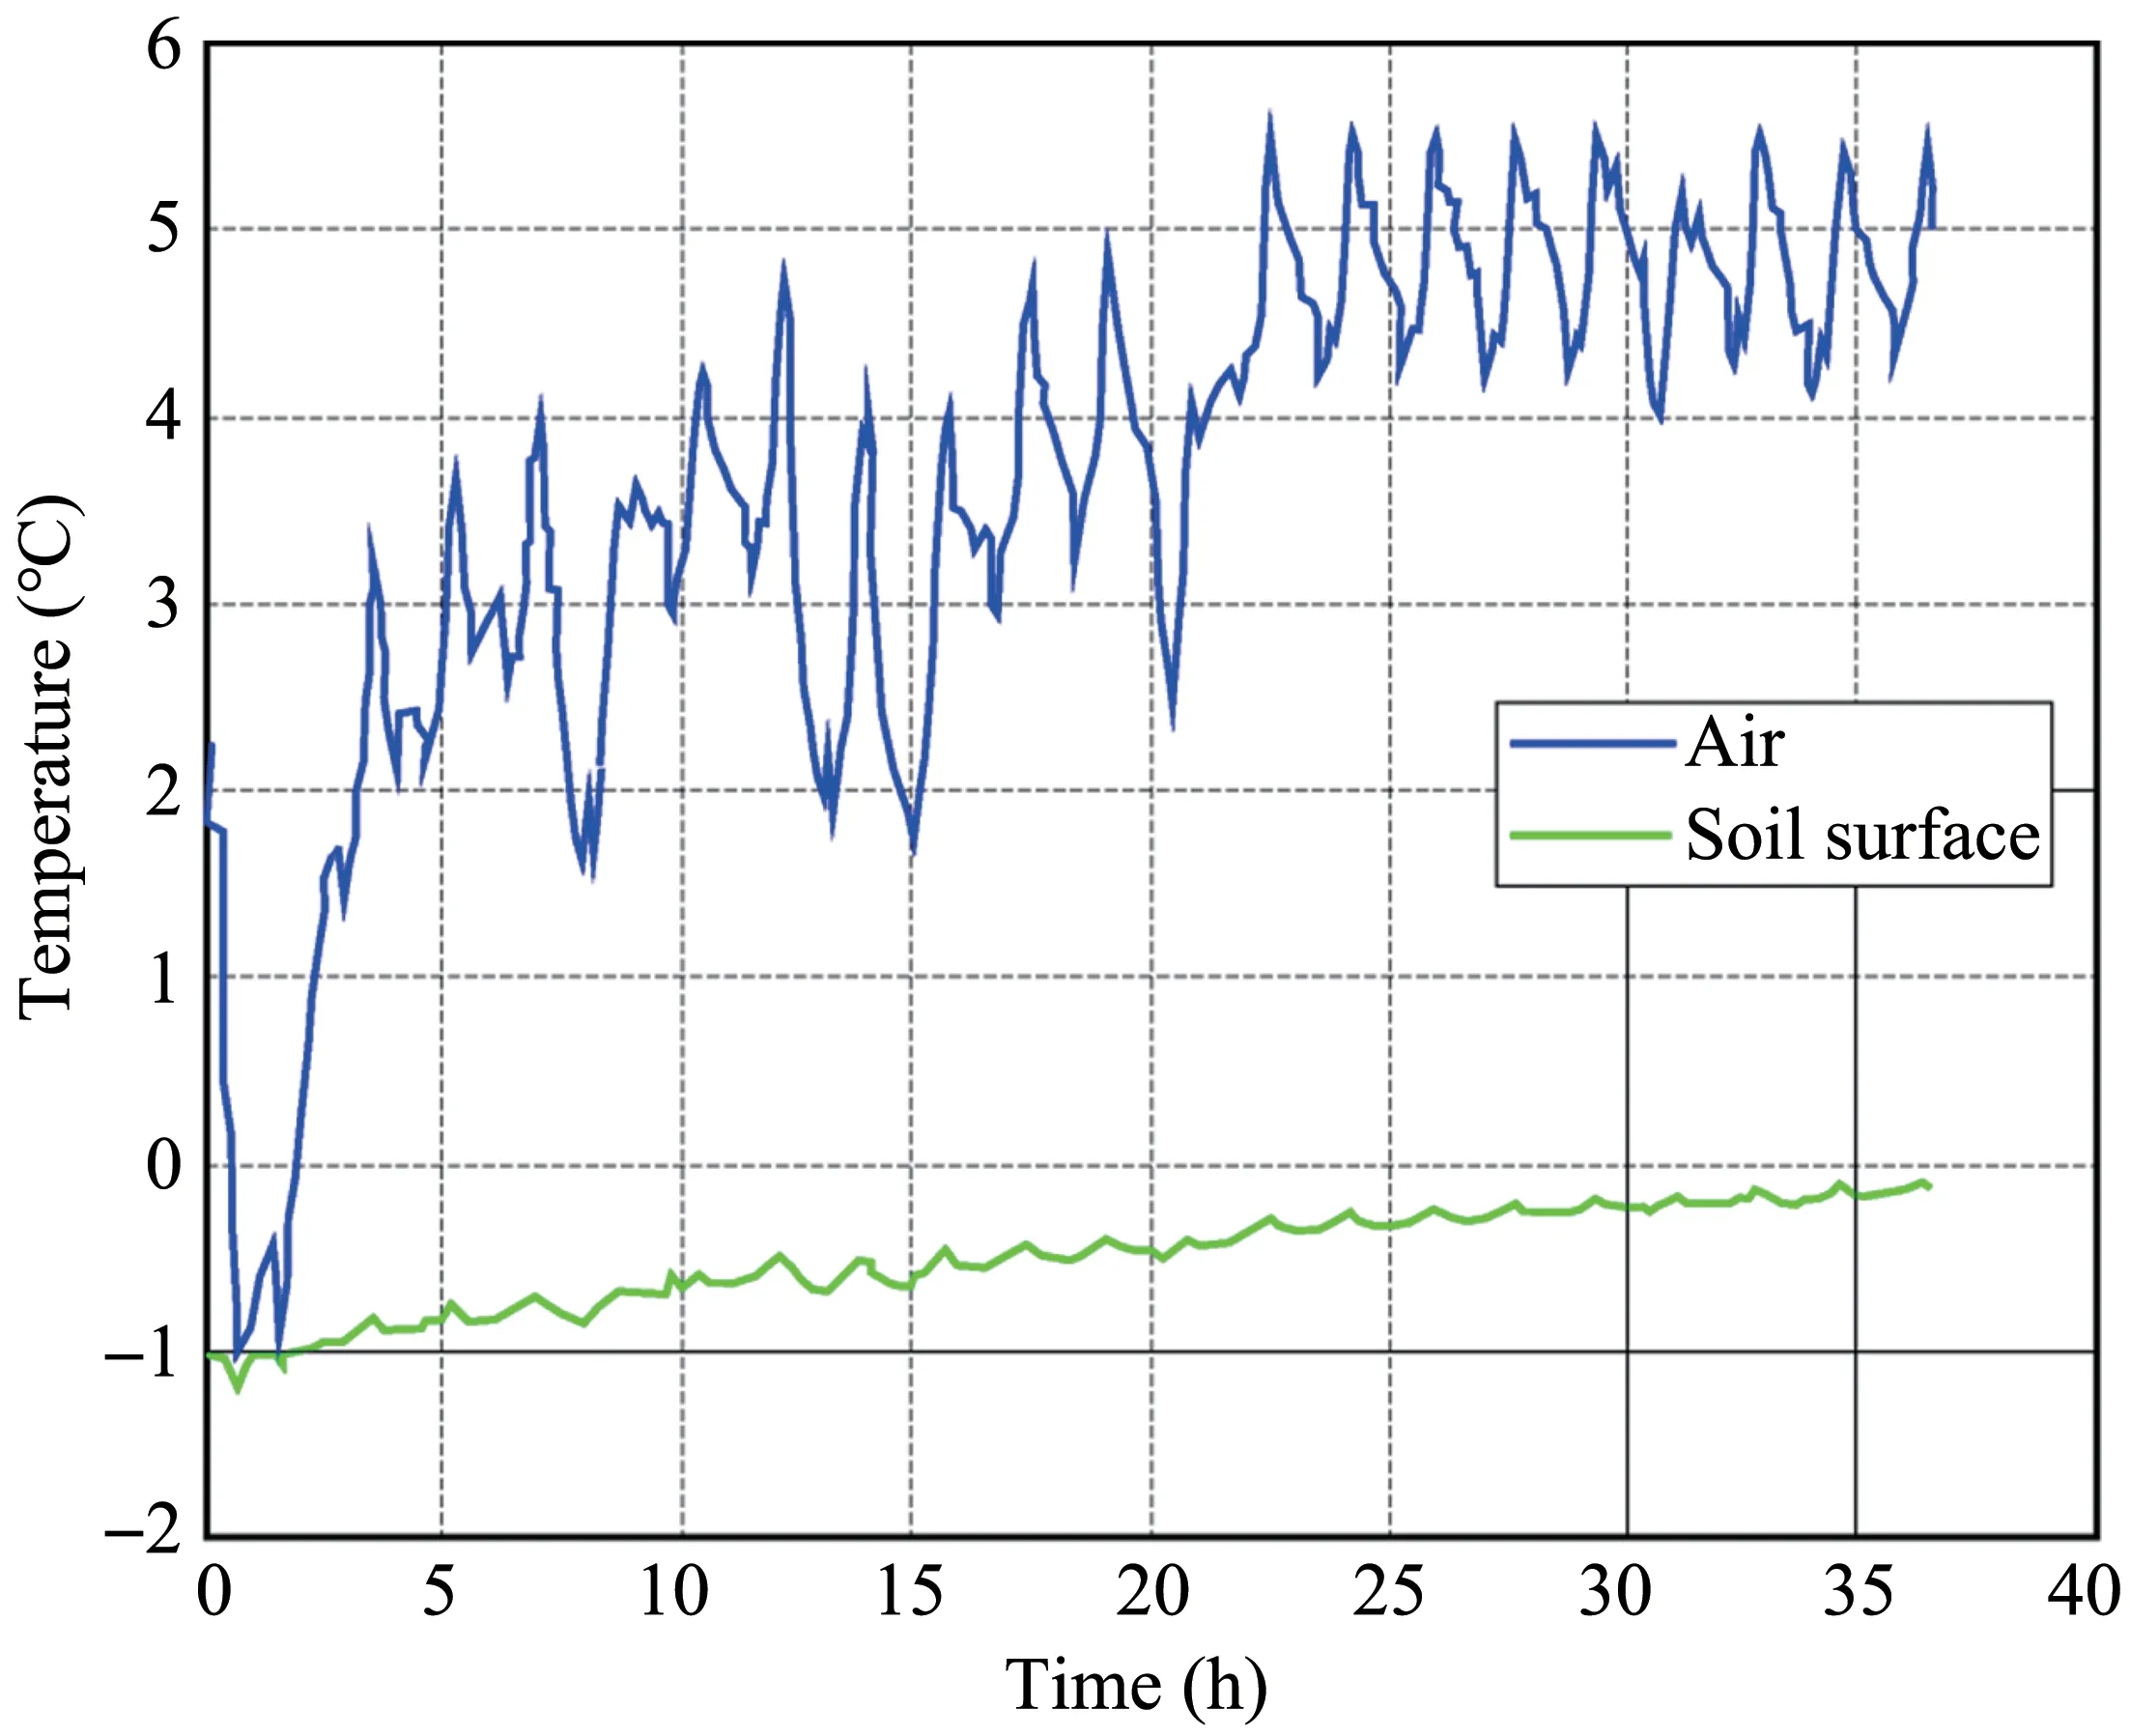
Figure 18 Temperature of air and soil surface with time
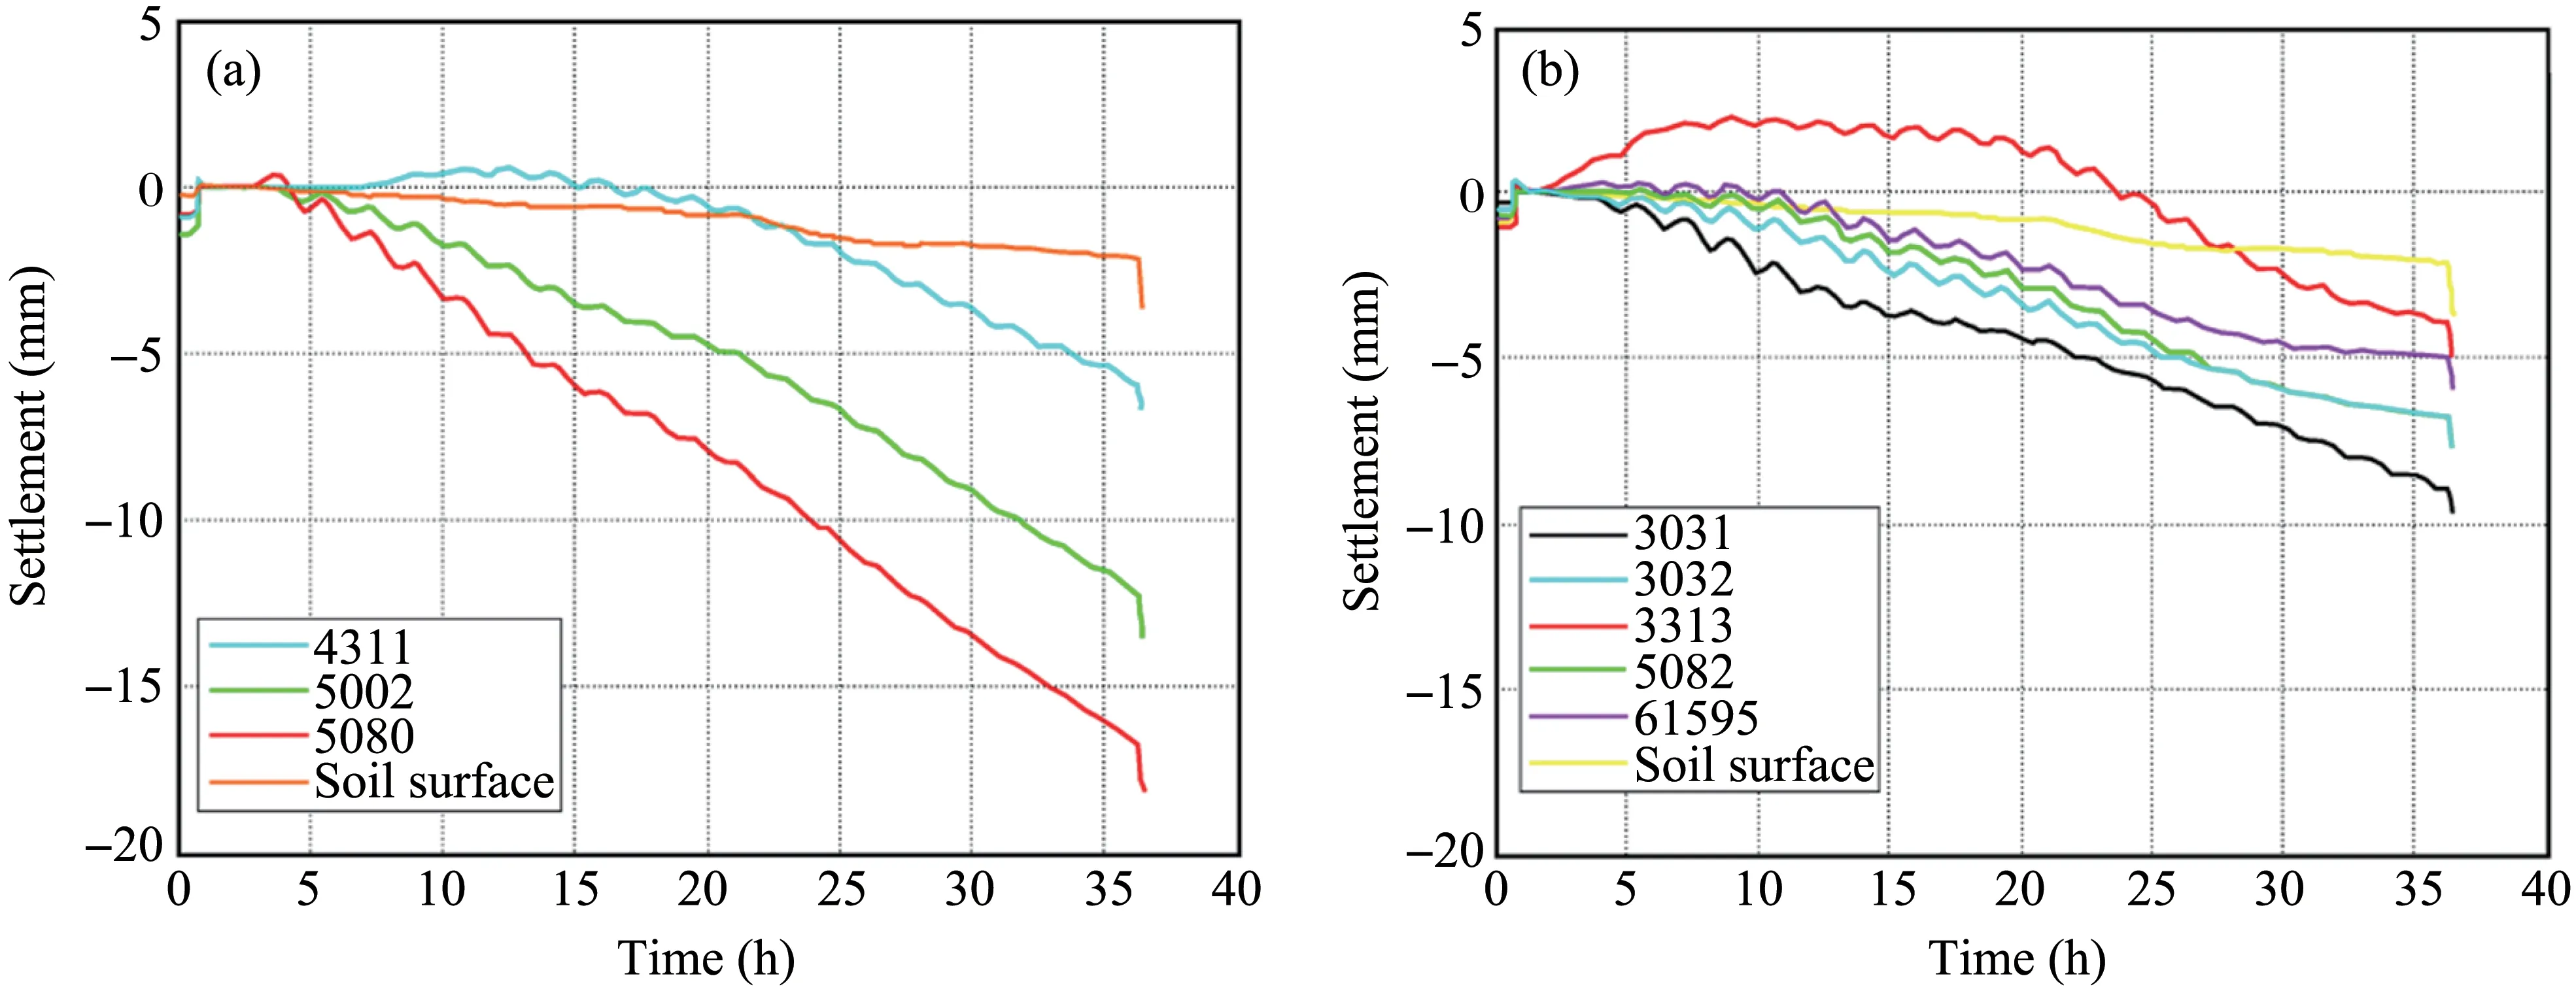
Figure 19 LVDT measurements:(a)pipe A,(b)pipe B
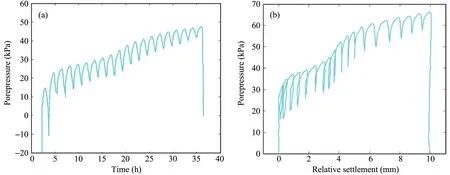
Figure 20 Pore pressure at pipe A invert level with(a)time and with(b)thaw settlement
In addition,the periodic decreases of pore pres‐sure are induced by cryo-suction as soil back freez‐ing occurs due to the temperature fall from +7 to+2°C.
3.3 Post-test activities
After stopping the centrifuge,the experiment package was disassembled and the soil sample con‐taining the pipe was transferred to a cold room.Posttest measurements were taken to check the locations of the pipes.CAT scan images were also taken for each pipe and soil block separately.After that,water contents were measured from each soil blocks.The frozen soil samples were taken from the soil block along the entire depth and thawed soil samples were taken from two locations for each pipe.Note that the frozen soil block started defrosting due to long expo‐sure to room temperature.The soil was partially de‐frosted on the edges which may have affected the wa‐ter content in the soil.
3.3.1 CAT scans
Radiographic examination of the model pipes and soil samples was carried out to determine the posi‐tions of pipe and RTDs,extent of thaw bulb,and ar‐eas of thawed soil and settled soil.The machine was a Toshiba Xpress/GX whole body X-Ray CT Scanner,single slice instrument with continuous rotation and 896 channel Solid-state detectors.The scans were car‐ried out using a "small" field of view and a 1 mm slice thickness.Thaw strains according to areas of thawed soil and settled soil from CAT images were calculated and the results are shown as follows.
3.3.2 Water contents
The total water contents for both pipes A and B are plotted in Figure 21.Note that the lower parts of water profiles under pipes A and B show a larger wa‐ter content than the upper parts after test because the soil defrosted and the pore water migrated.The water contents are 64.2% and 70.6% in the lower parts of pipes A and B,respectively.They are 39.5% and 41.8%in the upper parts.
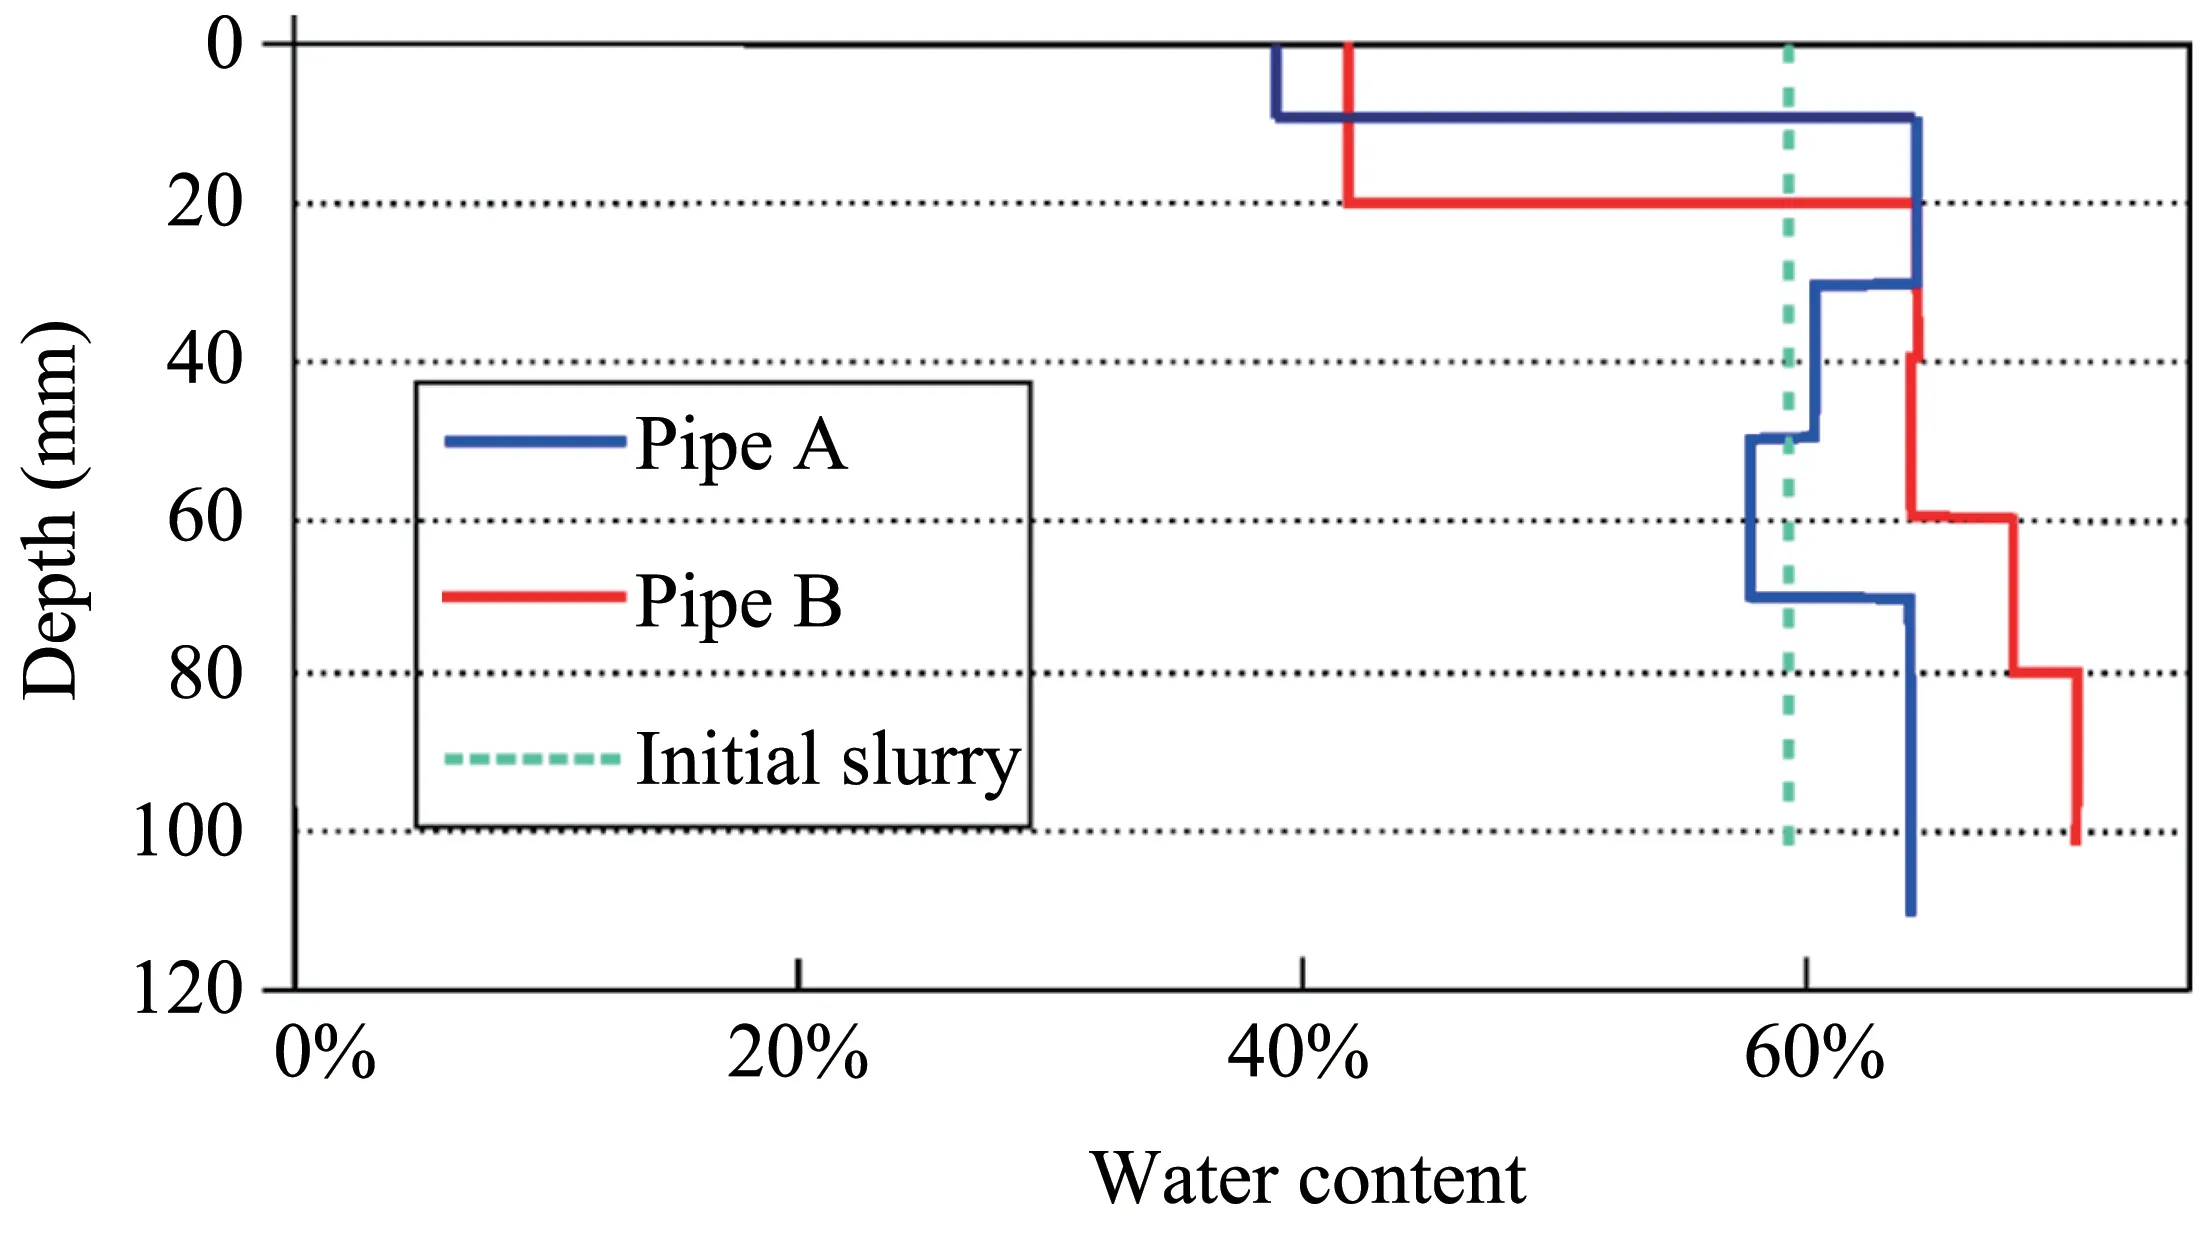
Figure 21 Water content profile
3.4 Pipeline thaw settlement
3.4.1 Thaw-settlement strain (TS) of thawed soil
Thaw settlements of the pipelines are controlled by the TS and thaw penetration of the soil under the pipes offset by any external support from sand bags and frozen ground.
The TS can be calculated based on the thawed soil area (Ath) and settlement area (Ast) with the help of the following formula:
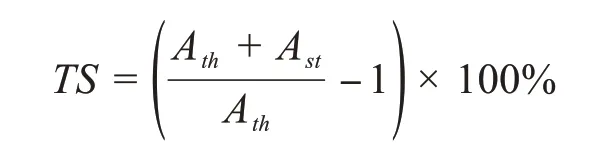
A typical CAT scan cross section (Figure 22)shows the thaw bulb area in light red and the overly‐ing void (settlement area) in darker red on the CAT image.The settlement area,thawed soil area and thaw strain are digitized and calculated on the CAT images at different positions of pipes A and B,presented in Figure 23.An average settlement area of 1,741.1 mm2for unsupported pipe A is significantly more than 707 mm2for the cooled and supported pipe B.Simi‐larly,an average thawed soil area of 4,509.1 mm2for pipe A is also clearly more than that of 1,811.6 mm2for pipe B.However,their average thaw strains are equal to 38.9% because they are primarily dependent on soil type and water content.
3.4.2 Relative pipe settlement
The specific gravity of the pipe was estimated at 1.57 or higher.The thawed material had a specific gravity of around 1.8 or less.The pipe may therefore float (rather than settle) in the thawed material (Pow‐ellet al.,2002).The onset of effective stress in the thawed material however generated sufficient shear resistance to maintain the pipe within the soil.The pipe is expected to settle with the thawed material.
The relative pipe thaw settlement is the settlement of the pipe relative to the soil surface.The develop‐ment of pipe settlement and the thaw front below the initial pipe elevation is presented in Figure 24 for pipes A and B.For pipe A,it was after the thaw front at the middle part of the pipe had advanced to 18 mm below the pipe before the relative settlement com‐menced.The thaw settlement appeared to accumulate linearly at about 40%of the thaw front advance.
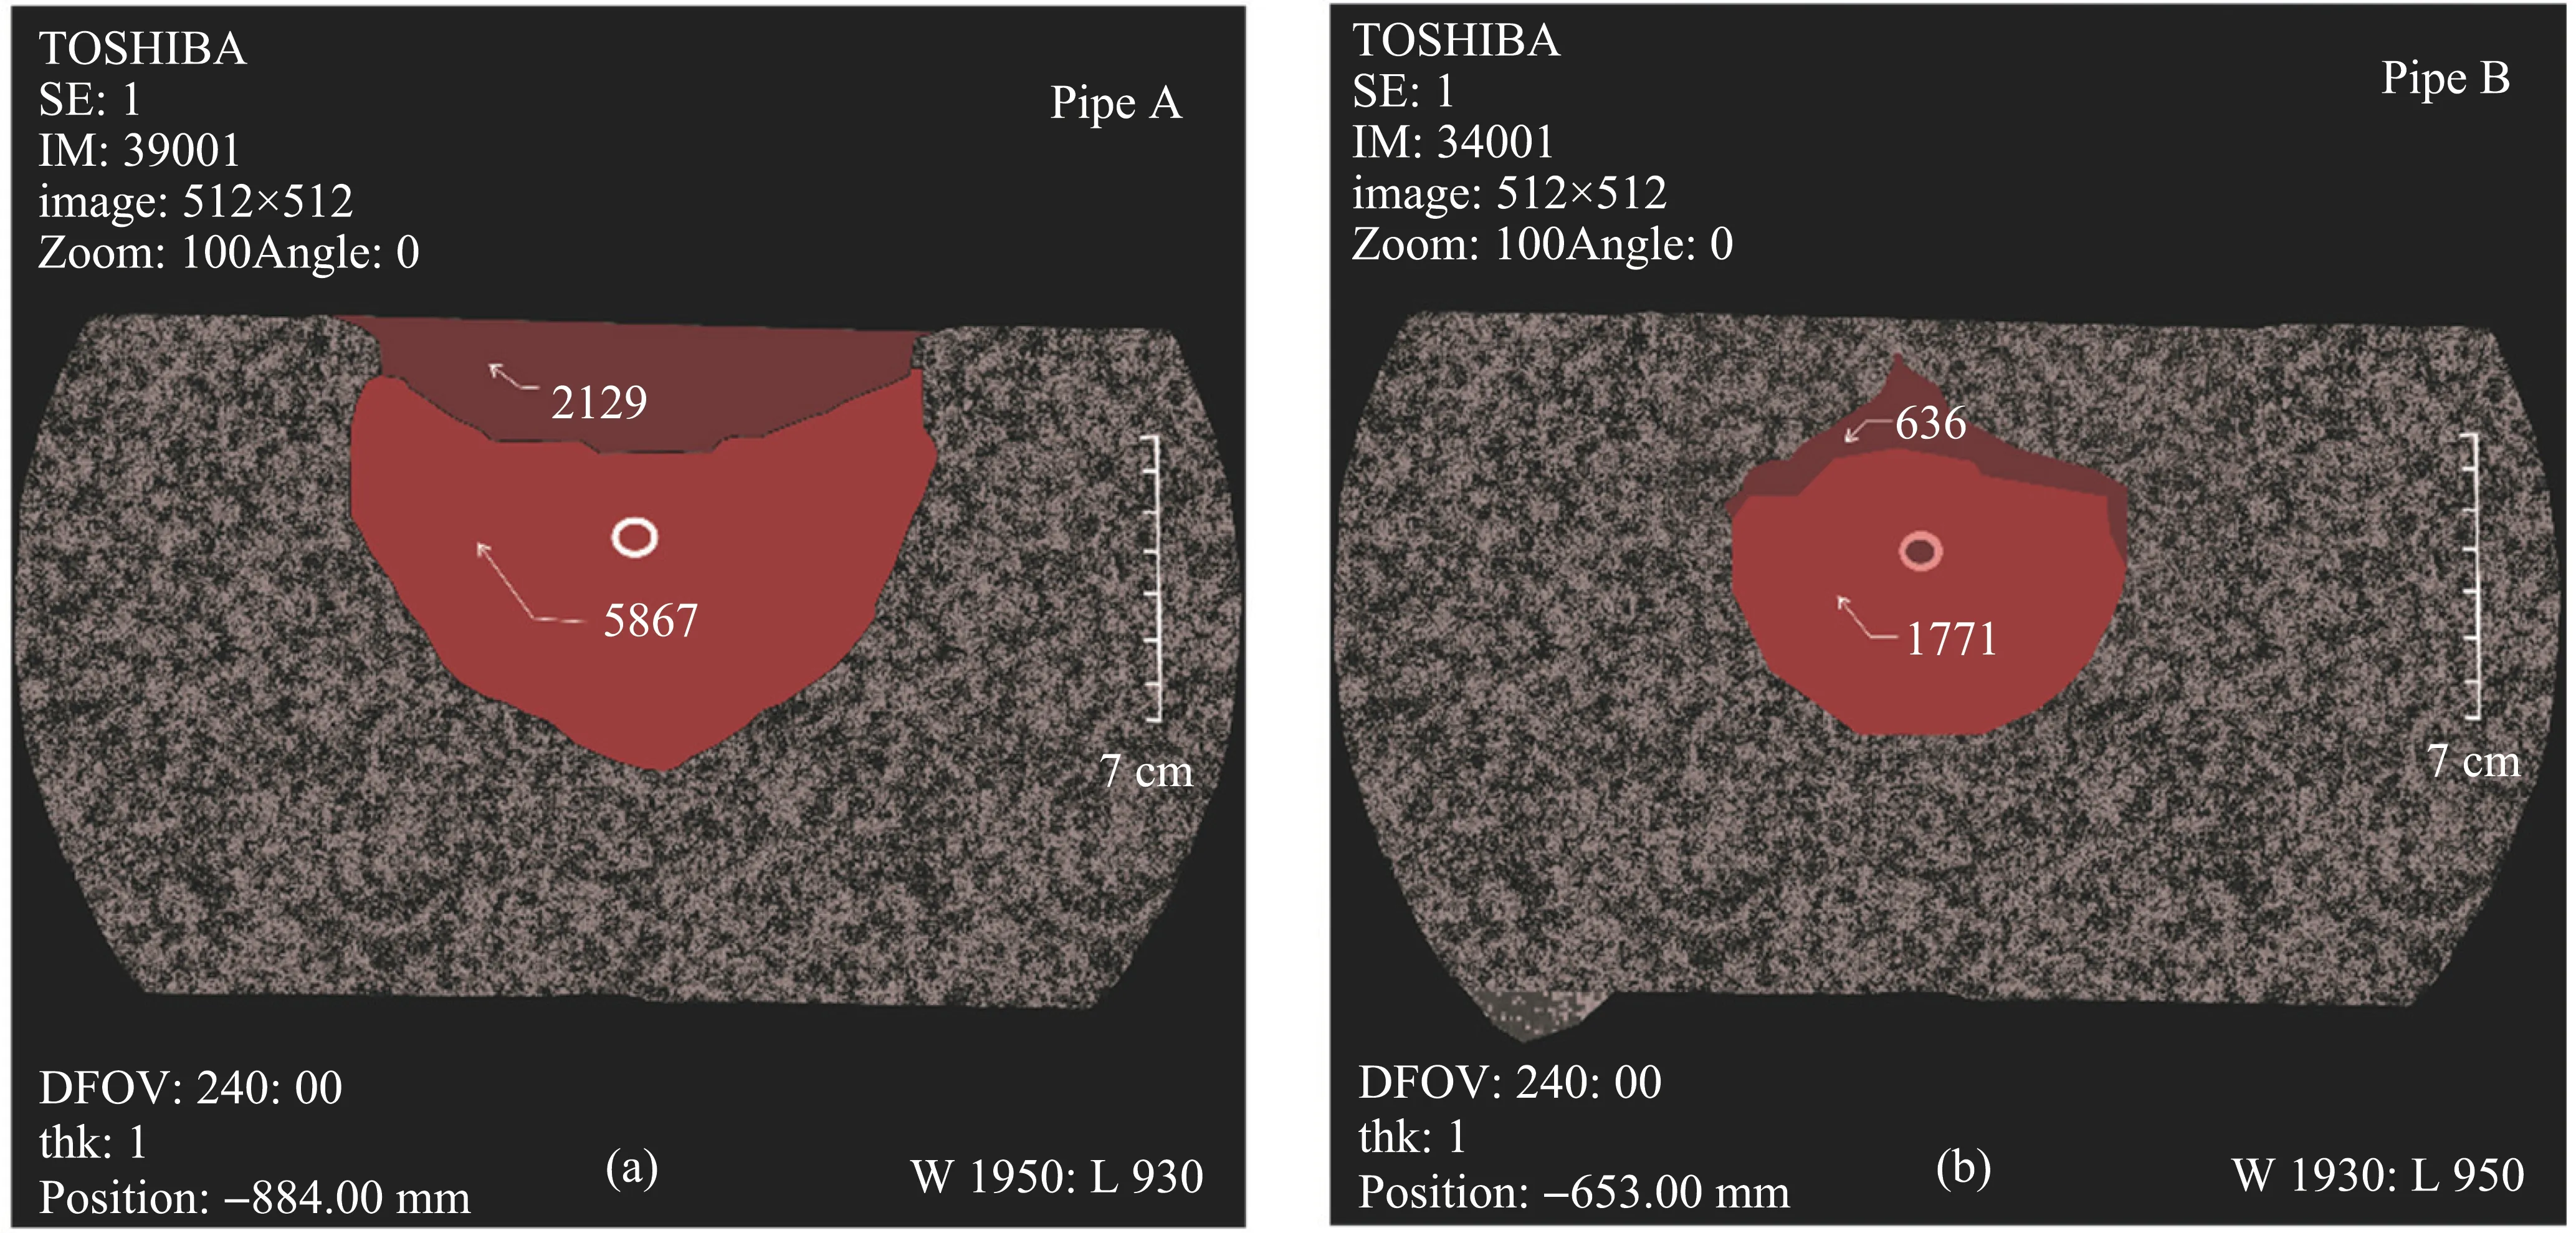
Figure 22 Typical processed CAT scan image:(a)pipe A,-20 mm from pipe center,(b)pipe B,-50 mm from pipe center
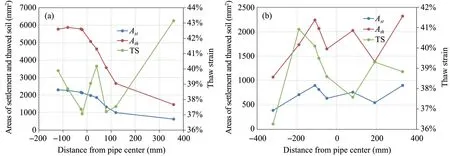
Figure 23 Areas of settlement(Ast)and thawed soil(Ath)and thaw strain(TS)on CAT images along pipes:(a)pipe A,(b)pipe B
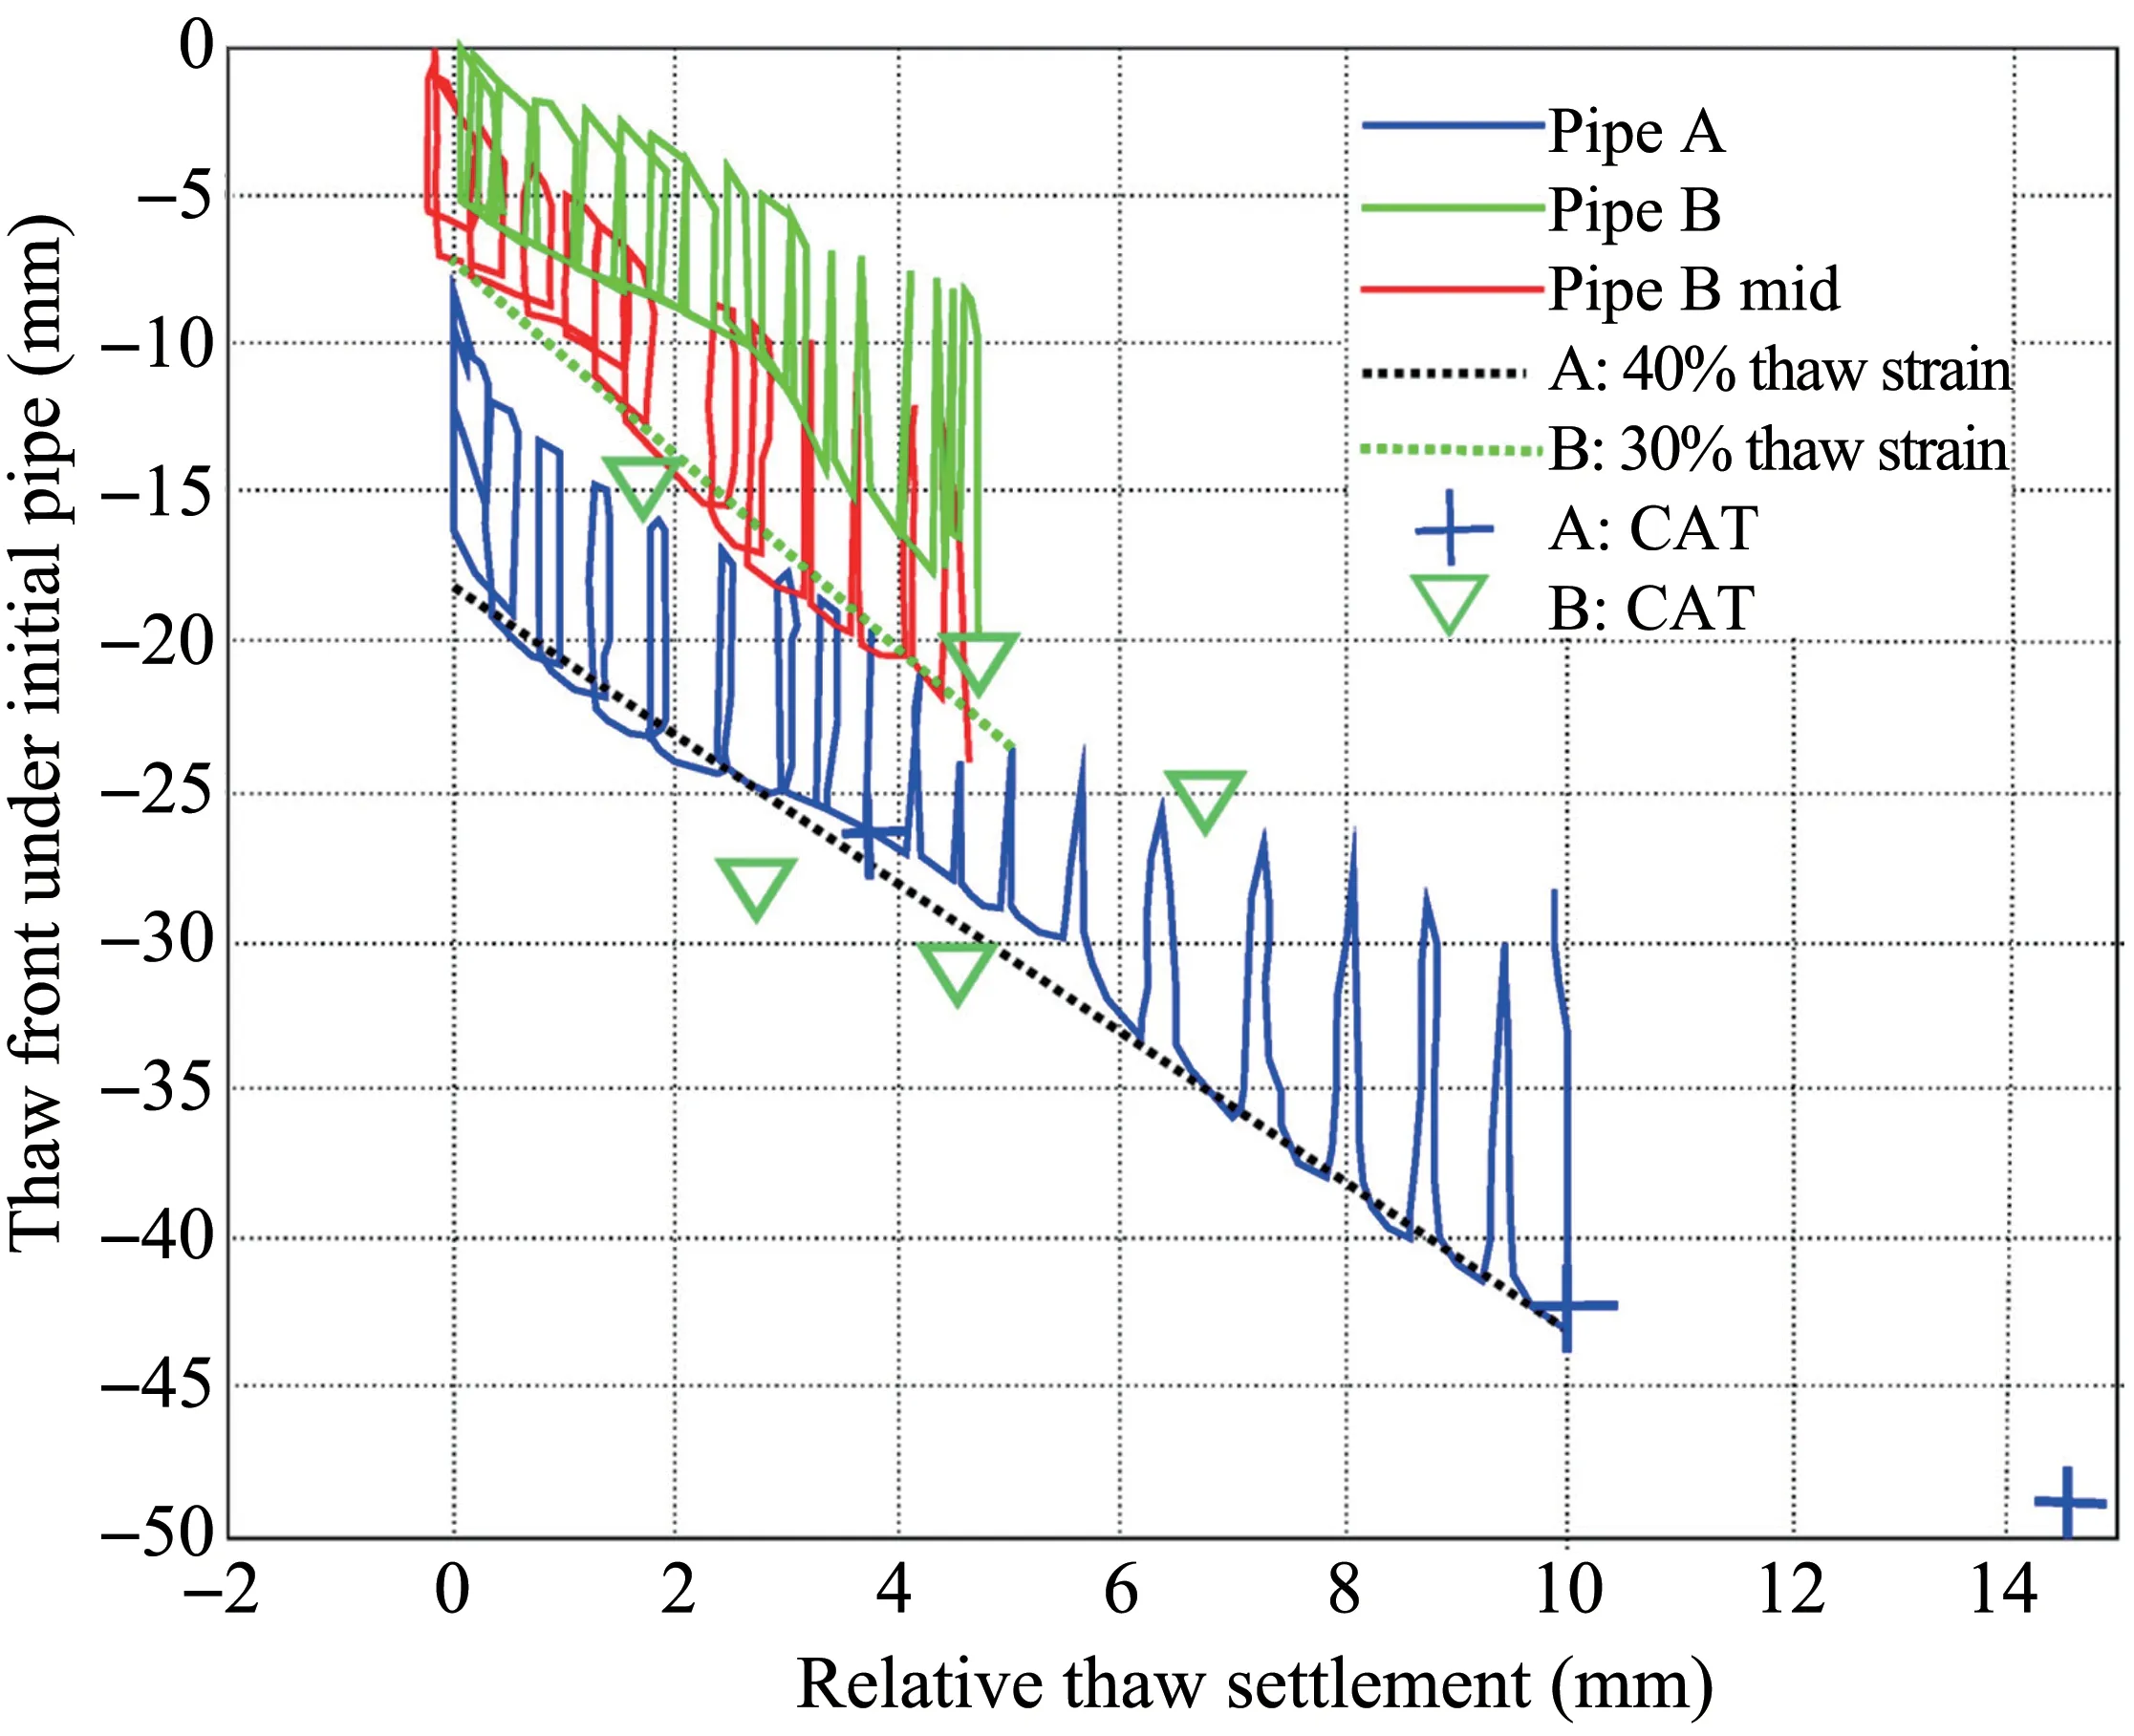
Figure 24 Development of thaw front and pipe settlement
The thaw front location is based on initial RTD lo‐cations.However,the RTDs settled in the thawed ma‐terial.The final locations of the RTDs were measured from the CAT scan.The thaw front location based on the initial and final elevations of the RTDs is present‐ed in Figure 25.This confirms the unconstrained pipe is settling with the thawed material at about 35% ver‐tical strain.This 35% vertical strain is slightly less than the 38.9% volumetric thaw strain due to the shape of thaw bulb.
The thaw front depths measured from the CAT scans and final thaw settlements at the three LVDT lo‐cations(Figure 8)are shown by blue"+"in Figure 24.These three data points are consistent with the thaw front depths assessed from the temperature profiles,Figure 13.
The thaw front versus settlement response at the mid-span of pipe B indicates a thaw strain of 30%starting after the thaw front is 8 mm below that pipe(Figure 24).This thaw strain and that at middle of pipe B is less than that of pipe A due to the sand bag support and mitigative effect of the thermosyphons.The upper three CAT scan data points,marked as green "∇",near the three sand bag/thermosyphon sup‐ports are consistent with the 30% line.The lower two points near mid-span are below the 30% line due to the reduction in thaw settlement from the three sup‐ports along pipe B.
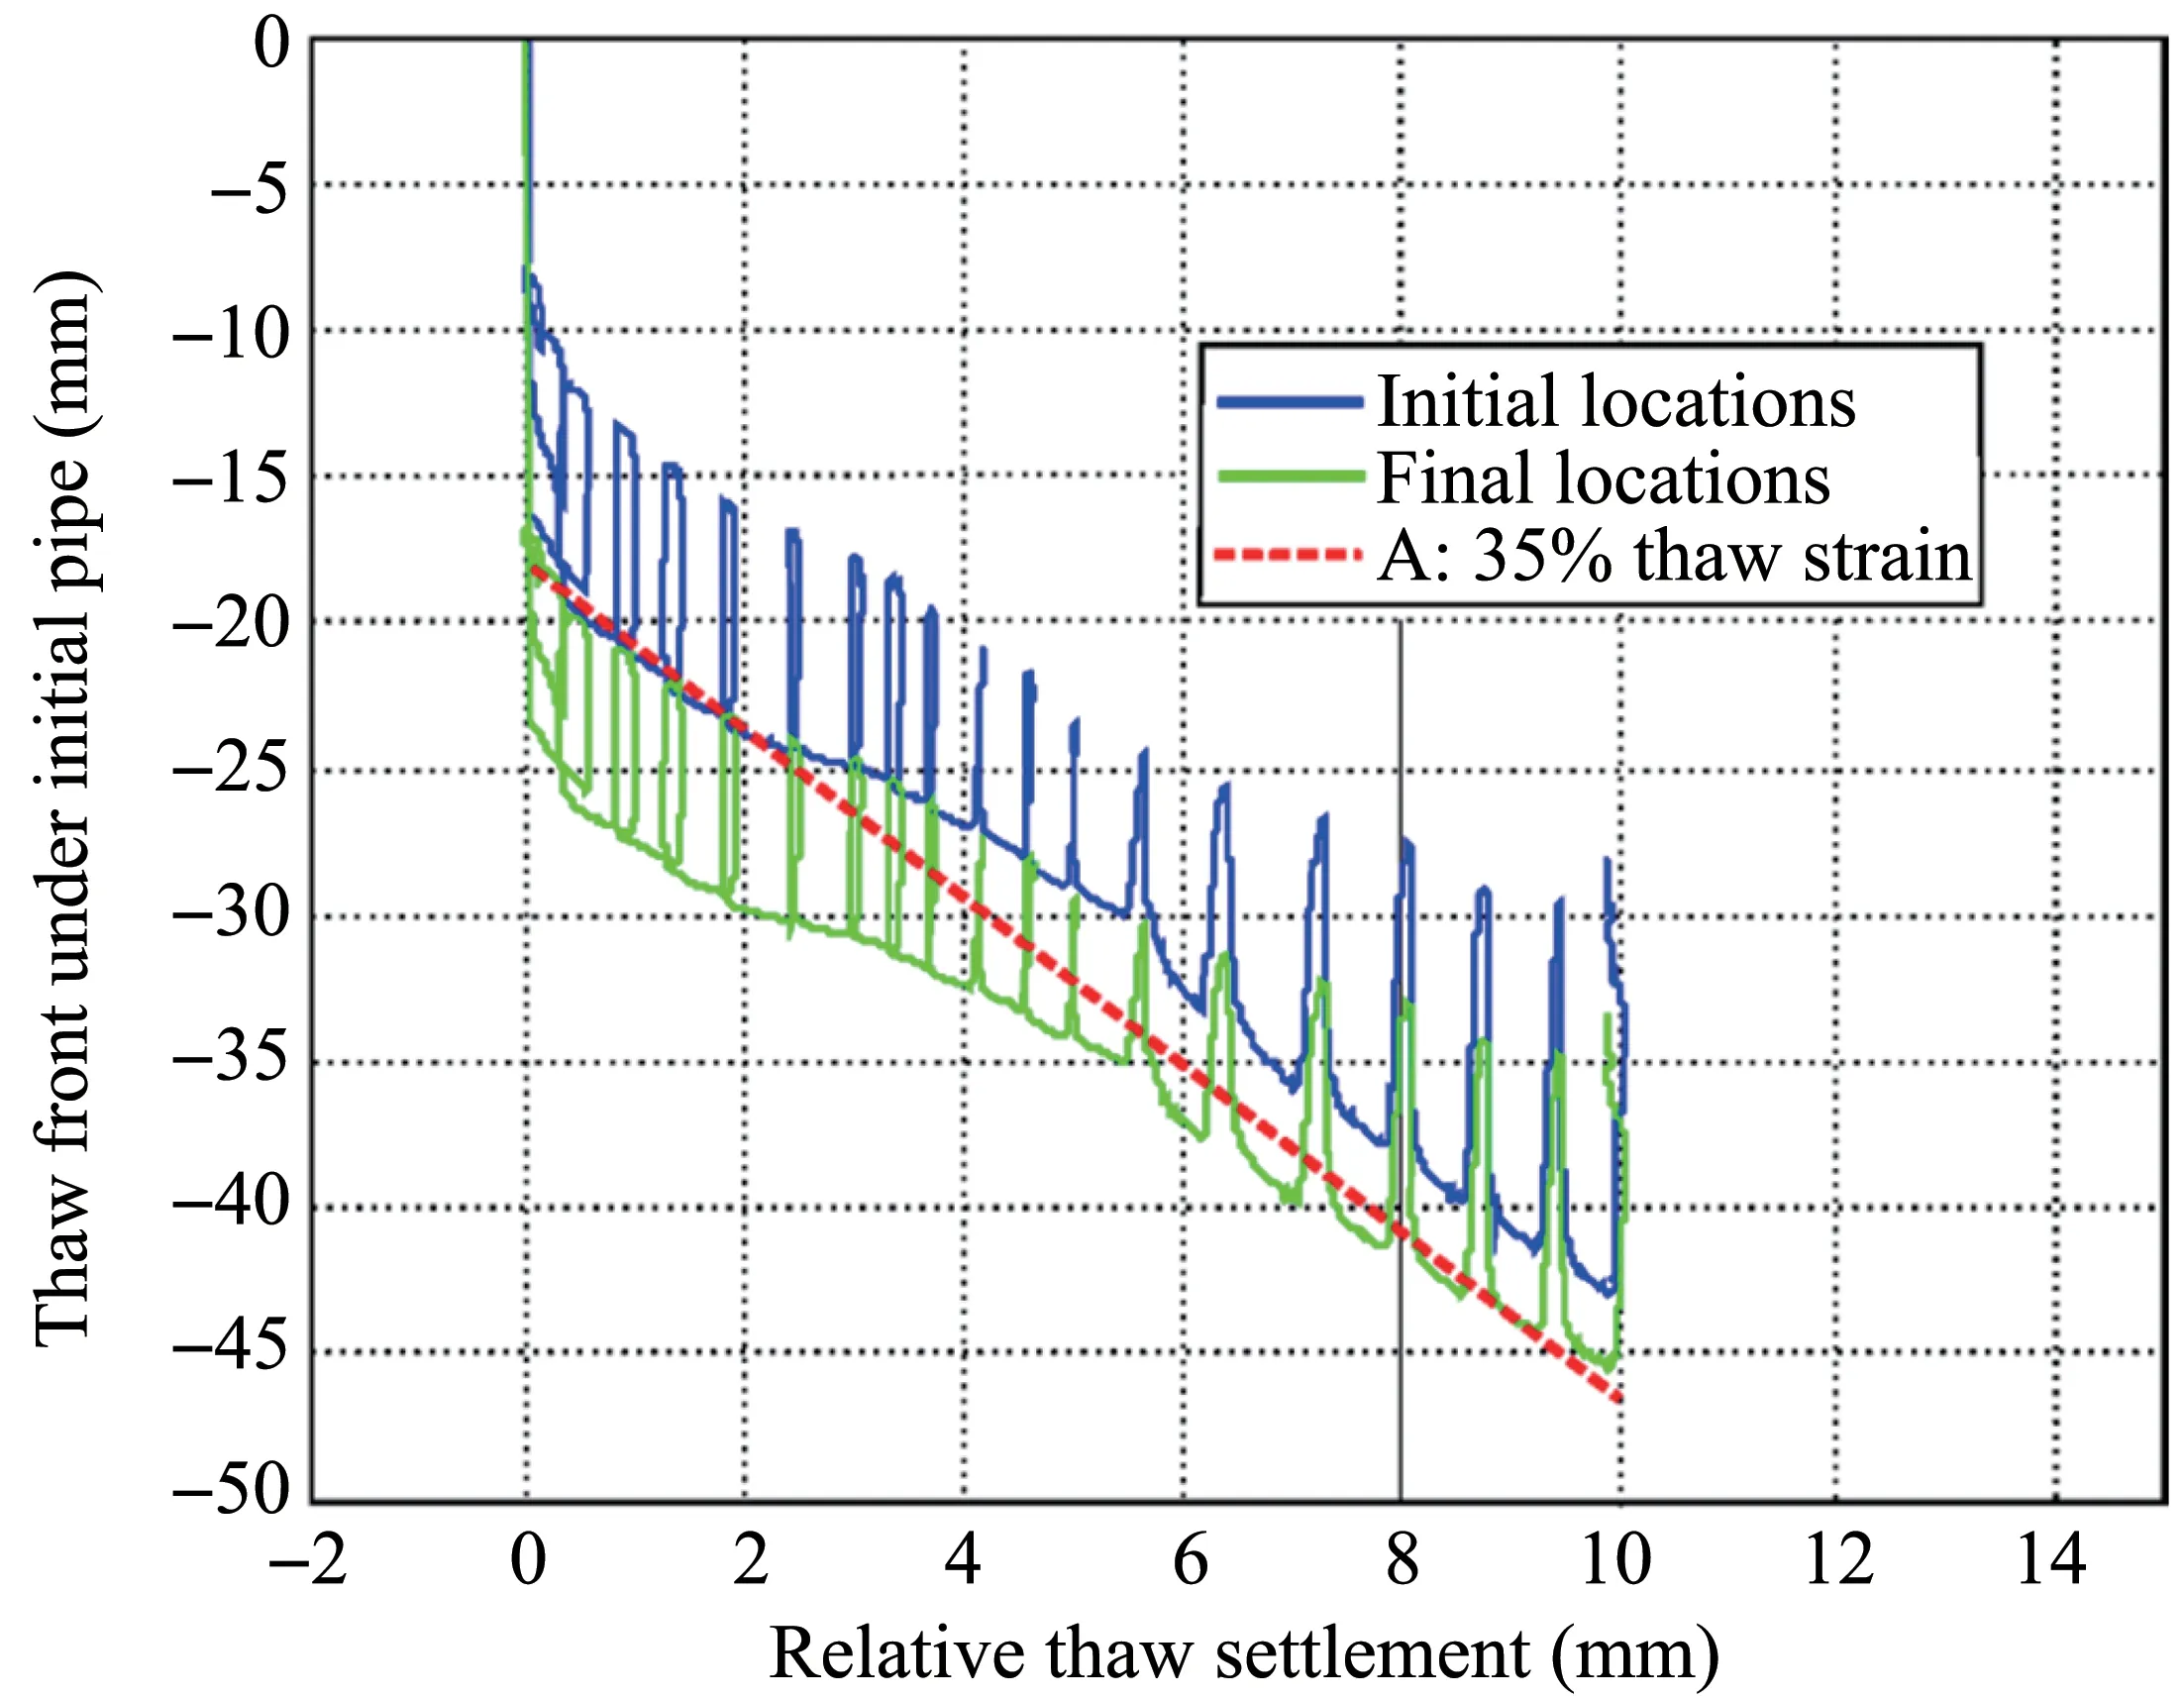
Figure 25 Development of thaw front and pipe settlement,pipe A
The temporal development of the thaw front and related thaw settlement in Figure 26 indicate an in‐crease in the rate of thaw front advance below the pipes around 25 and 22 hours,respectively.The settle‐ment rate for pipe A also increases after 25 hours.Im‐portantly,the settlement rate for pipe B is maintained after 22 hours due to the influence of the pipe sup‐ports.The cyclic settlement component in both pipes is significantly reduced after these times.
3.4.3 Creep strain of frozen soil
The LVDTs measure settlement with respect to the strong box and the support beams.The flexure of these beams under their increased weight at 73 g gives an increase of 1 mm and subsequent decrease in measured settlements in the first hour from swing up(Figure 19).The relative pipe settlements need to be as‐sessed relative to the settlement of the soil surface.The frozen soil surface settled by 2 mm during the 35-hour test as presented in Figure 19.This settlement is equiv‐alent to a vertical strain of 1.5% over the 133-mm-thick sample.This strain is attributed to creep of the frozen soil under the vertical stress generated by the centri‐fuge.The strain magnitude is comparable to values assessed from one dimensional creep compression of frozen low-density silts by Eckardt (1982) on a 200-mm-high sample of frozen silt under −5 °C ac‐counting for the actual stress and temperature levels.
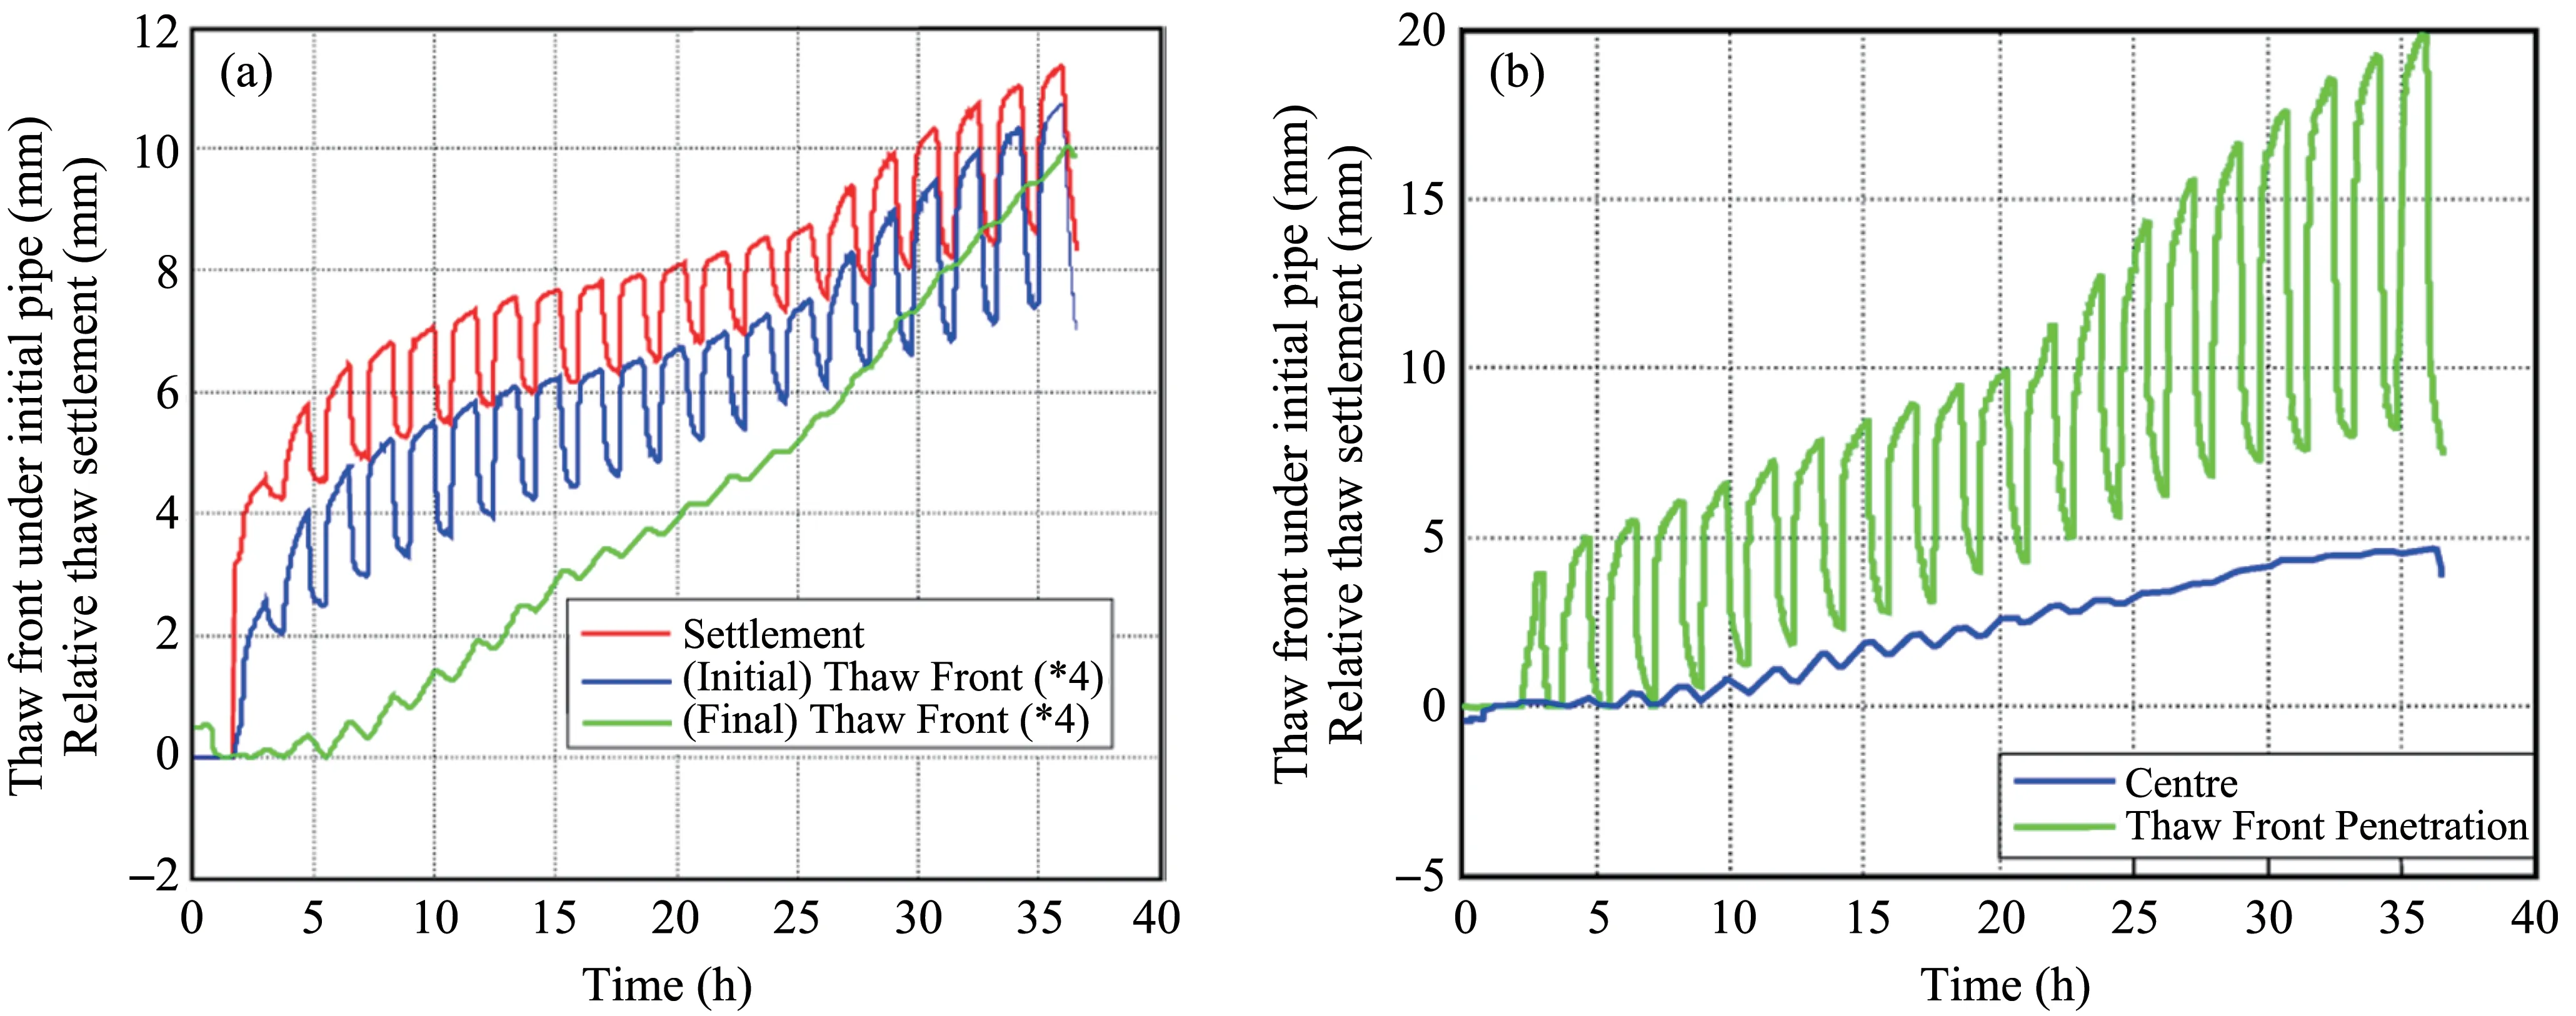
Figure 26 Temporal development of thaw front and pipe settlement:(a)pipe A,(b)pipe B
3.4.4 Thaw bulb development
Thaw bulb development and pipe settlement are presented in Figures 22 and 24.It is found that there is a delay for thaw settlement following thaw bulb.It can be explained conceptually,as in Figure 27.The initial delay in experiencing thaw settlement un‐til thaw bulbs are 18 mm below pipe A and 8 mm be‐low the middle part of pipe B seems to be related with the initial growth of an axisymmetric thaw bulb centered on the pipe,as in Figure 27a.The phase transition from ice to water causes an air void to de‐velop above the thaw bulb (Figure 27b),to accom‐modate the change in volume.This air gap insulates the overlying frozen material causing the thaw bulb to expand laterally,rather than towards the ground surface.
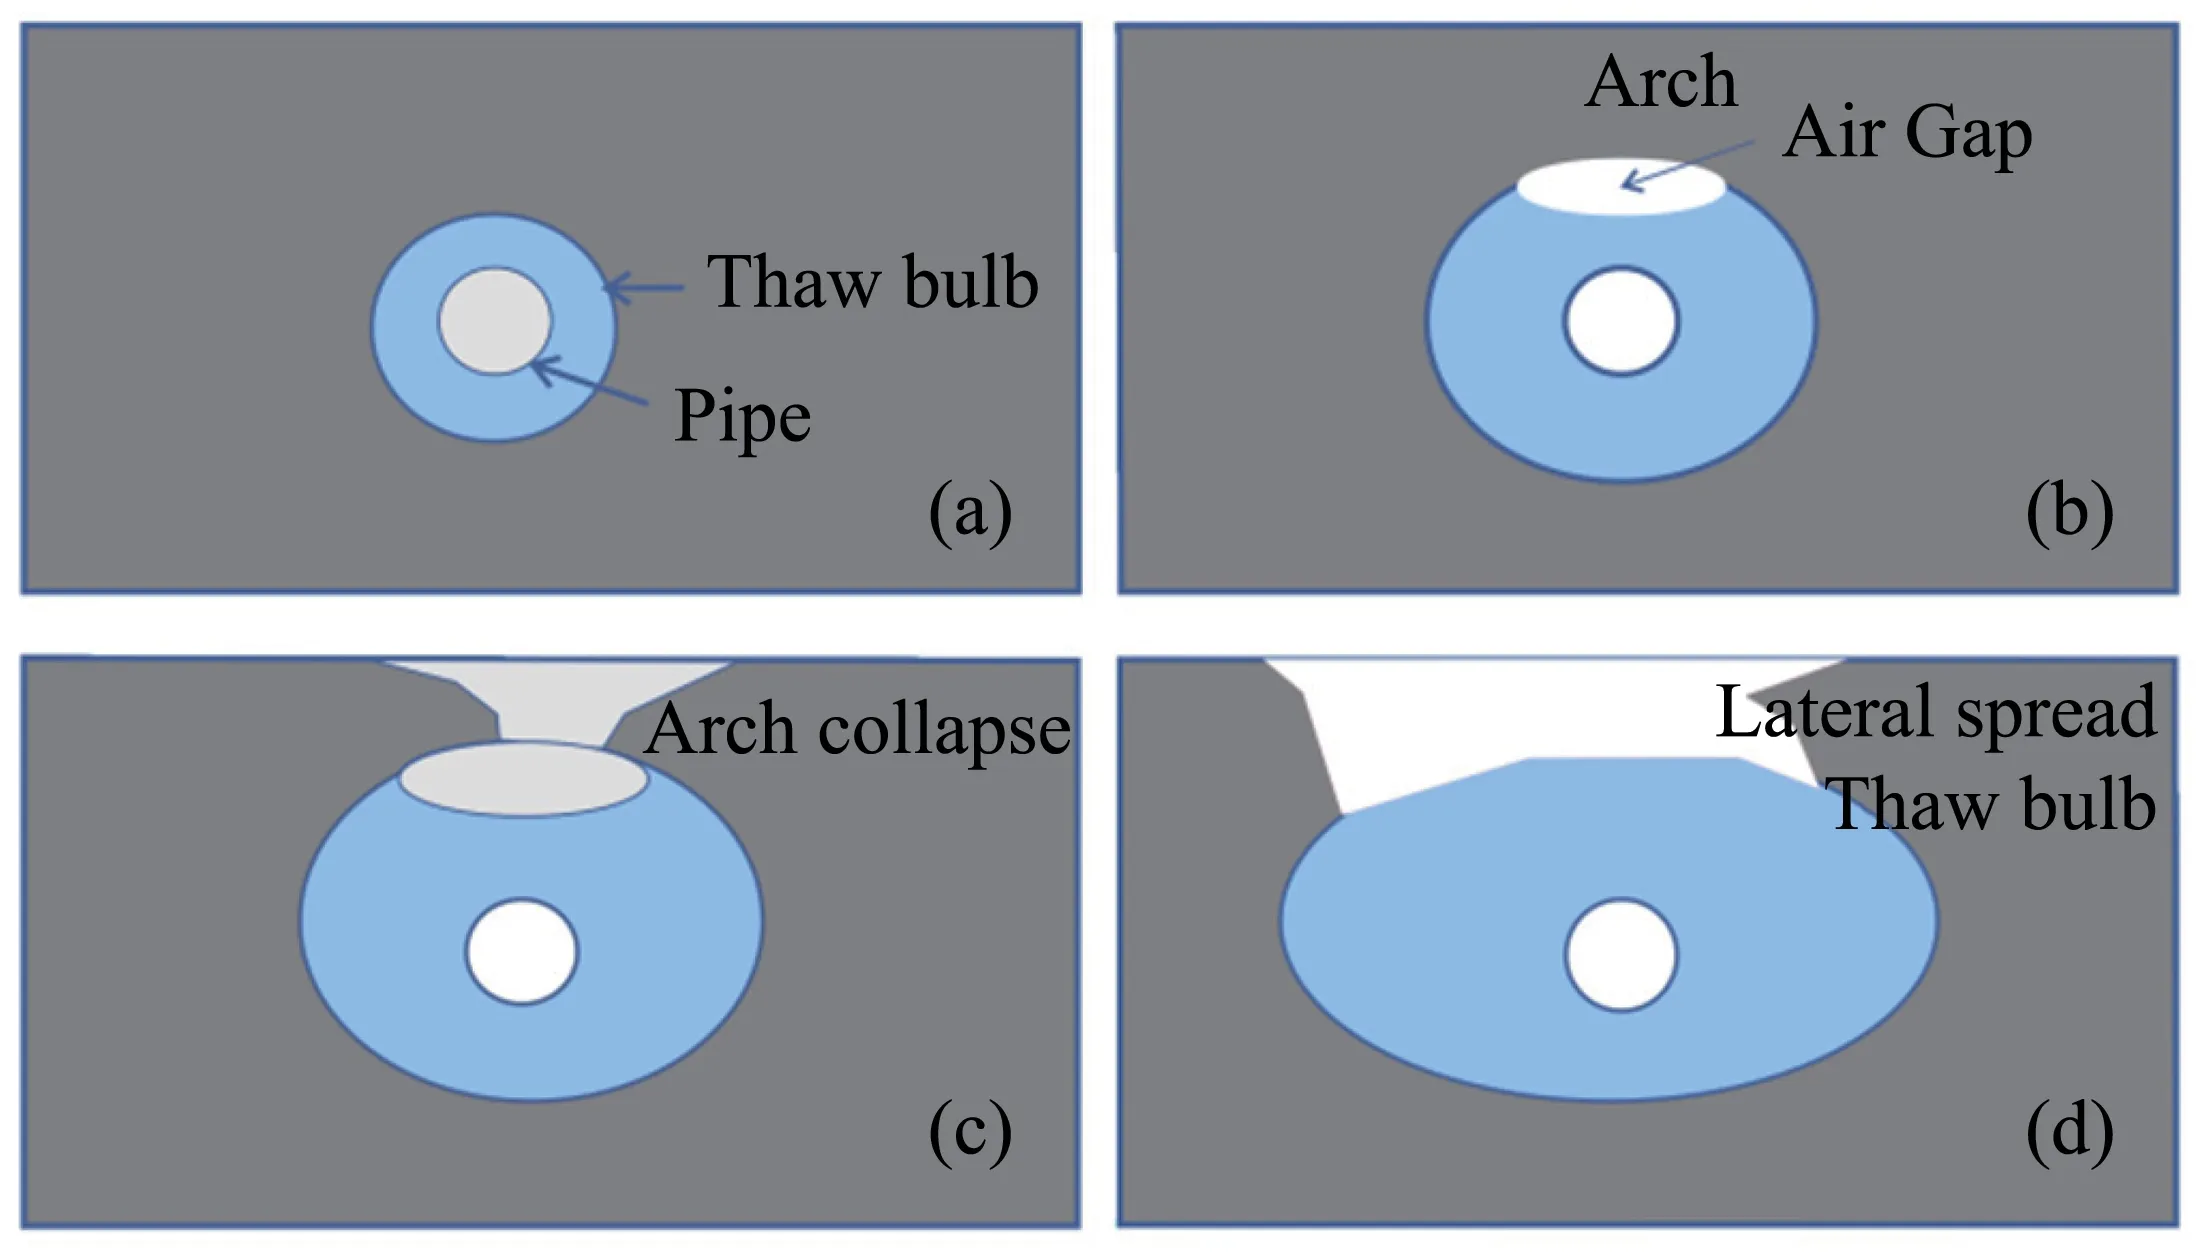
Figure 27 Conceptual thaw bulb development
This air gap may also form an open conduit for water flow in sloping areas.The overlying soil arch will collapse as the thaw bulb continues to expand laterally as presented in Figures 22 and 27c.The collapse of this arch will bring the outside air into contact with the top of the thawed material,as in Figure 27d,promoting further lateral expansion of the thaw bulb if the outside air is above 0 °C as pre‐sented in Figure 22.This arch collapse causes an in‐crease in the rate of thaw bulb advance in these two tests,and the reduction in the cyclic thaw settlement component.
The response of pipe B is constrained by the three sandbags cooled by the thermosyphons.Rate of thaw bulb advance,thaw settlement and collapse are rela‐tive smaller.
3.5 Pipeline B strain response
3.5.1 Total strain of pipe
Figure 28 shows the total average longitudinal strains recorded through the test duration.As can be seen,seven SGs responded on spin up and strains var‐ied throughout the test.SG 8 became partly debonded and did not work correctly and was not reliable during the test.The SG responses are from mainly thermal and flexural effects.Configurations of the SG bridges will reduce the effects of other loads,such as shear or axial forces,and some temperature effects.However,thermal strains from temperature differences between the pipe crown and invert will not be compensated.
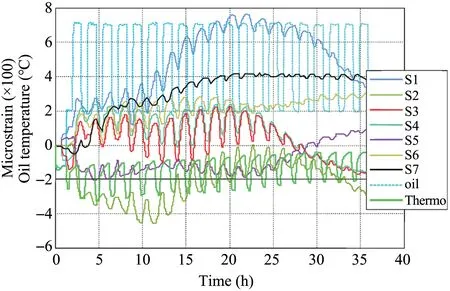
Figure 28 Strain gage response
3.5.2 Thermal strain
The initial jumps in SG readings as the pipe is first heated(at around the first two hours),and the cy‐clic variations in strains observed as the oil tempera‐ture is varied,are attributed to thermal effects.This cyclic variation is evident in Figure 29.
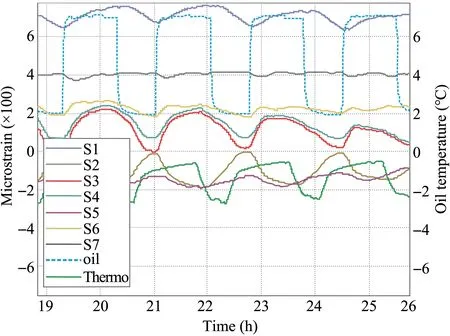
Figure 29 Zoomed strain gag e response
The correlation of strain cycles with change in oil temperature(Figure 29)is consistent with the verifica‐tion test carried out after centrifuge test by heating the oil in the unconstrained pipe section.SGs 1 and 7,and SGs 2 and 6 have the opposite polarity to the heat‐ing test;this is probably associated with the change in the thermal regime with a gap under pipe at mid spans between sandbag supports.The effect at SGs 3 and 4 is more pronounced and probably associated with an increase in differential temperatures by local thermo‐syphons.The cyclic strain components are also corre‐lated with the cycles in the settlement rates(mm/s),as both indicate changes in thermal conditions.
3.5.3 Flexural strain
The trends in the SG data are taken as indicators of bending strain in the pipe.In electrical terms,the alternating current (AC) components of the signals are associated with thermal strain,and the direct cur‐rent (DC) components with flexural strains.These flexural strains are a function of pipe curvature ac‐cording to bending theory.The total strain and defor‐mation profiles of the pipe are compared at 6-hour intervals in Figure 30.These profiles were zeroed after swing up and prior to heating the pipe.The pipe is sup‐ported on sandbags at −274 mm,0 mm and +274 mm(see Figure 6).The initial strain offsets at six hours and−220 mm are obviously associated with the change in thermal conditions as there has been no significant flexural deformation of the pipe at this time.
3.5.4 Pipe settlement profile
The pipe settlement profile in Figure 30 indicates a combination of global (rigid) and local (flexure) de‐formations.Flexural strain in the pipe is a result of lo‐cal deformations and not rigid body motion.The glob‐al pipe movements were assessed from a linear fit to the LVDT data near the three support points,Figure 30.The pipe indicates a relative thaw settlement of 4 mm,with up to 10 mm/m global rotation of the pipe due to differential settlement of the supports.This is equivalent to 5.5 mm differential settlement between the two external supports.
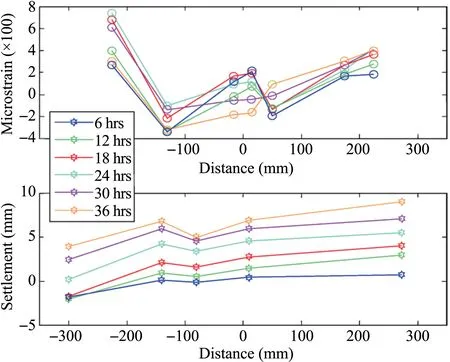
Figure 30 Strain and deformation profiles
3.5.5 Local displacement-flexural strain correlation
The local (flexural) pipe displacements correlate well to the associated strain measurements at SGs 1,2 and 6 accounting for thermal strain effects (Figure 31).SG 1 shows the largest strain response (Figure 28),and was not affected by changes in ambient tem‐perature.There is a very good correlation between lo‐cal deformations at LVDT 5082 and SG 1(Figure 31).Similarly,there is a good correlation between LVDT 61595 and SG 2,allowing for the initial 300 με ther‐mally induced decrease in strain at two hours.The correlation between LVDT 3032 and SG 6 is reason‐able,due to the longer span length,lower strain levels and absence of mid span settlement measurements.
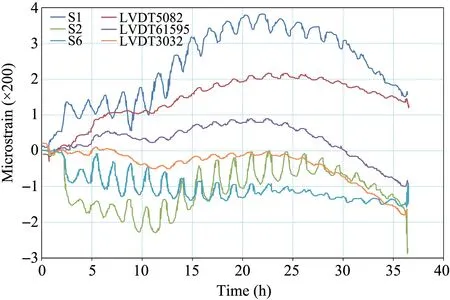
Figure 31 Local deformation comparison adjacent to SGs 1,2 and 6 for pipe B
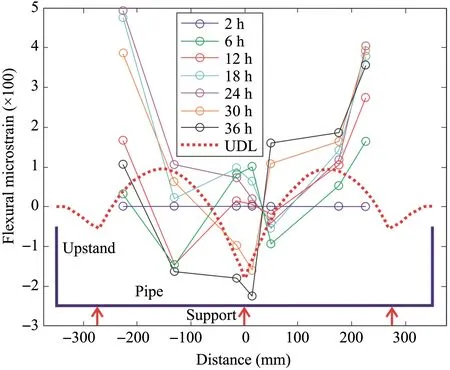
Figure 32 Flexural strain profile estimates
There is a maximum of 1 to 2 mm of measured mid-span deflection over 274 mm span adjacent to LVDT 5082 and LVDT 61595.A bending strain of 500 on 11.1 mm diameter pipe implies a radius of cur‐vature of 11.1 mm.That is equivalent to 0.85 mm over 274 mm chord length.The measured flexural de‐flections are therefore consistent with the strain levels measured.
The maximum total strain in SG 1 of about 750,is relieved after 22 hours as the soil arch collapses above the pipe center.
3.5.6 Pipe loading-flexural strain correlation
The flexural strain response of the pipeline was as‐sessed by accounting for thermal strains.The cyclic thermal strains were removed by fitting a ninth order polynomial to assess the strain trend.The initial ther‐mal strains caused by heating the pipeline were re‐moved by zeroing the strain data at two hours.The flexural strain profile estimates are presented in Fig‐ure 32 at six hour intervals.The estimated profiles are reasonably symmetric about the center support with maximum hog moment over this support and maximum sag moment close to each outer support.The maximum sag moment occurs between 18 and 24 hours,when the frozen arch collapses.
The estimated profiles can be compared to the strain profile shape expected from a uniformly distrib‐uted load (UDL) over the whole pipe length,as shown by the red dotted line (Figure 32).This com‐parison is for benchmarking only,as the actual pipe loading is not uniform and other loading mechanisms influence the pipe response.The comparison shows the estimated maximum sag moment is closer to the outer support than expected from UDL alone.This change may be due to a sag moment restraint acting on the upstands.The load level required to cause the 600 difference between the maximum sag and hog moments is estimated from the UDL profile.This dif‐ference only requires the equivalent of the self-weight of one pipe diameter depth of frozen material acting along the top of the pipe.The self-weight of the pipe is supported by the dense slurry formed by the thawed material.
The central support settled relatively more than the two end supports.The UDL loading analysis shows the central support carries 60% more reaction load than the end supports.This additional loading was the cause of the additional settlement.
4 Discussions
This study presented the results of a 1/73rd scale physical model test in a geotechnical centrifuge relat‐ed to CRCOP.Test conditions were well controlled and data was collected as planned.All the required test parameters,such as temperature,pipe settlement,pore pressure and strains have been recorded.The monitored data included thaw settlement of two pipe‐line sections,one unsupported and one supported,over a period simulating over 20 years of operation with seasonal oil and air temperature cycles.The sup‐ports,comprised of sandbags,under the pipe at the equivalent of 20 m spacing kept frozen by a pair of thermosyphons.
The 4.5 mm (equivalent to 330 mm) mid-length pipe settlement of the supported section was 45% of the 10 mm (equivalent to 730 mm) settlement of the unsupported section over 33 hours (equivalent to 20 years).These settlements were linearly associated with the growth of the thaw bulb below the slightly buoyant pipeline.Settlement for the unsupported sec‐tion was about 35% of the thaw bulb depth below the initial pipe elevation,which was consistent with the expected thaw strain from CAT scan measurements.The mid-span settlement of the supported pipe was less at 30% of the thaw bulb depth,which was also less extensive,due to the influence of the supports.After 20 years (33 hours model scale),the thaw bulbs extended about 3.6 and 1.6 times the pipe diameter under the initial pipe elevations,respectively.
Continued pipe settlements would occur due to the consolidation of the thawed material within the thaw bulb if the thawing stopped without refreezing.
The thaw bulb growth involved the formation of a void above the thaw bulb which initially insulated the frozen arch below the soil surface.This void may have no initial surface response,but could pos‐sibly be detected by ground penetrating radar or other geophysical tools.In sloping terrain,this void will act as a water culvert promoting the erosion of the thawed material and the arch.The arch collapsed as the void expanded.The warmer air temperatures then acted directly on the thaw bulb and promoted an increase in thaw and pipeline settlement rates for the unsupported pipe,but only in the thaw rate for the supported pipe.
The local(flexural)response of the supported pipe section was assessed by removing its rigid body settle‐ment and rotational motions.The flexural pipe strains were estimated by removing the mainly cyclic ther‐mal strain components.The measured flexural pipe strains were consistent with the local displacements in both magnitude and trends.The maximum local flex‐ural displacement was 150 mm (2 mm) at a bending strain level of around 500 με.These displacement and bending strains levels are equivalent to those cre‐ated by one pipe diameter depth of frozen material bearing under self-weight over the whole length of the supported pipe.The pipe sandbag supports re‐mained frozen throughout the test period.
Suggestions for design considerations for similar field conditions are based on the model test observa‐tions.The average global settlement of the supported pipe is about 45% of the unsupported one.However this reduction in global settlement causes an increase in the local (flexural) settlements of the supported pipe.This local increase reduces the pipe curvature and increases flexural strains in the supported pipe.
The model pipe strains were induced by the selfweight of some of the collapsing arch material bear‐ing on the pipe.This collapse may occur sooner in the field due to water flow along the pipe or surface load‐ing effects.The maximum bending stress induced over the 20 m span length from bearing of the cover over the pipe is equivalent to about 40%SMYS.If the internal pressure causes about 70% SMYS in the hoop direction,the addition of the bending stress will induce about 80% SMYS von Mises stress in the pipe locally considering effective compression in the pipe.The acceptable design limits for the pipe are unknown.
This effective compression is even higher consid‐ering the difference between the "as-laid" and the op‐erational temperatures of the pipe.This temperature difference of approximately 20 °C may cause upheav‐al buckling or perhaps downward buckling of the pipe as the vertical restraint is relieved (Palmeret al.,1990).Estimates show the buckling wavelength is most critical over four span lengths (80 m) due to the flexural rigidity of the pipe.The buckling load will de‐pend on the "out of straightness" of the pipe over these distances.Buckling may also be prevented due to the progressive and extensive nature of the thaw process allowing the pipe to elongate over significant distances.
The bearing stresses from the arched material act‐ing on the pipe will increase the bearing stresses un‐der the pipe on each sandbag support by about 1 MPa.The thermal insulation on the pipe may crush under these stresses.The EN 253 standard specifies a mini‐mum foam density of 60 kg/m3and a minimum com‐pressive strength at room temperature of 0.3 MPa when tested in the radial direction to 10% deforma‐tion (EN 253,2003).The specification of the foam on the pipeline should be confirmed.
Other mitigation and control schemes can be con‐sidered.A combination of measures may be required for an optimized solution.Two suggestions are oil chilling and foam injection based on the centrifuge test results and other pipeline experiences.These po‐tential measures need further investigation.
The 896 km Norman Wells Pipeline runs through the western Canadian Arctic and is a chilled pipeline buried in permafrost terrain.The oil is chilled by a refrigeration system before it enters the line at Nor‐man Wells,and operates at near-ambient permafrost temperatures (GSC,1999;ACIA,2005).This pipe‐line carries 25,000 bbls/day which is less than that of CRCOP.The temperature differential across the chiller is not known.The cost of cooling may be pro‐hibitive.However,the offshore oil industry has devel‐oped oil chillers on production platforms for compara‐ble flow rates and temperature differentials.
Compensation grouting with a low thermal con‐ductivity material,such as foam,would provide both a thermal barrier and lift the pipeline up to compen‐sate for thaw settlement.Foam injection is used exten‐sively for slab jacking,Soltesz (2002) reported two years of performance data of Uretek foam.Such a foam may displace the slurry under the pipe,fill the overlying void,lift the pipe if sufficient material is placed,provide thermal insulation between the pipe and permafrost reducing thaw settlement,and in‐crease the pipe bearing area.Foam injection would be easier to implement than 5-meter-deep excavations to install the sandbag props.
5 Conclusions
A physical centrifuge test related to the CRCOP pipeline were carried out to investigate the thaw settle‐ment response of buried pipeline stabilized by thermo‐syphon cooled sandbags.Temperature,pipe settle‐ment,pore pressure and strains have been successful‐ly recorded during the test.Some conclusions are drawn as follows based on the monitored data.
The pipe settlement of the supported section was 45% of the settlement of the unsupported section over 20 years.These settlements were linearly associated with the growth of the thaw bulb below the pipeline.The settlement for the unsupported section was about 35% of the thaw bulb depth below the initial pipe ele‐vation.The settlement of the supported pipe was less at 30% of the thaw bulb depth due to the influence of the supports.After 20 years (33 hours equivalent in the test),the thaw bulbs extended approximately 3.6 and 1.6 times the pipe diameter below the unsupport‐ed and supported initial pipe elevations,respectively.
The thaw bulb growth involved the formation of a void above the thaw bulb.In sloping terrain,this void will act as a water culvert promoting the erosion of the thawed material and the arch.The arch collapsed as the void expanded,and promoted an increase in thaw and pipeline settlement rates
The support comprised sandbags under the pipe remained frozen by a pair of thermosyphons over a period simulating over 20 years of operation.
The maximum bending stress induced over the 20 m span length from bearing of the full cover over the pipe is equivalent to 40% SMYS.The maximum local flexural displacement was 150 mm (2 mm) at a bend‐ing strain level of around 500 με,removing mainly cyclic thermal strain components.
Acknowledgments:
This work was supported by the Strategic Priority Re‐search Program of Chinese Academy of Sciences(XDA20030201),National Natural Science Founda‐tion of China (41672310),the National Key Research and Development Program (Nos.2017YFC0405101 and 2016YFC0802103),and the Research Project of the State Key Laboratory of Frozen Soil Engineering(SKLFSE-ZY-20).Authors thank these financial sup‐ports and also warmly express thanks for Ryan Phil‐lips,Gerry Piercey,Ken Chi,Karl Tuff,Derry Nicholl and Karl Kuehnemund in C-CORE in Canada for their kind help to design and carry out the test.
 Sciences in Cold and Arid Regions2021年3期
- Sciences in Cold and Arid Regions的其它文章
- A concise overview on historical black carbon in ice cores and remote lake sediments in the northern hemisphere
- Summary of research on frost heave for subgrade in seasonal frozen ground
- Overview of an early warning system for Glacial Lake outburst flood risk mitigation in Dudh-Koshi Basin,Nepal
- Temporal changes in seasonal precipitation over the Sahara Desert from 1979 to 2016
- Changes in morphology and soil nutrient patterns of nebkhas in arid regions along a precipitation gradient
- Linkages between soil microbial stability and carbon storage in the active layer under permafrost degradation