
A concise overview on historical black carbon in ice cores and remote lake sediments in the northern hemisphere
2021-07-30 01:11PoonamThapaJianZhongXuBigyanNeupane
Poonam Thapa ,JianZhong Xu ,Bigyan Neupane
1.State Key Laboratory of Cryospheric Science,Northwest Institute of Eco-Environment and Resources,Chinese Academy of Sciences,Lanzhou,Gansu 730000,China
2.University of Chinese Academy of Sciences,Beijing 100049,China
3.Department of Environmental Science and Engineering,Fudan University,Shanghai 200433,China
ABSTRACT Black Carbon (BC),as a driver of environmental change,could significantly impact the snow by accelerating melting and decreasing albedo.Systematic documentation of BC studies is crucial for a better understanding of its spatial and temporal trends.This study reviewed the BC studies in the ice core and remote lake sediments and their sources in the northern hemisphere.The literature surveyed points to around 2.9 to 3.7 times increase of BC in the European Alps and up to a three-fold increase of BC in the Himalayan-Tibetan Plateau (HTP) after the onset of industrialization in Europe and Asia,respectively.BC concentration from Greenland ice core showed seven times increase with an interrupted trend after 1950's.South Asian emissions were dominant in the HTP along with a contribution from the Middle East,whereas West‐ern European and local emissions were responsible for the change in BC concentration in the European Alps.In the Arctic,contributions from North America,Europe and Asia persisted.Similarly,a historical reconstruction of lake sediments re‐cords demonstrates the effects of emissions from long-range transport,sediment focusing,local anthropogenic activities,precipitation and total input of flux on the BC concentration.
Keywords:black carbon;ice core;lake sediment;Himalayan-Tibetan Plateau;Arctic;European Alps
1 Introduction
Carbon combustion products are generally classi‐fied into organic carbon (OC) and black carbon (BC)(Qianet al.,2015).BC is a specific kind of carbona‐ceous substance produced from incomplete combus‐tion of fossil fuel and biomass burning (Ghan and Penner,1992;Hammeset al.,2007;Petzoldet al.,2013;Gaoet al.,2016).Biomass burning and com‐bustion of fossil fuel have been the primary sources of BC since the 19thcentury (Goldberg,1985).Because of their small size,they can hover as airborne parti‐cles for days to weeks(Druffel,2004).The global dis‐tribution of BC is not uniform and is highly correlated to proximity to emission sources (Kaspariet al.,2011).The widespread occurrence of BC in atmo‐sphere in increased amount can be traced to the begin‐ning of the industrial revolution (Wik and Natkanski,1990;Muriet al.,2002b).The impact of BC on cli‐mate is not bound to specific regions.BC is ubiqui‐tous and cannot be considered restricted to certain re‐gions such as the Arctic since it can alter the air quali‐ty from the point of origin to the inter-regional dis‐tances (Rose and Ruppel,2015).BC can exist as chars or soot,the two subtypes of BC.Chars are usu‐ally large particles that get deposited within a short distance from the source of emission,whereas soots are tiny particles,measured in sub-micrometer,capa‐ble of distant transport to a larger extent.
BC's sources and properties differentiate it from other organic carbons,making it a significant marker of anthropogenic activities;its optical properties could influence the Earth's radiative heat balance by absorbing sunlight effectively (Andreae,2001).Four properties of BC make it of interest to climate scien‐tists:strong visible light absorption,refractory in nature with a vaporization temperature of almost 4,000 K,strong aggregate morphology of small carbon spher‐ules,and water insolubility in many other common or‐ganic solvents (Bondet al.,2013;Petzoldet al.,2013).Due to these properties and direct radiative forcing,it is regarded as the second most important factor contributing to global warming after carbon di‐oxide (Ramanathan and Carmichael,2008;Zhanget al.,2017).Additionally,BC can impact the climate by absorption and scattering the radiation,distorting cloud properties and impacting snow from its deposi‐tion.These effects collectively enhance a net warming effect on the Earth's climate(Bondet al.,2013).
Due to the quantifiable effect on the atmospheric processes,there is a growing realization on BC among the scientific community.BC has a long retention time in the atmosphere,and its microscopic size en‐ables it to be transported away from the source of emission.BC in aerosol form is the main light-absorb‐ing constituent,not only absorbing solar radiation but also warming the atmosphere before being deposited.Once deposited,it aids in darkening the surface of ice and snow,leading to more heat absorption.As a re‐sult,there is a significant reduction in albedo and ac‐celeration of melting of snow and ice (Flanneret al.,2007).These aerosols also interplay with the radiation to cause both cooling and warming effects.Scattering of short wave radiation before reaching the earth's sur‐face leads to the cooling effect while particles'absorb‐ing long wave radiation emitted from the earth back to the atmosphere brings about the warming effect(Shresthaet al.,2010).Further,Baronet al.(2009)re‐port that BC converts UV to infrared that is radiated back to the atmosphere,causing atmosphere warming at higher altitudes and cooling effects on the surface and resulting in a lower temperature in the lower at‐mosphere.This can be backed by the Himalayas sce‐nario where the warming of the atmosphere and ice sur‐face darkening are considered to be a cardinal reason in rapid glacier retreat (Xuet al.,2009a).Several stud‐ies have pointed out the presence of BC in the Europe‐an glaciers,North America,and the Himalayas beside the Arctic (Jenket al.,2006;Xuet al.,2009a;Limetal.,2017;Kaspariet al.,2020).Even if historical emis‐sions inventories are available,they may not be uni‐form around the world.Environmental archives might play a crucial role in assessing the temporal trend of BC,although the transport and depositional process may have site-specific influences(Ruppelet al.,2013).
BC from the atmosphere is accumulated by wet and dry deposition (Muriet al.,2002b).Studies have suggested that the BC deposition impact in snow and ice should be considered as an element of climate forcing(Minget al.,2013).For instance,Menonet al.(2010) demonstrated based on a numerical model that from 1990 to 2000,approximately 0.9% of Himala‐yan snow and ice disappeared,where BC tentatively contributed to 36% of the disappearance.The Tibetan Plateau (TP),also called the "third pole," holds the largest mass of ice after the Polar Regions,but it has received less scientific attention.Since radiative forc‐ing over the snow and ice averages 1.5 W/m2,the TP can no longer be ignored as a climate forcing(Flanneret al.,2007).Historical accumulation of BC and flux can be studied from glacier ice as they provide invalu‐able archives of deposition of atmospheric pollutants.Similarly,lake sediments also serve as a proxy for the deposition history of BC and have been examined in several studies (Muriet al.,2002b;Muriet al.,2003;Conget al.,2013;Hanet al.,2015;Ruppelet al.,2015;Neupaneet al.,2019).Layers of sediments of‐fer a continuous record of atmospheric events and conditions showing a long-term variation of environ‐mental conditions.Also,studies on BC in lake sedi‐ments will be discussed here.
The term BC is often interchangeable with ele‐mental carbon (EC) as they are proxies for the same emissions (Hammeset al.,2007;Grahameet al.,2014).However,BC is formed from incomplete com‐bustion in an anoxic environment,whereas EC is of‐ten referred to as carbon fraction measured after aero‐bic oxidative combustion above a certain temperature(Shresthaet al.,2010).Besides,Lacket al.(2014)states that BC is used in referring to carbonaceous par‐ticulate matter assessed using any of the methods of measuring amounts of solid,light-absorbing,refracto‐ry graphitic carbonaceous material in ambient air as well as material that is insoluble in water and com‐mon organic solvents.For atmospheric sciences,Bondet al.(2013) defined BC as a distinct type of carbonaceous material formed in flames,incorporat‐ing a unique combination of physical properties.When measuring emissions from the same source,the limited existing data display that the measurements are in good correlation when establishing a relation‐ship between BC and EC(Janssenet al.,2012;Salakoet al.,2012).Both terminologies are used in atmo‐spheric sciences as well as soils and sediments.How‐ever,generally,the term EC has been used quite often in atmospheric sciences,and BC is widely used in the study of soil and sediments (Hammeset al.,2007).Occasionally,EC was also applied in the study of sed‐iments(Hanet al.,2007).Nevertheless,the terminolo‐gy BC will be used in this study as much as possible.
Systematic and scientific documentation of BC studies over the past few decades is crucial for under‐standing its spatial and temporal trends.This study focuses on the status of BC deposition in ice core and remote lake sediments and relates it with the BC concentration measured before and after the Industri‐al Period.A comprehensive summary of the existing research of BC in ice cores and remote lake sedi‐ments in the northern hemisphere is provided first.Subsequently,the temporal trends of BC deposition in ice cores and remote lake sediments are examined,and a systematic documentation of BC in back‐ground sites from the preindustrial era to the modern time is provided.This study aims to elucidate the changing concentrations of BC via historical recon‐struction and present a brief summary of the various methods employed.
2 Analytical methods
There are no standard methods for measuring BC.Each of these existing methods comes with bias and uncertainties (Bondet al.,2013),which makes mea‐surement an important factor to consider.Several ana‐lytical methods have been employed for the measure‐ments of BC in different studies.For both ice and lake sediment cores,pretreatment of the samples is crucial in getting the only desired fraction of BC to be quanti‐fied.It is essential in sediments to separate inorganic minerals and thermally unaltered organic carbons that come along the sediments(Rose and Ruppel,2015).
Based on the resistance to break down into other forms of organic carbon,pre-treatment and thermal methods have been employed in analysing BC concen‐tration (Hammeset al.,2007).Existing methods for measuring BC include visual (Goldberget al.,1981),microscopy,light induced incandescence-based single particle (Chellmanet al.,2018),thermal oxidation(Muriet al.,2002a),thermal-optical transmitance/re‐flactance (Hanet al.,2007;Khanet al.,2009),and chemical oxidation (Gustafssonet al.,1996).However,pioneer work in quantifying the BC in sediments was based on visual approaches (Goldberget al.,1981;Saldarriaga and West,1986).After the visual methods were found to be inefficient in analysing certain proper‐ties of BC,several other methods were introduced,in‐cluding the widely used chemo-thermal oxidation(CTO) method (Gustafssonet al.,1996;Gustafssonet al.,2001).This method incorporates the following three steps:inorganic carbonates removal with the aid of acidification,removal of nonpyrogenic organic car‐bon,and finally quantification of residual carbon (i.e.,BC) (Gustafssonet al.,2001).It can differentiate be‐tween char and soot and is best in quantifying the BC in its most condensed forms.However,it's ability to analyse BC is compromised when the presence of low condensed char BC affects the BC continuum(Hammeset al.,2007).Another widely used approach is the thermal-optical method,which applies different temperatures in a controlled environment to separate fractions of carbon,viz,four organic carbon,three black (elemental) carbon and one pyrolyzed carbon fraction which are defined by temperature protocol,ox‐idation and laser reflectance (TOR) or transmitance(TOT) (Hanet al.,2007).The single particle soot pho‐tometer (SP2) is one of the best method for measuring low concentration of BC in snow-ice.SP2 is based on real-time measurement of refractory BC,and it's advan‐tage over the thermal-optical method includes a low de‐tection limit and fast and continuous analysis with no interference from organic carbon(Limet al.,2014).
3 BC in ice cores
Glaciers and ice sheets have served as the best ar‐chive of atmospheric constituents.Lavanchyet al.(1999) claim their study to be the first to present the history of BC deposition over the last 200 years from European alpine ice core.However,some studies of snow and ice cores from Greenland had already been reported earlier (e.g.,Chýleket al.,1987;Chýleket al.,1995).Polar ice cores have yielded long-term in‐formation about atmospheric change and global emis‐sion,which reveals the earth's climate and historic at‐msopheric composition over several thousand years(Hammeret al.,1997).Similarly,high alpine glaciers also provide the information covering several hundred years due to their high accumulation rates and rela‐tively small volume (Lavanchyet al.,1999).These studies motivated similar work in other parts of the world,as evidenced by the attention drawn to the Ti‐betan Plateau and Himalayas.This section will high‐light the studies of BC in ice cores from different parts of the northern hemisphere,and Figure 1a shows the location of the BC ice core records.
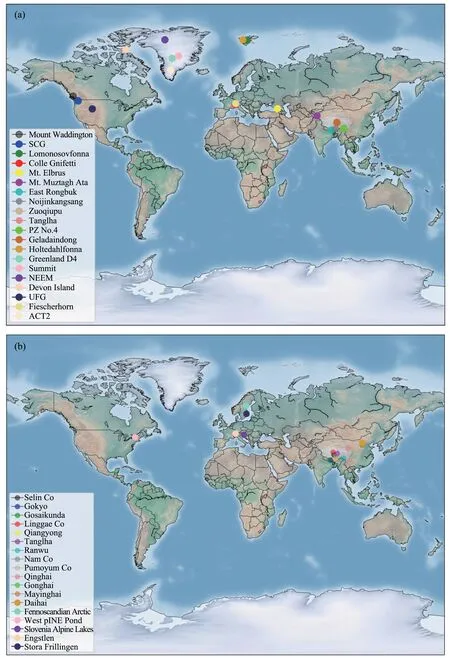
Figure 1 Map showing the locations of BC.(a)ice core records,and(b)lake sediment records
3.1 Himalayas and Tibetan Plateau (HTP)
The HTP lies in the mid-latitude region and is con‐sidered a water tower of Asia,stretching from the Pamir and Hindu Kush in the west to the Hengduan Mountains in the east,Kunlun and Qilian mountains in the north to the Himalayas in the south (Yaoet al.,2012).The Himalayas is located in the southern mar‐gin of the Tibetan Plateau extending 2,500 km eastwest.Most of the world's reputed mountains above 8,000 m falls in the HTP region (Yaoet al.,2007).This region shares its border with the progressively developing regions such as East China,South and Central Asia.For the close relationship between the economic development and industrial progression and pollutant emission,it is crucial to study this "third pole"region to understand the BC deposition in snowice.Being in a unique location and having a large mass of snow and ice,the HTP serves as a ground for inter‐action among the atmosphere,hydrosphere and cryo‐sphere and offers a sensitive and tangible indicator of climate change(Xuet al.,2009a;Yaoet al.,2012).
A few studies in the HTP region(Minget al.,2008,2013;Xuet al.,2009a,2009b;Jenkinset al.,2016) re‐ported the concentrations of BC in ice cores,which al‐low the examination of the regional BC trend.BC con‐centration and its trend are shown in Figure 2.Minget al.(2008) presented a detailed study on East Ronbuk Glacier(ERG)of the Mt.Everest region in the high Hi‐malayas and reported a variation of BC concentration for the last 50 years.Their results show that the concen‐tration varied greatly from mid-1960's to mid-1970's,with a mean of 16 µg/kg from the commencement of the industrial era to 1976,which increased to 20.3µg/kg in the period of 1995 −2002,demonstrating a signifi‐cant increasing trend.Further,ERG ice core of Mt Everest's northern slope from early pre-industrial times to the new millennium (1860−2000) indicated 3 times BC increase from 1860−1975 to 1975−2000 (Kaspariet al.,2011).The historical reconstruction of BC from ice core since the 1950s suggested that the BC concen‐tration in the TP were highest during the period of 1950 to the 1960s (Xuet al.,2009a),but Himalaya cores re‐veal that the increased concentration occurred in recent few decades (Minget al.,2009;Xuet al.,2009a).Al‐so,Yaoet al.(2012) reports the BC concentration of ice cores in the TP,which agrees with Xuet al.(2009a)and shows a dramatic increase after the 1980's.
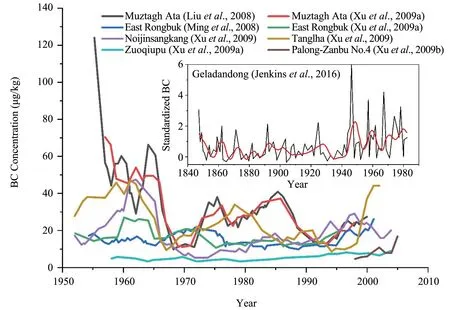
Figure 2 Historical BC reconstruction by ice cores in the HTP region
The differences in the temporal trend of BC depo‐sition have been attributed to various sources of emis‐sion and transport.The pollutants in the HTP were credited to European BC sources until some historical emission inventories and modeling came into light,suggesting South Asia as a major source region along with a limited contribution from the Middle East(Bondet al.,2007;Xuet al.,2009a;Kaspariet al.,2011;Kopaczet al.,2011).Minget al.(2013,2009)further support this observation and suggest that the Indo-Gangetic Plain (IGP),Sichuan Basin,Pakistan,Bangladesh and Central Asia be notable emitting sources,as supported by the presence of thick aerosol loading in the atmosphere over these regions.The ar‐eas in proximity to the HTP are emerging sources of atmospheric pollutants leading to an increased deposi‐tion of BC (Kanget al.,2019).Westerlies wind dur‐ing the winter and summer monsoons is also consid‐ered other systems influencing the surrounding of the HTP due to BC emissions.For the Himalayas,fossil fuel and biomass burning have almost equal contribu‐tions (46% and 54%,respectively),which can be at‐tributed to IGP sources.In contrast,the northern TP receives 66% BC from fossil fuel combustion corre‐sponding to Chinese sources (Liet al.,2016).Besides the transport from emission sources,the HTP itself has a complex terrain and complicated geographical features and many glaciers in the hinterland,where significantly high BC concentrations have been re‐corded (Minget al.,2013).The strong melting of the glacier surface is likely responsible for BC enriching and high BC concentration.This observation is sup‐ported by Minget al.(2013),who found that BC in the snow surface in some glaciers could accumulate and displayed high concentrations during melting.On the contrary,in the elevated Himalayas,low tempera‐tures possibly prevent snow from melting and pre‐serve BC concentration.
The GEOS-Chem model was employed to analyze the origin of BC that reaches the HTP (Kopaczet al.,2011).The results demonstrated seasonal and spatial variation with a lower concentration in summer.This study identified that northern India,Nepal and southeastern China contribute the majority of BC emis‐sion to the Himalayas,along with Africa due to bio‐mass burning during dryseasons.BC in the glaciers of the TP is dominated by the emissions from west‐ern and central China,Middle East and India,cata‐lyzing warming in the HTP region.In brief,BC con‐centrations were relatively high in the 1950s to the 1960s but decreased in the 1970s to the 1980s.This is especially true on those glaciers influenced by long-range atmospheric transport from Europe (Xuet al.,2009a),all thanks to the "Clean Air" policies enacted during that period.However,BC concentra‐tions increased again during the latter 1980s to the 1990s,which corresponded to the economic boom‐ing phase during industrialization in south Asia.Sim‐ilarly,Minget al.(2008) observed similar increases in BC concentrations after 1980 −1990 through the cores from the East Rongbuk Glacier near Mt.Ever‐est.Based on real-time observation and simulation,aerosols from south Asia in monsoon,northern India during non-monsoon and some contributions from northwestern India during pre-monsoon season were transported over the Himalayas (Chenet al.,2018).Recent modeling assessment confirmed that the an‐thropogenic BC over the TP was originated from south Asian,which contributed 10%−50% and 40%−80%during monsoon and non-monsoon seasons,respec‐tively(Yanget al.,2018).
3.2 European Alps and North America
European Alps are the mountain range stretching about 1,200 km in the east −west direction and lies across some major economies such as France,Swit‐zerland,Italy,Austria and Germany along with Mo‐naco and Slovenia.Grove (2004) suggested that Eu‐ropean Alps between the 13thto mid 19thcentury were more extensive than it's present form,and the glaciers retreated rapidly after the mid 19thcentury.The glaciers at high altitudes offer information on changes in the environment.Colle Gnifetti glacier,located on the Swiss-Italian border,is a much-stud‐ied glacier in the Alps and is identified as suitable for long-term records (Thevenonet al.,2009) along with some other glaciers in the region.In recent years,a few long ice cores have been analyzed in the European Alps (Siglet al.,2018),Caucasus(Limet al.,2017),and in North America (Chellmanet al.,2017;Kaspariet al.,2020),in addition to short ice core BC reconstruction (Neffet al.,2012).The BC concentration over the years are presented in Figure 3,where,one can see an increasing trend after the 1850s,followed by a sharp surge during the early to mid-1900s and a gradual decrease during late 1900s.
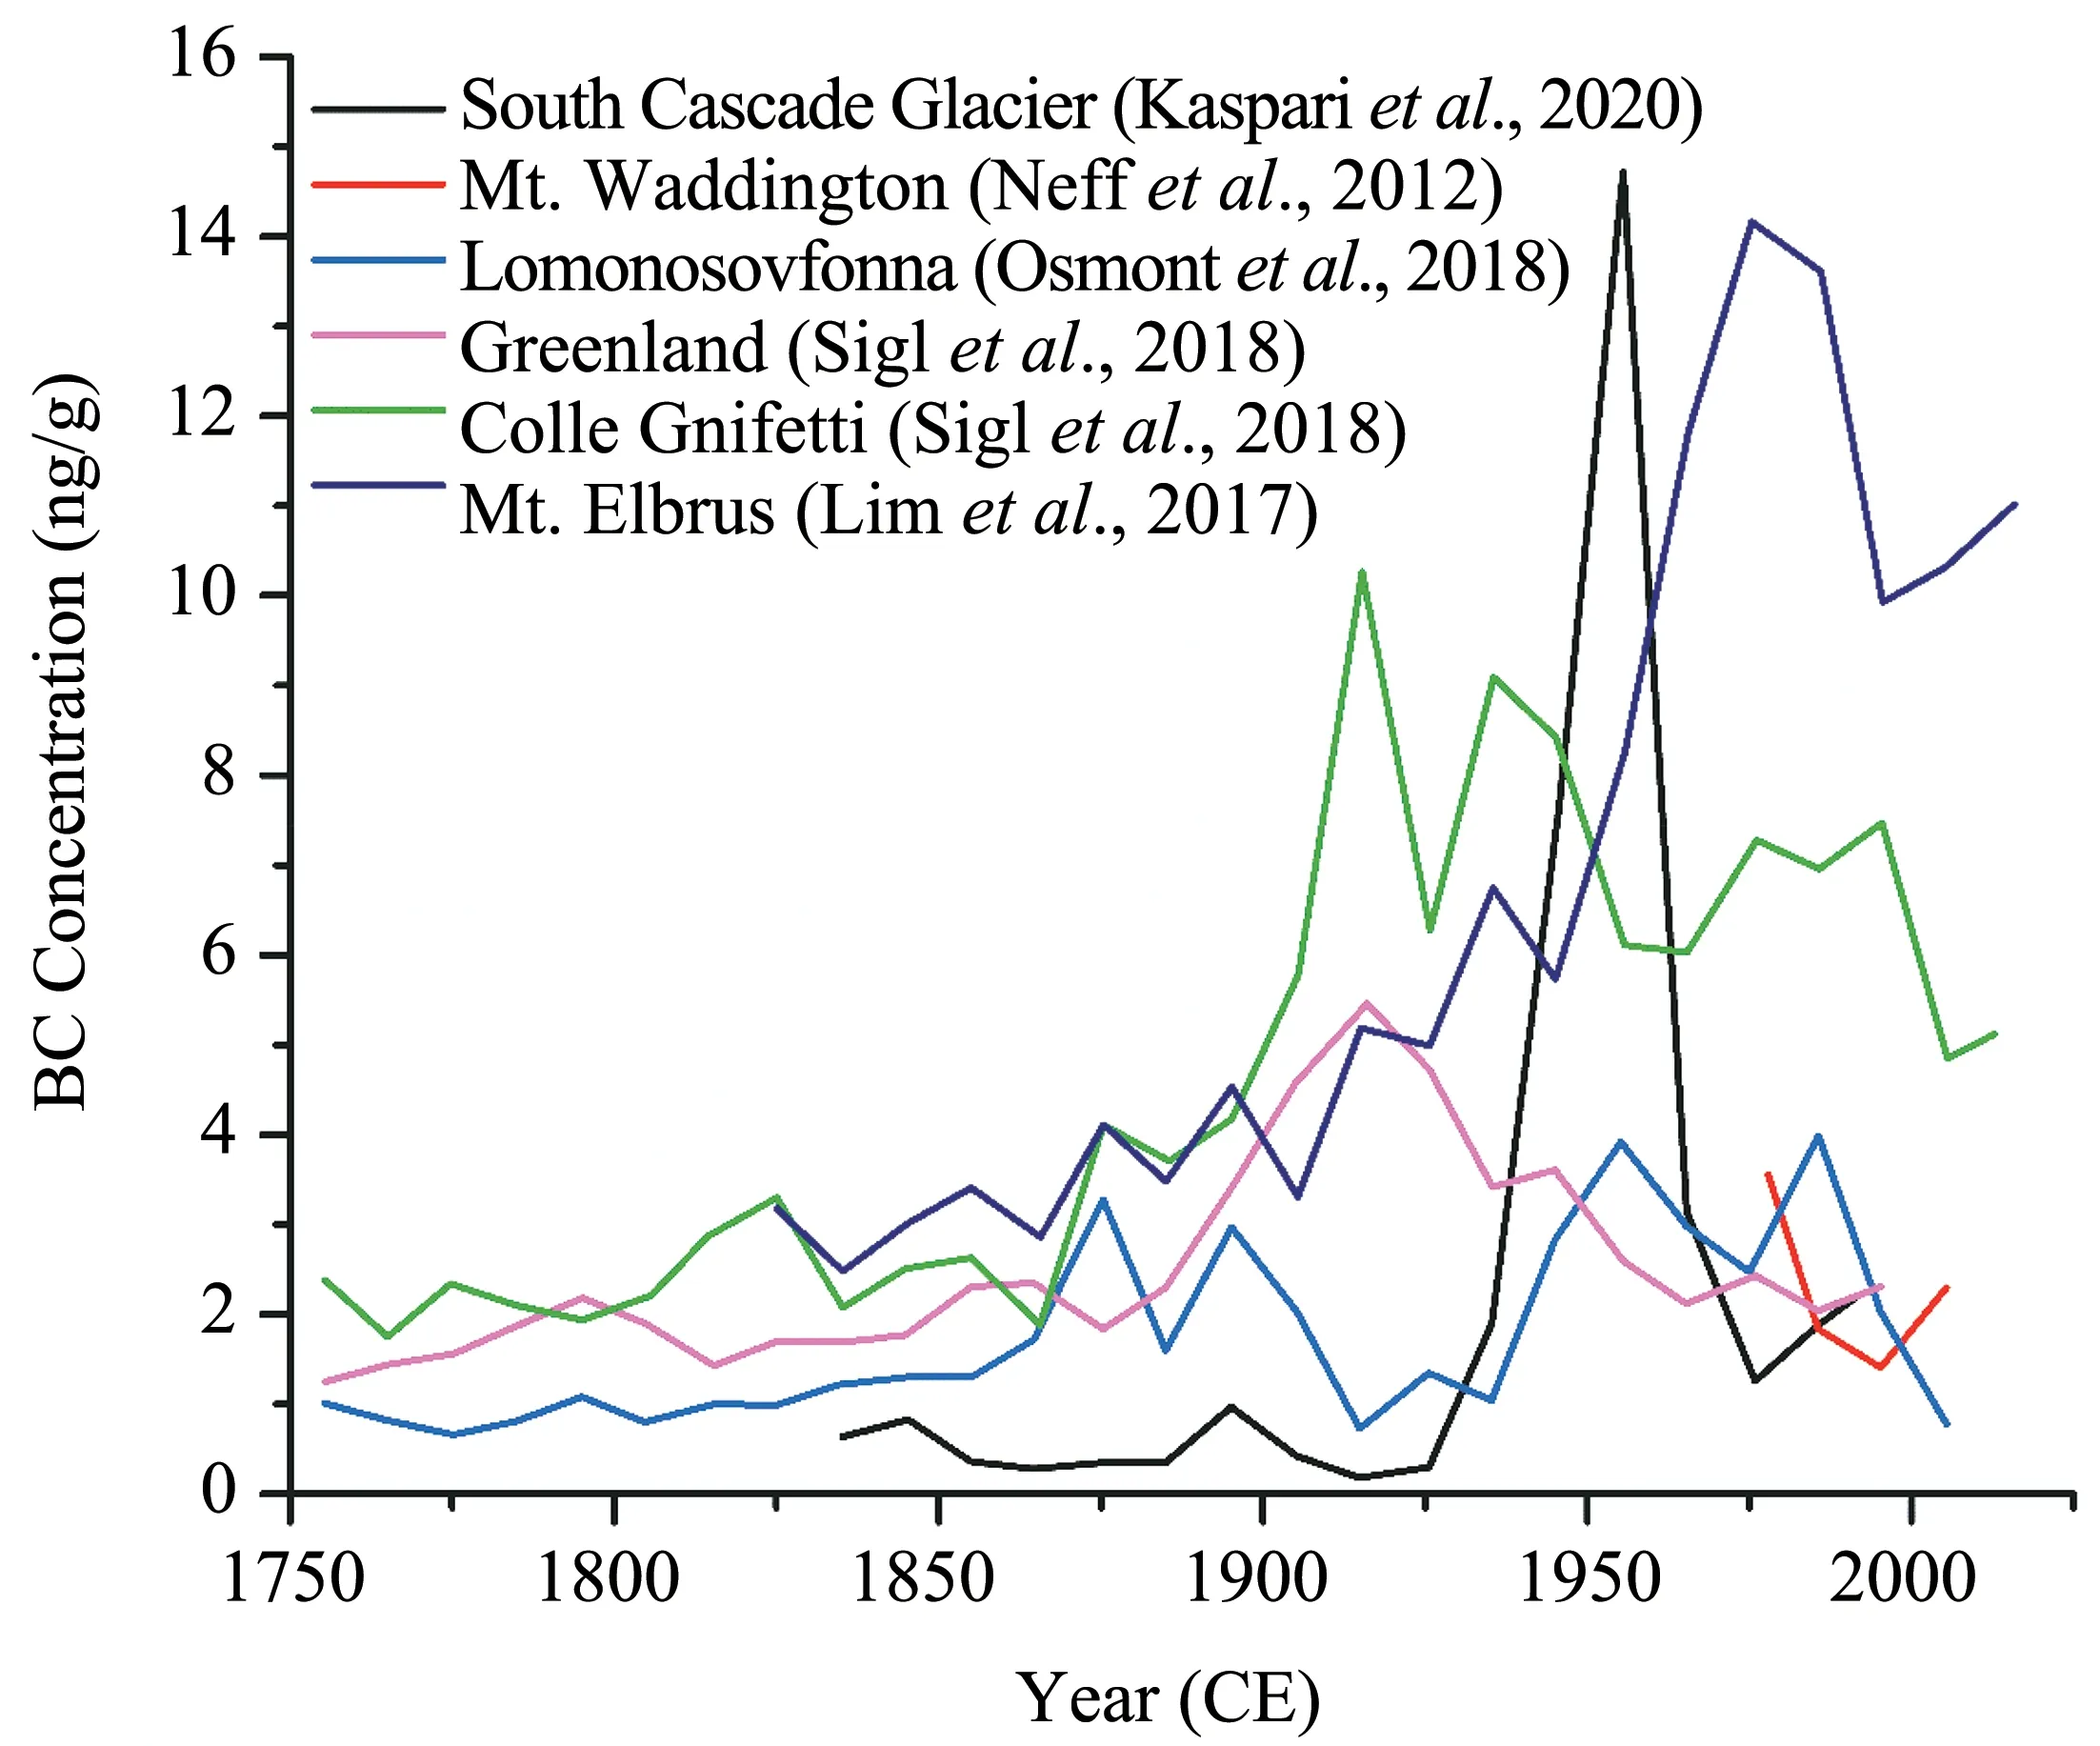
Figure 3 Historical BC reconstruction in the ice cores of Europe,Greenland,North America and the Caucasus
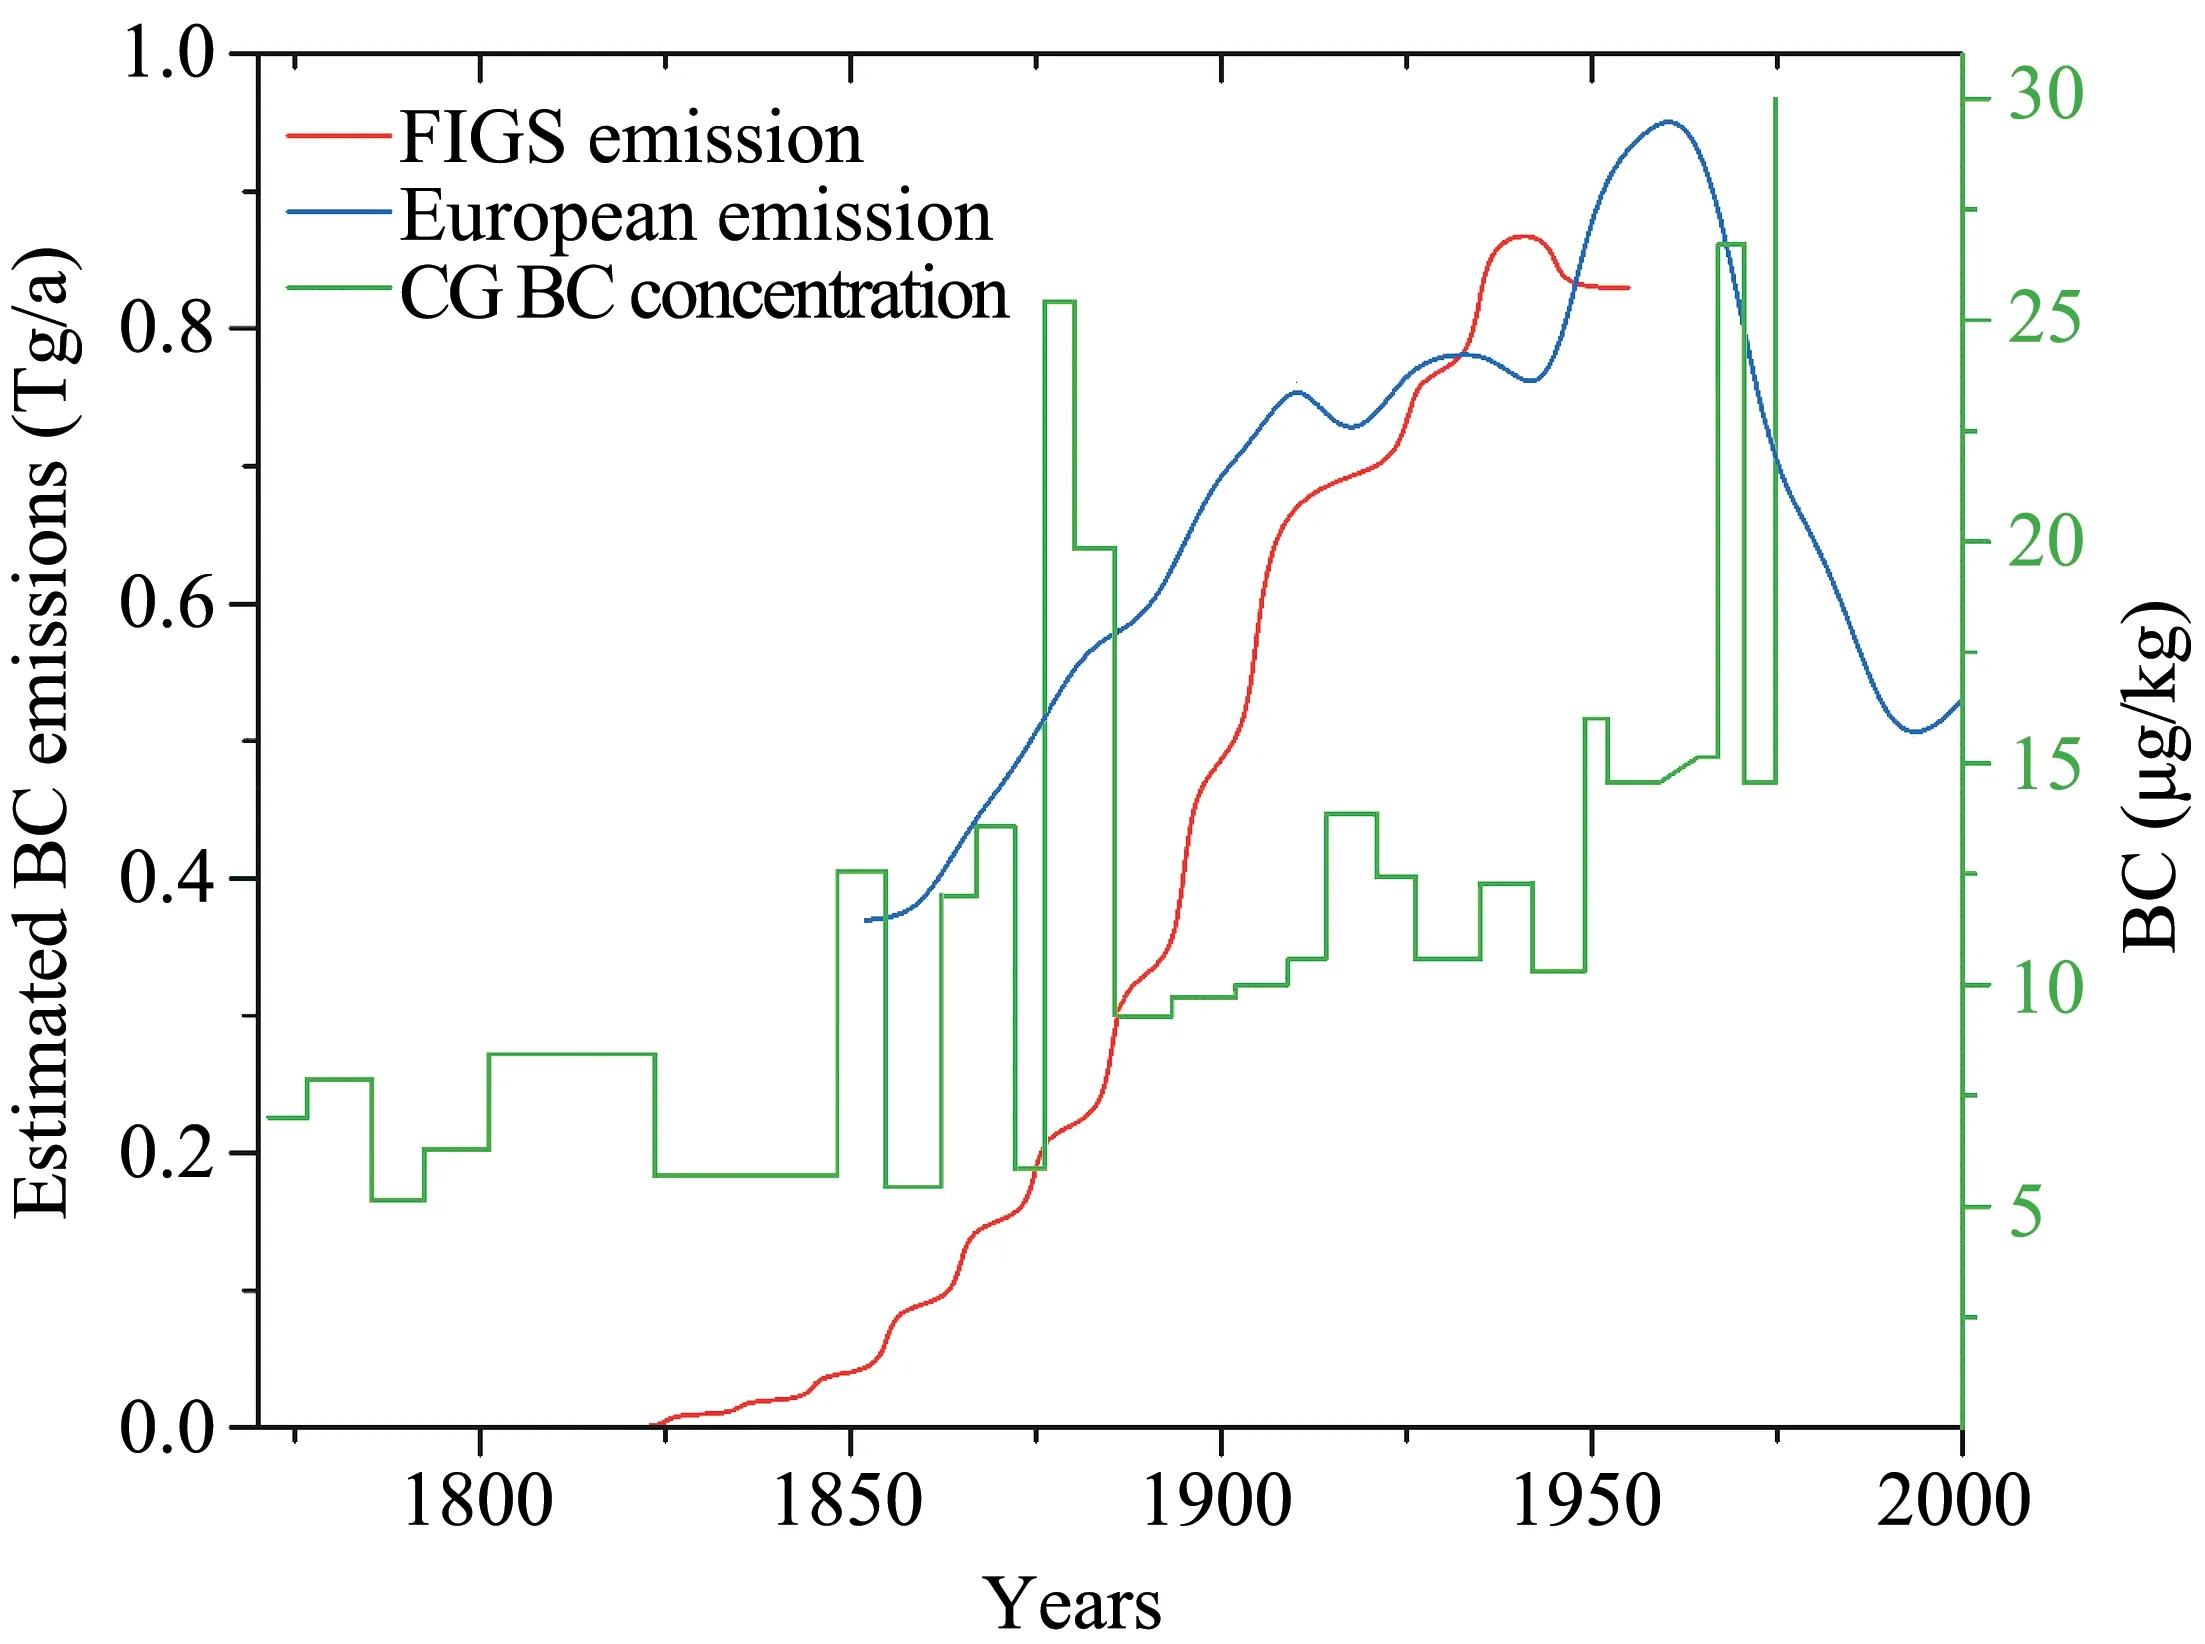
Figure 4 Estimated emission from France,Italy,Germany and Switzerland(FIGS),European emission and BC trend of
Lavanchyet al.(1999)analyzed the BC concentra‐tion in Monte Rosa,Colle Gnifetti from 1755 to 1975 and found it increased by a factor of 3.7 from pre-in‐dustrialization (1755−1890) to 1950−1975.Based on evidence from Western Europe,they attributed this in‐creasing trend to the BC emission from Switzerland,Germany,France and Italy.Further,another study by Thevenonet al.(2009)provided a long-term record of BC along with the concentration variation due to shift of the energy source.Both studies assert the regional scale anthropogenic activities' impact on historical BC concentration.From the preindustrial era to the modern time (1950−1980),BC increased from 7 µg/kg to 20 µg/kg,or by 2.9 times,as energy source shifted from wood burning towards fossil fuel.A significant increase of BC was observed between 1875 −1885,due to coal emission just after the beginning of Euro‐pean Industrial Revolution.Nevertheless,local impact in moderation could not be overlooked as tourism and migration coincided with this time.Similarly,a core from a site nearby Fiescherhorn glacier,Switzerland,demonstrated almost six times increase in the BC con‐centration due to fossil fuel contribution from around 1879(Jenket al.,2006)and the increasingly anthropo‐genic activity after this period earlier and aided by the increasingly anthropogenic activity after this period.Legrandet al.(2007) analyzed BC in the ice core from Col du Dome near Mount Blanc summit and Colle Gnifetti and found that it increased by a factor of 6 after World War II.This sharp increase is due to the surge in road traffic emission during summer,even after being counterbalanced by decreasing emis‐sions from residential sectors.
European total BC emission increased from 630 Gg in 1920 to the maximum of 1,430 Gg around 1970 and again decreased to 950 Gg in 1985 (Fagerliet al.,2007).It is worth noting that the emission estimates till 1985 are considered from combustion without emission control.Emission for 2000 inventory was reduced by approximately 30%,to 950 Gg at the Eu‐ropean scale (Fagerliet al.,2007).The decrement was attributed to reduction in the coal consumption of residential sectors.The studies of Legrandet al.(2007) and Fagerliet al.(2007) agree that mobile source dominates the summer emission,and increas‐ing road traffic is responsible for maximizing BC emission.This observation was confirmed by the simulated BC trend and supported by the ice core re‐cord.It is also suggested with evidence that open biomass burning has some contribution at Col du Dome in both summer and winter.For the European Alps,it is confirmed that regional emission is the main contributor to increasing BC,especially in Western Europe.Industrial Revolution starting from the mid 18thcentury and spreading to other parts of Europe till the mid 19thcentury was the major factor in BC emission.The primary sources of BC in west‐ern Europe were the combustion of wood,coal and petroleum products whose contribution to the emis‐sion changed with time (Lavanchyet al.,1999).Fig‐ure 4 clearly compares an estimated emission in France,Italy,Germany and Switzerland (FIGS),Eu‐ropean emission,and BC trend of Colle Gnifetti gla‐cier.Without human-influenced interference,temper‐ature and precipitation records suggest increment of the glaciers until about 1910 compared to what it is at present (Painteret al.,2013).However,a recent study argues that while industrial BC emissions and its subsequent deposition on Alpine glaciers were responsible for rapid deglaciation,summer tempera‐ture drops induced by sulfuric acid aerosols from large volcanic eruptions led to glacier expansion(Siglet al.,2018).
Colle Gnifetti glacier,redrawn from Painteret al.(2013)
Upper Fremont Glacier (UFG) in Wyoming,USA,indicated that BC experienced a sharp increase from 1870 C.E.and peaked in 1900 C.E.before declining to present time (Chellmanet al.,2017),which agrees with that of southern Greenland ice cores.Over this period,3-fold increase of BC was reported in the UFG cores.The BC concentration exhibited a similar trend in the South Cascade Glacier (CSG) of northcentral Washington,USA (Kaspariet al.,2020).The BC concentration began to increase after 1890 and peaked between 1940−1960,displaying a median BC concentration that is about 16 times higher than the background level of pre-1890.The extremely high BC concentration is most likely due to domestic coal and forest fire emissions.And wood burning and coal were the sources of BC in the 1960s.However,the in‐troduction of air pollution regulations and a shift in energy use from coal and wood led to the post-1960 concentration decrement.
3.3 Arctic Region
Being the largest ice-snow storage house,the cores obtained from Arctic regions have been of ut‐most importance in analyzing the BC deposition histo‐ry.The large ice caps from Greenland and Antarctic had fascinated the scientific community in the past.Still,it was in 1957 −1958 when the extensive re‐search programs decrypted the environmental ar‐chives stored in snow-ice for several hundred thou‐sand years (Boutron,1995).Greenland ice cap is lo‐cated in the Northern Hemisphere and close to heavy industrial areas in North America,Western Europe as well as Northern Russia.Compared to the Antarctic,with an area of 12.5×10⁶km2and its majority covered by ice cap,Greenland ice cap,a part of Denmark,is only 1.4×10⁶km2(Boutron,1995).
It is reported that the Arctic is warming twice as fast as the rest of the world (ACIA,2005).Recurrent analyses of Greenland ice cores in various sites re‐garding BC deposition along with the study of vanil‐lic acid and non sea salt sulphate revealed the emis‐sions from conifer-specific forest fire and industrial activities,especialy from fossil fuel (McConnellet al.,2007).Two cores from Greenland (D4) ice sheet showed seven times increase in BC concentration from 1850 to around 1910,when the concentration peaked.There was a steady rise between 1888 and 1920,followed by a decline through the late 1940's and a sharp plunge in 1952.Before 1850,the BC con‐centration revealed the vanillic acid,indicating its ori‐gin of the coniferous boreal forest fire.On the con‐trary,after 1850,non-sea salt sulphate was evident,pointing to the industrial source.Eastern and northern US and Canada were identified as the likely source re‐gion by back trajectory models.Koch and Hansen(2005),with the GISS model,suggest that the predom‐inant pollutants in the Arctic originate from south Asia.Also,Wanget al.(2011) found Asian emission as a major anthropogenic source of BC in the free tro‐posphere henceforth,suggesting Asian emission to be a prime source,which is in agreement with other stud‐ies.Nevertheless,McConnellet al.(2007) inferred that industrial BC during 1850 to 1951 was from North America.Table 1 presents the BC concentration in ice core studies from the Arctic and Europe.
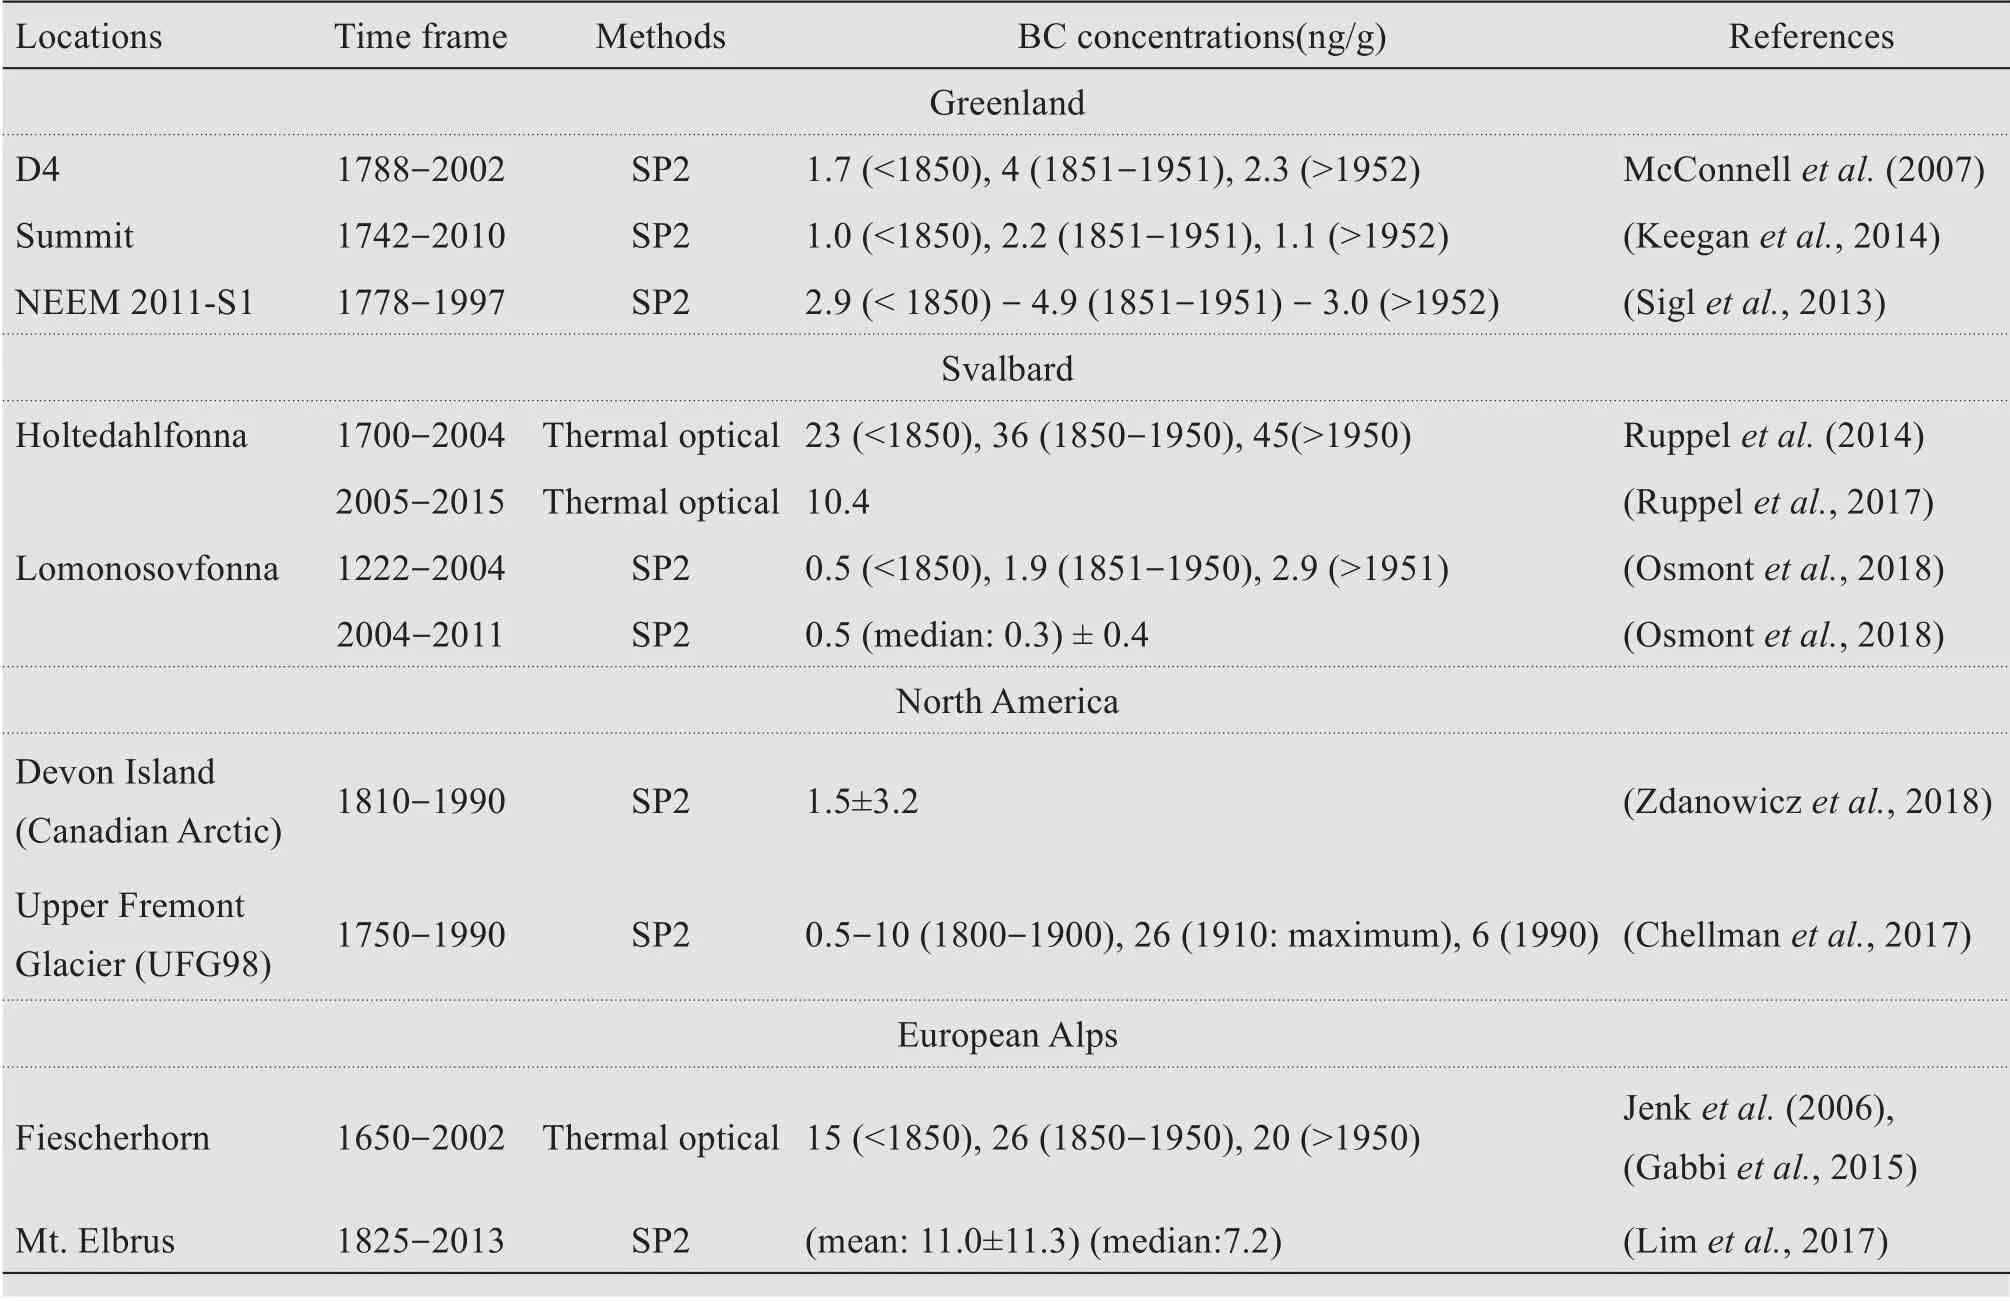
Table 1 BC concentration in ice cores from the Arctic,North America and Europe
The trend in the D4 site is in agreement with the NEEM-2011-S1 ice core reported by Zennaroet al.(2014),which confirms the peak resulted from a slow‐ly incresing trend from about 1750 followed by an ac‐celerated rise during the late 1800s.This BC record exhibited the highest concentration from 1850 to the present,attributed particularly to coal.However,bio‐mass burning is considered the primary source of BC before 1850,as revealed by a close correlation be‐tween BC and vanillic acid.During the industrial peri‐od,also a coal-dominated era (1860−1940) (Bondet al.,2007),a high BC concentration was seen in ACT2 ice core from Greenland during 1910−1940 (McCon‐nell and Edwards,2008).When comparing the BC ob‐servation trends in Greenland,Europe and North America with models,they agreed and correlated well with each other (Kochet al.,2011).The ice-core BC trends from three different sites corresponds well with that of the coal emission during the industrial period.The correlations between heavy metals and BC sug‐gested coal burning in North America and Europe as the dominant source.
An ice core from Holtedahlfonna glacier in Sval‐bard from 1700−2004 displayed an increase in BC af‐ter 1850 and a peak concentration of 80 µg/L in 1910,and revealed an unprecedent surge in the 1990's,result‐ing in a peak of 103µg/L in 1998 (Ruppelet al.,2014)(Figure 5a).Results from this core contradict that of Greenland D4,where no consistent rise after 1950's(Figure (5b) is observed.Such factors as BC scaveng‐ing efficiency,post depositional process and vertical distribution differences are attributed to the difference in these two sites in the Arctic.Also,the BC concentra‐tion in Lomonosovfonna ice core from Svalbard peaked during 1850−1900,followed by gradual decre‐ment until the 1940s,and again accelerated from 1950 to early 1990(Osmont 2018).Further,the different ana‐lytical methods,approaches and instruments used for detection have been suggested to be partially responsi‐ble for the difference in the results.Besides,regional sources are expected to be accountable for the erratic display of concentration in Holtedahlfonna glacier.In contrast to the D4 site,the difference in this site is al‐so the result of air mass movement,in which a large portion of atmospheric transport comes from Europe and northern Siberia (Stohl,2006),whereas North American emission governs in Greenland.Post-1970's concentration indicates that the BC data recorded in Svalbard do not resemble those of Greenland ice cores,since the major emission in the lower tropo‐sphere could not reach there.McConnellet al.(2007)also argued that the BC recorded in high-altitude ice cores located in the free troposphere might not repre‐sent the trends for the lower regions of the Arctic.
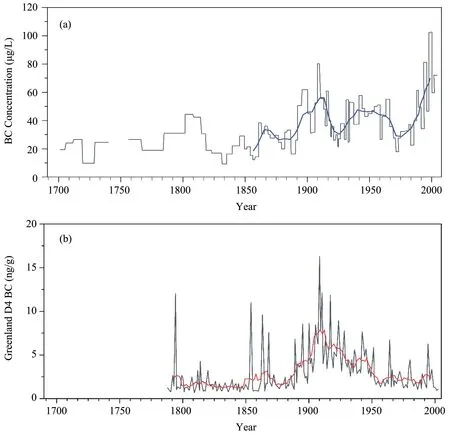
Figure 5 BC trend in ice core of(a)Svalbard,Holtedahlfonna glacier.The black curve represents the concentration at sample resolution and the blue line the running 10-year averages of sample and(b)Greenland,D4 where black and red lines denote monthly and annual BC concentration,redrawn from Ruppel et al.(2014)and McConnell et al.(2007)respectively
4 BC in lake sediments
An ice core preserves a record of BC and its sourc‐es,such as the remote Greenland and higher Himala‐yas,which were influenced by long range atmospher‐ic transport of pollutants,and the Alps,which is af‐fected by relatively close emission sources in Europe.With its distribution being heterogenous and associat‐ed with regional sources,it is important to measure BC from many widely distributed locations (Rose and Ruppel,2015).Another widely used proxy for BC is lake sediments.Due to the inertness,like in ice cores,the BC in sediments persists over a longer period of time in deep sediments and serves a time span of more than several thousand years (Masiello and Druffel,1998;Muriet al.,2002b).Analysis of the sediment profile provides a good tracer of fossil fuel consumption and past wild fire events (Griffin and Goldberg,1983).Furthermore,sediments offer BC signatures of the pre industrial era,and prehistoric sediments serve as evidence of wild fires (Muriet al.,2002b).Therefore,it is generally agreed that sedi‐ments are an effective tool for reconstruction of histor‐ical pollutant emissions and deposition (Hiteset al.,1977;Linet al.,2017).This section summarizes exsit‐ing BC deposition results from remote lake sedi‐ments.Among the limited studies of BC deposits in lakes,nineteen were identified to be on samples from remote lakes with minimal anthropogenic activities in different parts of the Northern Hemisphere.Table 2 lists the remote lake study sites,methods,BC concen‐tration and flux,and time spans.
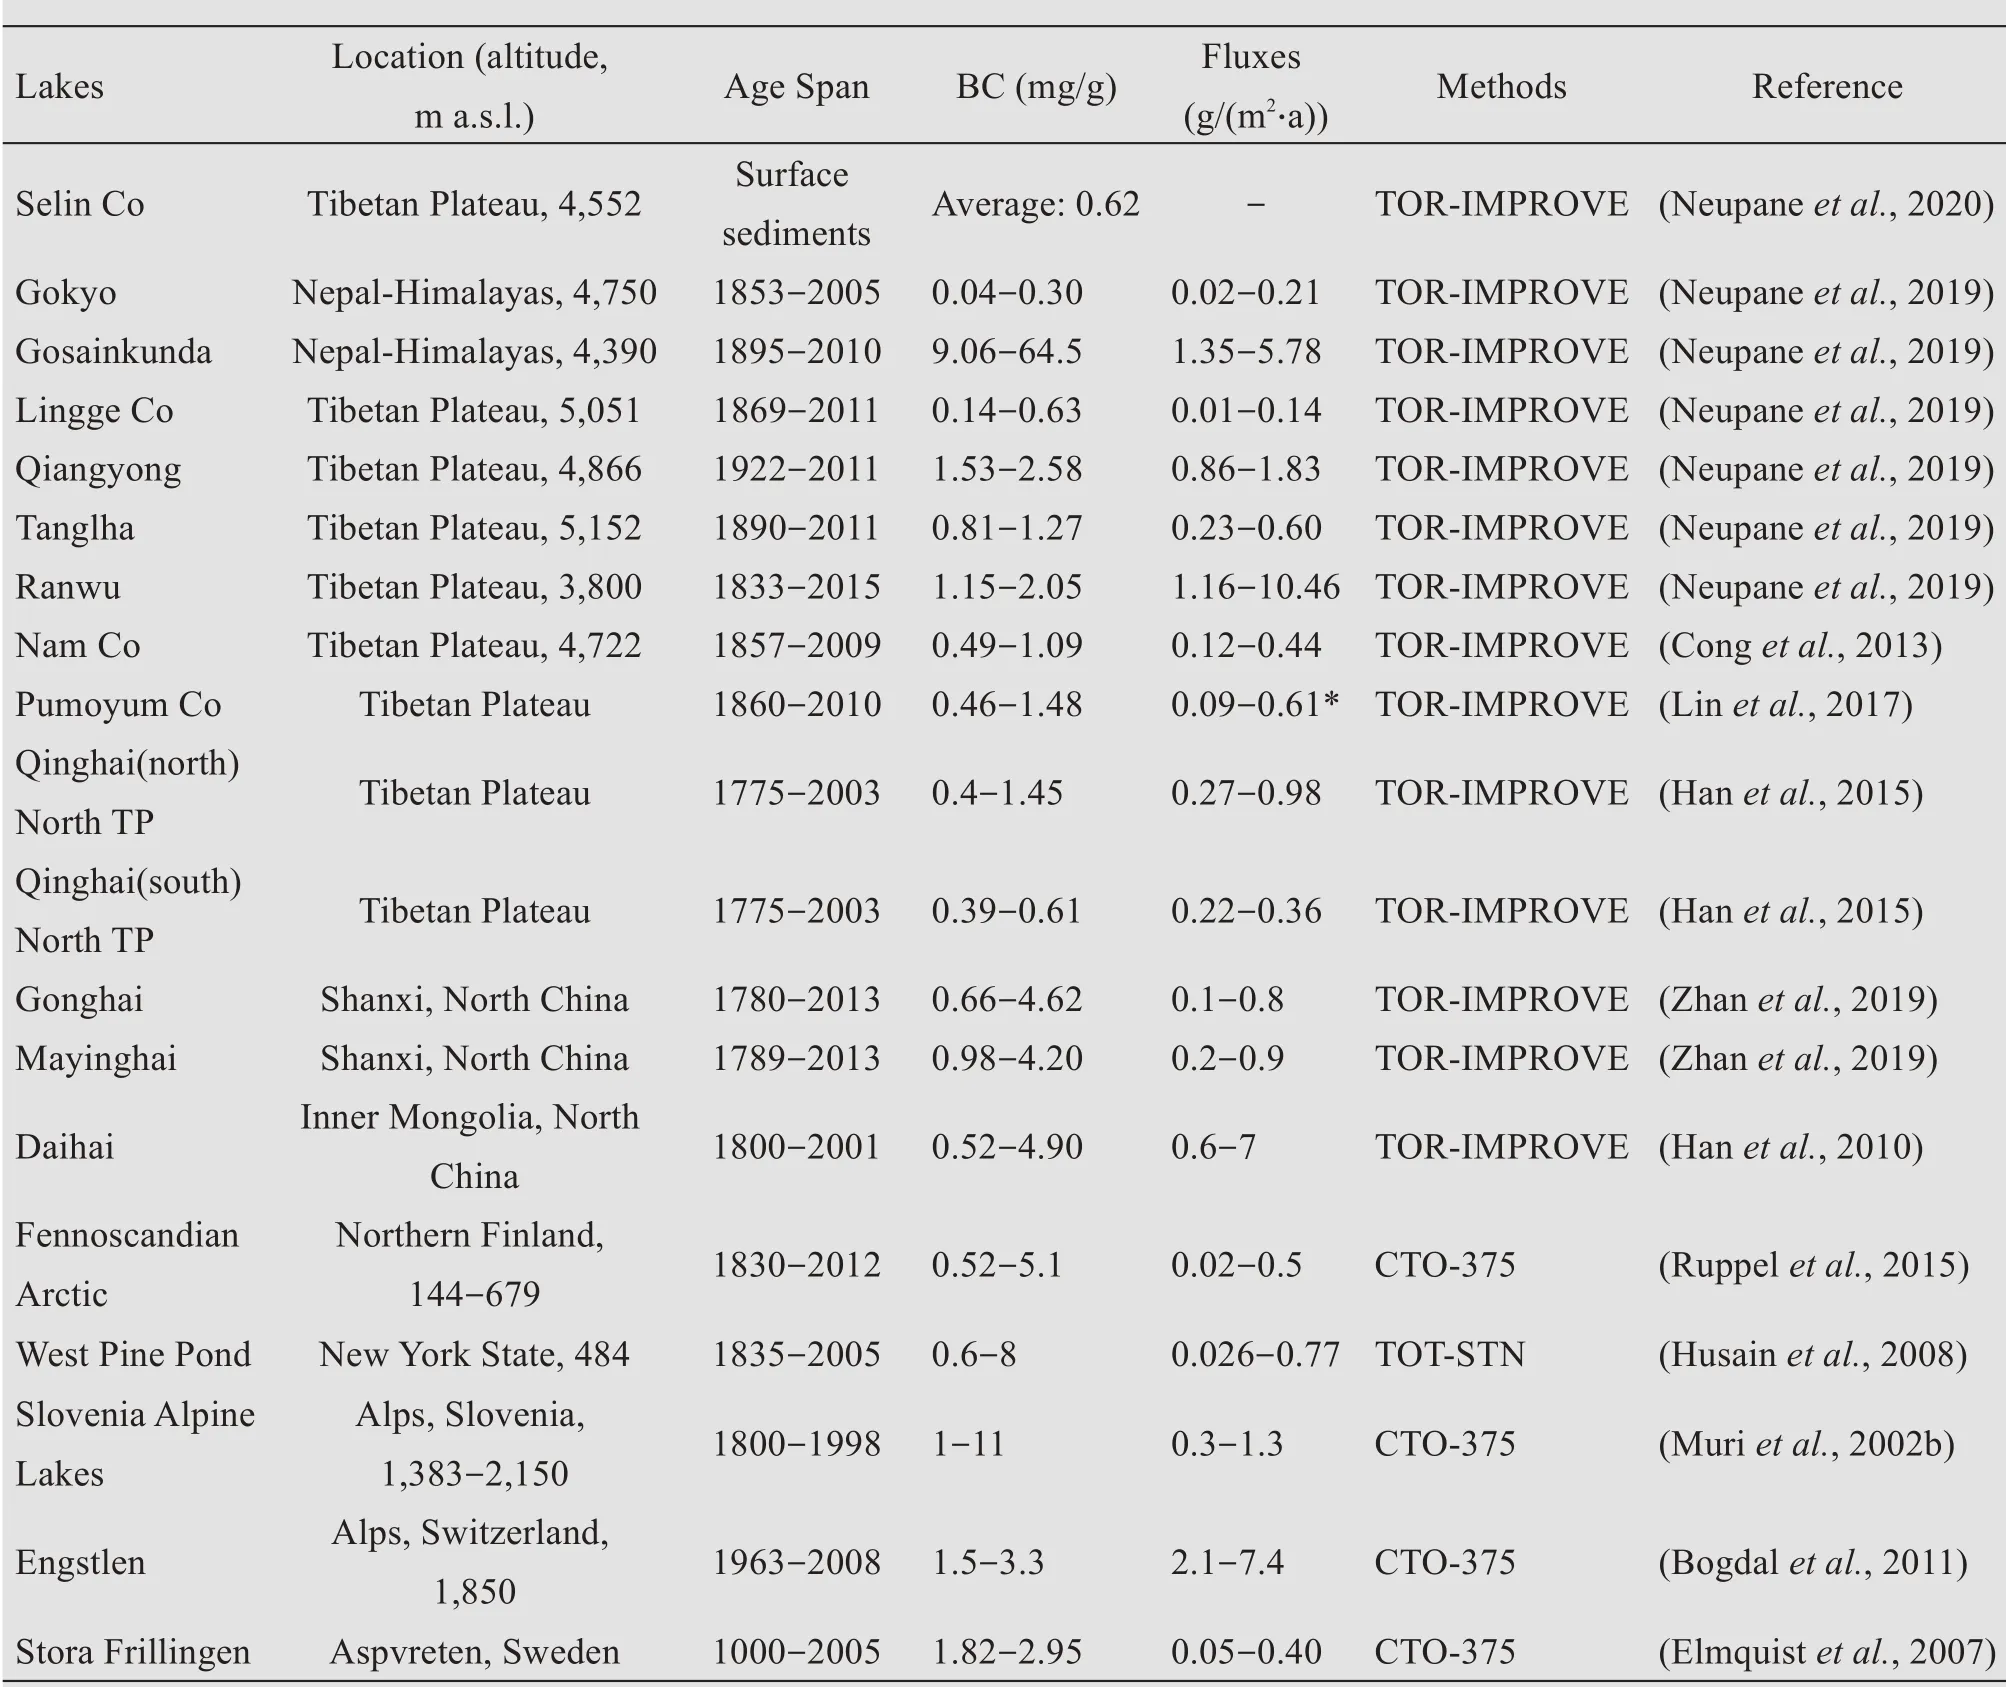
Table 2 Detailed description of the remote lakes for BC investigation
4.1 Himalayan-Tibetan Plateau (HTP) lakes
BC investigated from remote lakes in the HTP,viz.,Gokyo,Gosainkunda,Nam Co,Pumoyum Co,Qiangyong,Ranwu,Lingge Co,Tanglha,Lake Qing‐hai and Selin Co are located within the region of Indi‐an Monsoon in summer and the westerlies in winter(Conget al.,2013;Hanet al.,2015;Linet al.,2017;Neupaneet al.,2019;Neupaneet al.,2020).Among these lakes,Nam Co and Pumoyum Co have no out‐flow,and the water supply is dependent upon precipi‐tation,inflow and evaporation,whereas Lake Qinghai is supplied by precipitation runoff via seven large riv‐ers,which bring more than 80% of the total annual fluvial sediments (Xuet al.,2006;Hanet al.,2015).Notably,riverine inputs of BC in Lake Ranwu are largely controlled by the snow-ice melt from the sur‐rounding mountains (Neupaneet al.,2019).Besides,Qiangyong Co is a small lake with an outlet and a contribution from glacier melt discharge,whereas Se‐lin Co is the largest lake in central TP fed by four major rivers.
These lakes in the HTP demonstrated similar con‐centrations,which are significantly lower than record‐ed in other parts of the world (Figure 6a).The lower concentration of pollutants such as BC can be attribut‐ed to the remoteness of the TP and minimal anthropo‐genic activities.Also,these pristine regions are mini‐mally disturbed by human interferences and still con‐sidered as a background site due to steep topography and high elevation.Amidst these facts,the BC concen‐tration and flux in recent decades,especially after the mid and late 1900's,have increased (Conget al.,2013;Neupaneet al.,2019).Notably,the concentra‐tion is unprecedentedly high in Lake Gosainkunda due to religious and local activities(Kanget al.,2016;Neupaneet al.,2019).The models and backward tra‐jectories revealed that,besides a few local emissions,the air mass movement is accountable for the concen‐tration in these lakes.The emission inventory indi‐cates that the BC emission surge in south Asia,China and the Middle East is responsible for the increased BC profile (Bondet al.,2007) (Figure 7).Though higher Himalayas were considered to be unaffected by atmospheric pollutants,Bonasoniet al.(2010)state that they can reach up to 5,000 m a.s.l.,cross and eventually land upon the TP.Specifically,the backward trajectory model shows the pollutants trans‐port from south Asia to settle in the lake sediments.The Bay of Bengal and north India are responsible for air mass circulation in summer,and west Nepal,north‐west India and Pakistan in winter(Conget al.,2013).
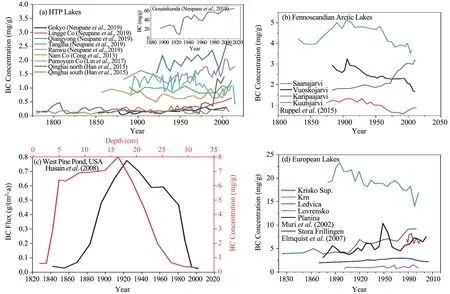
Figure 6 Historical BC reconstruction in the lake sediment cores of(a)the HTP,(b)Fennoscandian Arctic,(c)USA and(d)Europe
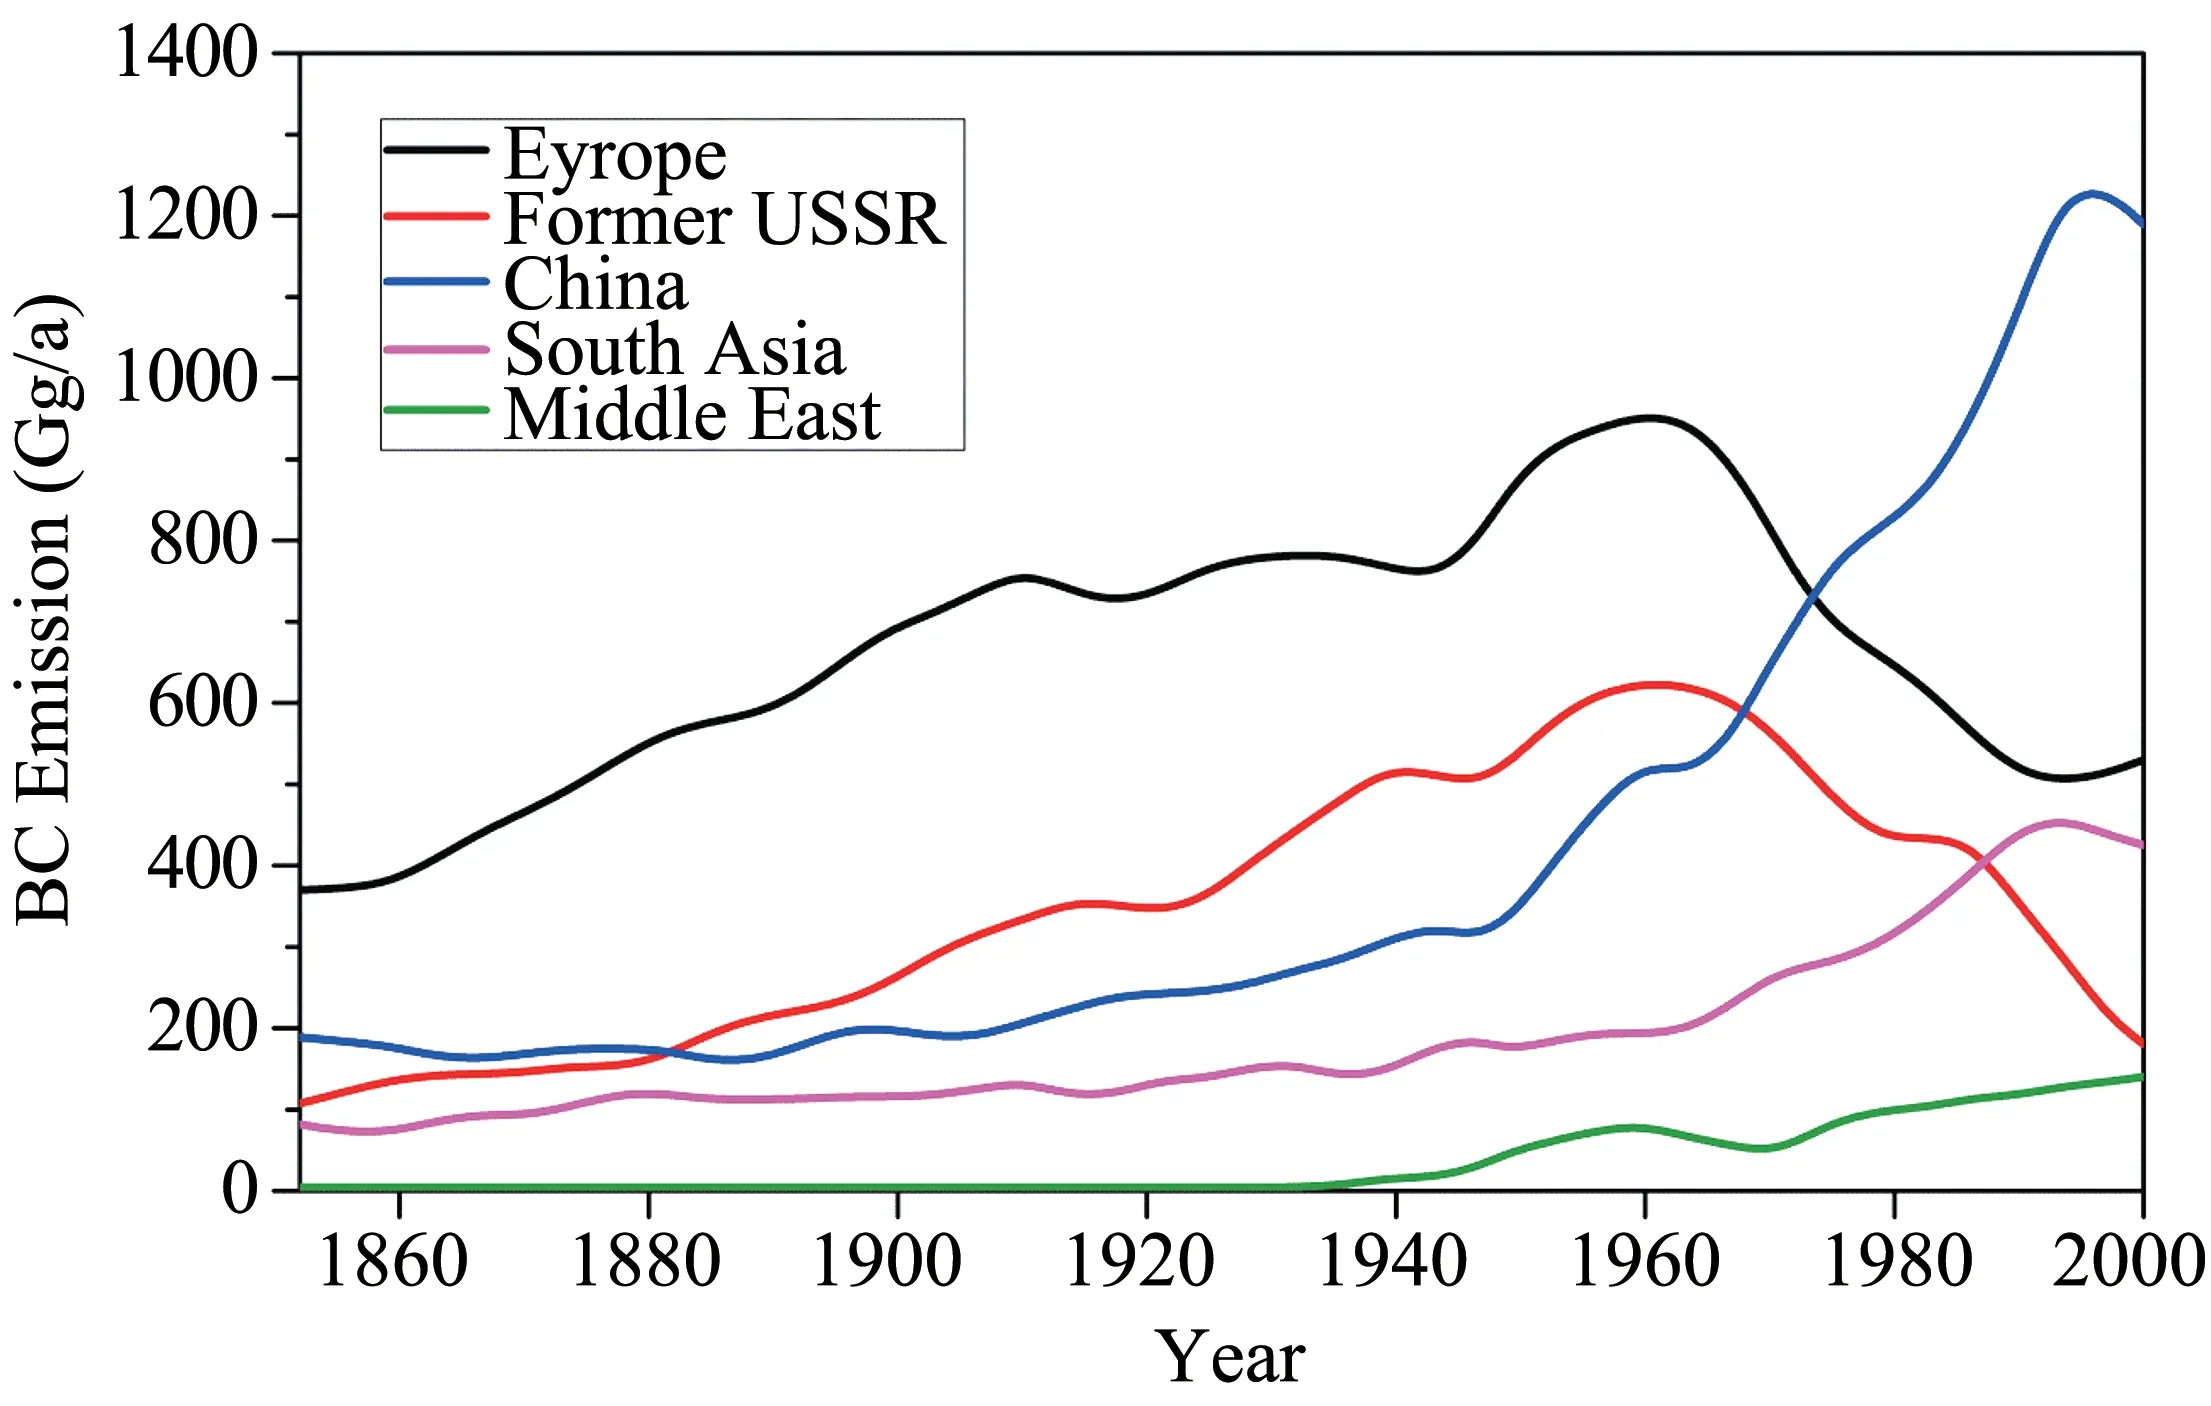
Figure 7 Historical BC emission data,redrawn from Bond et al.(2007)
High-intensity wildfires have been associated with soot emission,as evident in the China Loess Plateau(Hanet al.,2020).In the vicinity of the TP,open fire is one of the major emitters of BC,which can trans‐port into the lakes (Neupaneet al.,2019).The ratio beteween the low temperature (LT) and high tempera‐ture (HT) thermal optical reflectance (ToR) of BC (al‐so referred to as char/soot ratio) provides a meaning‐ful indication for BC source identification,where a high ratio of BCLT-ToRto BCHT-ToRindicates biomass burning as a contributor(Conget al.,2013).Neverthe‐less,a few lakes displayed dominant soot fraction,which implies they are influenced by long-range at‐mospheric transport of pollutants (Neupaneet al.,2019).The BC source of the lakes in northern China,such as Gonghai and Mayinghai,was similar to those in the HTP;the temporal trend of BC after 1950 showed an apparent increase,most of which can be at‐tributed to fossil fuel consumption resulted from the development of China (Zhanet al.,2019).Further,in remote lakes,long-range atmospheric transport is cred‐ited as another source for increased BC concentration.
The concentration in cores from north Lake Qing‐hai corresponds with the anthropogenic activity,where‐as the decreased concentration in cores from south can be attributed to the lacustrine inputs associated with summer monsoon,which weakens,as evident by the dropping lake water level (Hanet al.,2015).The source of BC,in the form of char,is yak dung and grass combustion,and increment can also be credited to the long range transport.The increasing concentra‐tion is attributed to the local anthropogenic sources and the detrital matters and local tourist industry (Hanet al.,2015).Nevertheless,Indian source and eastern and inland China emission played a role in the in‐crease of concentration.
4.2 Europe and the USA
BC concentration results were reported from lakes in Europe,including Fennoscandian Arctic Lakes in Northern Finland (Ruppelet al.,2015),Alpine Lakes in Slovenia (Muriet al.,2002b),Engstlen Lake in the Alps,Switzerland (Bogdalet al.,2011) and Stora Frillingen Lake in Aspvreten,Sweden (Elmquistet al.,2007),and West Pine Pond in New York,USA(Husainet al.,2008).One of the first studies on the historical trends of refractory soot BC in lake sedi‐ments between approximately 1850 to 2010 was from Fennoscandian lakes in the Arctic(Figure 6b)(Ruppelet al.,2015).The concentration of five studied lakes varied from 0.6 to 5.1 mg/g,with the lowest in lake Saanajarvi and the highest in lake Kuutsjarvi.BC con‐centration of lake Vuoskojarvi and Kuutsjarvi demon‐strated gradual decrement from the decade of 1950's.In contrast,Saanajarvi showed a slight decline in the concentration after 1960's and again a slow increment after 2000's.It is noted that the concentration in the sediments can be affected by dilution of the detrital material,for which depositional fluxes are taken into account.Most of the fluxes reported less than 0.1 g/(m2·a) representing pre-industrial value.But higher flux of Kuutsjarvi before the industrial era seemed du‐bious without obvious BC source during that time and is attributed to the sediment focusing,where resus‐pended sediments move deeper in the accumulation zone.The BC flux increase from 1970's is plausible due to regional industrial emission and agrees with the Svalbard ice core(Ruppelet al.,2014).
Muriet al.(2002b) investigated five remote Alps lakes in Slovenia (Figure 6d),where BC concentra‐tion varied from 1 to 11 mg/g.The concentration seemed consistent and declined in the 1990's,which is credited to the clean air legislation and switching to natural gas.The two lakes viz,lake Ledivca and Plani‐na,showed gradual increment after 1950's.Study shows the anomalous increment in concentration also results from natural calamities such as earthquakes as well as forest fires (Muriet al.,2002b).The rest of the resulting increment in the BC peaks could be ex‐plained by emerging industrialisation and fuel con‐sumption.The concentration decreased in the westeast direction across Slovenian Alps due to the de‐creasing amount of precipitation.Bogdalet al.(2011)reported BC flux 2−7 g/(m2·a)with a decreasing trend after 1960 in deep basin floor samples from lake Eng‐stlen.Light soot particle transport is the mechanism of reaching this region.Improvement in combustion technology and regulations balanced the application of fossil fuel sources.Elmquistet al.(2007) com‐pared the BC concentration in a different time frame in lake Aspvreten,Sweden.The pre-industrial emis‐sion was steady.Wood burning practice had conse‐quently started to increase the BC emission up to the industrial revolution.Henceforth,the concentration seemed steady up to 1950 but again increased until 1960,showing consistency in high usage of fuel,as energy shift from coal to oil became popular and rep‐resented large supply of resources.The legislative control approach in Europe showed its effectiveness in reducing the BC and the decreasing trend contin‐ued to 1990's,though a slight increment was observed in the new millennium.The preindustrial level of BC flux,i.e.,0.05 g/(m2·a),reached 0.29 g/(m2·a) in mid 1800's,peaked in the decades of 1920's to 0.40 g/(m2·a),and decreased in the mid 1950's.A study in West Pine Pond,USA(Husainet al.,2008) displayed a continu‐ous increase in BC,which peaked around 1910 and then kept on decreasing until about 1960,due todiffer‐ent combustion sources,and decreased to almost back‐ground values around 2000 (Figure 6c).These lake sediments were calibrated against Whiteface Moun‐tain,New York,which was in good agreement and al‐so related with the regional BC emission.
5 Summary
We summarized various studies on the BC concen‐tration and its trend in ice cores and remote lake sedi‐ments of the northern Hemisphere.The unprecedent‐ed global development and industrialization over the last few decades have led to high atmospheric pollu‐tion,which is reflected in the ice core and lake sedi‐ments.The light-absorbing properties of BC and its influence on snow and ice surface play a principal role in affecting remote mountains,thereby threaten‐ing water resources,particularly in Asia (Hodson,2014).BC in high glaciers of Asia is greatly depen‐dent on elevation as well as the extent of regional emission and surface melting condition (Minget al.,2013).South Asian emission dominates the BC trans‐port in the HTP region with effective channels from the eastern Himalayan valleys into the Tibetan Pla‐teau,whereas the high elevation of the Himalayas acts as an obstacle,resulting in a lower concentration.In the European Alps,the regional emission was respon‐sible for the increasing concentration,besides local development activities.To a larger extent,developed countries in Western Europe is responsible for the in‐creased concentration.The Arctic environment experi‐ences a variable impact from the different source re‐gions.North American emission played its part during the 19thand mid 20thcentury,after which Asian emis‐sion contributed to much of the BC concentration.Eu‐ropean and North Siberian contributions also control the concentration in this region.Observations and mod‐els suggested a higher average BC concentration in the deposition in the Russian Arctic,followed by that in Canadian and Alaskan Arctic,and Arctic Ocean and Greenland.Note the Arctic and Greenland data indicat‐ed an inversely proportional relationship between the concentration and latitude(Dou and Xiao,2016).
All the investigated lake sediments in the Tibetan Plateau showed a consistent,increrasing trend in BC concentration and flux after mid-1950s,correspond‐ing to the south Asian emission.And the concentra‐tion in Pumoyum Co displayed a decreasing trend,withsedimentation rate apparently controlling the total input of pollutants flux.Interestingly,Arctic Fen‐noscandian lakes in Europe had a lower BC concentra‐tion after mid 20thcentury except for lake Karipaarjvi due to sediment focusing.Lakes in Slovenia demon‐strated decreasing concentration in a west-east direc‐tion,and due to differences in the bedrock the lakes are situated,the BC trends varied among the investi‐gated lakes.Lake Aspvreten,Sweden,and West Pine Pond,too,showed a decreasing trend corresponding to regional emission pattern.
6 Concluding remarks
The authors over the past decades have reported the study of BC analysis in ice cores and lake sedi‐ments.This study is an overview of the state of histor‐ical BC,incorporating various observations resulting in its concentration and distribution.The emission and long-range transport of BC particles,together with local emissions,play a crucial role in the spatial variation and temporal trend.BC emission inventories from various regions highlight the status of BC.Nev‐ertheless,more precise,deep and uniform records can resolve the discrepancies among the major source re‐gions.More robust,high-quality data from observa‐tion and modelling is desirable,and global models in‐corporating the local and neighboring sources can sup‐plement the observation data in complex terrain.As suggested by McConnell (2010),exploration of BC source tracers and continuous analytical methods should be adopted.In lake sediments,the sediment fo‐cusing and pollutant fluxes from local sources and an‐thropogenic activities,precipitation,glacier melt in the surrounding area and fires should be taken into ac‐count,as they influence the temporal BC trend and concentration.Consistent sampling protocols and ana‐lytical methods are urged to have a better understand‐ing and comparison among various sites.
Acknowledgments:
This study was supported by the National Natural Sci‐ence Foundation of China (41771079,41805106),the Strategic Priority Research Program of the Chinese Academy of Sciences-The Pan-Third Pole Environ‐ment Study for a Green Silk Road (Pan-TPE)(XDA20040501),and the Key Laboratory of Cryo‐spheric Sciences Scientific Research Foundation(SKLCS-ZZ-2019).The authors thank two anony‐mous reviewers for their invaluable comments and suggestions for improving this article.We also highly appreciate the helping hands of Mr.Mukesh Rai.
 Sciences in Cold and Arid Regions2021年3期
- Sciences in Cold and Arid Regions的其它文章
- Summary of research on frost heave for subgrade in seasonal frozen ground
- Overview of an early warning system for Glacial Lake outburst flood risk mitigation in Dudh-Koshi Basin,Nepal
- Temporal changes in seasonal precipitation over the Sahara Desert from 1979 to 2016
- Centrifuge model test on performance of thermosyphon cooled sandbags stabilizing warm oil pipeline buried in permafrost
- Changes in morphology and soil nutrient patterns of nebkhas in arid regions along a precipitation gradient
- Linkages between soil microbial stability and carbon storage in the active layer under permafrost degradation