
Temporal changes in seasonal precipitation over the Sahara Desert from 1979 to 2016
2021-07-30 01:12SindikubwaboCelestinQiFengRuoLinLiWenJuChengJianMaHabiyakareTelesphoreNzabarindaVincent
Sindikubwabo Celestin ,Qi Feng ,RuoLin Li ,WenJu Cheng ,Jian Ma ,Habiyakare Telesphore ,Nzabarinda Vincent
1.Key Laboratory of Eco-hydrology of Inland River Basin,Northwest Institute of Eco-Environment and Resources,Chinese Academy of Sciences(CAS),Lanzhou,Gansu 730000,China
2.University of Chinese Academy of Sciences,Beijing 100049,China
3.Qilian Mountains Eco environment Research Center,Lanzhou,Gansu 730000,China
4.Academy of Water Resources Conservation Forests in Qilian Mountains,Zhangye,Gansu 734000,China
ABSTRACT Rainfall variability dominates livelihoods in all countries of Saharan Africa.To better understand the processes involved in Sahara precipitation changes,we used the Global Precipitation Climatology Center (GPCC) dataset to examine dry and wet seasonal trends in the Sahara region from 1979 to 2016.We also used the European Centre for Medium-Range Weath‐er Forecasts(ECMWF)to evaluate the general atmospheric circulation associated with seasonal change of Sahara precipi‐tation.The Mann-Kendall test and Theil sens' slope estimator methods were adopted to test and estimate the significance and weight of precipitation trend,respectively.The results revealed that Sahara precipitation has increased significantly.The seasonal evaluation shows a positive trend of 0.42 mm/decade and 1.43 mm/decade in JAS (June,August,and Sep‐tember) seasons for the northern and southern Saharan Desert,respectively.Moreover,the JFMA (January,February,March,and April)period shows a negative trend but not statistically significant.An examination of the general circulation and moisture transport changes suggested an increase of rainfall in southern Sahara.The wet period is also driven by northward penetration of moisture originating from the Sahel region,African Easterly Jet(AEJ),and weakening in the up‐per tropospheric zonal wind.Summer rainfall has also been likely associated with positive anomalies of sea surface tem‐perature(SST)in the North Tropical Atlantic(NTA)and the Mediterranean Sea.
Keywords:Sahara;precipitation;variability;arid;Africa;climate
1 Introduction
Precipitation is a crucial point in the hydrological cycle,and its fluctuations may result in flood or drought events,which lead to the degradation of eco‐systems.The state of precipitation plays an inevitable role in economic activities such as agriculture and pas‐ture.Precipitation changes are among the best indica‐tors of climate change effects on water resources (On‐yuthaet al.,2016).Moreover,regional precipitation acts as an essential reference for designing and imple‐menting desertification policies,particularly in re‐gions with fragile ecological systems.The Special Re‐port on Managing the Risks of Extreme Events and Disasters to Advance Climate Change Adaptation(SREX) reported that climate change effects include changes in frequency,the intensity of extreme weath‐er and climate events(Seneviratneet al.,2012).There are multiple pieces of evidence of climate change's ef‐fects on the ecosystem and human systems (Oveet al.,2018).The Africa continent is known for its weak adaptive capacity to extremes linked to climate change(Tegegneet al.,2021).In addition,climate change has contributed to the increase of poverty level and exposes the entire continent to the attached risks (Ma‐sihet al.,2014).The sub-Saharan countries are more vulnerable than other countries (Masihet al.,2014).Many tropical African countries are prone to frequent droughts,and the most threatened countries lie under semi-arid climates (Masihet al.,2014;Ahmadalipouret al.,2019).In different chronological periods,drought events devastated semi-arid regions such as West Africa,Sahel (Nicholson,1981;Druyan and Koster,1989;Nicholsonet al.,1998;Nicholson,2005),East African horn (Nicholson,2016),and the Sahara Desert prior to the 1970s (Charneyet al.,1975).Drying conditions have also been observed in central Asia and caused a climate shift from sub-hu‐mid and humid to semi-arid climates (Huanget al.,2016).Studies have also shown that drought and hu‐man activities led to water loss in middle and central Asia (Schefferet al.,2001;Pekelet al.,2016).More‐over,some climate models have projected an increase of regional temperature by 1−2°C by 2030−2050(Li‐oubimtsevaet al.,2005).Climate models projected a likely decrease in Moroccan rainfall by 10% to 20%in 2050.This decrease in precipitation will be accom‐panied by an increase in temperature and population growth (Schillinget al.,2012).Similar negative trends in African precipitation were observed in the savanna biome in the southern African region (Mar‐umbwa,2019).Studies based on the drought vulnera‐bility index showed that sub-Saharan countries (Chad and Mali) are most vulnerable to the high frequency of drought disasters.However,the Maghreb countries(Egypt,Tunisia,and Algeria) are less vulnerable to drought risks(Ahmadalipouret al.,2019).Other stud‐ies have suggested a decrease in drought frequency and increased precipitation,especially in the monsoon regions (Chenet al.,2020;Ndehedeheet al.,2020).Moreover,the lower frequency number of droughts and an increase in precipitation conditions are project‐ed in East Africa (Ethiopia).The results from model simulations suggested a positive trend in global mean precipitation due to an increase in global atmospheric moisture (Emori and Brown,2005;Zhanget al.,2007).Back in the arid regions,there is insufficient information on the long-term variability of Sahara pre‐cipitation due to the lack of sufficient in situ data re‐cords,which requires the application of high resolu‐tion satellite-based datasets to investigate its climate variability(Vizy and Cook,2017).The Global Precipi‐tation Climatology Center (GPCC) is among the gauge-based datasets widely used and produced rea‐sonable scientific conclusions (Nashwan and Shahid,2019;Salmanet al.,2020;Vignaet al.,2020).The GPCC is based on ground stations,near real-time and non-real-time,with the spatial coverage of ground stations which can reach 50,000 stations per month(Awangeet al.,2019;Ayugiet al.,2020).The dataset has shown good agreement with ground stations in the Nile River Basin,and it has shown an ability to capture the variability of monthly precipitation (Ba‐sheer and Elagib,2019).
A few researchers have drawn the spatial distribu‐tion patterns,and an average of Sahara precipitation(Haradaet al.,2003;Bradaiet al.,2014),but the tem‐poral variability and associated mechanisms need fur‐ther investigations.It is worthy of understanding the behavior of precipitation,particularly in the Sahara Desert,because any slight change defines a signifi‐cant extreme in regional ecosystems.Moreover,a large part of the Sahara Desert lies in the least devel‐oped countries such as Mauritania,Mali,and Chad,with a low economic budget and technology for irriga‐tion systems (Nations,2018).The agricultural sector in countries that lie within the Sahara Desert depends on local rainfall,oasis,inland water bodies,and sea‐sonal rivers,which are vulnerable to precipitation fluctuation.The research on the variability of Sahara precipitation is an additional key to further under‐standing climate change effects in an arid region.
2 Materials and Methods
2.1 Study area
This study focused on the Sahara Desert,a region located in North Africa within 20°N to 30°N,and ex‐tends from West Africa 15°W to East African 35°E.This region is limited by the tropical monsoon climate in the south,which receives rainfall in the boreal sum‐mer season (Biasutti,2019),and the Mediterranean climate in the north,which depends on boreal winter rainfall (Riesco Martínet al.,2013).The region is known as the center of Sahara Heat Low (SHL) and the massif Hoggar mountain,which plays a role in the position of SHL,and it has shown an effect on the west African monsoon (Lavaysseet al.,2016;Vizy and Cook,2017;El-Kholei,2019).The Sahara Desert is the source of dust that affects air quality in Europe particularly Spain and Italy (Wanget al.,2020).The hydroclimate of the region is dominated by lower an‐nual precipitation of less than 100 mm/year and a higher mean annual temperature.The annual mean of monthly maximum temperature can reach 40 °C in the western Sahara(SHL region).Figure 1 shows the annu‐al climatological mean conditions,including total annu‐al precipitation and average air temperature estimated at 2 m height.Average precipitation from the GPCC dataset revealed that,the total annual mean precipita‐tion of the Sahara Desert is less than 100 mm/year and the eastern region shows a hyper-dry condition with total annual precipitation of less than 5 mm/year(white color).Air temperature data from the fifth gen‐eration of the ECMWF Re-Analysis (ERA5) dataset shows that the Sahara Desert experienced warmer months than other parts of the African Continent,with a monthly maximum average of 33°C.
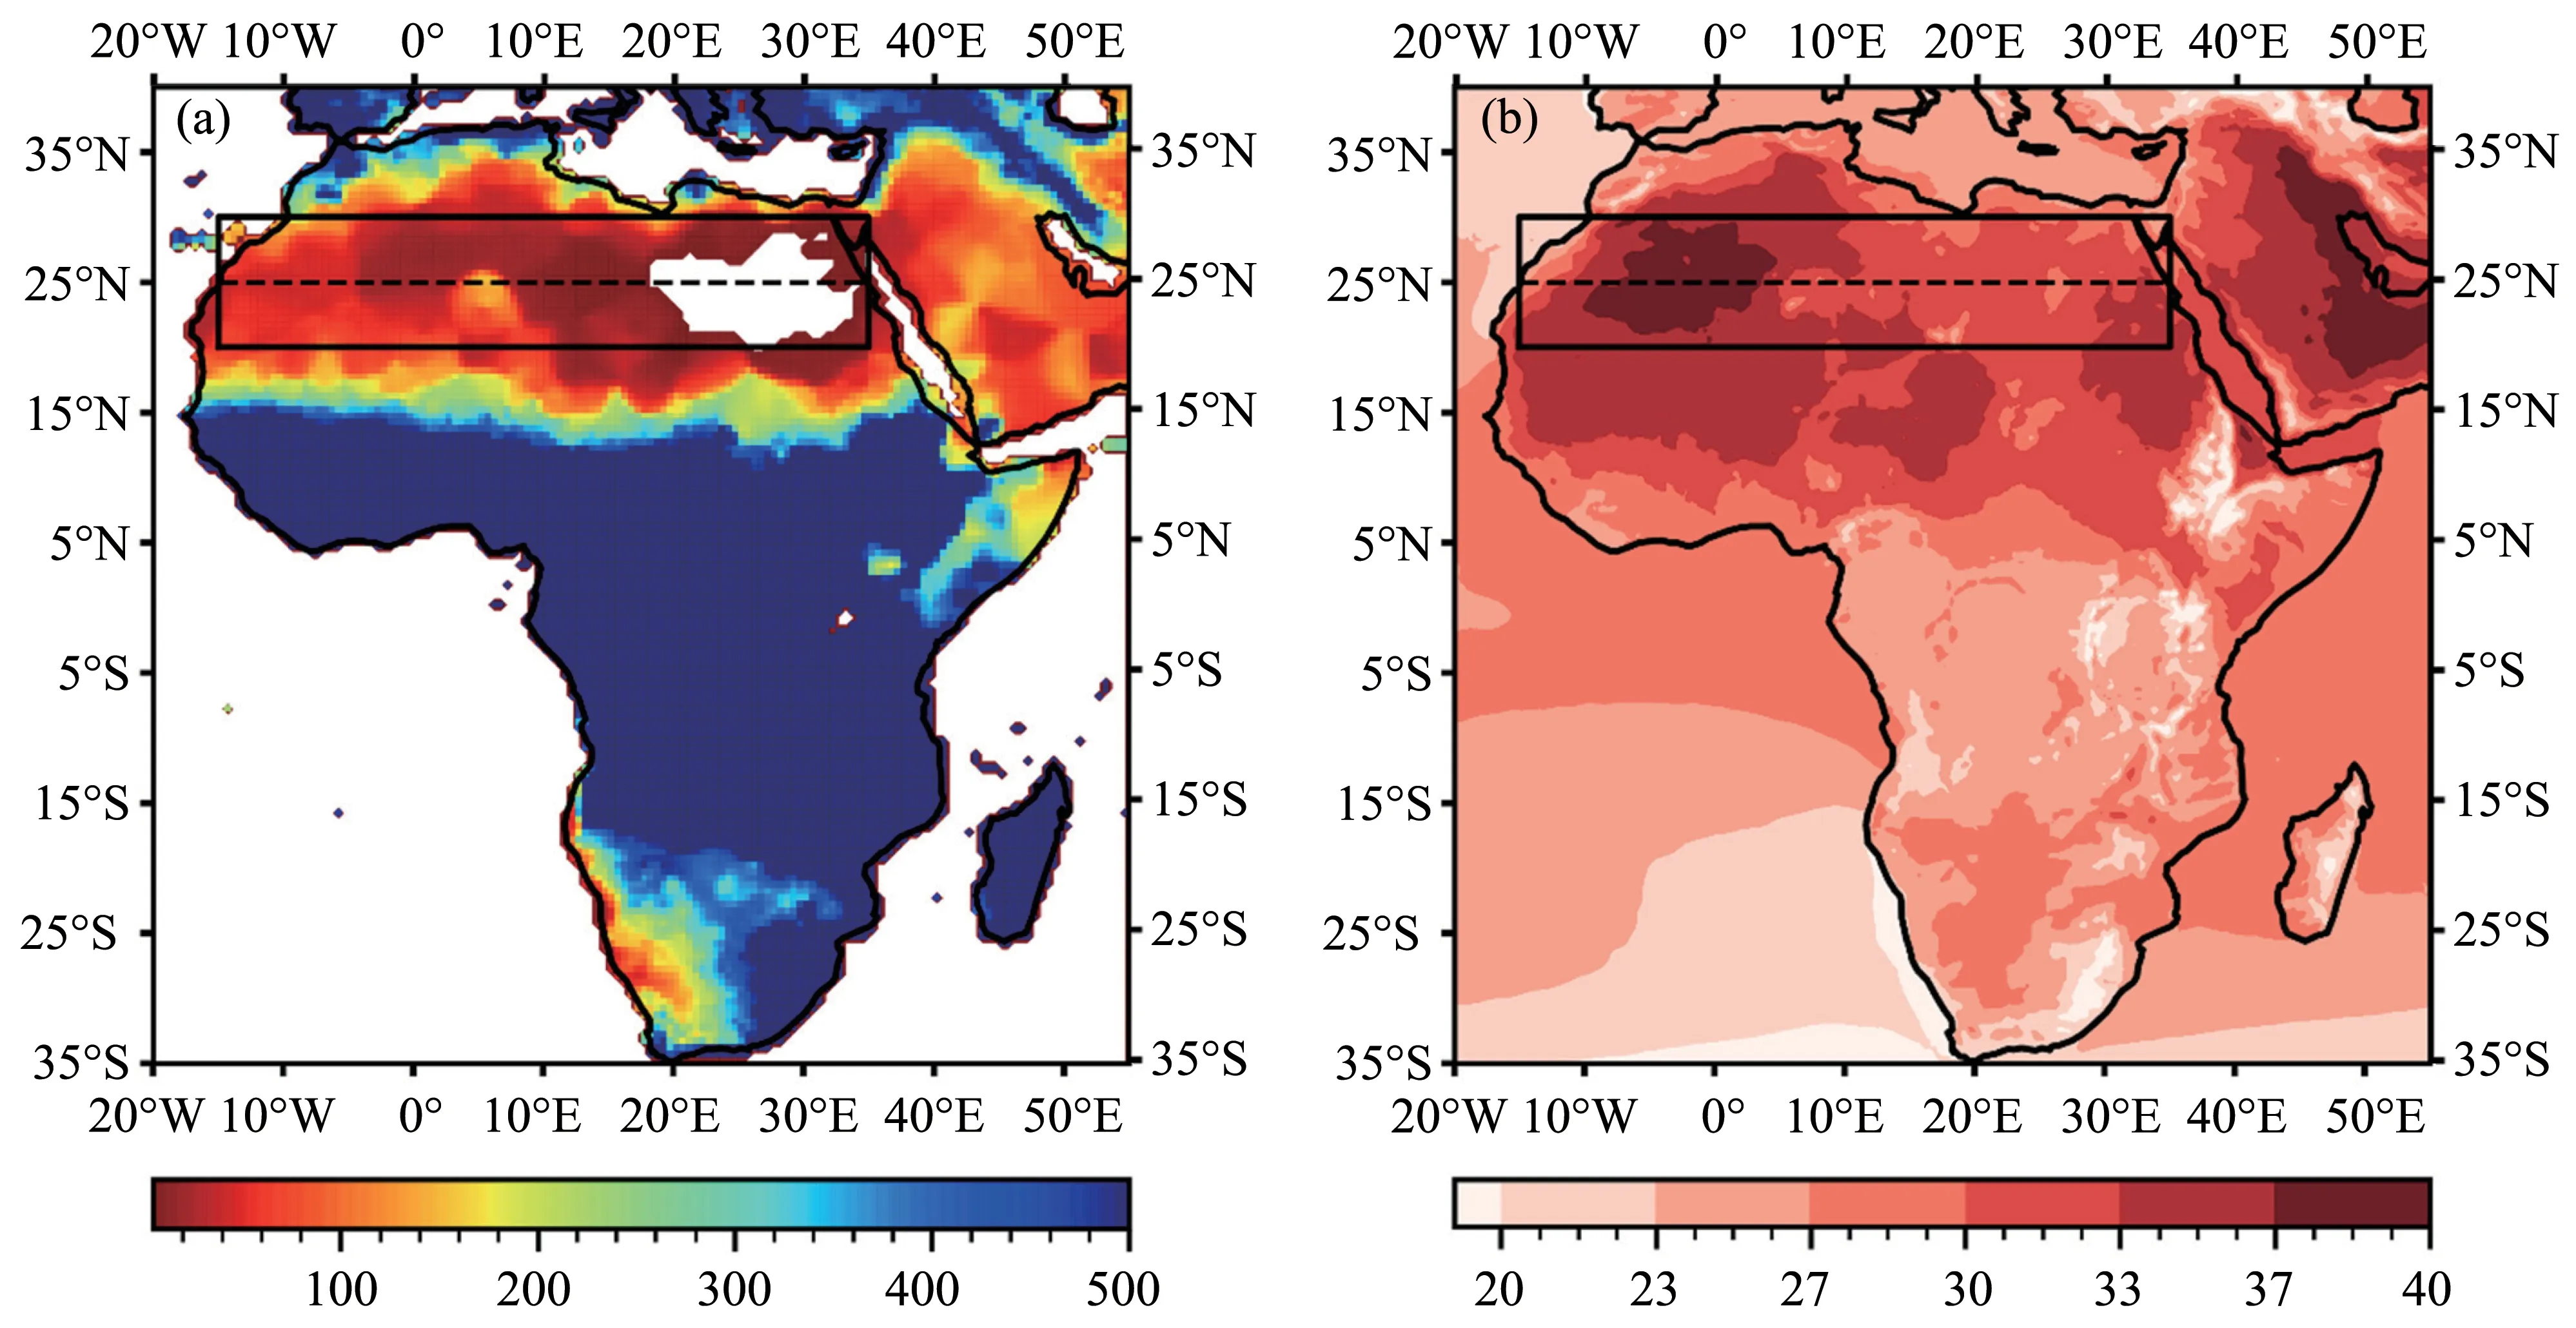
Figure 1 (a)Depicts the annual mean total precipitation estimated from GPCC dataset and(b)indicates the annual mean maximum temperature calculated from the ERA5 datasets.The dashed line divides the northern and southern parts of the Sahara Desert(box)
2.2 Data
Precipitation datasets with a spatial resolution of 0.5 degree were obtained from the Global precipita‐tion climatology Center (GPCC).The GPCC monthly product version 2018 is based on ground stations,near real-time and non-real-time.The spatial coverage of the GPCC dataset can reach 50,000 stations per month.Moreover,the monthly total precipitation data‐set has been newly generated based on a new GPCC climatological analysis background (Schneideret al.,2011).The length of temporal resolution deals with the monthly dataset and extends from 1979 to 2016.We used data from the European Centre for Medium-Range Weather Forecasts (ECMWF) to understand the general atmospheric circulation.The fifth genera‐tion of the ECMWF Re-Analysis (ERA5) dataset combines observations into globally complete fields using physics laws with the 4D-Var data assimilation method.The monthly datasets used include specific humidity,zonal and meridional wind components,and Sea Surface Temperature(SST)with a spatial res‐olution of 0.25°×0.25°.The SST dataset is averaged on a single level while specific humidity,zonal,and meridional wind are averaged on pressure levels(Hersbachet al.,2020).
2.3 Methods
Precipitation anomalies are calculated based on a 30-year climatological mean from 1981 −2010 and are used as the fundamental input dataset for further analysis.
whererepresents estimated anomalies from original time-series dataytat timetandstands for a 30-year climatological mean(1981−2000).
2.3.1 Mann-Kendall (MK) test method
The trend analysis adopted the Mann-Kendall(MK) test (Mann,1945).The famous MK test is a nonparametric test known for its simplicity and flexi‐bility in estimating trends.The test is widely used,es‐pecially in meteorological and hydrological studies(Asfawet al.,2018;Sindikubwaboet al.,2018;Weld‐egerimaet al.,2018;Praveenet al.,2020).The test is based on null and alternative hypotheses(H0 and H1).Alternative hypothesis H1 suggests a monotonic trend,while the null hypothesis assumes that the data is inde‐pendent and randomly distributed with no trend.The formulation of the MK test is presented below:
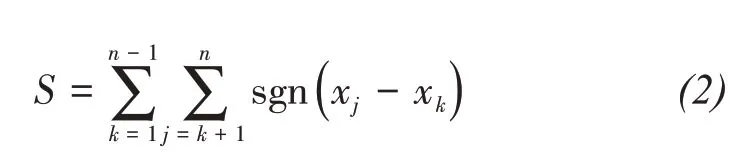
where,
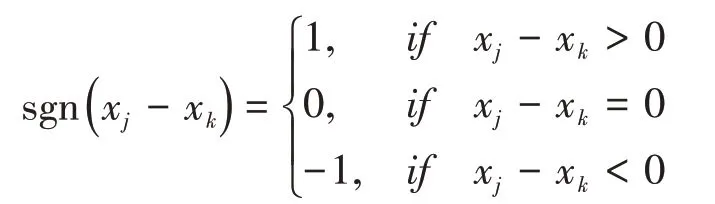
The componentsxjandxkare seasonal mean pre‐cipitation values in yearsjandkwithk>j.
Srepresents the Kendall test statistics and is as‐sumed to be normally distributed.A positive (nega‐tive) value ofSindicates an upward (downward)trend.Thus,for the selected sample withn≥10,the variance is calculated as follows:
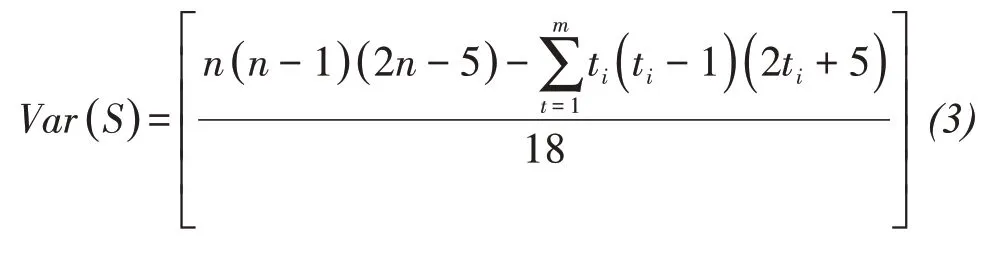
wherenis the number of observation and variablesmandtistand for the number of ties and sample points in the samplei,respectively.
The statistical testZis obtained from Equations(2)and(3)as follow:
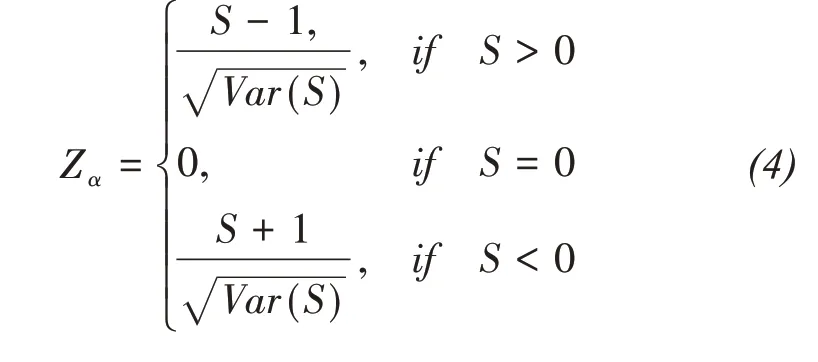
The positive or negativeZvalue depicts trend di‐rection(upward or downward).In caseZ=0,the data series is assumed to be normally distributed.The stan‐dard test statisticZαis used to measure the trend sig‐nificance.In case |Zα| is greater thanZα/2,the trend is significant.Here,α represents the chosen significance level(e.g.,5%withZ0.025=1.96).
2.3.2 Theil Sen's slope estimator
The magnitude of seasonal precipitation trends is based on Theil Sen's slope method (Sen,1968).Sen's slope estimator is another nonparametric method fre‐quently used to detect the magnitude of time series da‐ta.It also estimates an intercept of a linear regression equation.
For a given time seriesx,the computation of slopeQbetween two random values uses Equation(5)
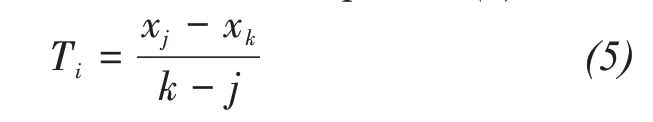
wherexkandxjare the data values at timeskandj(j>k)
The median ofNvalues ofQiis computed as
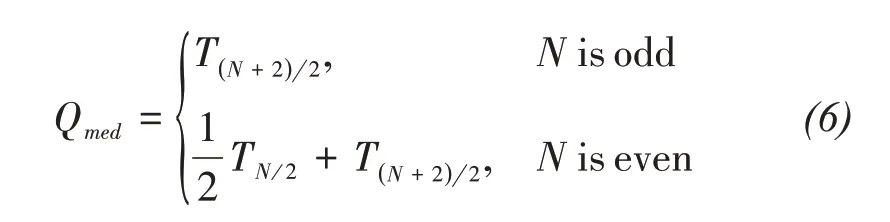
The positive or negativeQmedindicates an upward or downward trend.
2.3.3 Correlation analysis method
The analysis of the relationship between Sahara precipitation with regional and global climate vari‐ables adopted the statistical correlation function pre‐sented below:
whereris the coefficient of correlation and ranges between −1and1.
The positive (negative) values ofrindicate the positive (negative) relationship between Sahara pre‐cipitation and the given climate variable.Moreover,the significance test for obtained correlation coeffi‐cients is necessary.In this study,we used Pearson's correlation test to evaluate the significance of the correlation.
3 Results
3.1 Temporal variation of Sahara precipitation
Considering the Sahara Desert as a climatologi‐cal belt between tropical and Mediterranean cli‐mates,we analyzed the southern and northern parts separately.The northern part extends from latitude 25°N−30°N,and the southern part is bordered with the latitude of 20°N−25°N.Figure 2 shows the sea‐sonal features of the Sahara climate.It depicts the monthly mean precipitation averaged from 1979 to 2016 in both regions.
Even though the Sahara desert's overall precipita‐tion is small,however,it shows pronounced seasonal patterns.Figure 2 shows the monthly variation of pre‐cipitation in northern and southern regions.It depicts that rainfall in the northern Sahara is lower than that occurs in the southern Sahara throughout the year.The southern region receives relatively more rainfall in July,August,and September (JAS),and the month of August receives higher mean precipitation com‐pared to the other months.The JAS period is consid‐ered to be the wet season in the southern Sahara Des‐ert.In contrast,during the JAS period,the northern part of the Sahara Desert receives lower precipitation.Figure 2 shows that the Sahara Desert comprises two main seasons (winter and summer).During the winter season,precipitation occurs in the northern Sahara and begins in early boreal winter (October) and ends in middle boreal spring (April),with a prominent peak in December and January.In this period,month‐ly mean precipitation in the northern Sahara exceeds that observed in the southern Sahara.We have divided this long season into two periods.The first period in‐cludes the months of October,November,and Decem‐ber (OND),and the second period includes January,February,March,and April (JFMA).The summer sea‐son begins in July and ends in September.During this period,precipitation is mainly concentrated in the southern Sahara.This period is defined as a wet period as mentioned above.The period of May and June (MJ)shows a concurrent decrease and increase of precipita‐tion in the northern and southern Sahara,respectively.The MJ period is subjected to seasonal migration of precipitation from northern to southern Sahara Desert.
Figure 3 shows the spatial distribution of seasonal precipitation over the Sahara Desert.It reveals that the Sahara Desert receives low seasonal precipitation of less than 30 mm throughout the year.The large por‐tion of the eastern Sahara is dry and receives seasonal precipitation of less than 1 mm/a.The most vulnera‐ble region is found in Egypt and Libya.Figure 3 also shows that relatively higher rainfall occurs in the southwest during the JAS period,the portion extends from 15°W to 10°E.The northern region,especially the northeastern region [0−35°E],likely experiences dry conditions for all seasons.Summer precipitation shows a gradual migration from southwest to the northwest during the OND season and expands to northeastern Sahara during the JFM season.The MJ period shows a balanced distribution of rainfall over the Sahara.Therefore,the MJ period resembles the transition period between northern and southern Saha‐ra precipitation.
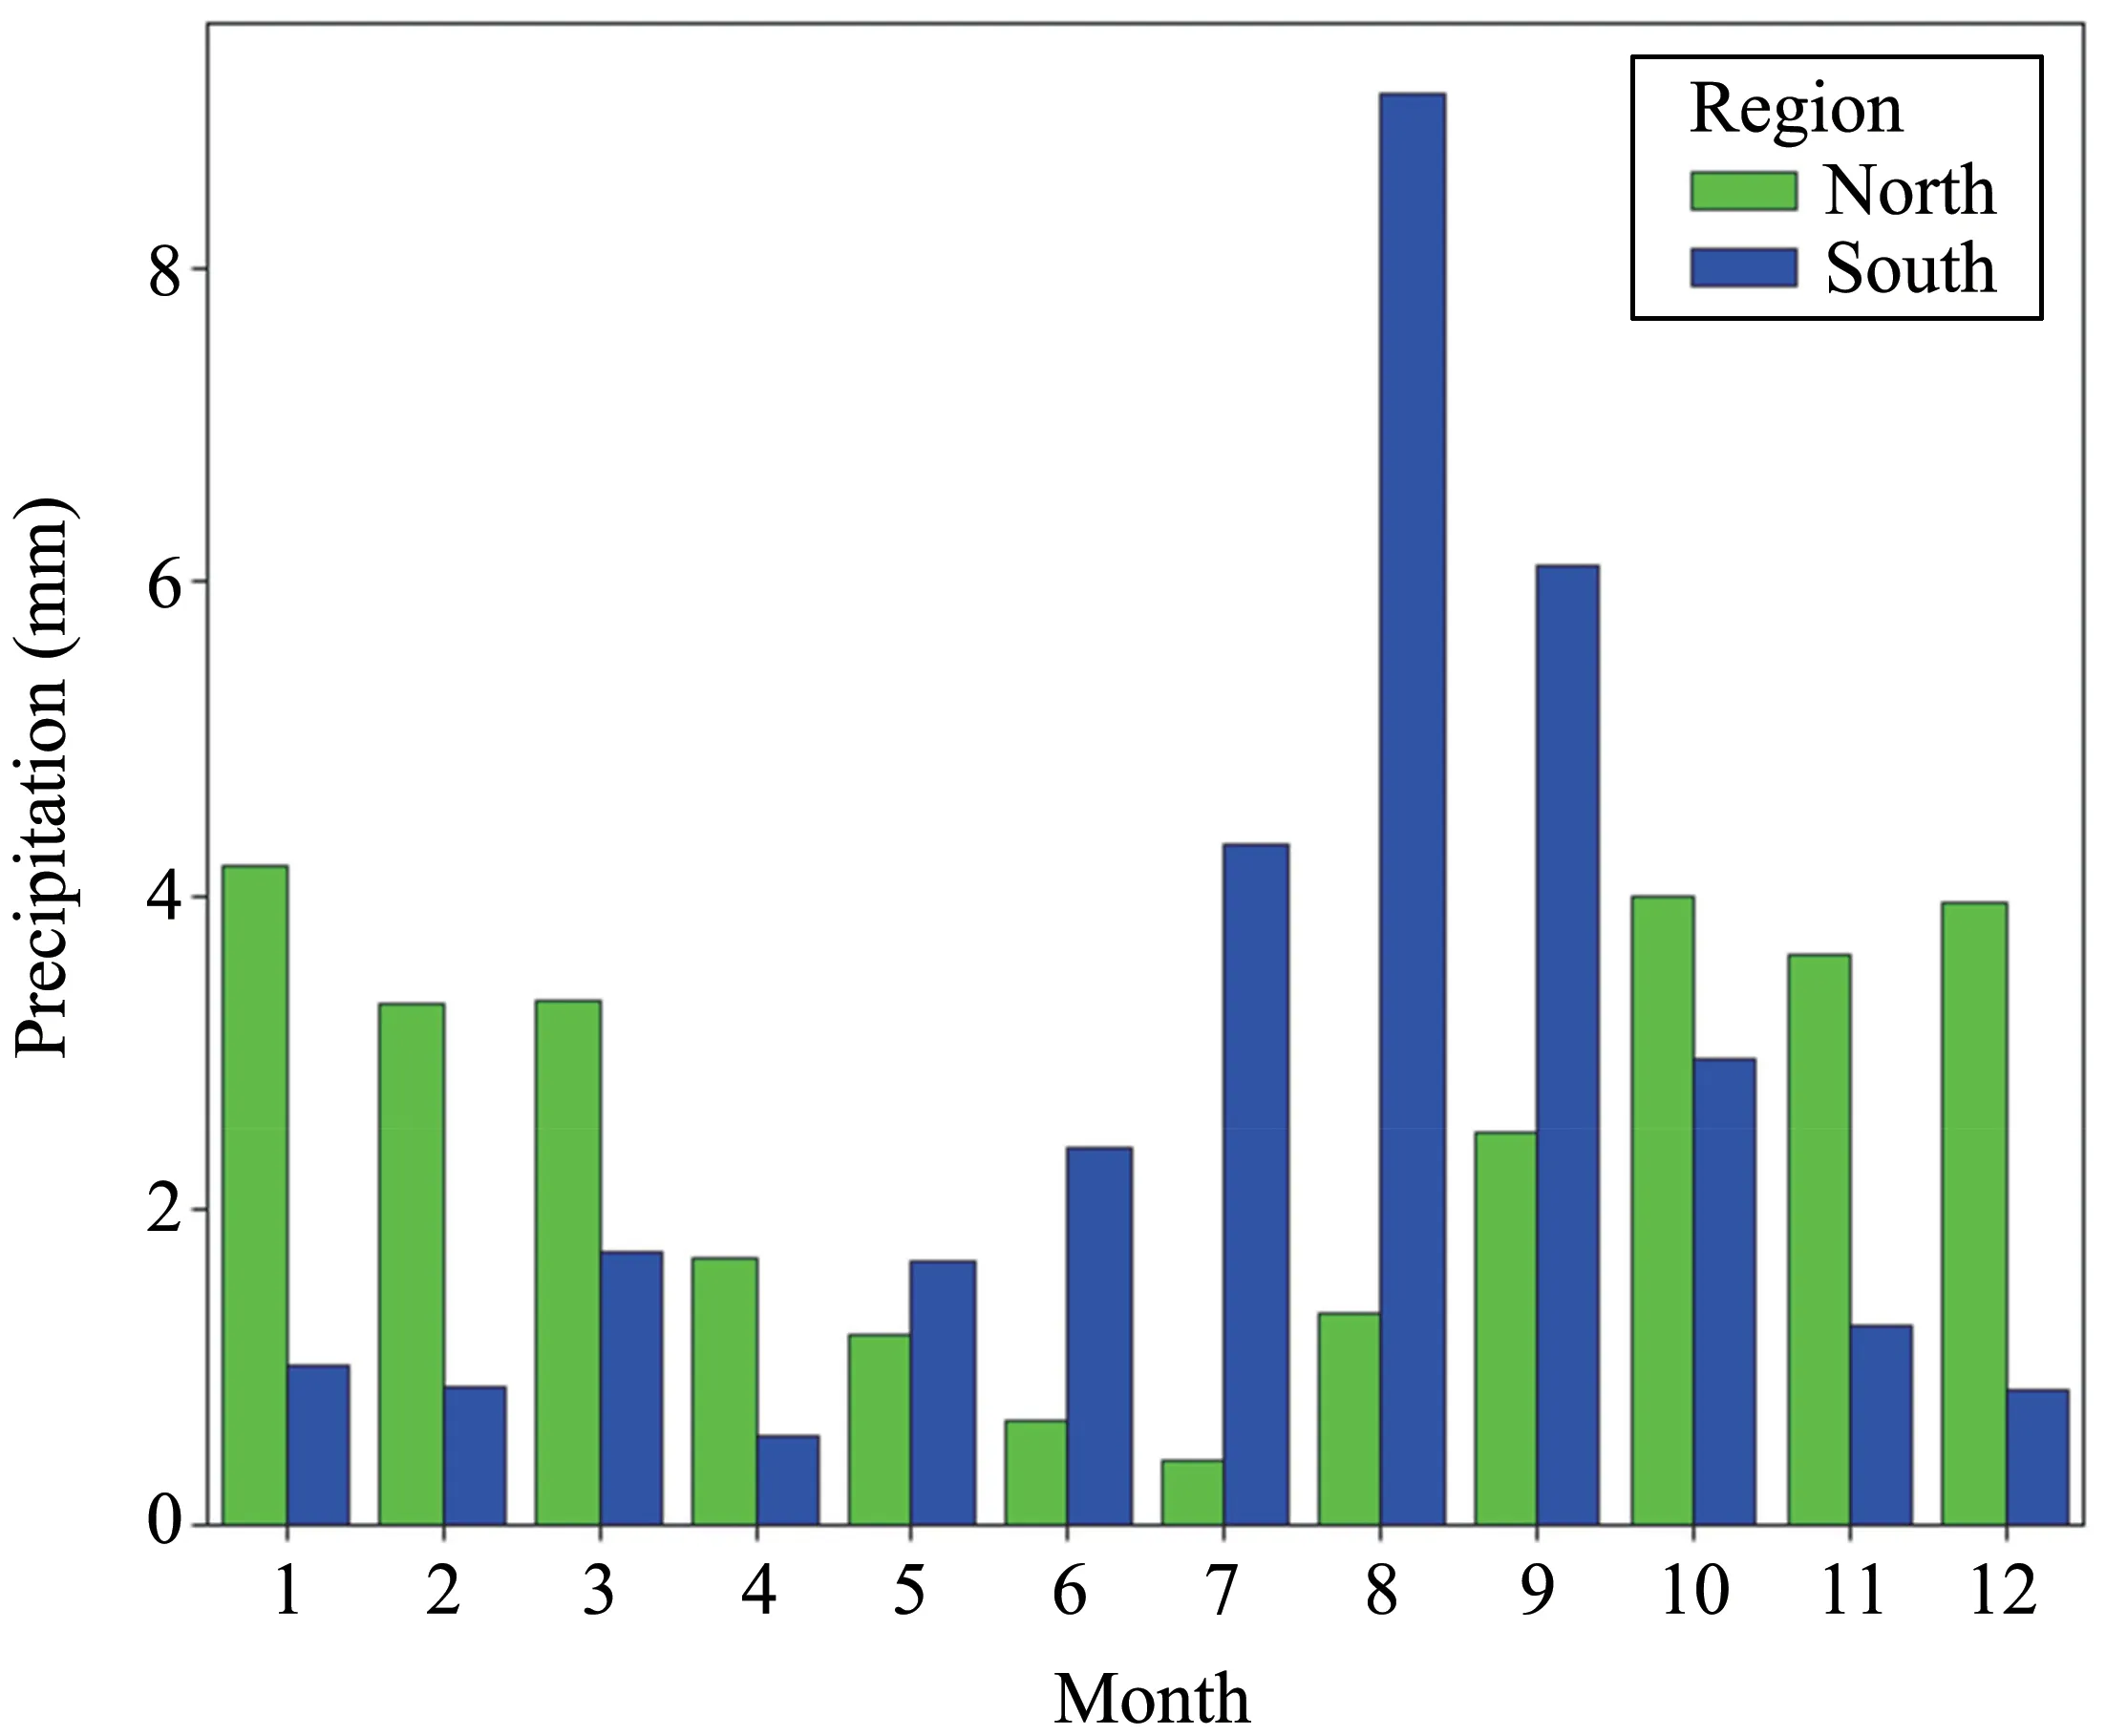
Figure 2 The monthly mean precipitation averaged between 1979 and 2016 in northern(green)and southern(blue)parts of the Sahara Desert
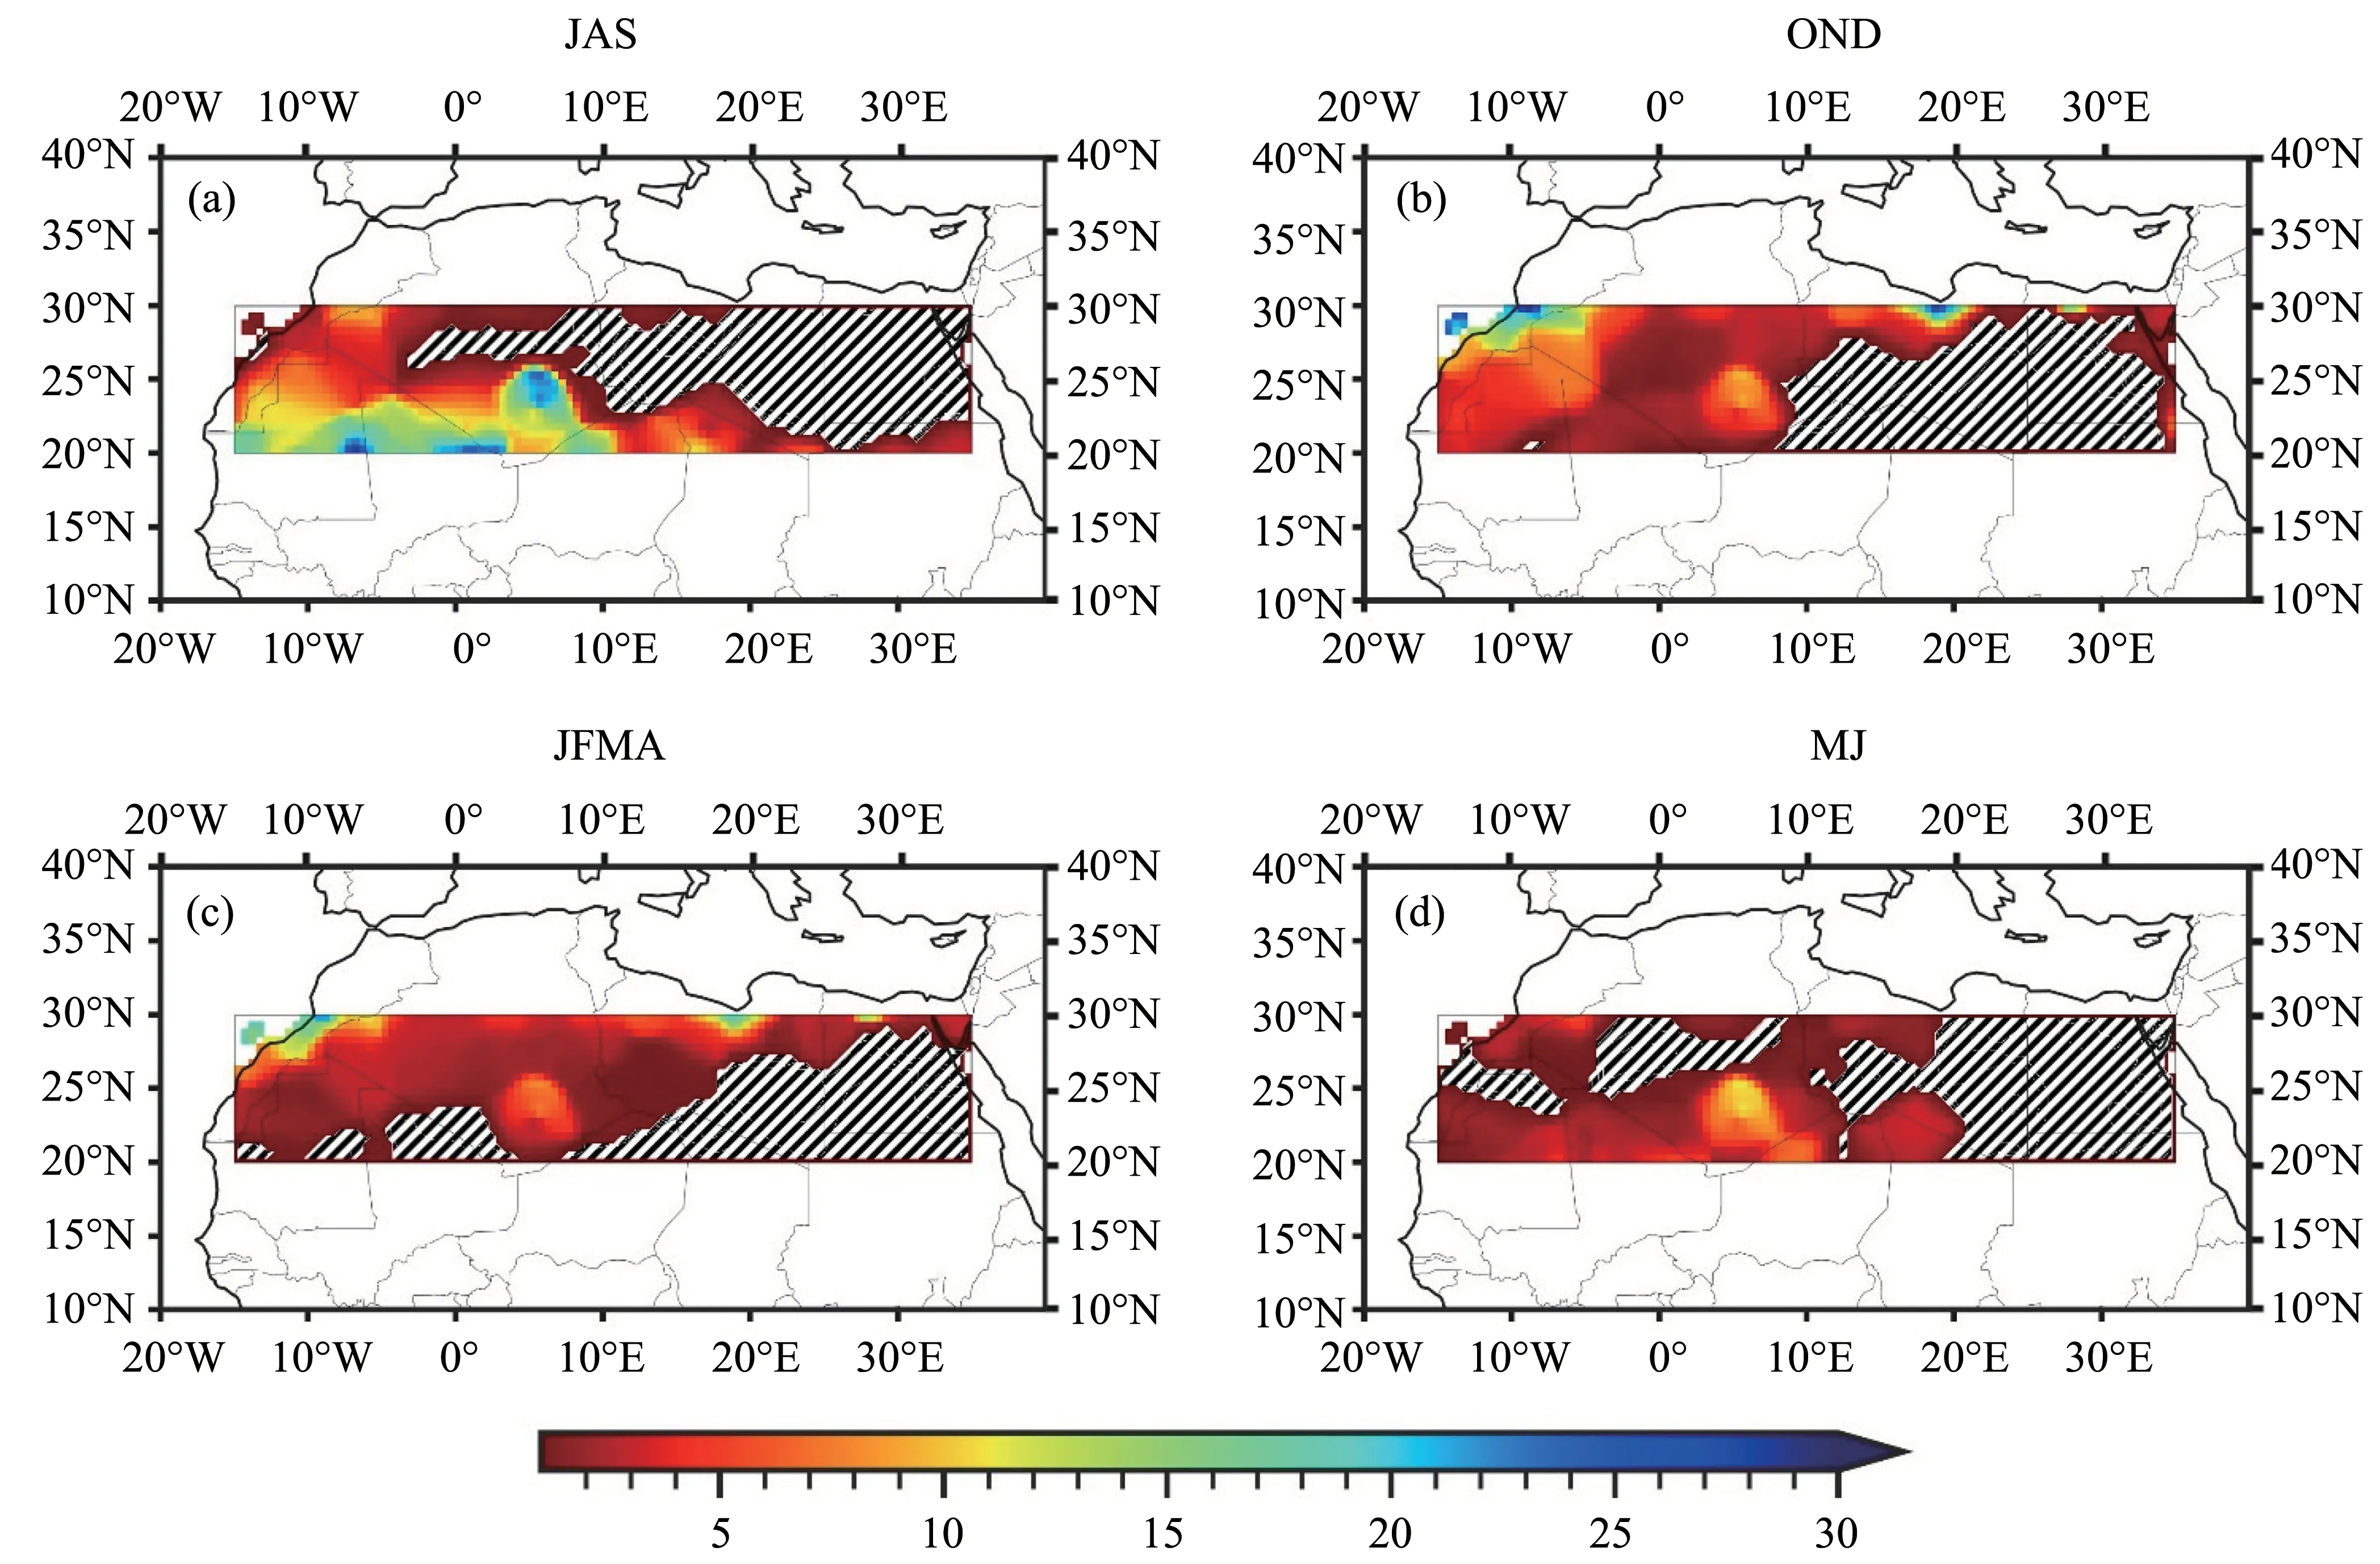
Figure 3 Spatial distributions of seasonal mean precipitation estimated from GPCC.The hatch areas indicate regions with seasonal mean precipitation of less than 1 mm
The spatial mean anomalies (Figure 4) shows that the JAS period is dominated by positive anomalies lo‐cated in southwestern Sahara (10°W−10°E) and cen‐tered in southern Algeria (Tamanrasset region).Posi‐tive anomalies also extend to the northwest and south‐east.The mean positive anomalies indicate a higher frequency and possible positive trends in southwest‐ern precipitation than the rest of the Sahara Desert.The OND period depicts average negative precipita‐tion anomalies,particularly in northeastern Sahara.Similar results are obtained in the JFMA period,which shows an expansion of spatial coverage for neg‐ative anomalies.The JFMA period shows weak posi‐tive anomalies in southwestern Sahara.The MJ sea‐son shows positive and negative precipitation anoma‐lies from west to east and it is limited to 15°E.
In this study,we investigated temporal changes in seasonal precipitation over the Sahara Desert.Figure 5 shows the temporal change in seasonal precipitation anomalies.The seasonal anomalies are calculated rela‐tively to a 30-year climatological mean averaged from 1981 to 2010.Figure 5a indicated that the precipita‐tion anomalies of the JAS period increased signifi‐cantly with a positive trend of 1.43 mm per decade in the southern region and 0.42 mm per decade in the northern Sahara Desert.The JAS period has relatively presented a large standard deviation compared with a 30-year climatological mean through an apparent posi‐tive anomaly observed after 2010,especially in the southern Sahara Desert.
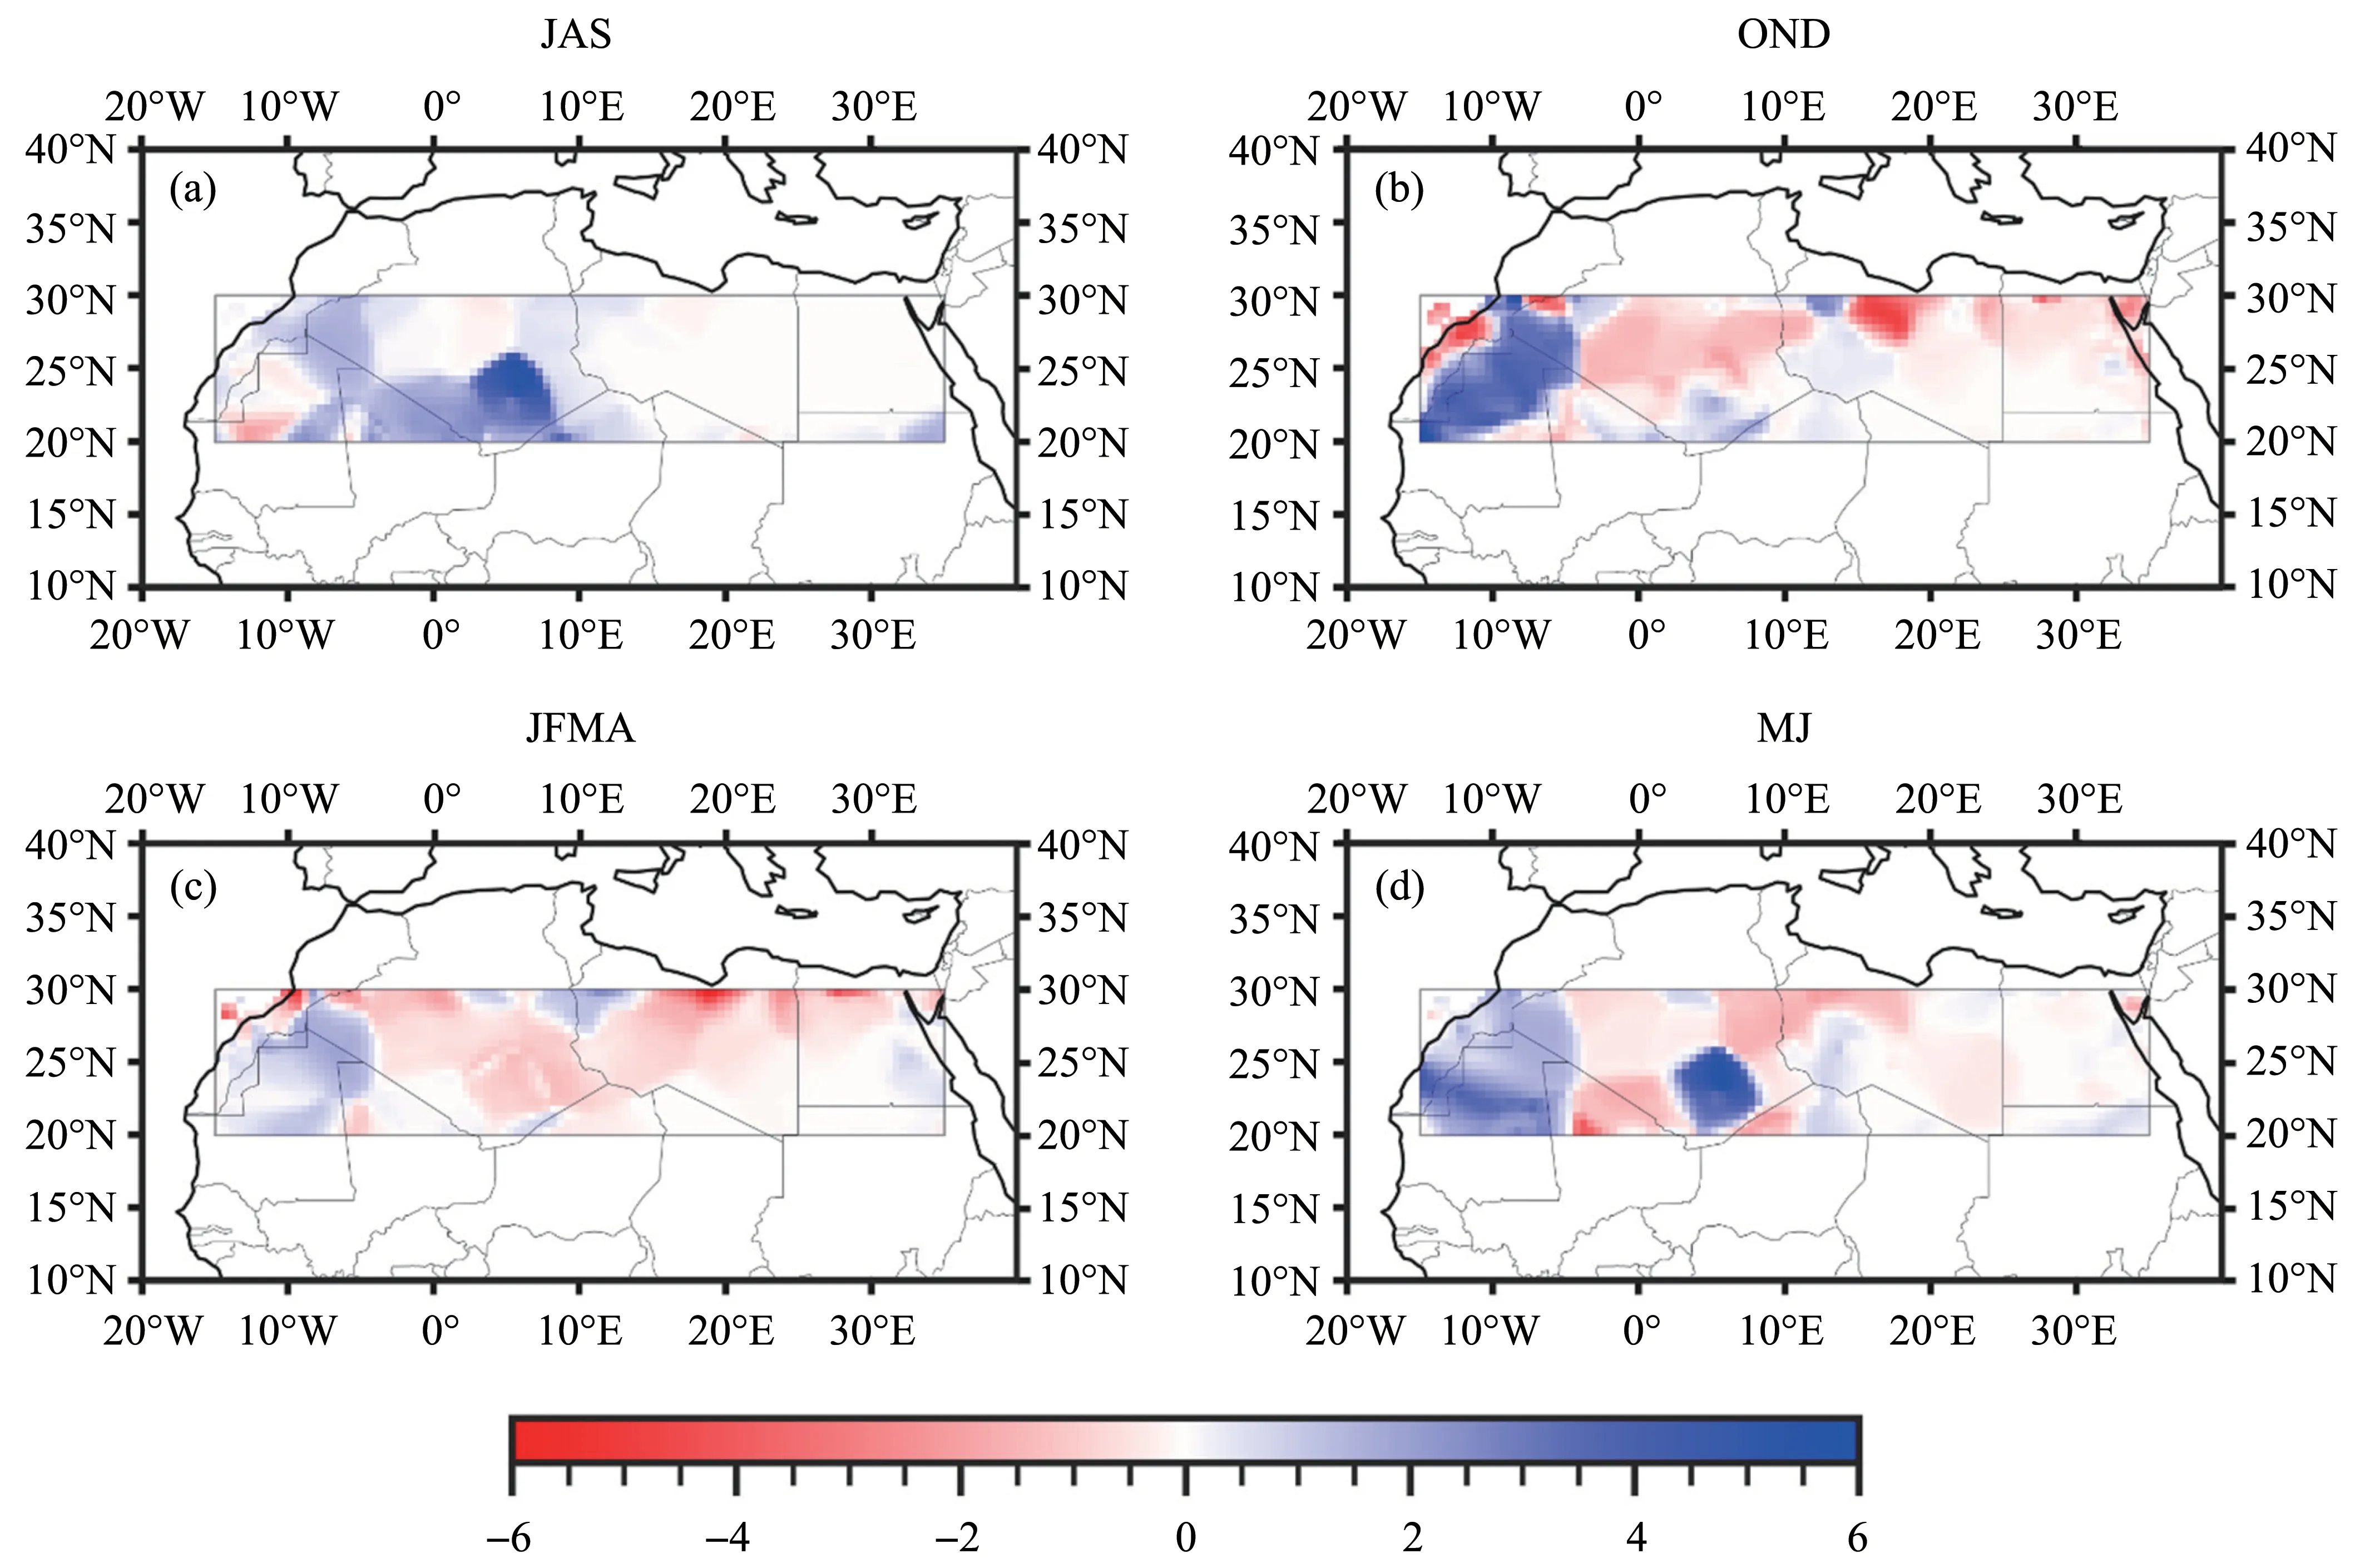
Figure 4 Spatial mean seasonal precipitation anomalies averaged from temporal seasonal anomaly calculated with respect to the 30-year climatological mean(1981−2000)
Except for the JAS season,the other seasons pres‐ent relatively low precipitation anomalies.For exam‐ple,the OND period in Figure 5b showed a flat trend and low magnitude over the whole Sahara,however,it showed remarkable fluctuations in the years of 1994 and 2004.The OND period shows a low but pos‐itive slope of 0.1 mm and 0.05 mm per decade for the southern and northern Sahara,respectively.Moreover,the trends of precipitation anomalies in the OND peri‐od are not statistically significant(P>0.05).Figure 5c also shows low precipitation anomalies in the JFMA period with negative slope values of −0.14 mm and−0.3 mm per decade in southern and northern Sahara,respectively.The negative trend in the JFMA period may be subjected to the obvious negative tendency of precipitation anomalies in 2006 −2016.In addition,this period is predominated with large positive fluctu‐ation anomalies like those observed in MJ period,sug‐gesting how unstable precipitation is in both periods.The details on the MK-test and Theil Sen's slope re‐sults are presented in Table 1.
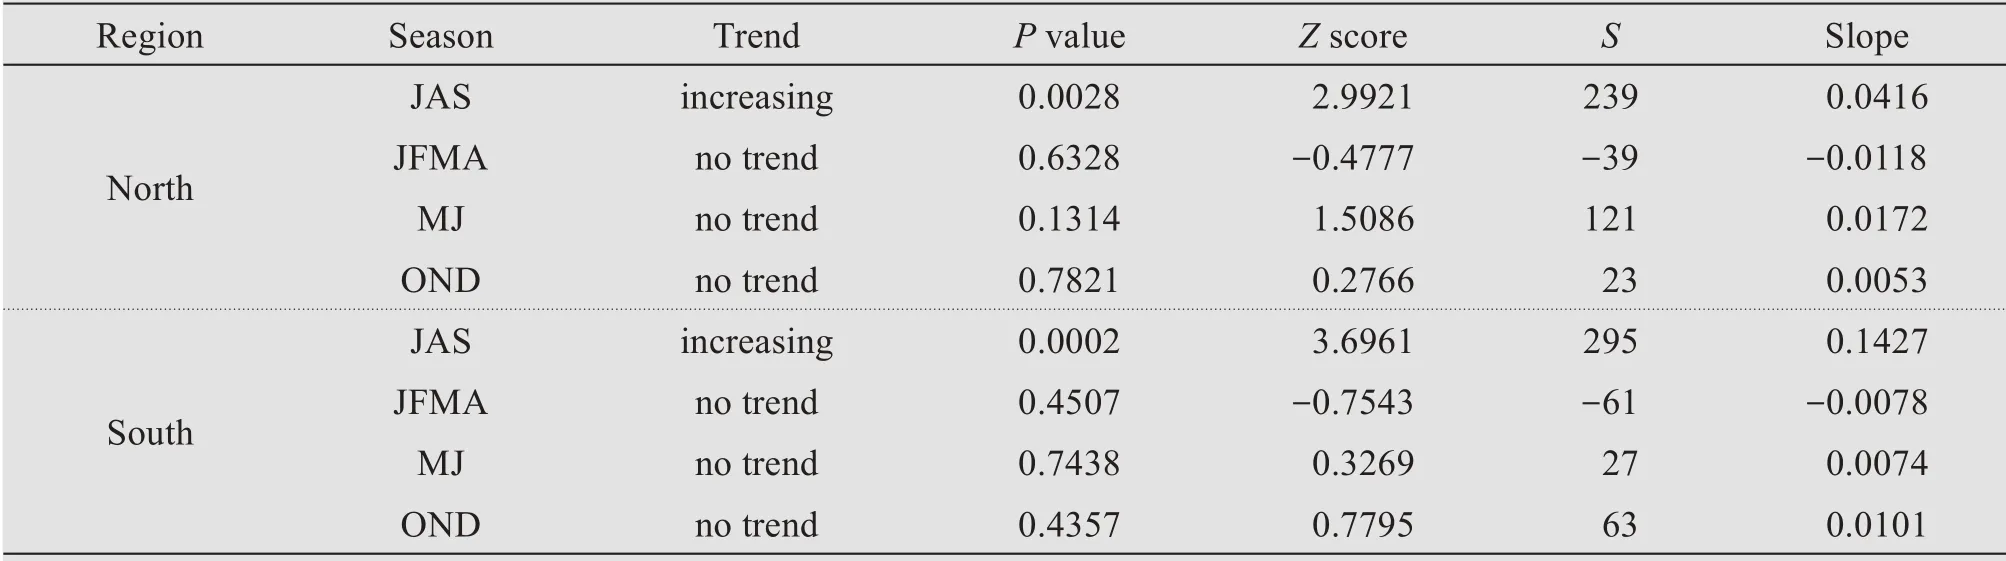
Table 1 Results summary of the MK-test and Theil Sen's slope computed from seasonal precipitation over the Sahara Desert.Note:the positive(negative)values of Z score,S and Slope indicate an upward(downward)trend,while the Z score ≥1.96 and P-value ≤0.05 indicate trend significance
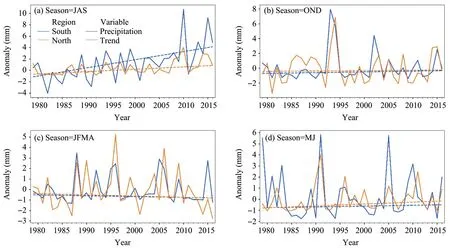
Figure 5 The seasonal precipitation anomalies for the northern(orange)and southern(blue)Sahara Desert.The anomalies are calculated in respect to the 30-year climatological mean(1981−2000)
3.2 The role of climate variability to Sahara Precipitation changes
3.2.1 air temperature and sea surface temperature
The effect of global warming on arid and semi-ar‐id regions is evident and has been reflected from var‐ious perspectives (El-Beltagy and Madkour,2012;Huanget al.,2016).The sea surface temperature is one of the climate change indicators,which revealed global warming (Gaetaniet al.,2017).It is also an important element for controlling global atmospheric variability.Moreover,variability of the Tropical SST has revealed a significant influence on flood and drought disasters (Prospero and Nees,1986;Yinetal.,2009;Parket al.,2020).In this study,we evaluat‐ed an interconnection between Sahara precipitation anomalies and sea surface temperature changes(SST).
Figure 6a depicts the spatial correlation between SST anomalies and Sahara precipitation of the JAS period.The SST anomalies were computed in similar way as for precipitation anomalies were calculated.The significant test shows a relationship between JAS precipitation and north hemispheric SST,particularly in the North Atlantic and Mediterranean regions.The seasonal mean SST anomalies increased by 0.2°C/de‐cade in the JAS season of the last 38 years (1979 −2016).A positive correlation is observed on the west coast of the Sahara Desert with a westward expansion into the northern tropical Atlantic (NTA) region.This expansion of positive correlation in the NTA region triggered an interest in evaluating the relationship be‐tween the NTA index and Sahara precipitation and Figure 6b compared the variability of the NTA SST anomalies (NTA index) and the southern Sahara pre‐cipitation anomalies.The results show corresponding patterns in both anomalies.In the early 1980s,the NTA SST anomalies and Southern Sahara precipita‐tion anomalies are dominated with a negative phase,suggesting that cooling in the NTA SST contributed to a weakening in southern Sahara precipitation.The op‐posite patterns are observed from 2000 to 2016.Southern Sahara precipitation and NTA SST anoma‐lies present positive values.Moreover,the 1990s are characterized by the fluctuation of negative and posi‐tive anomalies.Apart from the NTA region,the posi‐tive and significant correlation is also depicted in the western Mediterranean Sea and the southern coast of Greenland.The mean SST anomalies in both regions range from 0.3°C to 0.8°C.
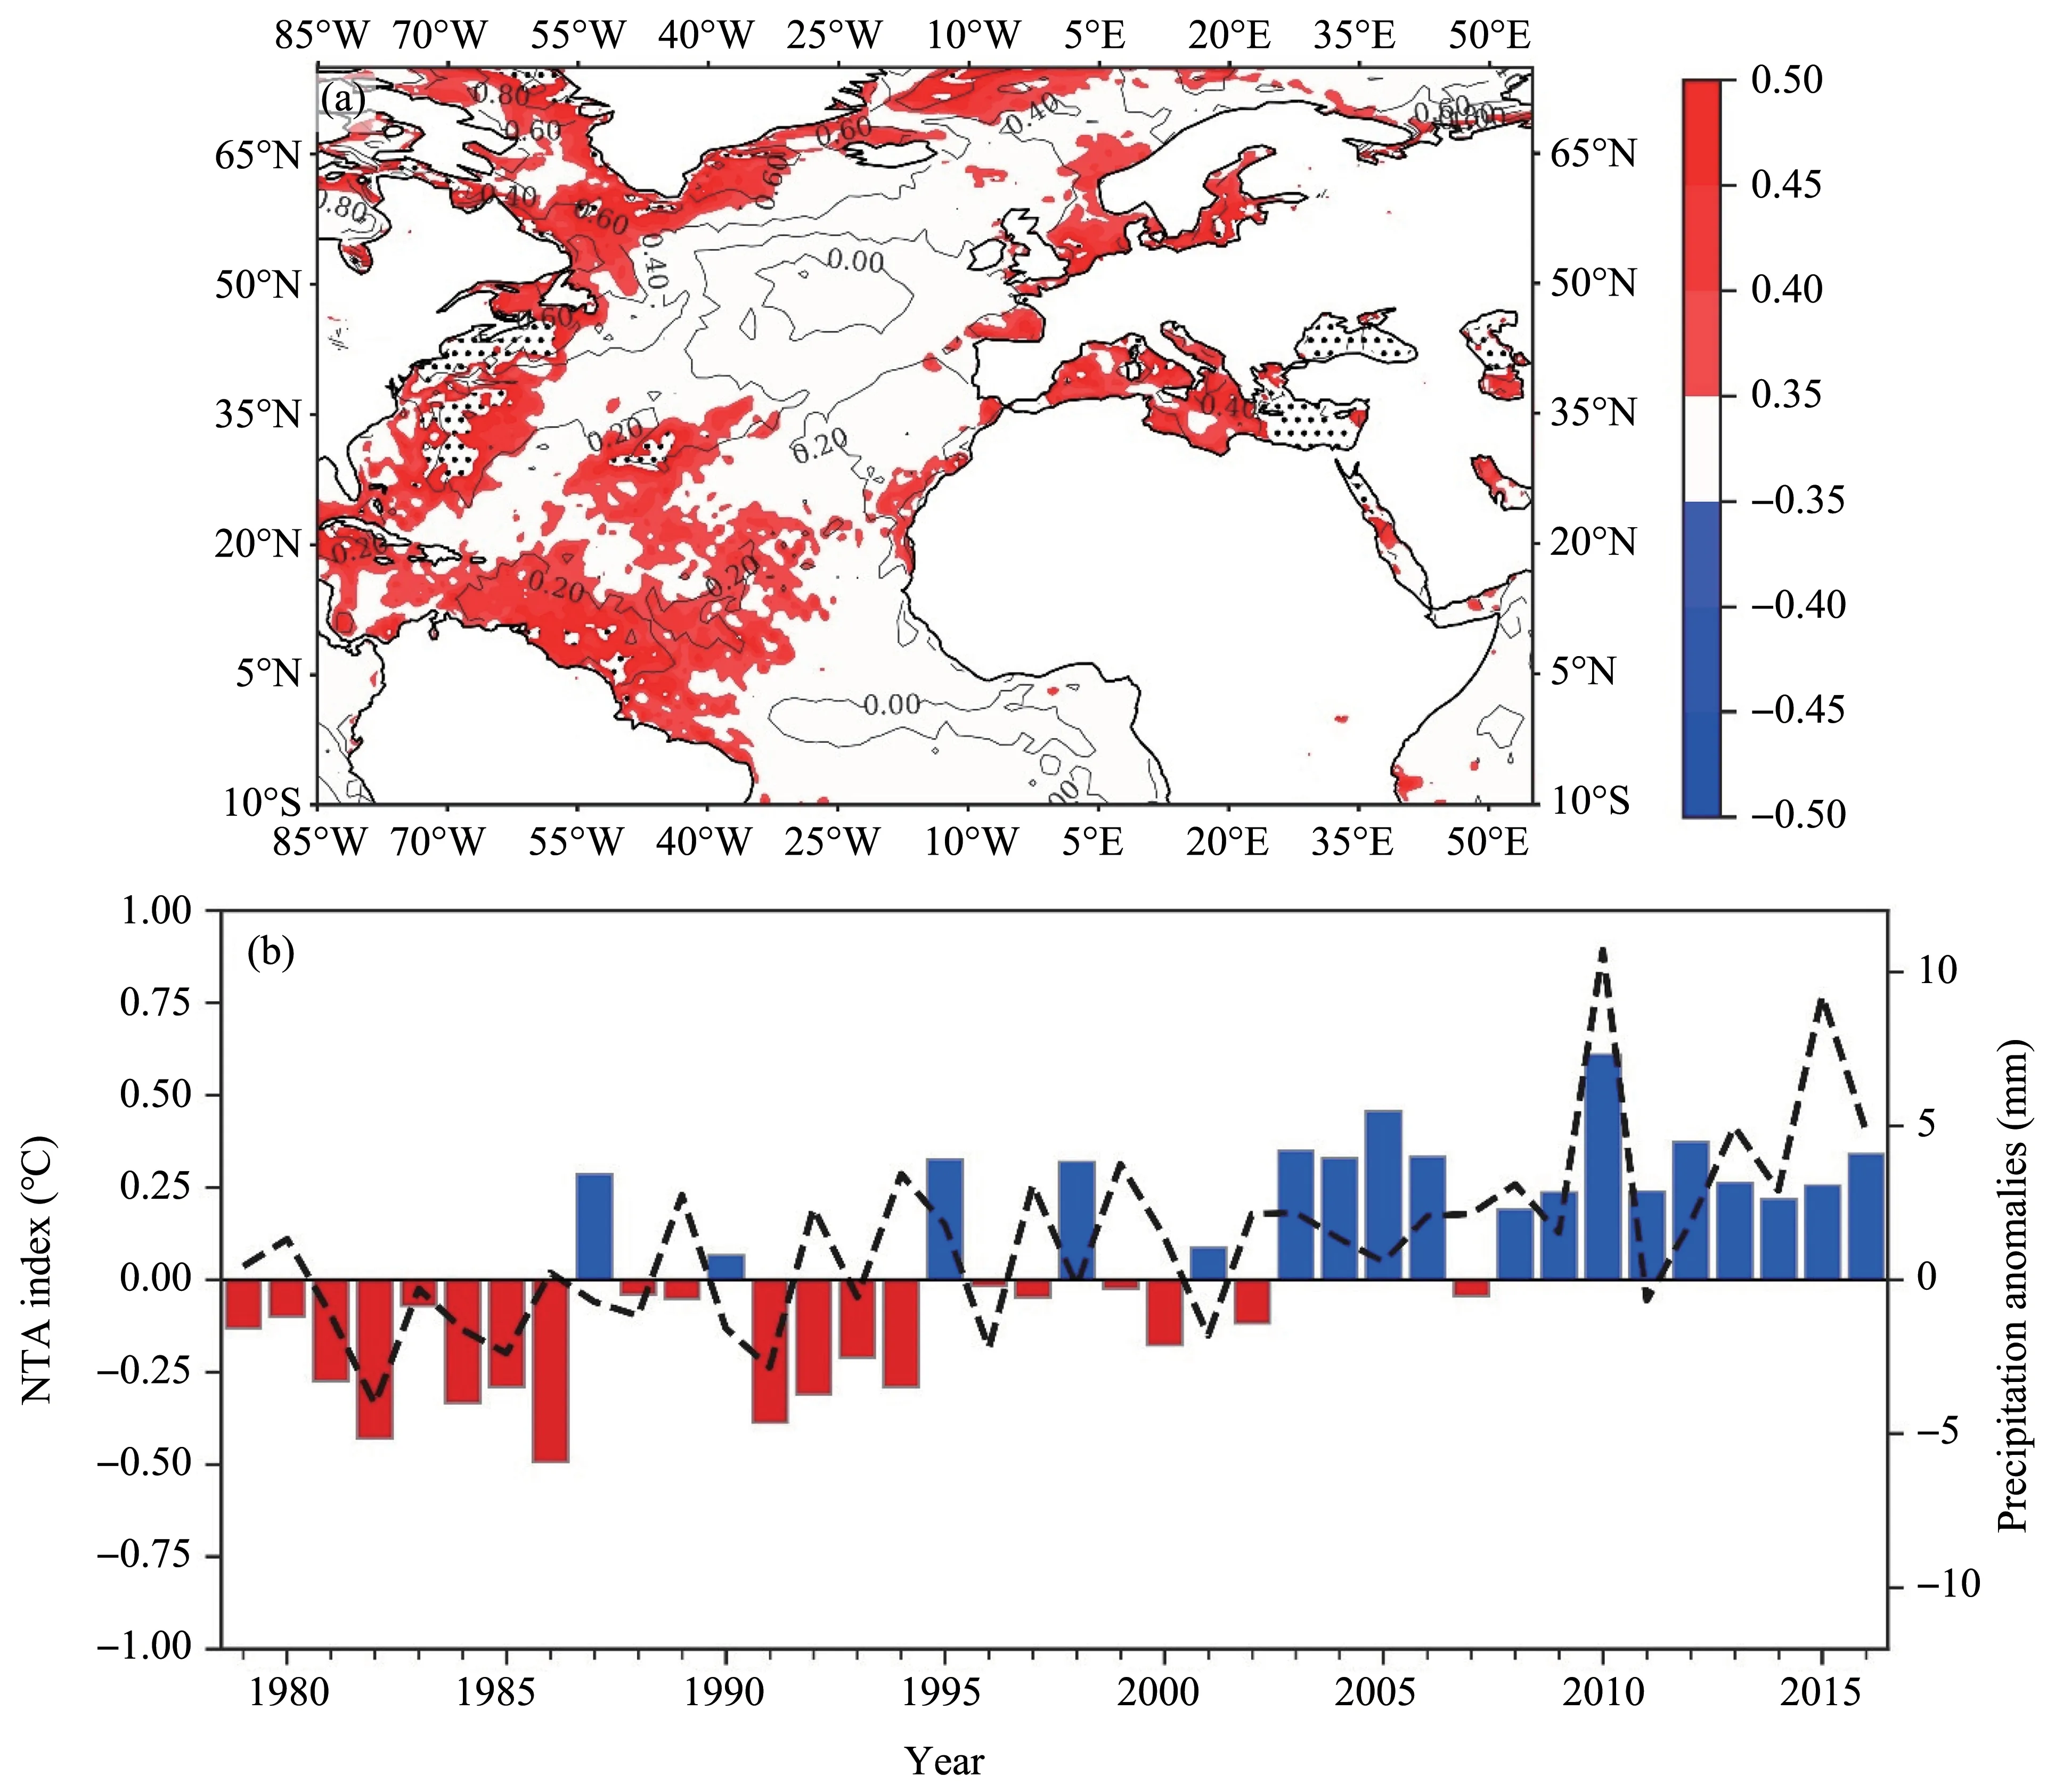
Figure 6 (a)Correlation between the southern Sahara precipitation and SST anomalies(b)Variation of NTA SST anomalies(bar)and southern Sahara precipitation anomalies during the JAS period 1979−2016(dash line).The contour values and dots indicate the spatial and significant estimated from SST anomalies of the JAS period 1979−2016
3.2.2 General Circulation
The general circulation components considered in this study include water vapor transport and zonal wind.Atmospheric water vapor is a vital component in the hydrological cycle,and it has a crucial contribu‐tion to the large-scale water balance (Held and Soden,2006;Wordenet al.,2007;Junget al.,2010;Sch‐neideret al.,2010).Moreover,it assists in dynamic processes of general atmospheric circulation (Sch‐neideret al.,2010).Figure 7 compare changes in sea‐sonal general circulation components.Figures 7a,7b plot the relationship between Sahara precipitation and specific humidity at 950 hPa for winter and summer seasons,respectively,they also plot moisture flux at 950 hPa and water vapor content at 1,000 hPa.Figures 7c,7d depict seasonal changes of upper tropospheric zonal wind at 200 hPa for winter and summer,respec‐tively.Figures 7e,7f plot similar content as of Figures 7c,7d but in the middle troposphere at 600 hPa.

Figure 7 Comparison of seasonal changes in general circulation components.Contour lines indicate the seasonal mean of specific humidity(a,d)at 1000 hPa,zonal wind at 200 hPa(b,e)and zonal wind at 600 hPa(c,f).Colors in(a,d)indicate correlation between southern Sahara precipitation and Specific humidity at 950 hPa for(a)winter and(d)summer,and arrows in(a,d)depicts seasonal moisture flux calculated at 950 hPa
Figure 7a shows that during the JFMA period,the correlation between Sahara precipitation and regional specific humidity is weak and the seasonal mean spe‐cific humidity at 1,000 hPa is averaged to 3 g/kg in the southern Sahara.Since the JFMA precipitation in the southern part shows a negative trend,the positive correlation with specific moisture may indicate a simi‐lar decrease in moisture over Ahaggar and Tassili-n-Ajjer mountains.The Sahelian moisture flux is charac‐terized by a southeastward direction and intercepts that from the Guinean Gulf which results in an east‐ward movement.Concurrently,the westerly jets at 200 hPa in Figure 7b are centered over Sahara and prevails at speed ranged between 36 m/s and 48 m/s.The eastern 20°E is most vulnerable and zonal wind speed can reach a maximum of 48 m/s.In the middle troposphere at 600 hPa,westerly zonal winds vary ap‐proximately between 7.5 m/s and 13.5 m/s,with an east‐ward increase reaching a maximum speed of 13.5 m/s over northern Sahara (Egypt).Meanwhile,the African Easterly Jet (AEJ) is centered around 0° with mean wind speed of 7.5 m/s (see Figure 7c).Cook (1998)demonstrated that the AEJ is generally confined be‐tween 5°N−10°N with jet core swings around 15°N on the west coast of Africa.The maximum velocity ranged between 11 m/s and 12.5 m/s during the sum‐mer season (Cook,1999).The AEJ is southerly ex‐panded with northward intensity decrease and limit‐ed near 10°N.From moisture transport and AEJ per‐spectives,the JFMA precipitation possesses a nearly zero contribution from southerly moisture and is free from the AEJ wave disturbances.However,the strong jets streams at 200 hPa and discontinuity of north‐ward moisture from tropical regions may be attribut‐ed to the causes of a small amount of winter precipi‐tation occurring in the Sahara Desert.
In the JAS period,Figure 7d shows a statistical sig‐nificance between southern Sahara precipitation and moisture of the surrounding regions.The main contrib‐uting regions include the Sahel region in the south,NTA and Mediterranean regions.The seasonal mean specific humidity at 1,000 hPa varies between 5 g/kg and 10 g/kg in the western Sahara,with a northward and southward decrease from Sahel and Mediterra‐nean regions,respectively.The positive and signifi‐cant correlation is observed in neighboring regions with mean specific humidity greater than 6 g/kg.The moisture flux shows a northeasterly penetration of moist air from the Mediterranean Sea but limited to the east of 20°E.Moreover,the middle troposphere(500 hPa) of the western part of 20°E encountered a higher geopotential height which is averaged to 5,900 m and extends westward to approximately 60°W(Figure not presented).It is suggested that west moisture branch sinks and forms the continental anticyclone flow over Western Sahara due to the weakening and shift of the Azores high which may enhance the for‐mation of the coastal cyclonic flow and lead to the penetration of cold air from the Atlantic Ocean to the Sahara Desert.Previous studies show that the variabil‐ity in the Azores high controls the dry and wet sea‐sons of the Mediterranean region(Almazroui and Awad,2016;Şahinet al.,2018).In the southern Saha‐ra,an inversion penetration of moisture from the Guinean Gulf is obvious and significant.The mois‐ture from the Sahel region is known to be one crucial contributing factor of Sahara precipitation changes(Haradaet al.,2003).The southern Sahara Desert shares rainfall mechanisms with the tropical monsoon region,especially,the Sahel region (Vischelet al.,2019).Moreover,in the upper troposphere of the Sahara desert,the summer westerly zonal wind at 200 hPa change dramatically and decreases to the range of 0 m/s and 12.5 m/s(see Figure 7e).Figure 7f depicts a northward migration of the AEJ at 600 hPa shows and settle the center between 10°N−20°N with mean wind speed of 10.5 m/s.The further north‐ward penetration of the AEJ occurred and reached the western region of 20°E.In summary,the summer rain‐fall in the Sahara Desert is driven by an increase and penetration of moist air from the Guinean Gulf and Mediterranean region accompanied by a northward penetration of the AEJ and weakening in the upper tropospheric zonal wind.
3.2.3 Composite Analysis
The composite analysis of water vapor,moisture flux and zonal wind between wet and dry periods of summer season is presented in Figure 8.The wet and dry periods are defined based on years with higher and lower precipitation anomalies,respectively.The JAS period of 2010 and 2015 shows to be wet years while the JAS period of 1982,and 1991 shows rela‐tive dry conditions.Therefore,average of general cir‐culation components (specific humidity,moisture flux and zonal wind) is calculated for each period.More‐over,the composite analysis is performed based on differences between wet and dry periods.Our results show that the mean moisture of the wet period in‐creased by the range of 0.8−2.5 g/kg,particularly west of 20°E.A similar increase is observed in the Sahel re‐gion,north of 15°N.Moisture increase extends west‐ward reaching the east coast of the North Atlantic Ocean.At 950 hPa,moisture flux shows a northeast‐ward penetration to the west coast of Sahel and in‐vades to the southwestern edge of the Sahara.Over eastern Sahel (near 20° E),the stronger northward moisture flux is developed and partially penetrates over a small portion of southeastern Sahara.At the same atmospheric level,the southward invasion of moisture increases and moisture flux penetration from the Mediterranean region was observed.The moisture increased westward and centered over the northern Sa‐hara around 0°.In upper troposphere at 200 hPa,the wet period shows a northward inversion of easterly wind centered around 25°E with a decreasing speed.The weakening in zonal wind speed covers the entire region of the Sahara Desert.In addition,the westerly zonal wind experienced a northward migration with a decrease by 1 m/s.It is worthy to note that the in‐crease of southern Sahara precipitation has likely de‐pendence on the westward and northward penetration of moisture and the weakening of zonal wind.Previ‐ous studies reported a significant influence of tropical easterly and mid-latitude westerly to the wet period of north Africa (Haradaet al.,2003),and the formation of extratropical cyclones show a close relationship with upper tropospheric westerlies and extratropical rainfall(Nicholson,1981).
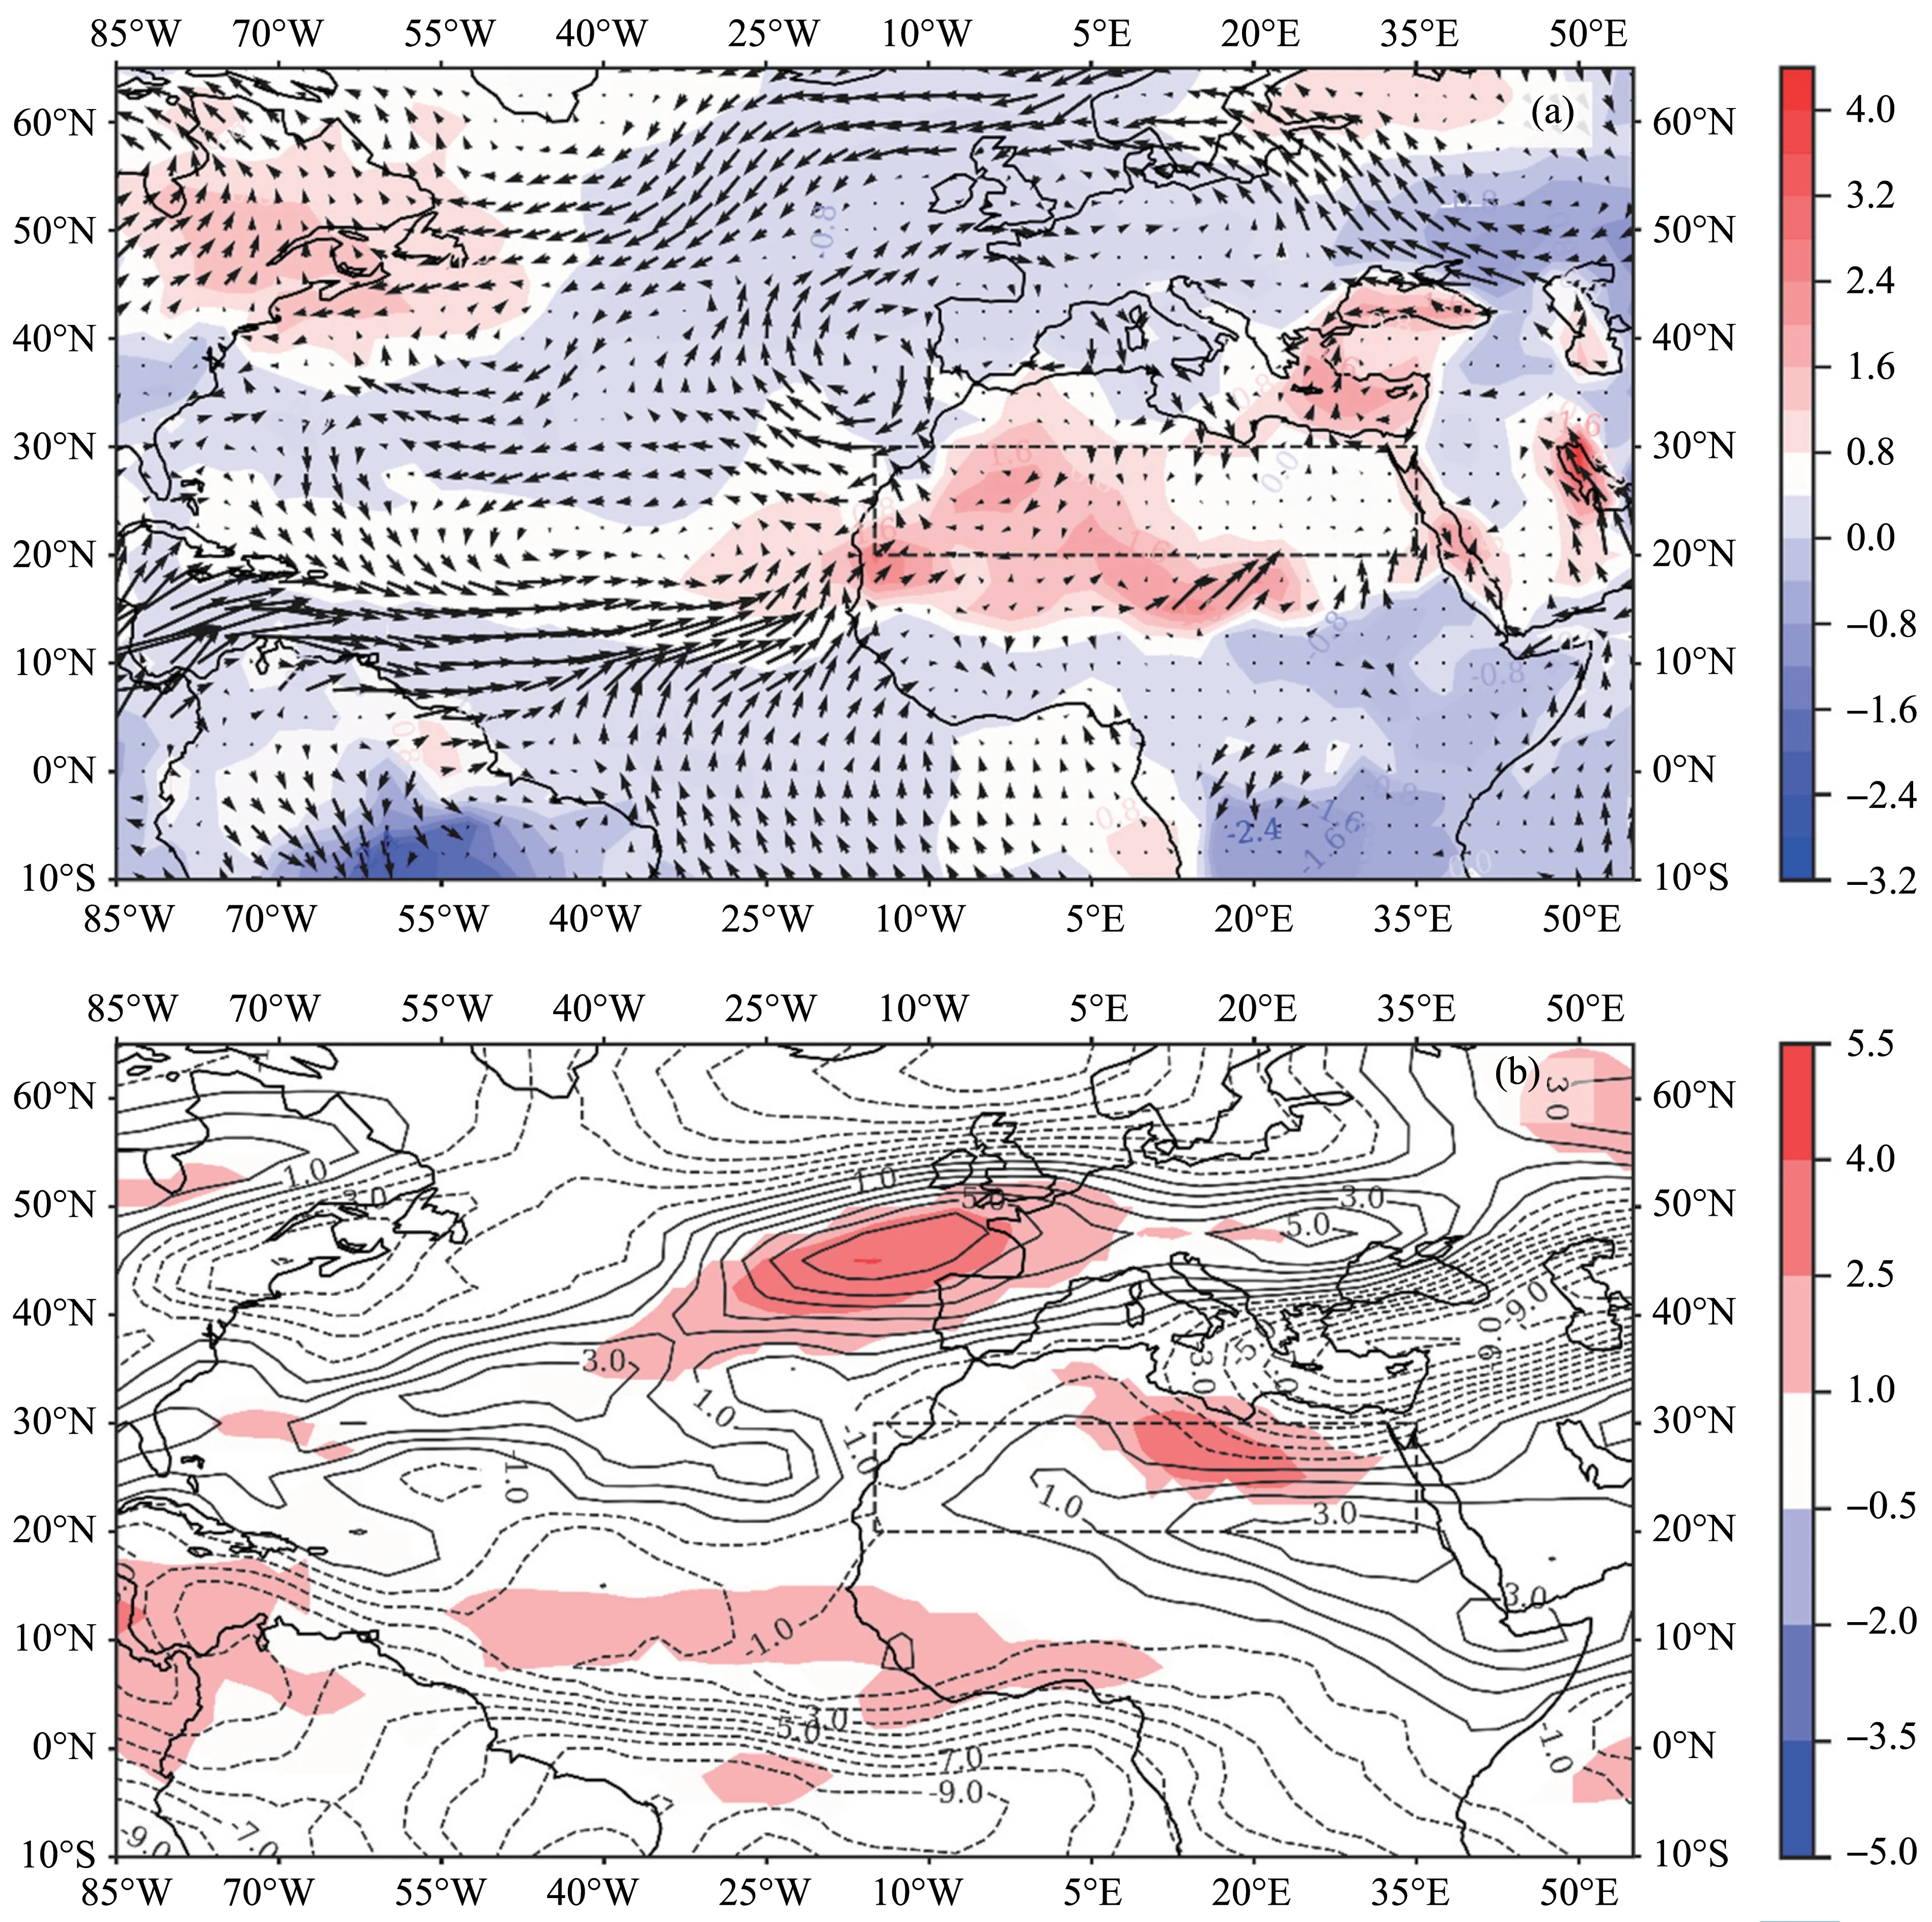
Figure 8 Composite analysis for(a)moisture and(b)zonal components performed between the wet and dry period of the JAS season.Color and arrows in(a)indicated changes in moisture contents(g/kg)and moisture flux components,respectively.Colors and contours in(b)show changes in zonal wind components at 600 hPa and 200 hPa,respectively
4 Discussions
This study focused on temporal variability in Sa‐hara precipitation from 1979 to 2016,using monthly precipitation values from the GPCC dataset.Our re‐sults show that the Sahara accounts for two main sea‐sons(summer and winter).The summer season occurs during July,August and September,and is character‐ized with relatively abundant rainfall concentrated in August.Summer rainfall in the Sahara Desert is spa‐tially distributed in the southwestern part.Similar pat‐terns have been mentioned in previous research,which showed that the Sahara climate comprises two significant seasons (wet and dry) (Nicholson,1981).The dry season begins early boreal winter and ends in the late spring,with relatively higher precipitation dis‐tributed in the north part of the Sahara Desert.The wet season begins with the boreal summer and ends in the middle of autumn,with significant precipitation distributed in the southern Sahara (Haradaet al.,2003).Evaluation of seasonal precipitation trends shows a positive trend in southern precipitation anom‐alies.The precipitation trends in JAS seasons are sta‐tistically significant.The long-term trend of Sahara precipitation shows a dominance of negative anoma‐lies in early 1990s and a rapid recovery after 2000s.The negative phase of precipitation anomalies in early 1994 is probably linked to the drought period that dev‐astated West Africa in the 1970s to the 1980s(Nichol‐son,1981;Nicholsonet al.,1998;Nicholson,2005;Caminade and Terray,2010;Dai,2011;Evanet al.,2015).There are interconnections between the Saha‐ran and Sahelian drought features such as drought re‐covery and drought frequencies (Evanet al.,2015;Rodriguezet al.,2015;Sindikubwaboet al.,2018).
Anomalous precipitation in the southern Sahara Desert shows a similar variability with NTA SST anomalies.Moreover,southern Sahara precipitation is positively correlated with SST in the NTA region.The present results are consistent with previous studies,which show a connection of the SST variation in the North Atlantic and Mediterranean to fluctuations in Northwest African and Sahelian rainfall,respectively(Li,2003;Rowell,2003).Other studies have also shown an influence of NTA SST anomalies on neigh‐boring regional climate variability(Chenet al.,2015).Less precipitation in the United States of America oc‐curs within the period of negative NTA SST anoma‐lies,while abundant precipitation co-occurred with positive NTA SST anomalies (Kushniret al.,2010)The dry (winter) season shows a negative slope sug‐gesting a decrease in Sahara precipitation,particularly in the northern Sahara.The decreasing trend in precip‐itation has been observed and projected in the neigh‐boring Mediterranean climate (Kyselyet al.,2012).The consistency of precipitation variability in north‐ern Sahara and Mediterranean may reveal the regional climate interaction and attribute the northern Sahara edge to the Mediterranean climate.However,the weakness of significance test in the northern Sahara precipitation trend suggests further research on the re‐cent connection between Mediterranean climate and variability of northern Sahara precipitation.The pre‐cipitation component from a high-resolution dataset of GPCC shows that JAS precipitation increased by a range of 0.42−1.43 mm per decade,however,the re‐sults may include a certain level of uncertainty associ‐ated with the paucity of weather stations available in the Sahara Desert.Dinku,(2019) presented several challenges of climate data quality in Africa including the sparsity of weather stations and declining observa‐tion networks (Dinku,2019).Unfortunately,this study was not intended to evaluate the uncertainties of the GPCC in the Sahara Desert due to difficulties re‐lated to data acquisition from ground observations and we reserved uncertainty problems for further study.Moreover,the low magnitude in the Sahara pre‐cipitation trend may be merely subjected to rare rain‐fall and high evaporation of arid regions.The positive trend can be attributed to abrupt changes that oc‐curred in the Sahara during the years 1993 and 2009.These changes have brought a noticeable fluctuation,which led to a shift in average precipitation from neg‐ative to positive anomalies (Sindikubwaboet al.,2018).The general circulation patterns suggest mois‐ture transport from the Mediterranean region,which disperses into two branches (west and east).The west moisture branch sinks and forms the continental anticy‐clone flow over Western Sahara.The weakening and shift of the Azores high may enhance the formation of the coastal cyclonic flow,which may lead to the pene‐tration of cold air from the Atlantic Ocean to the Saha‐ra Desert.Previous studies shows that variability in Azores high controls the dry and wet seasons of the Mediterranean region (Almazroui and Awad,2016;Şahinet al.,2018).In the southern Sahara,precipita‐tion is associated with an increase in NTA,SST and the northward penetration of both atmospheric mois‐ture and the AEJ.The southern Sahara desert shares rainfall mechanisms with the tropical monsoon region,especially,the Sahel region(Vischelet al.,2019).
5 Conclusions
The temporal variability in Sahara precipitation from 1979 to 2016 has been studied using the Mann Kendall,Theil Sen's,and Pearson's correlation meth‐ods.We adopted the GPCC dataset to estimate rainfall variability and the ERA5 datasets were used to evalu‐ate the general circulation of the Saharan climate.This study has reached the following conclusions:the sum‐mer periods show an increase in precipitation in the en‐tire Sahara Desert with statistical significance varies between 95% and 99%.An increase in Sahara precipi‐tation shows a significant connection with global SST,particularly the North Atlantic Ocean and the Mediter‐ranean Sea.The general atmospheric circulation has al‐so shown an influence on Sahara precipitation.Interac‐tion of moisture transport,atmospheric pressure,and zonal wind have altered the regional cyclonic and anticyclonic flows and led to an increase of precipitation in the Sahara Desert.Moreover,we suggest further re‐search considering in situ precipitation datasets.
Acknowledgments:
This research was funded by the National Key R&D Program of China (No.2017YFC0404305),National Natural Science Foundation of China (No.41801015,No.41771252) and the Foundation for Excellent Young Scholars of Northwest Institute of Eco-Environ‐ment and Resources NIEER Chinese Academy of Sci‐ences,CAS (No.51Y851D61),the Major Program of the Natural Science Foundation of Gansu province,China (No.18JR4RA002),Science and Technology Program of Gansu Province,China (18JR2RA026),and the Chinese Academy of Sciences-The World Academy of Sciences (CAS-TWAS) President's Fel‐lowship programme.
 Sciences in Cold and Arid Regions2021年3期
- Sciences in Cold and Arid Regions的其它文章
- A concise overview on historical black carbon in ice cores and remote lake sediments in the northern hemisphere
- Summary of research on frost heave for subgrade in seasonal frozen ground
- Overview of an early warning system for Glacial Lake outburst flood risk mitigation in Dudh-Koshi Basin,Nepal
- Centrifuge model test on performance of thermosyphon cooled sandbags stabilizing warm oil pipeline buried in permafrost
- Changes in morphology and soil nutrient patterns of nebkhas in arid regions along a precipitation gradient
- Linkages between soil microbial stability and carbon storage in the active layer under permafrost degradation