
Experimental study on repeatedly loaded foundation soil strengthened by wraparound geosynthetic reinforcement technique
2021-07-27 10:06:32MuhammadNoumanAmjadRajaSanjayKumarShukla
Muhammad Nouman Amjad Raja, Sanjay Kumar Shukla
a Geotechnical and Geoenvironmental Engineering Research Group, School of Engineering, Edith Cowan University, Joondalup, Perth, WA 6027, Australia
b Department of Civil Engineering, School of Engineering, University of Management and Technology, Lahore, Pakistan
c Civil Engineering Department, Delhi Technological University, Delhi, India
Keywords:Geosynthetics Repeated loads Wraparound reinforcement technique Model tests Footing settlement Bearing capacity Reinforcement ratio Strip footing
ABSTRACT In the recent past, the potential benefits of wraparound geosynthetic reinforcement technique for constructing the reinforced soil foundations have been reported. This paper presents the experimental study on the behaviour of model strip footing resting on sandy soil bed reinforced with geosynthetic in wraparound and planar forms under monotonic and repeated loadings.The geosynthetic layers were laid according to the reinforcement ratio to minimise the scale effect.It is found that for the same amount of reinforcement material, the wraparound reinforced model resulted in less settlement in comparison to planar reinforced models.The efficiency of wraparound reinforced model increased with the increase in load amplitude and the rate of total cumulative settlement substantially decreased with the increase in number of load cycles. The wraparound reinforced model has shown about 45% lower average total settlement in comparison to unreinforced model,while the double-layer reinforced model has about 41%lower average total settlement at the cost of approximately twice the material and 1.5 times the occupied land width ratio. Moreover, wraparound models have shown much greater stability in comparison to their counterpart models when subjected to incremental repeated loading.
1. Introduction
In the current construction practice, the use of geosyntheticreinforced soil is increasing rapidly for making the projects,including geosynthetic-reinforced soil foundations, sustainable.During the past four decades,an extensive research has been carried out to evaluate the behaviour of shallow reinforced soil foundations subjected to monotonic loads (Khing et al.,1993; Omar et al.,1993;Yetimoglu et al.,1994;Adams and Collin,1997;Basudhar et al.,2007;Abu-Farsakh et al.,2013;Kumar and Sahoo,2013;Roy and Deb,2017;Li et al., 2019; Raja and Shukla, 2020a, 2021). A limited number of studies were conducted on the reinforced soil bed under cyclic loading by simulating either the vehicle (tire) or train load or the combination of static and cyclic loads(Yeo et al.,1993;Leng and Gabr,2002;Raymond,2002;Das and Shin,2009;Moghaddas Tafreshi and Dawson,2010,2012a;Boushehrian et al.,2011;Asakereh et al.,2013;Moghaddas Tafreshi et al., 2014; Wang et al., 2018; Ghotbi Siabil et al., 2020). The main objective of majority of these studies was to determine and optimise the most critical parameters which play a significant role in increasing the ultimate bearing capacity and reducing the settlement of the reinforced foundations, such as distance of the topmost reinforcement layer from the base of the footing(u),vertical spacing between the successive reinforcement layers(h),number of reinforcement layers (N), tensile modulus of the reinforcement(J),and width of the reinforcement layer(b).In most cases,the optimum value of the reinforcement width has been reported to be in the range of 4-8 times the footing width (B) (Fragaszy and Lawton,1984; Omar et al.,1993; Shin and Das, 2000; Michalowski,2004; Chakraborty and Kumar, 2014; Aria et al., 2020). However,often the field boundary conditions such as property line dispute and limited land space do not permit this optimum reinforcement width.In order to overcome this problem and to achieve the desired bearing capacity, multilayer reinforcements, 3D-geocells, grid-anchors, and horizontal-vertical reinforcements have been suggested as the possible alternative solutions(Latha and Murthy,2007;Biswas et al.,2013;Mosallanezhad et al.,2016;Hou et al.,2017).In spite of these developments, the practical difficulties in manufacturing process,field installation and cost-effectiveness of these techniques are questionable especially when the budget is limited.
In the recent past, simple yet innovative and effective wraparound geosynthetic reinforcement technique has been proposed and implemented for enhancing the ultimate bearing capacity and reducing the settlement of reinforced foundations (Shukla, 2014,2016).For this,the ends of the reinforcement layer are folded along the longitudinal axis.In this way,the occupied land area outside the footing width is reduced and soil above the reinforcement is confined,thus preventing its lateral movement.Kazi et al.(2015a,b,2016) experimentally evaluated the ultimate bearing capacity of the strip footing resting on wraparound geotextile-reinforced sandy soil bed. They reported the increase in the ultimate bearing capacity of approximately 12%-30%and 65%-80%in comparison to those of model foundations reinforced with planar geotextile layer without wraparound ends and unreinforced models, respectively.The results of the numerical simulations conducted by Benmebarek et al.(2018)depicted that the wraparound geosynthetic-reinforced foundations offered the maximum improvement of bearing capacity for a strip footing under monotonic loading.Aria et al.(2019,2021) experimentally and numerically investigated the behaviour of strip footing resting on soil bed strengthened by wraparound geotextile reinforcement technique. Test results and model simulations indicated that the bearing capacity ratio(BCR)of the model foundation generally increases with the increase in lap-length ratio and occupied land width ratio of wraparound reinforcement. Most recently, Raja and Shukla (2020b) developed an analytical expression to estimate the ultimate bearing capacity of wraparound geosynthetic-reinforced soil foundations.In spite of all these studies, the behaviour of the footing resting on soil bed strengthened by wraparound geosynthetic reinforcement technique subjected to repeated loading is yet to be investigated. The main focus of this study is to experimentally evaluate the loadsettlement response of the strip footing on reinforced and unreinforced sand beds under slow repeated loads,and also exclusively,to demonstrate the usefulness of wraparound technique in comparison to unreinforced and planar geosynthetic-reinforced models. Moreover, the economic aspects are also considered by comparing the amount of geosynthetic material used in reinforced model with wraparound ends with those without wraparound ends.Further,in the paper,the term“planar reinforcement”will be used for geosynthetic arrangements without the wraparound ends.
2. Wraparound technique for foundations - Basic concept and mechanism
Fig.1 shows the three-dimensional(3D)view of a footing resting on soil bed strengthened by wraparound geosynthetic reinforcement technique. The horizontal and vertical components of the wraparound are represented by lxand ly,respectively,which act as anchorage and provide additional confinement to the foundation soil in comparison to the planar geosynthetic arrangement. Fig. 2 illustrates the failure pattern of the wraparound geosyntheticreinforced foundation soil in comparison to planar geosyntheticreinforced model. As illustrated in Fig. 2a, four zones can be recognised for the increase in the ultimate bearing capacity of the strip footing resting on soil bed reinforced with wraparound geosynthetic reinforcement technique(Raja and Shukla,2020b).Zone I is the active wedge zone analogous to the Terzaghi’s failure mechanism for unreinforced soil foundation (Terzaghi et al.,1996)(Fig.2a).The soil in this zone moves downwards,thus pushing the adjacent soil sideways.The area adjacent to active wedge,i.e.Zone II,is the area above the reinforced zone in which soil tends to move horizontally to the sides due to induced shear stresses. This provides additional shear resistance to the horizontal displacement of foundation soil at soil-geosynthetic interface in comparison to planar geosynthetic-reinforced model (Fig. 2b). Zone III is also the area adjacent to Zone I but inside the wraparound ends, and provides the passive resistance due to confinement of soil. This is similar to the mechanism reported by Biswas et al. (2016) for geocell-reinforced foundations. Zone IV is the area beneath the geosynthetic layer and is unreinforced soil. Considering these mechanisms, the wraparound ends of the geosynthetic are considered to provide shear resistance at interface (soil-geosynthetic)and the passive resistance due to confinement of soil as presented in the zoomed view along with Fig. 2a, thus enhancing the ultimate bearing capacity of wraparound reinforced model foundations in comparison to planar reinforced foundation (Raja and Shukla, 2020b).
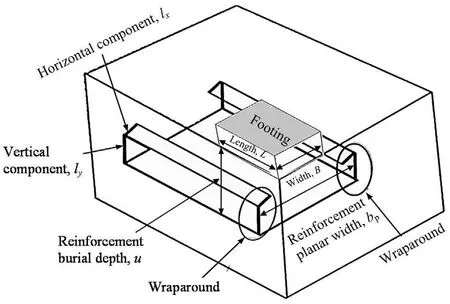
Fig. 1. Footing resting on soil bed strengthened by wraparound geosynthetic reinforcement technique.
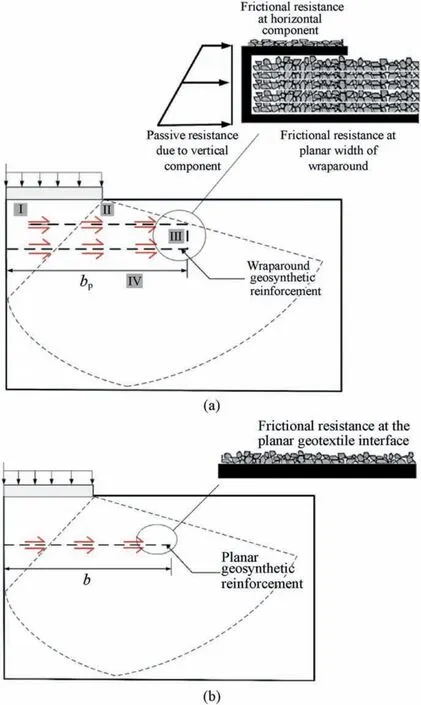
Fig. 2. A schematic mechanism of failure pattern of reinforced model for (a) wraparound and (b) planar reinforcement techniques (adapted from Raja and Shukla,2020b).
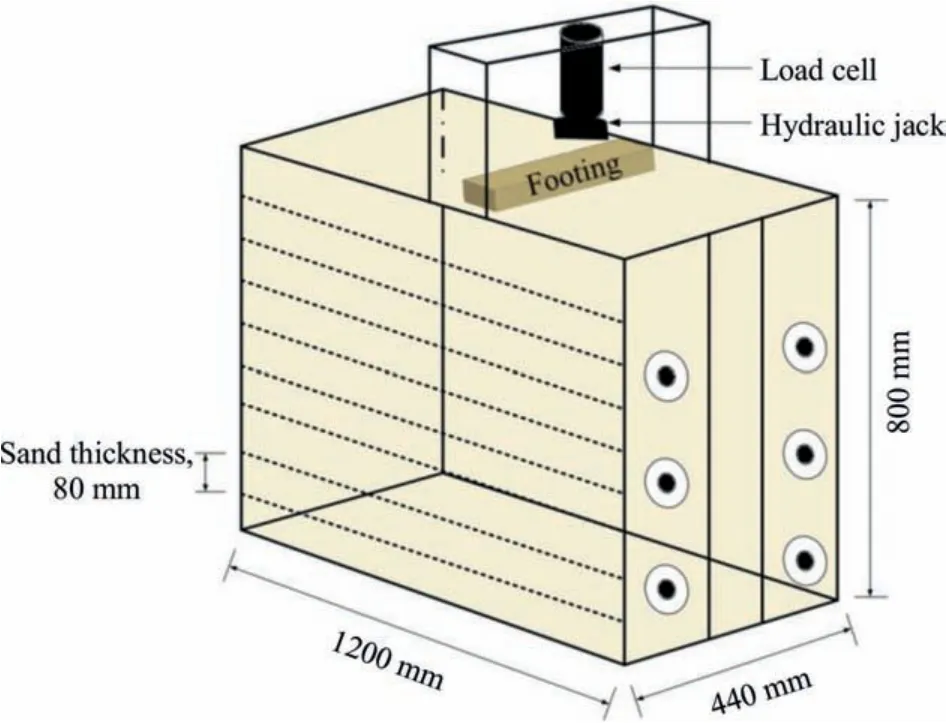
Fig. 3. Schematic view of the test cell used in the present study.
3. Experimental setup
A number of model footing load tests were conducted in the test cell located at the Geotechnical and Geoenvironmental Engineering Workstation, Edith Cowan University (ECU), Perth, Australia. The details about the materials, model test cell/tank and instrumentation, and experimental procedure adopted for this study are explained below.
3.1. Material description
The soil used in this study is a yellow brickie sand which has been extracted from the pit site located in the North Perth region,Australia.Physical properties of this sandy soil are measured according to the guidelines providedby AS1289.0-2000(2000).The soil isclassified as the poorly graded sand(SP)according to the unified soil classification system(USCS).By applying moderate effort,this type of sand can be compactedtoarelatively uniformdensity(Brachmanet al.,2001).The non-woven type geotextile made of polypropylene with a tensile strength of 13.3 kN/m at the corresponding tensile strain of 47.5%is used in this study. Various other properties of the soil and the geotextile are also summarised in Table 1.
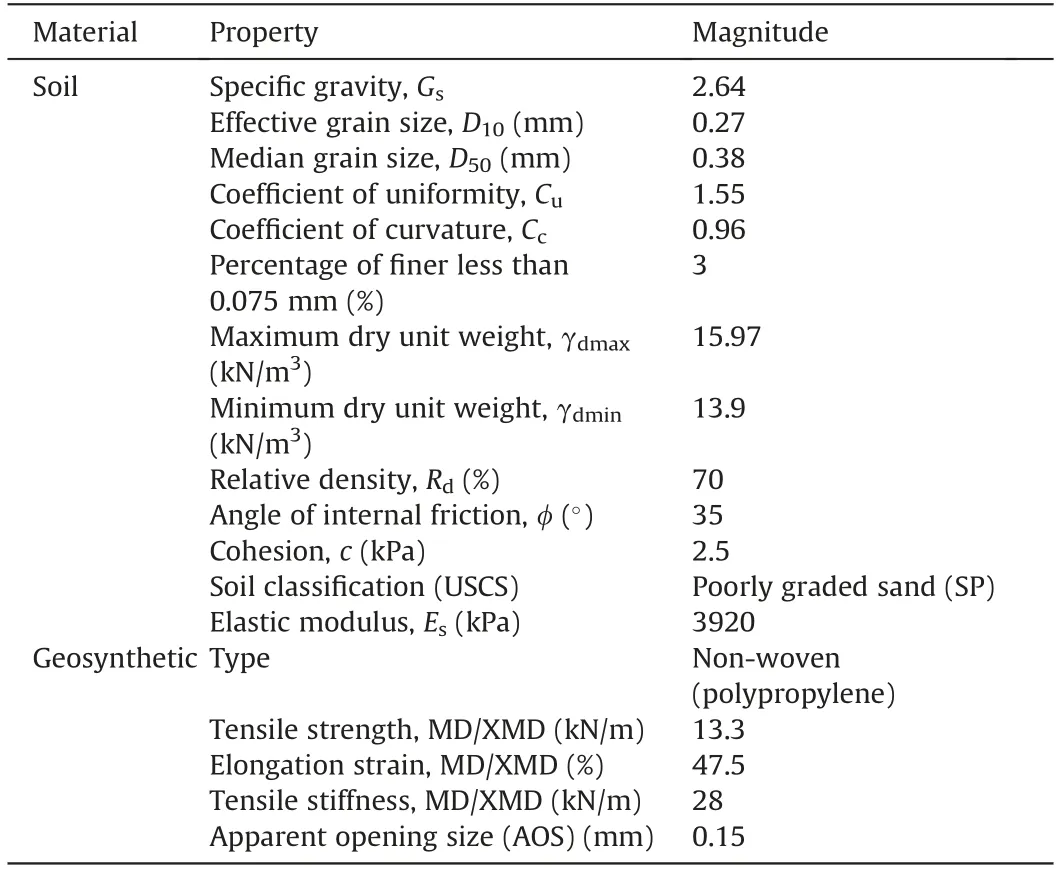
Table 1 Properties of soil and geosynthetic materials.
3.2. Laboratory test setup and instrumentation
The laboratory model tests were conducted in a metal steel tank with inside dimensions of 1200 mm×440 mm×800 mm(length×width×height).One long end of test cell was made of acrylic plexisheet of 25 mm in thickness.Following the approach of Shin and Das(2000) and Moghaddas Tafreshi and Dawson (2010), a light coat of petroleum jelly was applied at the ends to minimise the frictional resistance between the edge of the model footing and test cell walls.Moreover, test cell was braced (from outside) by the angle irons to prevent any potential yielding that may occur during the compaction of the sand and/or during the performance of footing load tests.
The rigid foundation has been modelled by well-seasoned sal wood footing. The measured dimensions of the footing for the model tests are 440 mm × 80 mm × 40 mm (length × width ×thickness).Since the ratio of length to width is greater than 3,it will act as strip footing. The base of the footing was made rough by cementing the sand grains to it by epoxy glue.Fig.3 represents the schematic view of the test cell used in the present study.
The sandy soil was compacted in a test tank in the form of seven layers with each having the thickness of 80 mm. The compaction was done manually by a wooden float to a relative density (Rd) of 70% which resulted in the average unit weight (γ) of 15.4 kN/m3.The whole arrangement for the model footing load tests is represented in Fig.4.Especial care was taken during the levelling of the sand bed at each layer, which was checked by digital auto-level to ensure the horizontal surface conditions(Fig.4a).The vertical load was applied by hydraulic jack connected with low pressure pump system to adequately control the loading rate.The applied load was measured by the load cell (GEFRAN series) of 50 kN capacity. The load cell has 8 built-in sensors and is configured in a way that reduces any potential error caused by imperfect application of the load. The displacement transducers (accuracy of 0.001 mm) were used to measure the settlement of the footing(Fig.4b).The load cell and displacement transducers were attached to the 16-channel Matest data acquisition system along with which the data logger software was used to record all the readings (Fig. 4c).
3.3. Testing programme
Four experimental test series for monotonic and seven for repeated loading conditions were performed. Test series for monotonic and repeated loading conditions were represented by letters A-D and E-K, respectively. The testing programme is summarised in Table 2. The layout of the reinforcements (planar and wraparound) is presented in Fig. 5. The parameters involved are given below: u is the distance of topmost reinforcement layer from the base of footing,h is the distance between the subsequent layers of planar reinforcement, b is the reinforcement width of planar geosynthetic reinforcement, and bpis the planar width of wrapround geosynthetic.All the parameters were normalised with the foundation width(B)and therefore represented as u/B,h/B,b/B,bp/B, lx/B, and ly/B. Following the approach of Lal et al. (2017), h/B was kept equal to u/B when multiple planar reinforcements were used in the tests.
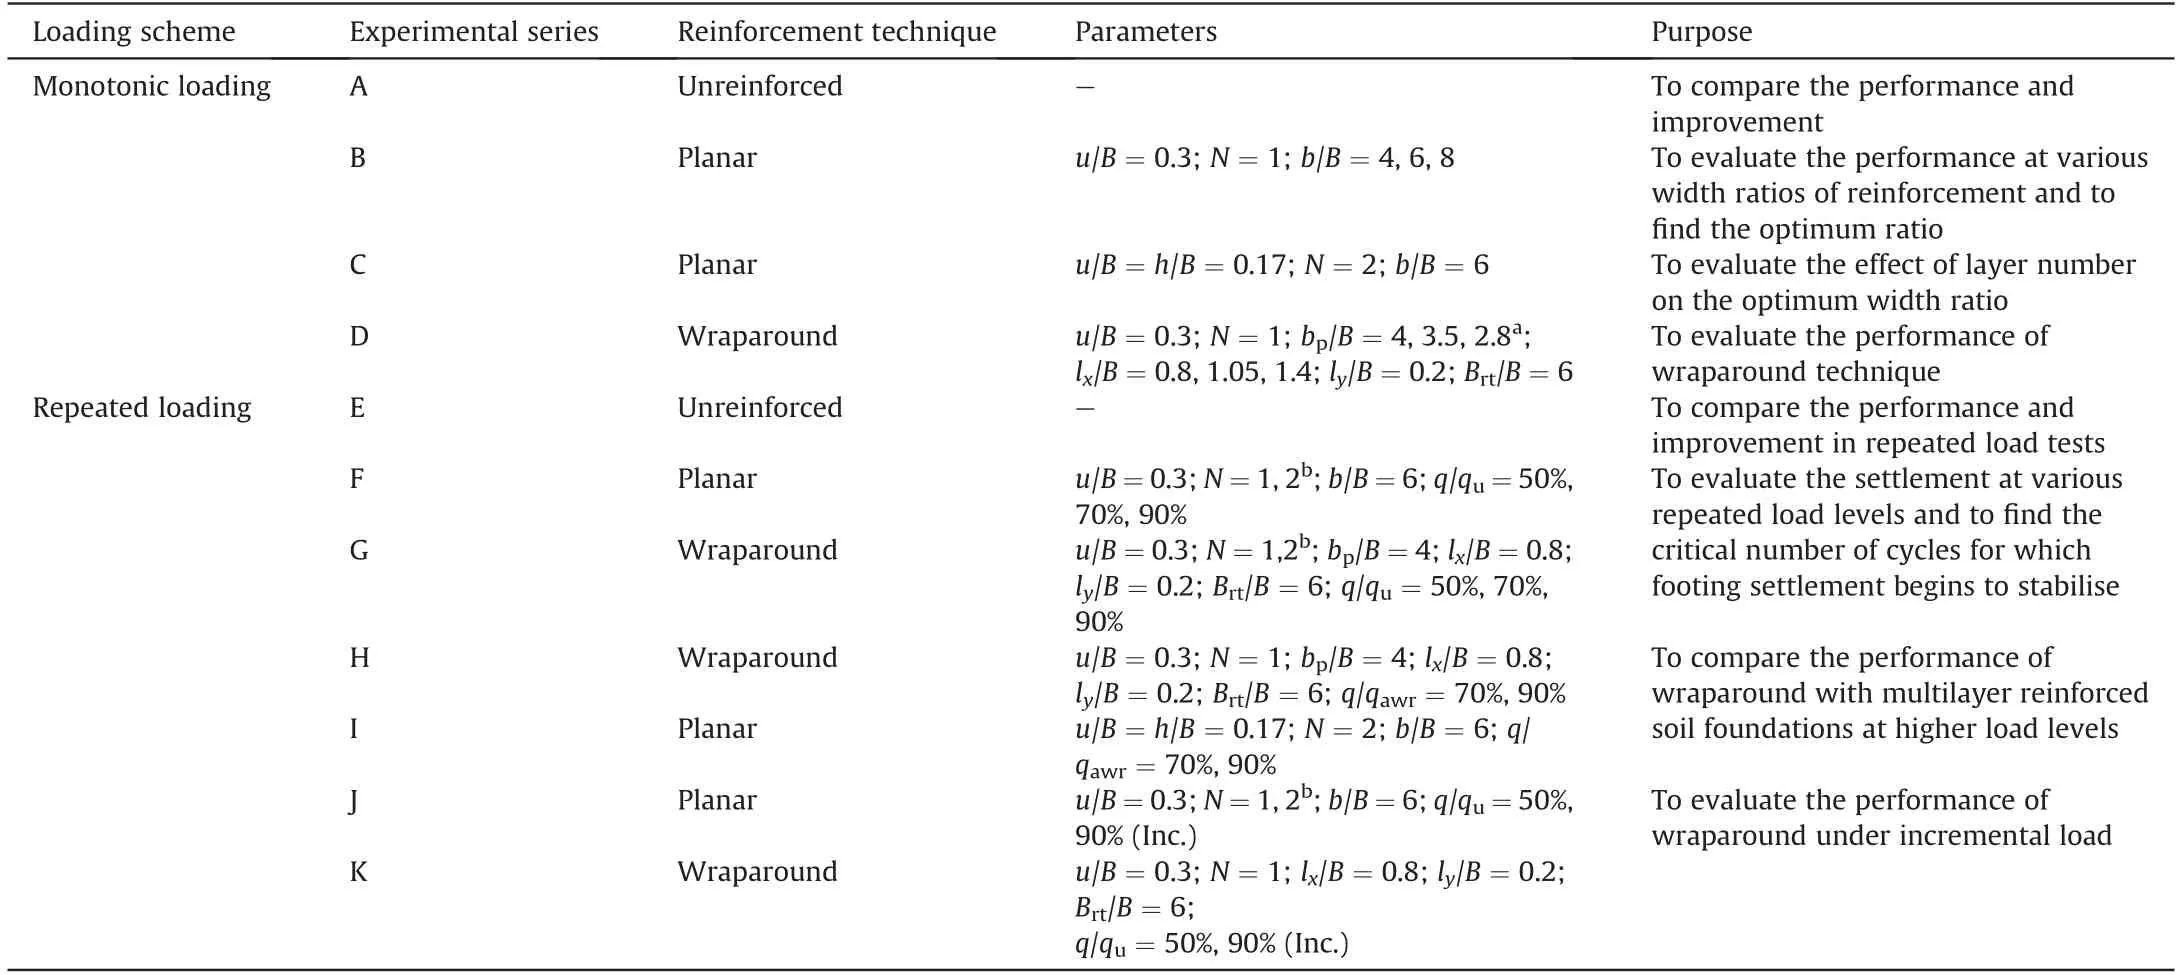
Table 2 Summary of experimental series.
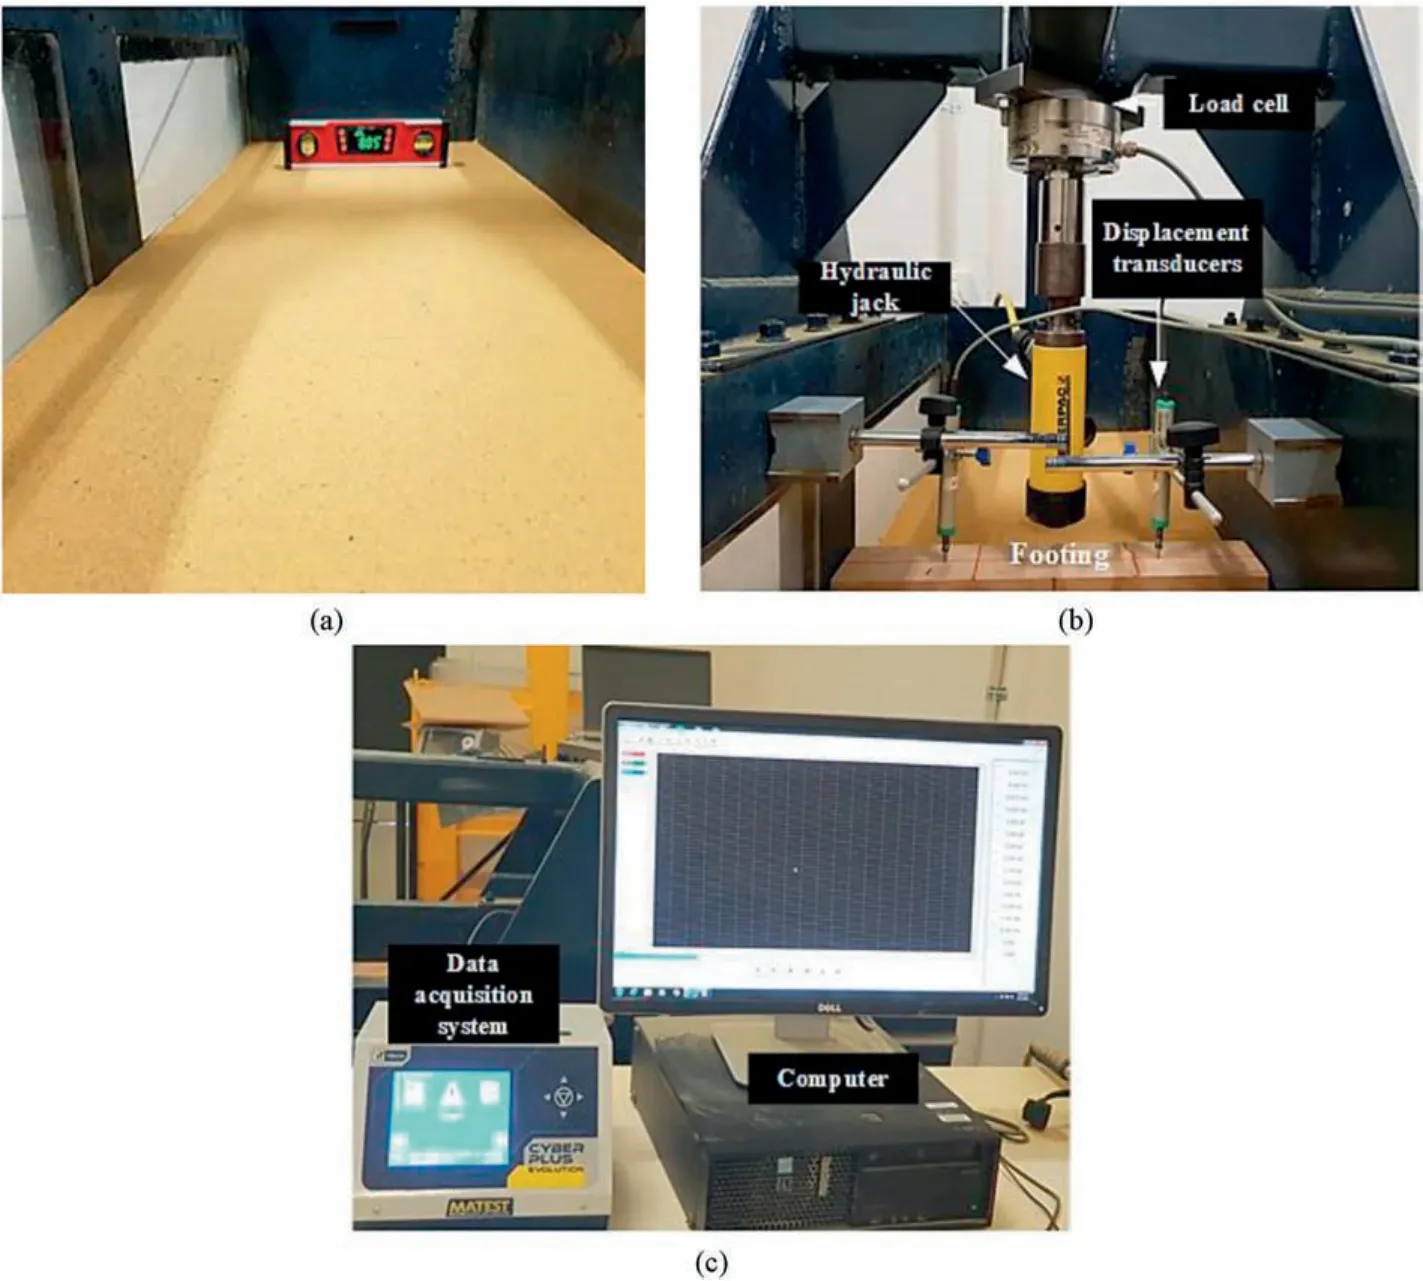
Fig. 4. Experimental model footing load test setup at workstation: (a) Levelling of sand bed; (b) Loading arrangement; and (c) Data acquisition system.
3.4. Loading scheme
For all the model footing load tests,the experimental procedure was performed according to the guidelines provided by ASTM D1196/D1196M-12 (2016). The load increment is applied and kept constant until the settlement of the footing is smaller than 0.03 mm/min for three successive minutes.Similar to the approach used by Kou et al. (2018), a vertical preload of approximately 0.05 kN was applied to surface footing before each trial. This ensures an even contact of surface footing with soil surface and thereafter readings were set to zero for consistency and uniformity.The settlement (s) is standardised with the footing width and expressed as the dimensionless factor (s/B). The ultimate bearing capacity values of the model foundations were estimated from their corresponding load-settlement curves.
For repeated loading tests, the model foundation was initially loaded with the portion of ultimate monotonic loads(e.g.50%,70%,and 90%), followed by the subsequent cycles of unloading and reloading.The repeated loading pattern is given in Fig.6.The typical rate of loading and unloading was kept at 0.1 kN/s.A similar approach was utilised by El Sawwaf and Nazir (2010) for examining the behaviour of rectangular footings resting on reinforced soil bed under slow repeated loads.The total cumulative settlement due to repeated loading (st) was also standardised with the footing width and expressed as st/B.
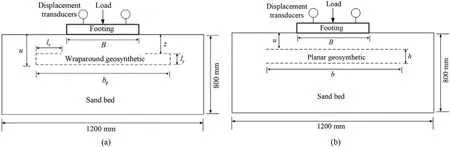
Fig. 5. Layout of (a) planar and (b) wraparound geosynthetic reinforcements.
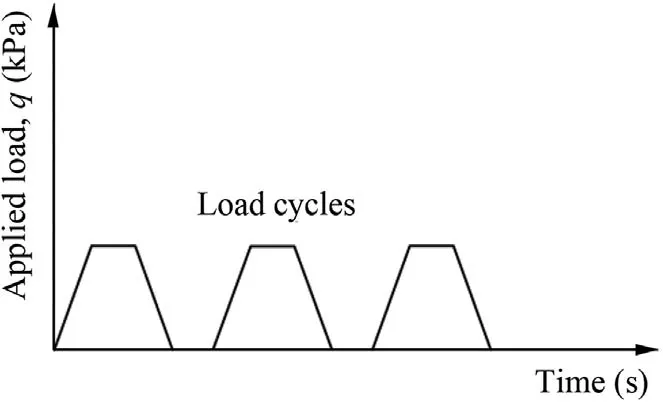
Fig. 6. Typical pattern of loading scheme in repeated load tests.
It is noteworthy that the main aim of this study is to demonstrate the practical advantage of wraparound technique. However, in addition to this main objective, an attempt is made to curtail the scale effect of the model footing load tests by taking several measurements into account which are discussed in the following section.
4. Scale effect
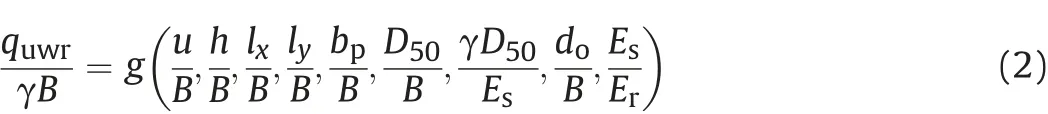
The scale effect is one of the major concerns in the laboratory model footing load tests (1g tests). However, for these tests, if correctly performed, the scale effect can be minimised. This has been the key reason that 1g tests are still widely used in geotechnical engineering in a cost-effective manner(Al Heib et al.,2020).In the previous studies, researchers have given a valuable insight about the critical parameters influencing the scale effect in the reinforced model footing load tests and how it can be minimised(Das et al., 1996; Fakher and Jones, 1996; Chen, 2007; Chen and Abu-Farsakh, 2011; Tavakoli Mehrjardi and Khazaei, 2017). The most common physical factors influencing the ultimate bearing capacity (quwr) of wraparound geosynthetic-reinforced backfill systems can be given as follows:B,u,h,lx,ly,bp,D50,do,γ,Erand Es,where dois the aperture/opening size of reinforcement, and Eris the elastic modulus of reinforcement. By utilising the dimension analysis rules, the function (g) governing the wrapround geosynthetic-reinforced backfill system can be written as follows:

Considering the length and force as the fundamental dimensions,11 parameters in Eq.(1)can be reduced to 9 independent parameters which can be identified as (π1,π2,…,π9) as depicted below:
For ideal response,the real-life projects and model tests should be the same. However, it would be practically not feasible to maintain the complete similarity. Therefore, some of the parameters, which are significantly prone to “scale effect” (Fakher and Jones,1996), can be listed. Considering the prototype footing (Bp)with dimension n times the model footing (Bm), the following equation can be expressed:

In order to maintain the similarity,the π terms for the prototype and model should be kept the same.For example,if the strip footing of 80 mm width is studied,then considering the value of n equal to 10, the parameters u, lx, ly, bp, D50and doshould be considered 10 times those of the model.In this way,assuming that the soil in the prototype and model is the same, the following equation can be satisfied to obtain the bearing capacity of prototype system:

The following sections are dedicated to the precautions taken in this study to minimise the scale effect according to the guidelines available in the well-established published literature related to the model footing load tests (unreinforced and reinforced).
4.1. Influence of ratio of median grain size to footing width (D50/B)
In practice, the width of footing is usually very large compared to the median grain size of the soil particle. Several researchers have reported that the ratio of D50/B has a significant impact on the bearing capacity of model foundations (Habib, 1974; Yamaguchi et al.,1977; Tatsuoka et al.,1991; Kusakabe,1995; Hsieh and Mao,2005). This is commonly called as the “particle size effect”.Kusakabe (1995) recommended that the particle size effect can be neglected if D50/B is kept smaller than 1/100.Cerato and Lutenegger(2003)suggested that the bearing capacity does not get affected if D50/B is kept smaller than 1/200. Hsieh and Mao (2005) recommended this value to be smaller than 1/15 for geosyntheticreinforced soils. Considering the above-mentioned recommendat ions, the particle size effect will be negligible as the ratio of D50/B for this study is 0.00475.
4.2. Scale effect of the reinforcement (reinforcement ratio, Rr)
Reinforcement ratio is a key parameter affecting the bearing capacity of model footing resting on geosynthetic-reinforced soil bed(Chen,2007;Chen and Abu-Farsakh,2011,2015;Ahmad et al.,2020).It incorporates the following parameters:u/B,h/B,Es/Er,and as/ar, which is mathematically expressed as

where asis the area of reinforced soil, and aris area of reinforcement.
Mathematical forms of ar, asand Erare given as follows:
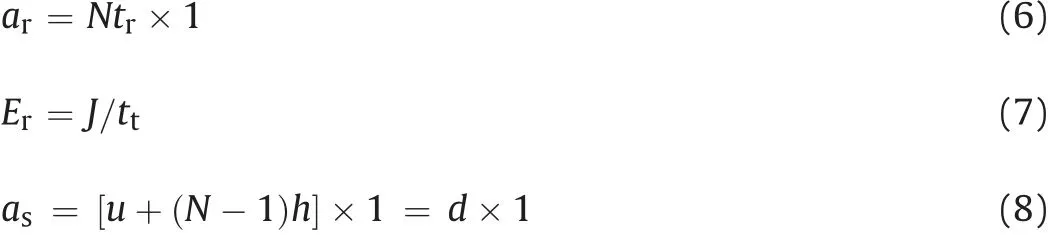
where N is the number of reinforcement layers, tris the reinforcement thickness,J is the tensile modulus of reinforcement,and d is the depth of reinforced zone.
Substituting Eqs. (6)-(8) into Eq. (5) results in

Chen(2007)has carried out extensive experimental(small-and large-scale) and numerical analyses of reinforced soil foundations and concluded that if the value of Rris kept the same as d/B, then the results of the laboratory reduced-scale model tests can be extrapolated to the full-scale reinforced soil foundations with minimal error.
In this study,the value of Rris 0.297 which is very close to d/B of 0.3 for all the tests except for test series for multilayer reinforcements where the depth of reinforced zone slightly exceeds 0.3.Therefore,it can be admissible that the scale effect regarding Rrwill have a low to negligible impact on the performed tests in this study.
4.3. Influence of ratio of aperture size to footing width (do/B)
The ratio of minimum opening size(do)of the reinforcement to the footing width has a significant effect on the BCR of the reinforced foundations.Cuelho et al.(2014)and Tavakoli Mehrjardi and Khazaei(2017)suggested that the do/B ratio should be restricted to 4 and 4-6, respectively, for achieving the highest BCR value with minimal scale effect.It is to be noted that this ratio has a significant impact when geogrid is used as the reinforcement. However, for geotextile-reinforced soil, this effect may not be applicable due to the negligible opening size of such reinforcements.
4.4. Test cell scale effect
Besides the above-mentioned parameters, another reason that can cause the scale effect issue is the insufficient dimensions of the test cell. Bransby and Smith (1975) suggested that for a wide enough test tank with smooth side walls,the boundary conditions and side frictional resistance do not have any noteworthy effect on the results of model footing load tests. Abdel-Baki and Raymond(1993) and Azzam and Nasr (2015) suggested that the length and height of tank should be kept minimum of 6 and 7 times the footing width, respectively, in order to minimise the scale effect. Lal et al.(2017) suggested that all the test cell dimensions should be minimum of 5 times the footing width.The test cell used in this study is 1200 mm long,440 mm wide,and 800 mm deep,as shown in Fig.4.All these dimensions are sufficient enough to minimise the scale effect on the performance of the model tests.
5. Results and discussion
A series of model tests was conducted on unreinforced, planar and wraparound reinforced models in a test cell.The details of the instrumentation used in the experimental procedure were given in Section 3.The ultimate bearing capacity of the unreinforced model foundation,qu,was 96.6 kPa at a settlement,s,of 7.986 mm which gives the s/B value of approximately 0.1.The increase in the bearing capacity (at various s/B ratios) for planar and wraparound reinforced models is quantified as a dimensionless ratio, respectively termed as the improvement factors IFpgand IFwgin this study,which are mathematically expressed as

where q(p), q(w)and q are the bearing capacities of planar, wraparound geosynthetic-reinforced, and unreinforced model foundations, respectively.
It must be noted that the results of some of the model footing load tests were checked for repeatability by conducting them more than once.It has been observed that if the appropriate care is taken and conditions are kept the same, then there is no marked difference between the observed values.
5.1. Monotonic load tests
5.1.1. Planar reinforced models
The results of the test series A and B are presented in Fig.7.For a medium dense type sand, the bearing pressure-settlement curve changes at a certain level indicating a shear failure in the soil and after that the curve becomes steeper (Shukla, 2014; Das and Sobhan, 2017). The reasonable agreement is achieved for the bearing pressure-settlement curve of unreinforced model foundation and the failure pattern of medium dense type sand. It is obvious from the figure that the bearing capacity of the reinforced model is greater than that of the unreinforced model. This is true even for the lower settlement levels; however, the effect is more pronounced after s/B>2.5%.This is in line with the previous studies on strip footing resting on geosynthetic-reinforced medium dense soil bed (e.g. Shin and Das, 2000; Cicek, 2011).
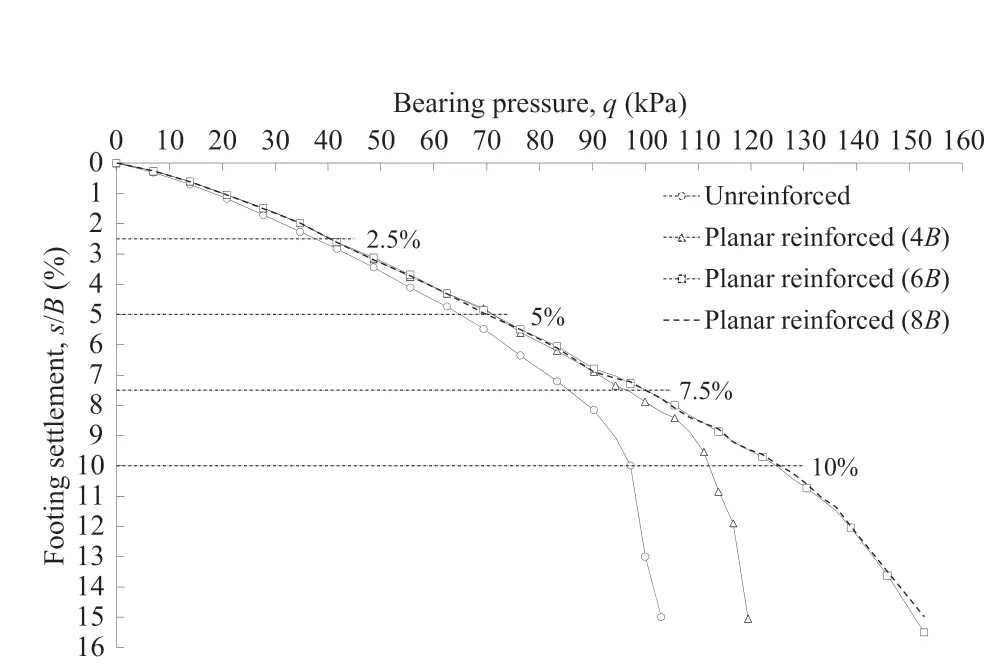
Fig. 7. Bearing pressure-settlement curve for test series A and B.
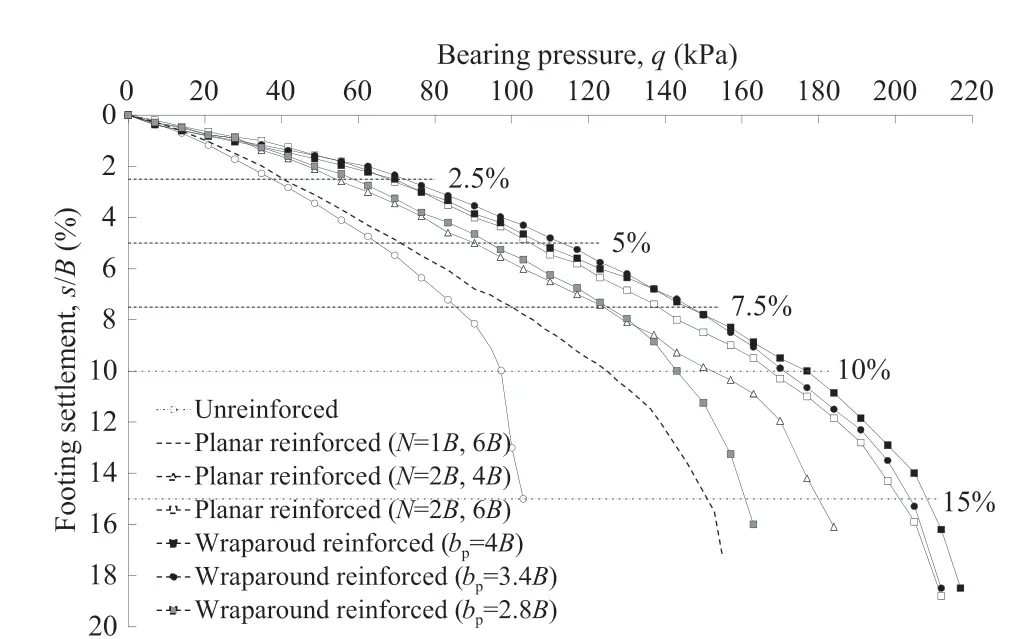
Fig. 8. Bearing pressure-settlement curve for test series C and D.
In the test series B,the model footing load tests were conducted at three b/B values of 4,6,and 8.These values were chosen based on the previous studies conducted on geosynthetic-reinforced soil foundations.There is a lack of unanimity in the literature regarding the optimum width of geosynthetic reinforcement placed under the footing. Guido et al. (1986) reported the optimum width of 2 and 3 for geogrid- and geotextile-reinforced soil foundations,respectively. Omar et al. (1993) and Khing et al. (1993) suggested the optimum values of b/B equal to 8 and 6,respectively.Cicek et al.(2015) studied the effect of reinforcement length on the bearing capacity of strip footing on sandy soil and found an optimum value of b/B equal to 5 for their model study; however, they concluded that the increase in bearing capacity is highly linked with the geometry, material properties, and type of reinforcement and therefore,cannot be generalised.For a single layer of reinforcement,the optimum achievement in this study is obtained at b/B=6.It is to be noted that the load-settlement curves are closer to each other for b/B=4 and 6 at lower magnitudes(s/B ≤5%),but after that the trend begins to change, and once s/B reaches 7.5%, a significant improvement can be observed. Moreover, for a single reinforcement of b/B=4,the failure point can be observed corresponding to the change in slope of load-settlement curve.However,the curves for b/B = 6 and 8 do not depict such failure points until higher settlement values. For b/B = 6 and 8, the curves follow almost the similar path until s/B = 10%. This is indicated in Table 3 which reports the IFpgvalues for planar reinforcement arrangement. The marked improvement can be observed especially for higher order and ultimate settlement values.For b/B=6,the value of IFpgis 1.553 for s/B at peak load level in comparison to IFpgof 1.19 for b/B = 4;but when the reinforcement width ratio is further increased to 8,the improvement is not significant (IFpg= 1.584).
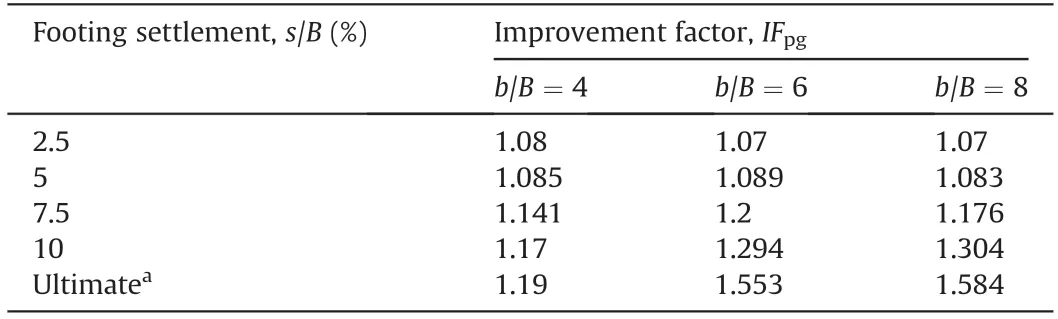
Table 3 Improvement factor for planar reinforcement arrangement at various settlement levels.
After the selection of optimum value of reinforcement width ratio (i.e. b/B = 6), the test series C with two planar layers of reinforcement were also conducted. For comparison purposes, the results of these load tests were discussed in the following section.
5.1.2. Wraparound reinforced models
The test series D represents the tests performed on the model footing resting on sand bed strengthened by wraparound reinforcement technique. For comparison purpose and to evaluate the benefits of wraparound technique, the results of the test series D are compared with those of series B and C. The test series C was conducted for N = 2 at u/B = 0.17 and b/B = 4 and 6. It should be noted that u/B was kept at 0.17 to minimise the scale effect due to the reinforcement ratio, as discussed in Section 4.2. For wraparound geotextile-reinforced tests, the parameters are given in Table 2. The total width of the wraparound geotextile (Brt) reinforcement was kept equal to 6. However, in order to find the optimum planar width ratio (bp/B) in the wraparound reinforcement technique,bpwas varied from 4B to 2.8B by changing the lap-length ratio (lx/B) from 0.8 to 1.4. The load-settlement behaviour of test series C and D is presented in Fig. 8. It can be observed that the optimum performance is obtained when the planar width of the wraparound geotextile is 4.The curve for wraparound(bp/B=3.5)depicts the higher IFwgvalues for s/B ≤7.5%but there has been no discernible improvement for the s/B levels between 7.5% and 9%and after that the performance decreases in comparison to the wraparound with bp/B = 4. Moreover, after the s/B value reaches approximately 12%,the curve has become steeper and much closer to the behaviour of planar reinforced model(N=2 and b/B=6).The performance of full wraparound(i.e.bp/B=2.8)is somewhat more similar to the planar reinforced foundation(bp/B=4 and N=2)at lower s/B values, and for s/B > 9%, the load-settlement behaviour was similar to that of reinforced model with single layer of geotextile (b/B = 6) but with additional thickness. This finding differs from the observation made by Aria et al.(2021):footing resting on soil reinforced with geosynthetic layer with full wraparound ends performs better than those reinforced with partial wraparound ends. Moreover, the fully wrapped model will behave as the coherent body and deform as the centrally loaded slab.The authors believe that this is because the reinforcement used by Aria et al.(2021) was of extremely high stiffness (i.e. J ≈1000 kN/m) which resulted in significantly higher BCR in model tests.Fakher and Jones(1996)indicated that the scale effect due to reinforcement stiffness is significant and may result in unrealistic high values of BCRs in laboratory reduced-scale model tests. Moreover, when fully wrapped geosynthetic reinforcement was utilised,this effect would have become more significant because of the horizontal component of wraparound(lx)practically being equal to the planar width(bp) of wraparound, as shown in Fig. 9. This geometry along with the very high tensile modulus of geosynthetic reinforcement may result in the deformation pattern of such models as centrally loaded beam or slab, as indicated by Aria et al. (2021). However, such mechanism is highly unlikely to occur in this study as the reinforcement properties and parameters were selected in a way to keep the scale effect at minimal level,as described in Section 4.In spite of this fact, even the fully wrapped model has performed better than the reinforced model with N = 1 and b/B = 6.
In order to evaluate the effectiveness of the wraparound technique,IFwgvalues at various settlement levels are computed against the amount of material used and occupied land width. The mass of geotextile with width equal to that of base area of footing is standardised as x(in g)and occupied land width as y(in m).It is to be noted that the occupied land width means the planar width of geotextile which is the same as b for geotextile without wrapround ends and bpfor geotextile with wrapround ends. The comparison has been presentedinTable 4.It can beeasily observed that for the same amount of material, the reinforced model with wraparound ends (case 1,IFwg= 2.15) has performed better than the model without wraparoundends(case2,IFpg=1.553).For planarreinforcement,case4has shownthebestperformanceand attained the IFpgvalueof 2.07 atsu/B,
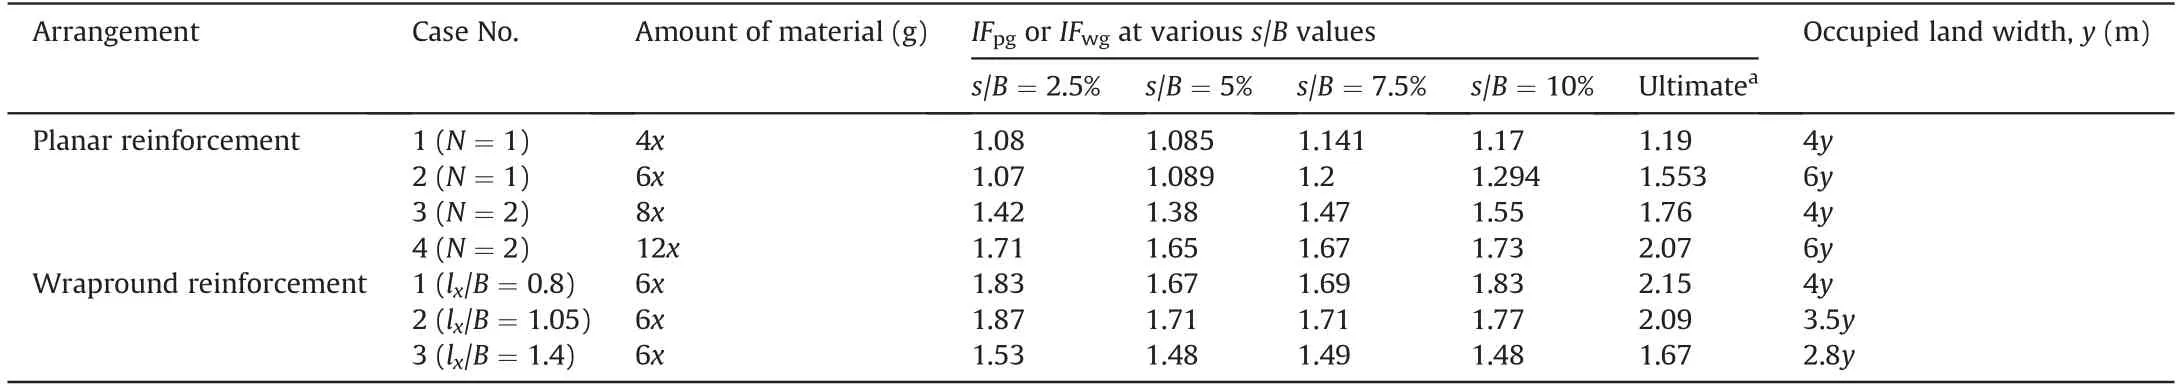
Table 4 Comparison of amount of material and occupied land width in terms of improvement factor at various settlement levels.
where suis the settlement at peak load.However,this is achieved at the cost of twice the amount of material and 1.5 times the occupied landwidthincomparisontowraparoundarrangement(case1).Fig.10 represents the variation of IFwgof wraparound reinforced model with lx/bpand lx/ly.It can be observed that if the total amount of the geotextile is kept constant, then the improvement in bearing capacity(IFwg)increases with the increase in lx/bpand lx/lyfrom 0.2 to 0.3 and from 4 to 5.25,respectively.Further increase in lx/bpand lx/lycauses the decrease inIFwg.The trendisespecially truefor settlement level(s/B)less than 10%. This can be attributed to the fact that at the lower settlement level, the frictional forces activated at the horizontal component along with the planar width (bp) starts providing resistance to the foundation soil,thus causing an increase in the bearing capacity.However,as lxis further increased,bpbecomes smaller,thus causing a decrease in optimal planar area of geosynthetic necessary for providing the resistance to the soil.However,it may be noted that for the same amount of geotextile, the increase in IFwgfor any settlement level is more than that in IFpg(see Fig.11).This is true for all the cases of lx/bpand lx/ly.The maximum improvement is achieved at ultimate loadlevelforlx/bpand lx/lyvalues of 0.2 and4,respectively.At higher settlement levels, it is expected that the shear resistance at soil-geosynthetic interface and the passive resistance due to confinement of soil as explained in Section 2 play their part in improving the bearing capacity and compression stiffness of the wraparound reinforced model foundations.However,for maximum benefits, it is important to place the wraparound geosynthetic with optimum planar width and lap-length ratio. It is important to note that the wraparound reinforced models have performed well even at the small settlement levels.Similar results were reported by Kazi et al.(2016)in examining the model foundations strengthened by wraparound geosynthetic reinforcement technique. This indicates the mobilisation of frictional and passive resistances in the wraparound zone even at smaller strain levels.
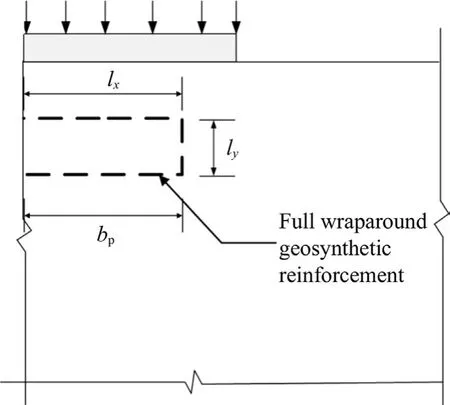
Fig. 9. Geometry of fully wrapped model.
5.2. Repeated load tests (unreinforced, planar and wraparound reinforced models)
After selecting the optimum width for planar and wraparound reinforced models, repeated load tests were conducted on unreinforced and reinforced model foundations (test series E-K). The repeated loads were applied according to the loading scheme as explained in Section 3.4.Three initial monotonic load levels,q/quof 50%, 70% and 90% were considered. For comparison purpose, the initial monotonic levels are kept according to the peak load level obtained for unreinforced models. This gives the values of applied load of approximately 48 kPa, 68 kPa and 87 kPa, respectively, for 50%,70%and 90%of q/qu.The results of the repeated load tests are discussed in the following sections.
5.2.1. Hysteresis loop analysis
Fig.12 represents the hysteresis loops of model footing settlement versus the applied pressure for 10 load cycles(test series EG).It is observed that with the application of initial monotonic load,the vertical settlement increases, and once the load is released(decreased),the elastic rebound can be observed.This is due to the elastoplastic nature of supporting soil and the reinforcement. For each cycle,the settlement attains a new maximum(peak)and new minimum value (residual) which is slightly greater than the previous one. The amount of plastic (permanent) settlement is more and gradually increases with the application of load cycles.Similar observations were made by Moghaddas Tafreshi et al.(2011)when analysing the response of circular footing resting on sand bed under cyclic loads.The trend is true for all the initial q/qulevels.However,it can be observed that the settlement values for the wraparound reinforcement technique are always less than those for the unreinforced and planar reinforced models.This is even true for higher initial load levels, that is, the accumulated settlement of wraparound geotextile-reinforced model foundation at q/qu=90%is less than that of the planar single-layer reinforced model at q/qu=70%.For double-layer reinforced model,the s/B values are much closer to that of wraparound case for higher initial load levels(i.e.q/qu=70%and 90%),but some difference can be observed for lower initial load level(i.e.q/qu=50%).This is probably due to the fact that at lower load levels,the frictional forces at planar geosynthetic interface are not fully mobilised especially in the second layer of reinforcement.As the load started to increase,the involvement of the second layer has become prominent in resisting the soil movement. However,for the wraparound arrangement, in addition to the planar width,the resistance to the foundation soil is also provided at the horizontal and vertical components. This geometric configuration will also provide the interlocking of the particles in the wraparound zone (Fig. 2). This configuration along with the densification and confinement process in the wraparound zone reduces the settlement and increases the ultimate bearing capacity and compression stiffness of the reinforced soil. However, further evaluation is necessary to find the effect of number of load cycles on the performance of wraparound models.
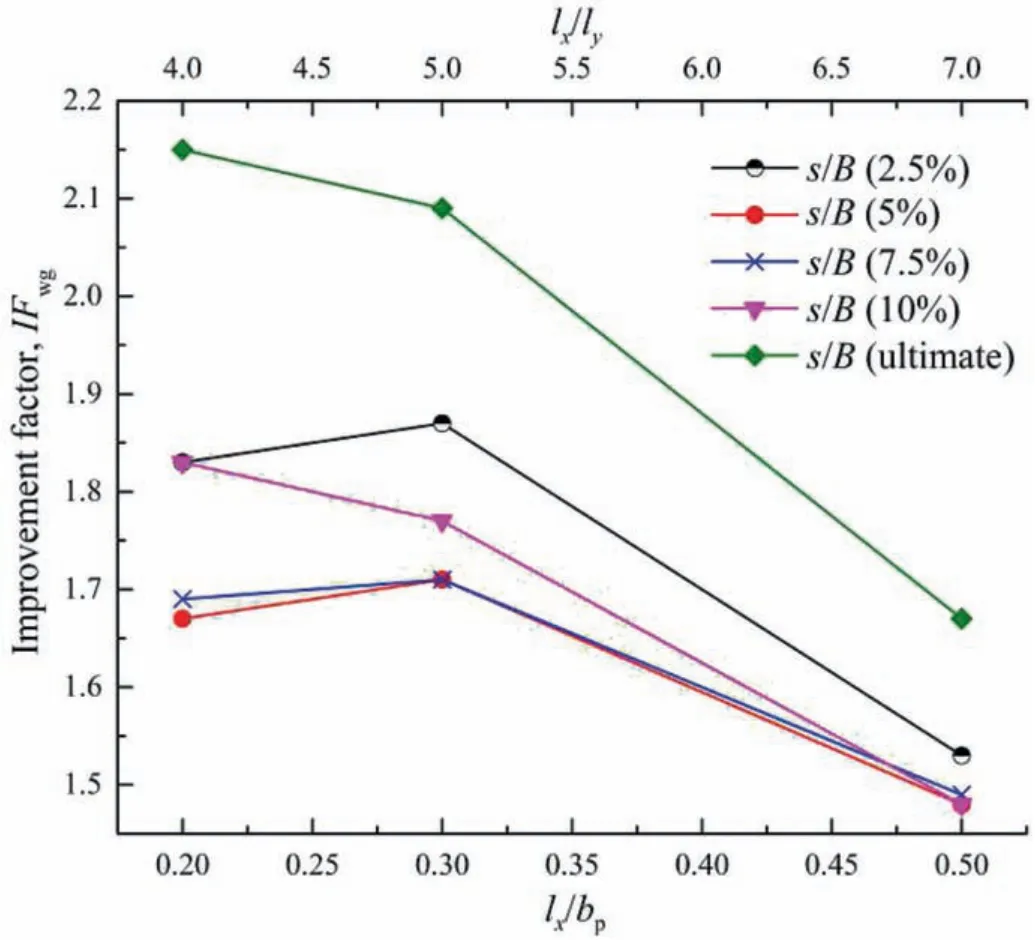
Fig.10. Variation of IFwg with lx/bp and lx/ly.

Fig. 11. Comparison of IFpg for planar geosynthetic-reinforced model versus IFwg for wraparound geosynthetic-reinforced modes at various settlement (s/B) levels.
5.2.2. Load cycle effect
In this section,theeffectof numberof loadcyclesisinvestigatedon the performance of unreinforced and reinforced models. The maximum number of load cycles is restricted to 100 to observe the general trend.Fig.13 represents the effect of number of load cycles(n)on the total settlement due to repeated loads of the models.It can be observed that for any initial load level, the settlement of footing is larger for first few load cycles,typically 1-20.It is evident that larger amount of total deformation occurs for unreinforced case in comparison to its counterpart models.Moghaddas Tafreshi and Dawson(2012b) reported the similar results in laboratory tests on footing resting on unreinforced and geotextile-reinforced sand bed under repeated loading.It is interesting to note that for unreinforced sand case(q/qu=90%),the settlement values are much higher.This depicts that even the application of slow repeated load of magnitude slightly less than the ultimate load can lead to the unstable plastic shakedown state and possibly result in the incremental collapse after further load applications.SimilarobservationwasmadebyShajaratietal.(2012)in their study related to the behaviour of sandy soils under repeated loading. The planar single-layer reinforced model depicts the progressive increase in the settlement(with decreasing trend)with the increase in the load cycles. For double-layer reinforced models, the settlement increases at a much slower rate with an increase in number of load cycles,especially at higher load levels.This is in line with the observations reported by El Sawwaf and Nazir(2010)during the investigation of reinforced sand bed subjected to repeated loading. A similar behaviour is observed for the wraparound case;however,thesettlement rate isextremelyslowafter the application of 30-40 cycles. This is the reason that for the repeated load level of lower magnitude(i.e.q/qu=50%),the test is terminated after 70 cycles.For a more comprehended presentation,an improvement factor IFsis introduced to compare the total settlement (st) for reinforced model in comparison to unreinforced model under repeated loading.Mathematically,the improvement factor is presented as follows:

where (st/B)Uis the total settlement of unreinforced model foundation, (st/B)Ris the total settlement of reinforced model foundation, and lnis the load level corresponding to n load cycle.Fig.14 shows IFsfor planar and wraparound reinforced models for 50 load cycles. The values of IFsfor each load cycle are calculated using Eq.(8)and averaged over the interval of 10 cycles.It is easily identifiable that the wrapround model performed well in comparison to planar reinforced models. The improvement can be observed even for the initial 10 cycles in which most of the settlement occurs. However, the effect is more prominent at higher load levels. The average IFsis 45% (all load levels) for wraparound reinforced models in comparison to 23% and 41% for single- and double-layer reinforced models, respectively. It is therefore admissible that the wraparound reinforcement technique can limit the accumulation of strains under repeated loading,thus providing greater stability to the foundation soil in comparison to planar reinforced models. This is true for any initial monotonic level and number of cycles under consideration.

Fig.12. Hysteresis loops of footing settlement for unreinforced and reinforced model foundations for: (a) q/qu = 50%, (b) q/qu = 70%, and (c) q/qu = 90%.
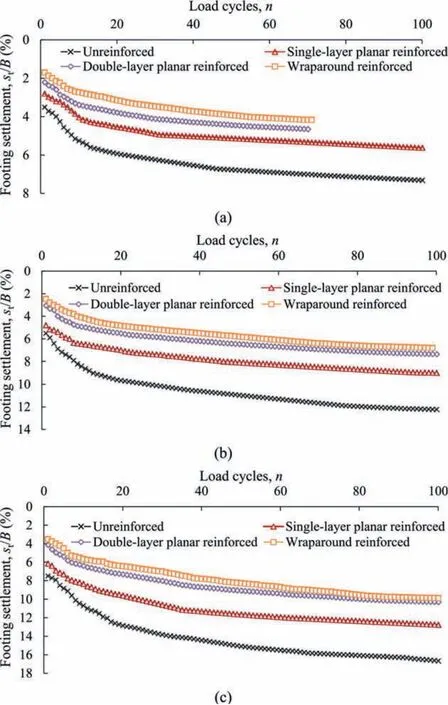
Fig.13. Number of load cycles versus total settlement for unreinforced and reinforced model foundations for: (a) q/qu = 50%, (b) q/qu = 70%, and (c) q/qu = 90%.
It may be noted that the wraparound reinforced models were subjected to repeated loads that were less than their ultimate monotonic loads. Therefore, test series H and I were conducted to compare the behaviour of wraparound and multilayer planar reinforced models at higher levels of repeated loads.The fair comparison would not be possible for any load percentage as both models have different values of ultimate bearing capacities(Fig.7).Therefore,for unbiased comparison,the load levels were kept at 70%and 90%load levels of average bearing capacity of wraparound and multilayer planarreinforcedmodelsats/B=10%asthesevaluesareclosertoeach other and of higher magnitude in comparison to other models.This gives the loads of 121.5 kPa and 156 kPa for q/qawp= 70% and 90%,respectively,where qawpis the average value of bearing pressure for wraparound and multilayer planar reinforced models.The results are shown in Fig. 15. It can be observed that the settlement values of multilayer reinforced foundations are much closer to those of wraparound reinforced model foundations. At the load level of q/qawp=90%,the difference is almost negligible.This again highlights the fact about the higher mobilisation of interface friction at higher load levels and with the increase in number of load cycles.As a whole,for higher load levels, the total settlement has gradually increased with the decreasing trend but no sign of failure is observed even after the application of 100 load cycles.
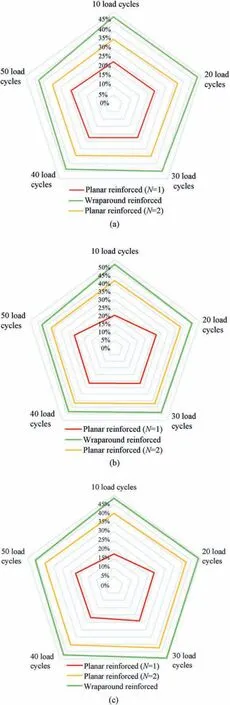
Fig. 14. Variation of improvement factor (IFs) at various load cycles in planar and wraparound reinforced model foundations for:(a)q/qu=50%,(b)q/qu=70%,and(c)q/qu = 90%.
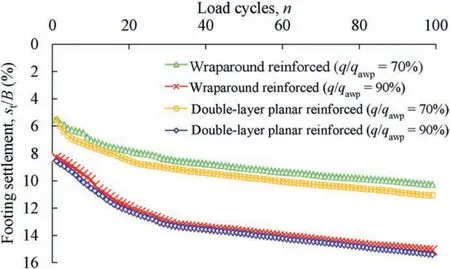
Fig.15. Number of load cycles versus total settlement for wraparound and multilayer reinforced model foundations.
5.2.3. Effect of incremental increase of load
The test series J and K were performed to evaluate the effect of incremental repeated loads on the footing. The previous repeated load tests were performed by applying the cycles of same load levels (i.e. q/qu= 50%, 70% and 90%). However, for this series, the incremental (step-up) repeated loads are applied to evaluate the performance of wraparound geosynthetic-reinforced soil foundation. Ten cycles of each load level were applied and the corresponding settlement was measured.The major shift in the pattern for any load test has been observed at the point of change of loading amplitude,especially when the load was raised from 50%to 70%of the ultimate capacity (see Fig. 16). At higher loading shift (70%-90%), the wraparound reinforcement has shown the least change due to its densification mechanism and interlocking of soil particles within the wraparound zone. Moreover, the foundation soil reinforced with wraparound technique and planar reinforced layers(N = 2) has shown much greater stability than unreinforced and single-layer reinforced foundations.
6. Conclusions
This research presents an experimental investigation that analyses the behaviour of repeatedly loaded strip footing resting on sand bed strengthened by wraparound geosynthetic reinforcement technique.The reinforcement properties and test parameters were selected in a way to keep the scale effect to a minimal level. The effects of repeated load amplitude and number of cycles along with the effect of reinforcement parameters, such as number of layers and reinforcement width, were studied. The amounts of geosynthetic material used in wraparound and planar reinforced models were also compared. Based on the results and discussion presented in the previous section, the following general conclusions can be drawn:
(1) For the same amount of geotextile and less occupied land width, the model foundations strengthened with wraparound reinforcement technique have outperformed the planar reinforced models.
(2) For lower settlement levels (s/B ≤5%), the wraparound geotextile with smaller occupied land width ratio (bp/B = 3.5) has performed well in comparison to the wraparound with slightly larger occupied land width ratio (bp/B = 4). However, for higher settlement levels, the wraparound with occupied width ratio of 4 provides more stability to the foundation soil. The performance of the fully wrapped model (bp/B = 2.8) is more similar to that of the planar double-layer reinforced model (b/B = 4); however, it should be noted that even the fully wrapped model outperforms the planar single-layer reinforced model with the same amount of geotextile and approximately 50% less occupied land width.
(3) For the same amount of geotextile, the total settlement due to vertical repeated loading is lower in wraparound geotextile-reinforced models than that in single-layer planar reinforced models.This is true for any initial load level(q/qu)and number of load cycles. Moreover, for lower q/qu(e.g.50%), the wraparound geotextile-reinforced model foundation has shown negligible amount of settlement after the application of 30 load cycles.
(4) For any magnitude of q/qu, the value of st/B for the wraparound geotextile-reinforced models tends to increase at a very slow rate in comparison to planar reinforced models.This is even true for the initial few cycles in which most of the settlement occurs.
(5) The wraparound reinforced model has shown about 45%lower average total settlement in comparison to unreinforced model, while the double-layer planar reinforced model has about 41% lower average total settlement at the cost of twice the amount of material and 1.5 times the occupied land width ratio. Moreover, for an incremental repeated loading, the wraparound reinforced model performed at par with the double-layer models.
The present study has been carried out using the small size footing under 1g conditions.The load carrying capacity of the sand bed is dependent on the footing size. Therefore, for more comprehensive understanding, it is recommended to perform further tests using field-scale tests on large-sized footings. In future, particle chasing technology, image capturing and strain measuring devices can be employed to explicitly confirm the assumptions and considerations regarding the scale effect and to modify or update the proposed theoretical mechanism suggested for wraparound reinforcement.
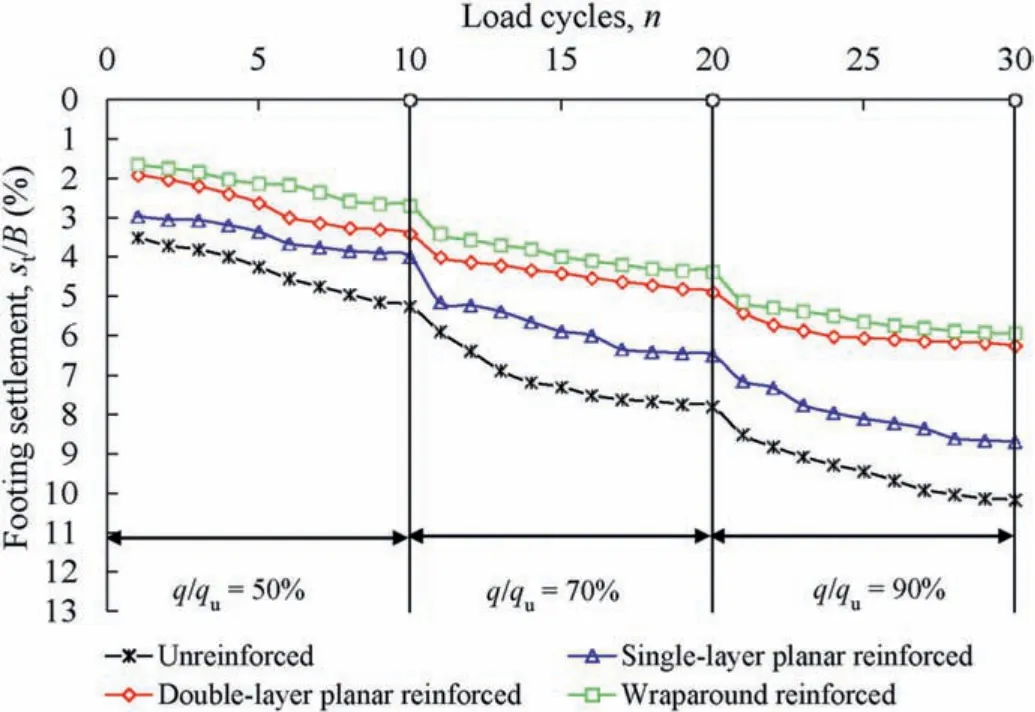
Fig.16. Effect of incremental repeated loading on the settlement of unreinforced and reinforced model foundations.
Declaration of competing interest
The authors declare that they have no known competing financial interests or personal relationships that could have appeared to influence the work reported in this paper.
Acknowledgments
This research was jointly funded by the Higher Education Commission(HEC),Government of the Islamic Republic of Pakistan and Edith Cowan University, Perth, Australia.
 Journal of Rock Mechanics and Geotechnical Engineering2021年4期
- Journal of Rock Mechanics and Geotechnical Engineering的其它文章
- Discussion on“Analysis of Bingham fluid radial flow in smooth fractures”[J Rock Mech Geotech Eng 12 (2020) 1112-1118]
- A state-of-the-art review of automated extraction of rock mass discontinuity characteristics using three-dimensional surface models
- Mesh generation and optimization from digital rock fractures based on neural style transfer
- An investigation into the effects of lime on compressive and shear strength characteristics of fiber-reinforced clays
- Mechanical performances and microstructural characteristics of reactive MgO-carbonated silt subjected to freezing-thawing cycles
- Deformation and water/gas flow properties of claystone/bentonite mixtures