Deformation and water/gas flow properties of claystone/bentonite mixtures
Chun-Liang Zhang
Gesellschaft für Anlagen- und Reaktorsicherheit (GRS), Braunschweig, 38122, Germany
Keywords:Crushed claystone Claystone/bentonite mixture Hydration Swelling Consolidation Water permeability Gas penetration
ABSTRACT
1. Introduction
Long-term safe isolation of radioactive waste in deep geological formations is guaranteed by the host rock and engineered backfill/seal barriers. Following emplacement of the waste in deposition holes,the remaining openings of the repository,including boreholes,drifts, ramps and shafts, will be backfilled and sealed with suitable materials to assure the stability and functionality against the release of radionuclides into the biosphere.In most of the disposal concepts,bentonite and bentonite-based mixtures are considered as backfill/seal material for retardation of radionuclides due to high swelling capacity, high sorption capacity, and low hydraulic conductivity of bentonite.For backfilling and sealing of the potential repositories in clay formations, as proposed in the Opalinus clay (OPA) in Switzerland(Nagra,2002)and in the Callovo-Oxfordian(COx)clay in France(Andra,2005),excavated claystone aggregate and its mixture with bentonite have been investigated(e.g.Zhang,2014;Zeng et al.,2019; Zhang and Kröhn, 2019; Middelhoff et al.,2020). Most of the studies focused on the suitability of the COx claystone aggregate and claystone/bentonite mixtures with respect to essential requirements on the backfill and seal such as:
(1) Sufficient mechanical stiffness and strength to guarantee the stability of the engineered barrier system;
(2) Certain swelling capacity to seal engineered voids remained in the barrier system and to resist the propagation of the damage of the surrounding host rock;
(3) Low porosity and permeability against water transport and radionuclide migration; and
(4) Low gas penetration pressure to allow release of gases without compromising the integrity of the multiple geological-engineered barrier system.
The previous studies(Zhang,2014;Zhang and Kröhn,2019)indicated favourable properties of the COx claystone aggregate and its mixture with bentonite MX80: the excavated aggregate can be directly used as backfill material with desirable properties, and the claystone/bentonite mixture with small bentonite contents of 20%-40% and a dry density of about 2 g/cm3exhibits similar sealing propertiesasthepure bentonitewith adrydensityof1.5g/cm3and/or the bentonite/sand(mass ratio of 7/3)mixture with a dry density of 1.8 g/cm3.
In order to examine the applicability of the results from the COx claystone aggregate to other types of claystone, a more systematic research was undertaken on the OPA claystone aggregate and its mixturewith bentonitein comparisonwith purebentonite.Relevant hydro-mechanical properties were studied, such as mechanical compressibility, water retention capacity, swelling capacity,consolidation, water permeability, and gas penetration. Among them, a series of parallel experiments was performed on coarsegrained OPA claystone aggregate,its mixture with bentonite MX80in a mass ratio of 7/3,and a bentonite pellets/powder(4/1)mixture.For the purpose of comparison, key properties and behaviours of these materials were determined under identical conditions,including:hydration and swelling with synthetic porewater of the clay, consolidation and water flow under increased loads, and gas penetration in the water-saturated and compacted conditions.
2. Test materials and sample preparation
2.1. Materials
2.1.1. Claystone aggregate
The OPA claystone aggregate was produced by excavation of a gallery through the sandy facies in the underground research laboratory (URL) at Mont-Terri, Switzerland. A road-header was used for the excavation. The produced aggregate has grains mostly smaller than 32 mm.Its grain size distribution is shown in Fig.1.It would be convenient to directly use the excavated aggregate as backfill material without additional treatments. For laboratory testing, two additional sets of aggregate samples with smaller grains of d < 10 mm and d < 5 mm (Fig.1) were also selected by removing the larger grains from the raw aggregate. The aggregate was partly desaturated during storage to a residual water content of 3.6%.A grain density of 2.7 g/cm3was measured with a helium gas pycnometer on samples dried at 105°C for 2 d.The sandy claystone contains 20%-25% of clay minerals, 30%-45% of quartz and 20%-40% of carbonates,and small amounts of other accessory minerals(Kaufhold et al., 2011; Zhang and Laurich, 2020). Compared with the COx claystone with 50%-55%of clay minerals,~20%of quartz,20%-25% of carbonates, and ~3% of others (Armand et al., 2014),the OPA sandy claystone has lower clay contents but more quartz and carbonates. The mechanical properties of the claystones are determined by the mineralogical components. Generally, the stiffness and strength increase with increasing carbonate cementation and with decreasing clay minerals. In the presence of expansive clay minerals such as smectite of 13%-23% in the COx(Tournassat et al., 2007) and 5%-20% in the OPA (Pearson et al.,2003), these claystones also exhibit certain swelling capacities upon water uptake (Zhang, 2017). The mechanical behaviour of individual claystone particles may affect the compressibility and variations in porosity and hydraulic conductivity of the aggregate under mechanical loading,particularly in compacted state with low porosities or large contact areas between neighbouring particles.The detailed characteristics of the claystones can be found in a great volume of reports,e.g. for the COx(Zhang, 2017, 2018) and for the OPA sandy claystone(Zhang and Laurich, 2020).

Fig.1. Grain size distributions of the crushed claystone aggregates as well as bentonite pellets, crushed pellets, and powder.
2.1.2. Bentonite
Sodium bentonite MX80 (Wyoming, USA) was tested by Andra(2016) for drift sealing with pellets/powder mixture. The same bentonite was provided for our experiments: pellets with a grain size d = 7 mm and a compacted dry density of 2 g/cm3, crushed pellets with d<5 mm,and powder with d<2 mm.Their grain size distributions of MX80 are illustrated in Fig.1 with curves d=7 mm,< 5 mm and <2 mm, respectively. Their water contents were measured on samples dried at 105°C for 2 d:w=7%for the pellets,5.5%for the crushed pellets and 15%for the powder.The delivered materials showed different water contents. The higher water content of the fine-grained powder resulted from its larger specific surface available for water adsorption.A grain density of 2.78 g/cm3was determined by Bosgiraud and Foin (2016). The mineralogical composition of the bentonite was measured by X-ray diffraction with Rietveld quantification to be 86%montmorillonite,6%quartz,3% feldspar, 2% plagioclase, 1% cristobalite, and small amounts of other minerals. The results were comparable with those reported(Herbert et al., 2004; Karnland et al., 2007). It shows that the dominating component montmorillonite is responsible for the high capacity of water adsorption and hence the high swelling capacity of the bentonite(Horseman et al.,1996;Yong et al.,2012;Cui,2017).
2.1.3. Water retention capacities of the materials
As one of the most important properties, the water uptake and retention capacities of the claystone, bentonite, and claystone/bentonite (7/3) mixture were determined using vapour transfer technique. Under suction effect, the initially unsaturated clay materials can take up water from a humid environment,which affects their hydro-mechanical properties and behaviours.The equilibrium water contents,as a function of suction for the materials at confined and unconfined conditions, are shown in Fig. 2. The confined samples were pre-compacted to target dry densities:1.5 g/cm3for the bentonite(d<5 mm),and 2 g/cm3for both claystone aggregate(d<5 mm)and claystone/bentonite(7/3)mixture.It is obvious that the bentonite shows the maximum capacity of water uptake at high content of montmorillonite as mentioned before. In contrast, the water uptake capacity of the claystone is limited due to the small contents of the expansive clay minerals. At zero suction (or 100%relative humidity), the amount of water uptake reaches the maximum of 40%-48% for the bentonite, which is 3 and 9 times higher than that of the claystone/bentonite (7/3) mixture and the claystone, respectively. The porosity of 46% in the confined bentonite and 26.5% in the confined claystone/bentonite mixture were fully saturated with the respective maximum amounts of water uptake, while the confined claystone aggregate with a porosity of 24%could be partly saturated with the maximum water uptake of 5% to a saturation degree of 45%.
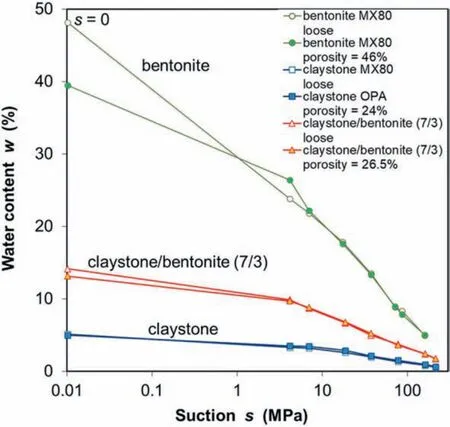
Fig. 2. Water retention curves of the claystone aggregate, claystone/bentonite (7/3)mixture, and bentonite at confined and unconfined conditions.

Fig. 3. Backfill and the seal material samples installed in oedometer cells: (a) Backfill (Excavated claystone, d < 32 mm; D/H = 280 mm/200 mm); (b) Seal material 1 (Bentonite pellets/powder with mass ratio of 8/2 mixture;d<7 mm;D/H=120 mm/46 mm);(c)Seal material 2(Claystone/bentonite with mass ratio of 7/3 mixture;d<10 mm;D/H=120 mm/73 mm);(d)Seal material 3(Assembly of claystone/bentonite with mass ratio of 7/3 block;d<10 mm;D/H=120 mm/67 mm);and(e)Seal material 4(Assembly of claystone blocks; d < 10 mm; D/H = 120 mm/67 mm).
2.2. Sample preparation
Backfill and seal material samples were prepared in consideration of available emplacement techniques, namely filling a loose material into the openings and compressing it on site to achieve a high density; and setting up pre-compacted blocks in drifts and shafts. Recently, a prototype “backfilling machine” with five screw conveyors was successfully used for horizontal emplacement of bentonite granules in a full-scale experiment at URL (Mont-Terri,Switzerland) (Müller et al., 2017), whereas compacted bentonite/sand blocks were emplaced in a drift sealing experiment at URL Bure (de La Vaissiere, 2015).
For laboratory testing, a backfill material sample was prepared by filling the coarse claystone aggregate (d < 32 mm) into a large oedometer cell with a diameter of 280 mm in two layers of 100 mm each.Each layer was compacted by hand stamping.A dry density of 1.81 g/cm3was achieved.Four seal material samples were prepared in oedometer cells of 120 mm diameter to different thicknesses:
(1) Seal material 1 is a bentonite pellets/powder mixture (sample S1), which was installed by emplacing the pellets(d = 7 mm) in seven layers and by filling the powder(d < 2 mm) into the voids between pellets. This yielded a mass ratio of pellets/powder ≈4/1 and a sample height of 46 mm.A dry density of 1.44 g/cm3achieved is slightly lower than that (~1.5 g/cm3) emplaced in the drift backfilling/sealing experiments (Foin et al.,2015; Müller et al., 2017).
(2) Seal material 2 is a claystone/bentonite (7/3) mixture (sample S2), which was mixed with the crushed claystone(d<10 mm)and the bentonite powder(d<2 mm)to a mass ratio of 7/3.The mixture was filled and stamped by hand to a height of 73 mm, yielding a dry density of 1.58 g/cm3.
(3) Seal material 3 is an assembly of claystone/bentonite (7/3)blocks(sample S3),which was firstly pre-compacted to a cylinder of 110 mm in diameter and 67 mm in height with a dry density of 2 g/cm3and then vertically cut through the central cross-sections into four sector subblocks.They were installed inthemiddleofacell.Theannulargapof5mminwidthandthe joints within the subblocks were filled with the bentonite powder to a dry density of 1.27 g/cm3,which led to an average dry density of 1.74 g/cm3of the block-powder assembly.
(4) Seal material 4 is an assembly of claystone blocks(sample S4),for which the same preparing method for seal material 3 was adopted.The crushed claystone(d<10 mm)was compacted to a dry density of 2.1 g/cm3.The four sector subblocks were installed in a cell by filling the bentonite powder into the gaps and joints.An average dry density of 1.85 g/cm3was achieved.
Fig. 3 shows the emplaced samples, while the average characteristics are summarised in Table 1. It is noted that the sample height was selected to gather representative pathways for fluid flow in the coarse-grained materials by assuming an adequate ratio of sample height to maximum grain size H/d>6.As a consequence,the ratio of sample height to diameter (H/D = 0.6-0.7) becomes larger compared with the normal values of 0.3-0.4 in conventional oedometer tests. This might yield a remarkable friction along cell wall and hence non-uniform stresses along the sample,which was not yet examined in the tests. However, an adequate sample thickness needs to be determined for coupled hydro-mechanical oedometer testing on coarse-grained materials in the future.
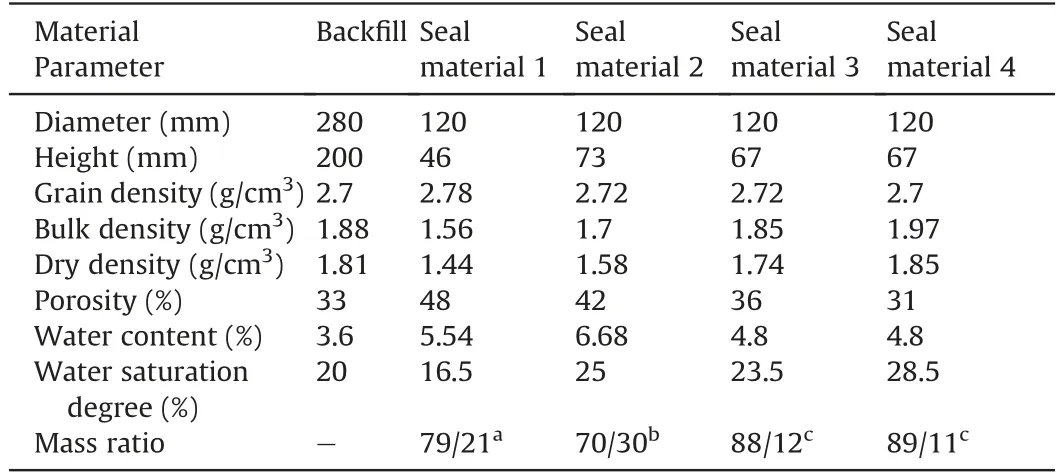
Table 1 Characteristics of the backfill/seal material samples emplaced in oedometer cells.
3. Test methodology
3.1. Setup
Long-term experiments were carried out on the backfill and seal material samples in oedometer cells.Fig.4 illustrates the schematic layouts.The backfill material sample with the coarse aggregate was tested in a large oedometer cell of D/H=280 mm/265 mm(Fig.4a).The sample was covered with two sintered porous plates at the top and bottom, which were connected to two thin holes through the upper load piston and the lower basic plate for fluid flow.A syringe pump was used for fluid injection at the bottom, while fluid outflow was measured at the top by means of burette at atmospheric pressure. The sample was axially loaded in a large testing apparatus at ambient temperature of ~22°C. Axial deformation was monitored using two linear variable differential transducers(LVDTs) mounted between the upper load piston and the cell top.
The same configuration was adopted for the set of four seal material samples in oedometer cells of D/H = 120 mm/140 mm(Fig.4b).Two coupled load rigs,each of which allows two samples one upon another(Fig.4c),were used for parallel testing under the identical conditions. This makes it possible to directly compare responses of the different materials.

Fig.4. Schematic layouts of the parallel tests on the backfill and seal materials in oedometer cells:(a)Large cell for backfill test;(b)Normal cell for seal test;and(c)A coupled load rig with two samples one upon another and associated mechanical and hydraulic systems.
3.2. Procedure
A common procedure was conducted on the backfill and seal material samples under repository-relevant conditions expected:(i) hydration by taking up water from the surrounding humid environment; (ii) consolidation under rheological rock compression and water flow from the surroundings;and(iii)gas generation and migration from corrosion of metallic components within a repository. These conditions were sequentially applied to the samples to investigate the responses of the materials:
(1) Hydration was conducted on the samples without mechanical loads. Synthetic water produced according to the chemical composition of the porewater in OPA clay(Pearson,1999)was introduced to the sample bottom at atmospheric pressure.Water uptake and axial strain of the samples were monitored for evaluation of their hydration processes and swelling capacities.
(2) Consolidation and water injection started upon the full watersaturated samples. Axial load was stepwise increased to different levels up to 5 MPa on the seal material samples and 17 MPa on the backfill material one. Each load step was kept for time periods of weeks to months until the consolidation rates reached the measurable limit of 10-10s-1. Under the load, the synthetic water was injected at pressures of 0.1-0.7 MPa to the seal material samples and 0.1-0.3 MPa to the backfill material one. The pressure gradients over 1000 were selected for precise measurement of water flow through the low permeable materials within acceptable durations of days to weeks,as done in the previous experiments (Zhang,2014;Zhang and Kröhn,2019).At high external stresses,the internal structures of the samples could not be remarkably altered by the slow water flow under the relatively low injection pressures. During steady-state water flow, apparent water permeability can be determined by Darcy’s law:

where Kwis the water permeability (m2); Qwis the water flow rate(m3/s);μwis the dynamic viscosity of the synthetic water(μw=9.5×10⁻⁴Pa s);H is the sample length(m);A is the cross-sectional area of the sample(m2);and Piand Poare the inlet and outlet pressures (Pa), respectively.
(3) Following the water flow at the final step load, gas penetration testing was carried out on the water-saturated and compacted materials.Firstly,it was tried to remove the water in the external reservoirs, but it could not be completely removed from the filters with small pores.Nitrogen gas was injected into the inlet by stepwise increasing pressure with small increments of 0.1-0.2 MPa at time intervals of 1-3 d,while the outlet was kept at atmospheric pressure.As soon as gas bubbles were detected at the outlet, the gas pressure in the inlet was considered as the gas breakthrough pressure Pb.Beyond the breakthrough, the gas injection continued for determination of apparent gas permeability by Darcy’s law:

where Kgis the gas permeability(m2),Qgis the gas flow rate(m3s-1), and μgis the dynamic viscosity of the gas (Pa s).
(4) Finally, the compacted samples were unloaded and dismantled for visual inspection.
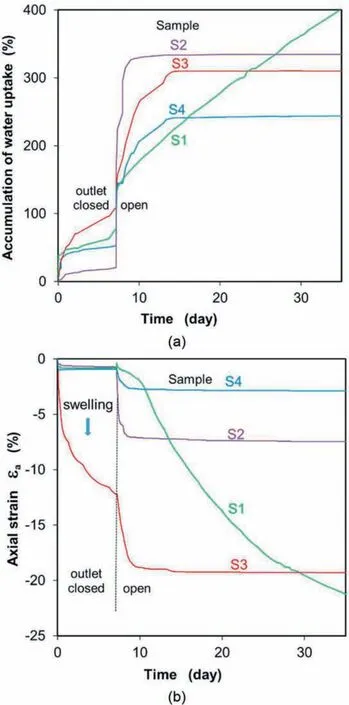
Fig.5. Evolution of(a)water uptake and(b)induced free swelling of the seal materials S1-S4 during hydration with synthetic porewater.
4. Results and discussion
4.1. Hydration and swelling
Fig.5 shows the amounts of absorbed water and axial strains of the seal material samples during hydration with synthetic water at atmospheric pressure. First, the outlet was closed. Under suction effect, the initially unsaturated materials took up water quickly in the beginning and then slowed down.As the outlet was opened,the water uptake was accelerated.This phenomenon suggests that the air in the pore space at closed outlet is compressed by increasing water content and thus the pore air pressure rises and impedes more water moving into the pores. As the outlet is opening, the compressed air releases and the reduced pore air pressure allows more water moving into the pores.The materials showed different hydration processes (Fig. 5a). Whereas the claystone block S4 as well as the claystone/bentonite mixture S2 and block S3 reached full saturation within 10-15 d, the bentonite S1 was still not fully saturated even over a longer time period to a month.Obviously,the hydration is dominated by bentonite content and dry density of the mixtures. At a given dry density, more water can be absorbed for higher contents of bentonite due to its high adsorption capacity,but more time is also needed for full saturation. Moreover, the associated swelling of bentonite particles decreases the effective porosity,which slows down the hydration too.At a given bentonite content,the pore volume decreases with increasing dry density, which slows down and limits the water uptake.
The hydration results in swelling of the clay materials(Fig.5b).At full saturation, a maximum swelling strain is achieved, which strongly depends on bentonite content and dry density. The bentonite S1, even at a low dry density of 1.44 g/cm3, exhibited a large swelling strain of 21%and more when the hydration continued till full saturation. A similar swelling strain of 20% was achieved by the claystone-bentonite block S3 at a high dry density of 1.74 g/cm3.The other two samples (claystone-bentonite mixture S2 and claystone block S4) showed smaller swelling strains of 7.5% and 3%,respectively,because of either a low dry density(1.58 g/cm3)for S2 or a low bentonite content filling the voids between blocks in S4.However, a rapid contraction occurred as water was introduced to the claystone aggregate subjected to a small load of 0.2 MPa from the piston weight(Fig.6).This can be attributed to collapse of the inner soil structure due to water-induced weakening of claystone particles and friction reduction between neighbouring particles. In practice,such contraction shall be avoided or minimised by adding bentonite to the aggregate with a small content like the claystone/bentonite(7/3) mixture S2, and/or by increasing emplacement density by mechanical compressing on site. The densities and porosities reached after hydration are summarised in Table 2 for all the samples.

Table 2 Main results determined on the studied seal materials at different test stages.

Fig. 6. Multistep consolidation behaviour and variation in water permeability of the claystone aggregate:(a) Axial stress and water injection pressure;(b) Axial strain and strain rate; and (c) Porosity and water permeability.
4.2. Consolidation and water permeability
The saturated samples were consolidated in drained conditions under repeatedly increased axial stresses and water injection pressures. The results are shown in Fig. 6 for the backfill and in Fig.7 for the seal materials in evolution of applied axial stress and water injection pressure,and resulting axial strain,porosity as well as water permeability.
4.2.1. Consolidation
The multistep loading can compact the materials and decrease their porosities (see Figs. 6c and 7b). It shows that all samples exhibit a similar multiple consolidation behaviour with a rapid decrease, followed by a gradual decrease of porosity under increasing load.The strain rates decreased steadily to a low level of~10-10s-1over days to months during each stage(see Fig.6b).The low strain rates are close to the rock strain rates observed around drifts in URL Bure (Guayacan-Carrillo et al., 2016). Quantitatively,the different materials showed different reductions in porosity(see Fig. 7b). The bentonite S1 was mostly consolidated with a high porosity of 55%-33% at 5 MPa. The claystone/bentonite (7/3)mixture S2 and block S3 exhibited a similar reduction of the porosity from 45%to 30%at 5 MPa.The claystone aggregate(Fig.6c)and block S4(Fig.7b) were less compacted due to relatively lower initial porosities and thus higher stiffnesses.
The consolidation of claystone aggregate and mixtures with bentonite is mostly governed by variations of the interparticle macropores, as the micropores in the claystone particles are hardly compressible under the lithostatic stresses. The stress and timedependent variation in porosity can be approached by(Zhang et al.,1993):

Furthermore, the consolidation increases the density and the mechanical stiffness, which can be quantified by bulk modulus:

where Δσ′aand Δεaare the increments of effective axial stress and axial strain under rapid loading.Fig.9 shows that the bulk modulus increases exponentially with increasing dry density.

Fig. 8. Stress-porosity relationship for the claystone aggregate.
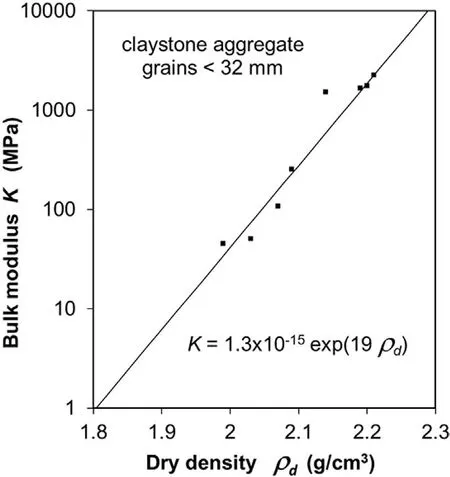
Fig. 9. Bulk modulus of the claystone aggregate as a function of dry density.
4.2.2. Water permeability
Along with porosity reduction, water permeability decreased either.Particularly, the permeability is decreased by 2-3 orders of magnitude at low stresses(below 2 MPa)(see Figs.6c and 7c):from 3 × 10-15m2to 2 × 10-17m2in the aggregate; 4 × 10-18m2to 4×10-20m2in the bentonite S1;7×10-16m2to 9×10-19m2in the claystone/bentonite mixture S2;1×10-17m2to 7×10-19m2in the claystone/bentonite block S4;and 2×10-16m2to 2×10-17m2in the claystone block S3.Note that because the bentonite was not fully saturated in the beginning, the water permeability was relatively low(2×10-19m2)and then increased to the maximum with the increase in water saturation due to porosity reduction.Beyond 2 MPa,the porosity and permeability varied insignificantly.

Fig.7. Multistep consolidation behaviours and variations in water permeability of the seal materials:(a)Axial stress and water injection pressure;(b)Porosity;and(c)Water permeability.
The dependence of water permeability on porosity is illustrated in Fig. 10. It is obvious that the permeability decreases exponentially with decreasing porosity for each material studied.Moreover,the water permeability decreases significantly with increasing bentonite content. Because the major part of the bentonite porewater is strongly bounded and becomes immobile under the applied pressure gradients,only a small fraction of the porewater is mobile within the limited pathways of smaller effective pores.

Fig. 10. Water permeability-porosity relationships of the claystone aggregate B (B remarks Backfill) and the seal materials S1-S4.
4.3. Gas penetration and impact
4.3.1. Gas penetration
Gas penetration testing followed the last consolidation stage at axial stresses of 5 MPa on the seal material samples and 17.3 MPa on the backfill material one, respectively. Fig. 11 depicts the results obtained from the parallel tests on the seal material samples with consolidated porosities (Table 2), in terms of applied gas injection pressure and permeability versus elapsed time.
The measured data indicate that:
(1) No advective gas flow occurred before the breakthrough threshold Pbfor each material;
(2) The breakthrough event occurred in the claystone block S4 at the lowest pressure Pb=0.2 MPa followed by the claystone/bentonite (mass ratio of 7/3) mixture S2 and block S3 at pressures Pb= 0.9 MPa and 1 MPa, respectively. The breakthrough of bentonite S1 was observed at the highest pressure Pb= 4.8 MPa;and
(3) The gas permeability increased with increasing injection pressure beyond the breakthrough. Obviously, the gas breakthrough pressures of the compacted claystone aggregate and claystone/bentonite mixture were much lower than that of the bentonite.The large discrepancies are mostly due to different states of porewater in the materials.
Many studies (e.g. Horseman et al.,1996; Rodwell et al.,1999;Birgersson and Karnland, 2015; Harrington et al., 2017) suggested that porewater in compacted bentonite is preferentially bound to interlayers and external surfaces of the particles and cannot be easily displaced by gas pressures, when the external confining stress is not exceeded.In contrast,porewater in claystone aggregate and mixtures with limited bentonite contents is either less strong bound or free.As gas pressure exceeds the local capillary thresholds of pores,interparticle porewater in such claystone-based mixtures can be displaced by pressuring gas. When gas pressure increases,higher capillary thresholds in narrower pore channels can be exceeded and additional pathways are created for increased gas flow.Increase in gas permeability is linearly related to the increase in injection pressure according to the equation:

In Eq. (5), the linear factor B is obtained by fitting the data for each sample and is given in Table 2.The linear relationship does not appear as a line in the log10Kg-Pgplot as shown in Fig.12 for the claystone aggregate B and block S4 as well as for the claystone/bentonite mixture S2 and block S3.

Fig. 11. Gas breakthrough pressures and permeabilities of the water-saturated seal materials compressed under axial stress of 5 MPa.
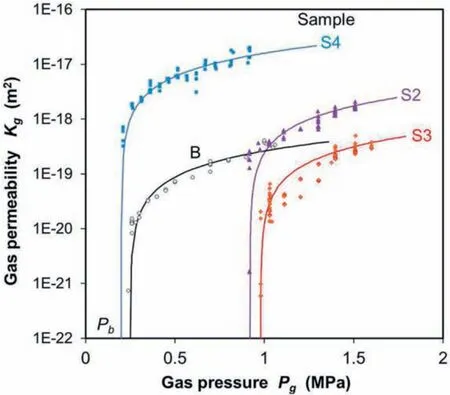
Fig.12. Gas permeabilities of the water-saturated and compacted claystone aggregate B and seal materials S2-S4 as a function of gas injection pressure.
As mentioned above, a much higher gas pressure is needed to create a pathway in bentonite.During the increase of gas injection pressure from 2.8 MPa to 4.8 MPa,a water outflow instead of a gas outflow occurred unexpectedly. This might be caused by the movement of the residual water remained in the inlet into the sample. That means that the real pressurised fluid in the sample was water rather than gas. The gas pressure was actually transferred to the porewater at the sample end(Pg=Pw).The increased pressure gradients drove the residual water into the pores displacing mobile water out of sample. The apparent water permeability values Kwestimated are presented in Fig.13. Moreover, the increased porewater pressure in the sample (mean value of Pw/2)decreased the effective stress and thus led to a gradual expansion of the sample (Fig. 14). This could be the reason for the increase in water permeability from 5×10-21m2to 3×10-19m2(see Fig.13).Only at the maximum pressure Pb, a sharp gas release was observed, indicating creation of a migration pathway through the sample.Following that, the gas pressure dropped sharply down to Pc=2.5 MPa,accompanied by a rapid reduction of gas permeability Kgto zero.This implies that the gas pathway became closed at the gas residual or shut-off pressure Pc.

Fig. 13. Evolution of gas injection pressure, water permeability before gas breakthrough and gas permeability at breakthrough observed on the bentonite sample.
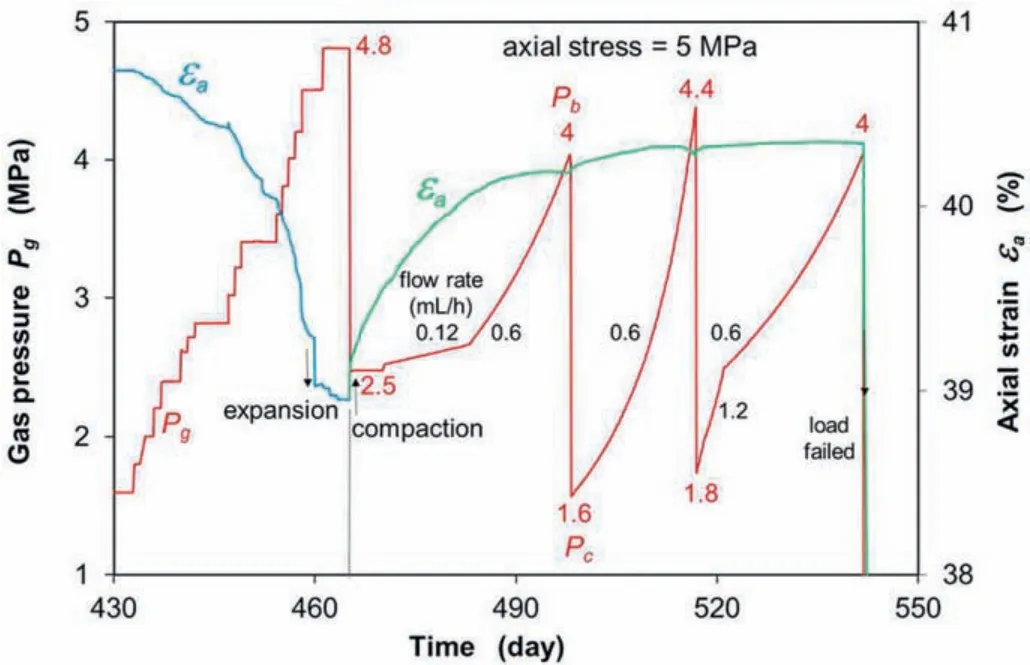
Fig. 14. Evolution of the gas injection pressure and resulting deformation of watersaturated and compacted bentonite.
Theoretically, the gas penetration in water-saturated bentonite is not dominated by displacement of porewater,but by creation and dilation of micro-fissures as the gas pressure exceeds the local confining stress and tensile strength (Horseman et al., 1996;Rodwell et al., 1999; Birgersson and Karnland, 2015; Gutierrez-Rodrigo et al., 2015; Harrington et al., 2017). In practice, the gas penetration often occurs in relatively weak regions, e.g. through joints between bentonite blocks, seal-rock interfaces, or samplecell interfaces in laboratory tests. Therefore, the gas breakthrough pressures observed in field and laboratory tests (including the present one)are usually slightly lower than the boundary confining stresses(Cuss et al.,2014;Liu et al.,2014;Birgersson and Karnland,2015; Harrington et al., 2017; Xu et al., 2017).
4.3.2. Impact of gas pressure
In order to examine self-sealing behaviour of the gas pathway in bentonite, gas injection continued at controlled flow rates. Responses of gas pressure in the inlet and axial strain are plotted in Fig.14.The gas pressure started rising from the shut-off point Pcat a flow rate of 0.12 mL/h and then accelerated at a higher rate of 0.6 mL/h until a new breakthrough at a pressure of Pb= 4 MPa occurred,which was close to the first breakthrough pressure of the intact sample. This implies that the previously induced pathway was resealed nearly to the previous intact state.The closure of the pathway is mainly caused by the mechanical compression εaunder the constant external stress. The gas pressure has no mechanical impact on water-saturated bentonite at pressures below the external stress(Birgersson and Karnland, 2015).
Following the second breakthrough, the gas pressure dropped sharply to a new shut-off point of 1.6 MPa.The continuation of the gas supply led to two further pressure rising/dropping cycles with a duration of one month for each. The repeated breakthrough pressures are within a narrow range of 4-4.4 MPa, while the shut-off pressures are within a narrow range of 1.6-1.8 MPa. The repeated breakthrough and shut-off pressures are slightly lower than those of the intact bentonite. Similar multiple cyclic pressure rising/dropping processes were also observed on water-saturated bentonites in some other experiments (Vokál et al., 2014; Gutierrez-Rodrigo et al., 2015; Harrington et al., 2017). In fact, the cyclic gas pressure rising/dropping process reveals closing/opening cycles of migration pathways.
4.4. Dismantled samples
The tests on the seal material samples were terminated due to a failure in axial loading. The unloading led to expansion of the samples (Fig. 15) with a gradual increase in porosity by 6% over 6 d at the bentonite S1, 6% and 9% at the claystone/bentonite mixture S2 and block S3,respectively,and 5%at the claystone block S4. After dismantling, the porosity of the bentonite increased further by 5.5%.
The dismantled samples can be seen in Fig.16 and described as follows:
(1) The coarse claystone particles are homogeneously distributed in the compacted aggregate and claystone/bentonite mixture;
(2) The annular gaps and joints within the assembled blocks are completely sealed with bentonite;and
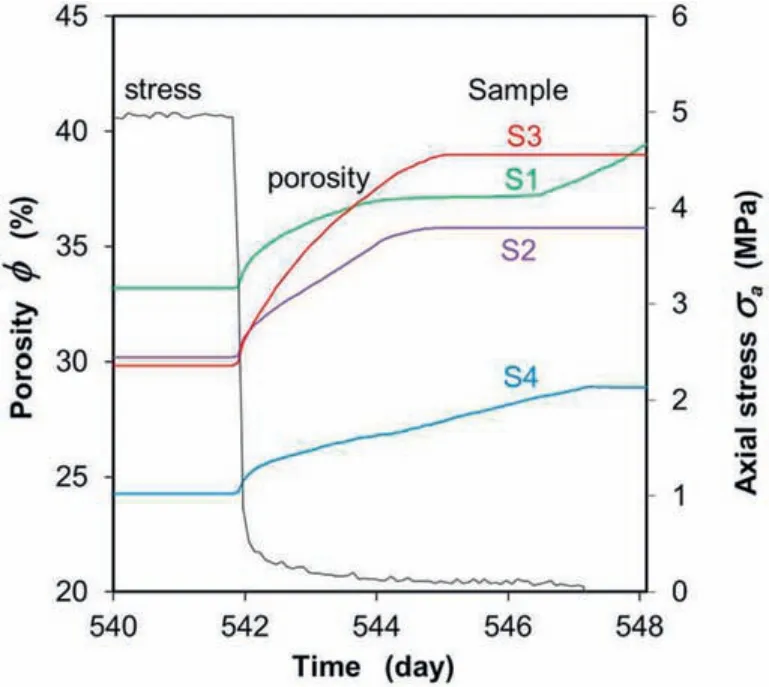
Fig.15. Swelling of the compacted seal material samples S1-S4 after unloading.

Fig.16. Photos of the dismantled backfill and seal material samples:(a)Backfill:compacted claystone;dry density=2.2 g/cm3;(b)Backfill:vertical section;(c)Seal 1:compacted bentonite pellets/powder with mass ratio of 8/2 mixture;dry density=1.5 g/cm3;(d)Seal 2:compacted claystone/bentonite with mass ratio of 7/3 mixture;dry density=1.73 g/cm3;(e)Seal 3:claystone/bentonite with mass ratio of 7/3 block;with bentonite-filled gap and joints;dry density=1.64 g/cm3;and(f)Seal 4:claystone block with bentonite-filled gap and joints; dry density = 1.92 g/cm3.

Fig.17. Demonstration of the homogenisation of bentonite pellets immersed in synthetic porewater(OPA):(a)Bentonite pellets;d=7 mm;and(b)Homogenised within 1 h.
(3) The initially heterogenous bentonite pellets/powder mixture became very homogeneous. The homogenisation of the bentonite pellets/powder mixture is mainly dominated by swelling of the pellets during the first hydration phase, as demonstrated by a simple experiment(see Fig.17).Bentonite pellets (d = 7 mm) were emplaced in a glass and flooded with the synthetic porewater.Within 1 h,the pellets swelled into the interparticle pores to be a homogeneous bentonitewater mass at a ratio of 3/1.
5. Conclusions
As a potential material for backfilling and sealing purposes in radioactive waste repositories in clay formations, OPA claystone aggregate,claystone/bentonite(7/3)mixture and bentonite pellets/powder (8/2) mixture were investigated in oedometer cells under sequentially applied conditions of hydration with the synthetic porewater, consolidation and water flow under increased loads,and gas injection into the water-saturated materials. The main conclusions can be drawn as follows:
(1) Hydration of the clay mixtures is dominated by bentonite as its high capacity of water absorption. At higher bentonite contents, more water is absorbed and longer saturation is required. The hydration leads to increasing swelling strain with increasing bentonite content and dry density. The swelling of bentonite particles into the pore space contributes to the homogeneity of the internal structure. The bentonite pellets/powder mixture and the compacted claystone/bentonite (7/3) block with a dry density of 2 g cm-3exhibit sufficiently high swelling capacities to seal technological voids remained in a seal system and to resist the propagation of the surrounding damaged rock zone.
(2) Drained consolidation of the clay mixtures increases nonlinearly with stress and time. The reduction in porosity decreases the water permeability exponentially.Very low water permeabilities of 10-18-10-20m2can be achieved with the materials under consolidation at stresses of up to 5 MPa.The bentonite content governs the water permeability due to its high capacities for water absorption and swelling, which decreases the effective pore space and thus the permeability.
(3) Gas penetration in the water-saturated clay mixtures is significantly dependent on bentonite content. A high gas pressure is needed to create and dilate local micro-fissures in bentonite for gas flow. The gas breakthrough pressure observed for bentonite is nearly equal to the confining stress,and the induced pathway reseals quickly with a pressure drop to shut-off pressure. The pressure rising/dropping repeats cyclically upon the continuing gas supply within the gas pressure interval between the upper breakthrough and lower shut-off boundaries, reflecting the dynamic closing/opening cycles of the gas pathway in bentonite.In contrast to bentonite, compacted claystone aggregate and claystone/bentonite mixture allow for gas release at low and moderate gas pressures. The gas permeability of the induced pathway varies linearly with the injection pressure.
The results are helpful for design of the engineered barriers with the studied materials for safe isolation of radioactive waste in repositories.
Declaration of competing interest
We wish to confirm that there are no known conflicts of interest associated with this publication and there has been no significant financial support for this work that could have influenced its outcome.
Acknowledgments
The research was funded by the German Federal Ministry for Economic Affairs and Energy (BMWi) under contract number 02E11627. The supports from Swisstopo (Switzerland) and Andra(France) for providing the test materials are gratefully acknowledged. My colleague, Dr. Artur Meleshyn, and anonymous reviewers are also acknowledged for their many helpful suggestions on the manuscript.
 Journal of Rock Mechanics and Geotechnical Engineering2021年4期
- Journal of Rock Mechanics and Geotechnical Engineering的其它文章
- Discussion on“Analysis of Bingham fluid radial flow in smooth fractures”[J Rock Mech Geotech Eng 12 (2020) 1112-1118]
- A state-of-the-art review of automated extraction of rock mass discontinuity characteristics using three-dimensional surface models
- Mesh generation and optimization from digital rock fractures based on neural style transfer
- Experimental study on repeatedly loaded foundation soil strengthened by wraparound geosynthetic reinforcement technique
- An investigation into the effects of lime on compressive and shear strength characteristics of fiber-reinforced clays
- Mechanical performances and microstructural characteristics of reactive MgO-carbonated silt subjected to freezing-thawing cycles
