
Autophagy dysregulation mediates the damage of high glucose to retinal pigment epithelium cells
2021-06-11 00:49QianZhangHongSongLiRongLiJunHuiDuCongJiao
Qian Zhang, Hong-Song Li, Rong Li, Jun-Hui Du, Cong Jiao
1Center of Clinical Aerospace Medicine, School of Aerospace Medicine, Key Laboratory of Aerospace Medicine of Ministry of Education, Air Force Medical University, Xi’an 710032,Shaanxi Province, China
2Department of Ophthalmology, the Second Affiliated Hospital of Xi’an Jiaotong University, Xi’an 710004, Shaanxi Province,China
3Department of Ophthalmology, the First Affiliated Hospital of Xi’an Medical University, Xi’an 710077, Shaanxi Province,China
4Department of Ophthalmology, Xi’an Ninth Hospital Affiliated to Medical College of Xi’an Jiaotong University,Xi’an 710054, Shaanxi Province, China
Abstract
● KEYWORDS: diabetic retinopathy; retinal pigment epithelial cell; apoptosis; autophagy; the mechanistic target of rapamycin (mTOR)
INTRODUCTION
The layer of retinal pigment epithelial cell (RPE), located between the retina and the choroid, is an important part of the blood‐eye barrier and plays an important role in maintaining normal retinal metabolism[1]. RPE prevents the diffusion of large and many small molecules, thereby regulating the transport of substances between visual cells and blood. If this barrier is disrupted, changes such as protein leakage can occur. RPE secretes a variety of bioactive cytokines, which play an important role in various eye diseases, and these factors also react on RPE, affecting its biological activity and function[2]. RPE is essential for the function of the neuroretina, however, the change of RPE layer is difficult to find in diabetic retinopathy (DR)[3]. In recent years, some studies have concentrated on the abnormal structure and secretory function of RPE in DR. For example,the damage of high glucose to RPE will cause intracellular metabolic disorder, which will lead to the destruction of local environment of the retina and the occurrence of retinopathy[4].However, the pathophysiological regulation mechanism of RPE has not been widely understood, and further study of its injury mechanism is necessary to find new treatment strategies for DR.
Autophagy is a highly conserved intracellular degradation pathway, which plays a protective and repair role under normal conditions. However, autophagy dysregulation may have fatal consequences on cells, suggesting a complex network between autophagy and apoptosis[5]. Recently, autophagy dysregulation is supposed to be involved in the pathological mechanism of DR, and RPE, as the main cell for the maintenance of retinal function, plays a crucial role in DR due to abnormal autophagy activation[6]. Autophagy regulation is a multi‐step and extremely complex process, which is mainly regulated through the mTOR signaling pathway, Beclin‐1 signaling pathway and p53 signaling pathway[7]. Although autophagy disorder of RPE is involved in the pathological mechanism of DR, the specific regulatory mechanism and its effect on cell damage are still unclear. This study aimed to observe the role of autophagy in high glucose damaged RPE, and to lay a foundation for clarifying the pathological mechanism of DR.
MATERIALS AND METHODS
Cell CultureARPE‐19, a human retinal pigment epithelial cell line (Procell Life Science & Technology Co., Ltd., China)was regularly cultured in DMEM/F12 medium (Gibco,USA). When the cell density reached 80%, the medium was discarded, and then the cells were treated with 2 mL 0.25% trypsin (Gibco, USA). The cells were observed under a microscope for 1‐2min, and the cells were separated and rounded. A single‐cell suspension was made for passage at a ratio of 1:3 and expanded under the conditions of 37℃, 5%CO2and saturated humidity.
Cell GroupingThe cells in the logarithmic growth stage in good growth state were inserted into a 96‐well plate with 5×10³cells per well, and the blank group [added 100 μL sterile phosphate buffer saline (PBS)] was set up for overnight culture at 37℃. Cells were divided into the following groups according to different treatments: normal control group (NC),3‐methyladenine [3‐MA; an autophagy inhibitor (Selleck,USA)] group (10 mmol/L 3‐MA was added to the medium),high‐glucose group [HG; 30 mmol/L D‐glucose (Aladdin,China) was added into the medium], and HG+3‐MA group(30 mmol/L D‐glucose and 10 mmol/L 3‐MA were added to the medium).
Cell ViabilityThe viability of ARPE‐19 was analyzed using cell counting kit‐8 (CCK‐8; MCE, USA). In brief, 10 μL CCK‐8 solution was added to each well after 48h of cell treatment in different groups. Then, the cells were incubated at 37℃ for 4h. In a plate reader (Flexstation®3, Molecular Devices,USA), the absorbance value (A) of each well was estimated at 450 nm. The cell viability (%) in each experimental group=(Aexperimentgroup‐Ablankgroup)/(Acontrolgroup‐Ablankgroup)×100%.
Cell ApoptosisThe cells in good growth state were put into a 6‐well plate with 5×10⁵/well and cultured overnight at 37℃.Cells in the four groups were cultured for 48h and treated with 0.25% trypsin without EDTA. After digestion, the cells were collected and centrifuged. Then, the supernatant was removed,and the cells were resuspended with PBS. The cells were rinsed twice with PBS and centrifuged. Annexinv‐APC/7‐AAD apoptosis detection kit (Tianjin Sungene Biotech Co.,Ltd., China) was used to detect apoptosis using flow cytometry(CytoFLEX, Beckman Coulter, USA).
Western BlottingAfter treatment for 48h, the cells from each group were collected and washed with 4℃ precooling PBS.After adding RIPA cell lysis solution, the cells were cracked in the ice for 30min and then centrifuged at 12 000 rpm for 5min at 4℃ to collect supernatant. BCA protein assay kit (Beyotime,China) was adopted to quantify the concentration of proteins.The protein sample was mixed with 5× loading buffer (volume ratio 4:1), and denatured by heating in the boiling water bath for 10min. Equivalent amount of protein samples were taken for SDS‐PAGE gel electrophoresis. After separation,the protein was transferred to the PVDF membrane by semi‐dry method and incubated for 2h with the blocking solution tris buffered saline with Tween 20 (TBST) containing 5%skimmed milk powder. The diluted primary antibodies LC3(1:1000, Affinity, USA), p62 (1:1000, Affinity, USA), mTOR(1:1000, Cell Signaling Technology, USA), p‐mTOR (1:1000,Cell Signaling Technology, USA), Bax (1:1000, Cell Signaling Technology, USA), Bcl‐2 (1:1000, Cell Signaling Technology,USA), Caspase‐3 (1:1000, Cell Signaling Technology, USA),and GAPDH (1:1000, Hangzhou Xianzhi Biology Co., Ltd.,China) were added and incubated at 4℃ overnight. After washing with TBST, the membrane was incubated with HRP‐conjugated secondary antibodies (1:50 000, Boster, China) at room temperature for 2h. The membranes were then incubated with ECL substrate (Thermo Fisher Scientific, USA) and BandScan software (Glyko Inc., USA) was used to analyze the intensity of the target bands.
Detection of Autophagic FluxA single cell slide was taken out by using sterile forceps from75% alcohol, put over the alcohol lamp flame to dry the alcohol, and then put into a 12‐well plate. The cells in good condition were made to the single‐cell suspension with DMEM/F12 medium and then uniformly inoculated at 1×10⁵cells per well into the 12‐well plate. The cells were cultured overnight at 37℃ and 5% CO2.Together with indicated treatment in different groups for 48h at 37℃, 50 μL adenovirus expressing mCherry‐GFP‐LC3B fusion protein (Ad‐mCherry‐GFP‐LC3B, Beyotime, China)was transfected into the cells at a multiplicity of infection[MOI=virus titer (1×10⁸pfu/mL)×virus volume (0.05)/cell density (2×10⁵)] of 25 in DMEM/F12 medium. Then,autophagic flux was detected by a laser confocal microscope(C2, Nikon, Japan).
Statistical AnalysisSPSS 25.0 and Graphpad Prism 8.0 softwares were used to was used for statistical analysis and drawing charts. The measurement data were tested by Shapiro‐Wilk test to show a normal distribution and were shown as mean±standard deviation (SD). The one‐way analysis of variance (ANOVA) and following LSD‐ttest were used for group comparison, andP<0.05 was considered to be statistically significant.
RESULTS
Autophagy Inhibition Increased Cell Viability of ARPE-19 Under High GlucoseThe cell viability of the NC, 3‐MA,HG and HG+3‐MA group were significant difference(100.00±0.00)%, (96.50±2.21)%, (66.23±3.58)%, and(84.93±1.48)%, respectively (F=139.67,P<0.001). No significant difference in cell viability between the NC and 3‐MA group was found (P>0.05). Compared with the NC and 3‐MA group, the cell viability of the HG and HG+3‐MA group was lower (allP<0.001). Compared with the HG group, the cell viability of the HG+3‐MA group was higher (P<0.001;Figure 1).
Autophagy Inhibition Decreased Cell Apoptosis of ARPE-19 Under High GlucoseThe apoptosis rate of the NC, 3‐MA,HG, and HG+3‐MA group were (5.85±0.25)%, (6.19±0.40)%,(28.10±0.93)%, and (13.52±1.04)%, respectively (F=596.70,P<0.001). No significant difference in apoptosis rate between the NC and 3‐MA group was found (P>0.05). The apoptosis rate of the HG group was higher than the NC and 3‐MA group(allP<0.001). The apoptosis rate of the HG+3‐MA group was lower than the HG group (P<0.001; Figure 2).
The relative expression of proteins in the NC, 3‐MA, HG,and HG+3‐MA group were as following: Bax, 0.14±0.02,0.08±0.03, 0.69±0.03, and 0.34±0.02 (F=536.58,P<0.001);Bcl‐2, 0.09±0.01, 0.21±0.02, 0.05±0.02, and 0.13±0.02(F=56.39,P<0.001); pro‐Caspase‐3, 0.51±0.02, 0.50±0.02,0.51±0.03, and 0.51±0.02 (F=0.017,P>0.05); and Caspase‐3,0.08±0.02, 0.03±0.01, 0.23±0.03, and 0.14±0.02 (F=64.68,P<0.001), respectively. Compared with the NC group, the expressions of Bax and Caspase‐3 in the HG group and HG+3‐MA group were significantly increased (allP<0.01), but decreased in the 3‐MA group (allP<0.01). Compared with the 3‐MA group, the expressions of Bax and Caspase‐3 in the HG group and HG+3‐MA group were significantly increased (allP<0.001). Compared with the HG group, the expressions of Bax and Caspase‐3 in the HG+3‐MA group were significantly decreased (allP<0.001). Compared with the NC group, the expressions of Bcl‐2 in the 3‐MA and HG+3‐MA group were significantly increased (allP<0.05) but decreased in the HG group (allP<0.05). Compared with the 3‐MA group, the expressions of Bcl‐2 in the HG and HG+3‐MA group were significantly decreased (allP<0.001). Compared with the HG group, the expression of Bcl‐2 in the HG+3‐MA group was significantly increased (allP<0.001; Figure 3).
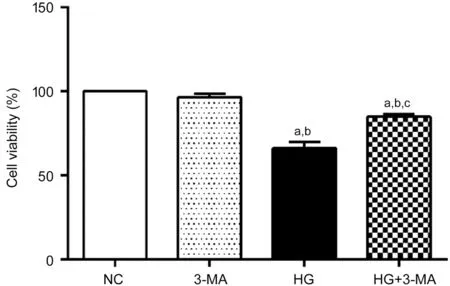
Figure 1 Comparison of viability of ARPE-19 cells in each group aP<0.001 vs NC, bP<0.001 vs 3‐MA, cP<0.001 vs HG.
3-MA Inhibited Autophagy Activation of ARPE-19 Under High Glucose ConditionsTo confirm the activation of autophagy by high glucose and the inhibition of autophagy by 3‐MA, the expression of autophagy markers LC3 and p62 of ARPE‐19 cells was analyzed by Western blotting. The ratio of LC3‐II/LC3‐I of the NC, 3‐MA, HG, and HG+3‐MA group was 0.16±0.01, 0.09±0.02, 0.57±0.03, and 0.33±0.03,respectively (F=268.49,P<0.001). The relative expression of p62 was 0.35±0.03, 0.55±0.03, 0.12±0.02, and 0.20±0.02 in the NC, 3‐MA, HG, and HG+3‐MA group, respectively(F=214.43,P<0.001). Compared with the NC group, the LC3‐II/LC3‐I ratio of the 3‐MA group was significantly reduced(P<0.01), and that of the HG and HG+3‐MA groups was significantly increased (allP<0.001). Compared with the 3‐MA group, this ratio of the HG and the HG+3‐MA group were significantly increased (allP<0.001). Compared with the HG group, this ratio in the HG+3‐MA group was significantly decreased (P<0.001). Compared with the NC group, the expression of p62 was significantly increased in the 3‐MA group (P<0.001), and significantly decreased in the HG and HG+3‐MA group (allP<0.001). Compared with the 3‐MA group, the expression of p62 was significantly decreased in the HG and HG+3‐MA group (allP<0.001). Compared with the HG group, the expression of p62 in the HG+3‐MA group was significantly increased (P<0.01; Figure 4).
To observe the dynamic changes of autophagy in ARPE‐19 cells, the autophagic flux was further detected by transfection with Ad‐mCherry‐GFPLC3B. In the NC group, weak green and red dots can be observed in the cells, representing diffuse LC3B protein in the cells. In the 3‐MA group, less green and red dots were noticed compared with that in the NC group.In the HG group, a significant increase of green and red dots compared with the NC and 3‐MA group, signifying an increased autophagic flux. However, decrease of green dots was found in the cells in the HG+3‐MA group, compared with that of the HG group, implying that the autophagosome formation was inhibited by 3‐MA treatment (Figure 5).
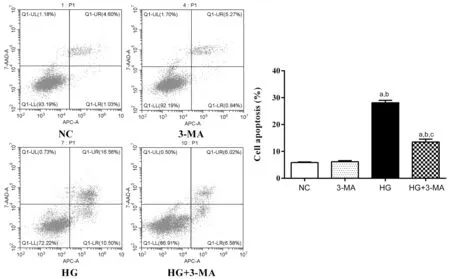
Figure 2 Comparison of apoptosis rate of ARPE-19 cells in each group aP<0.001 vs NC, bP<0.001 vs 3‐MA, cP<0.001 vs HG.
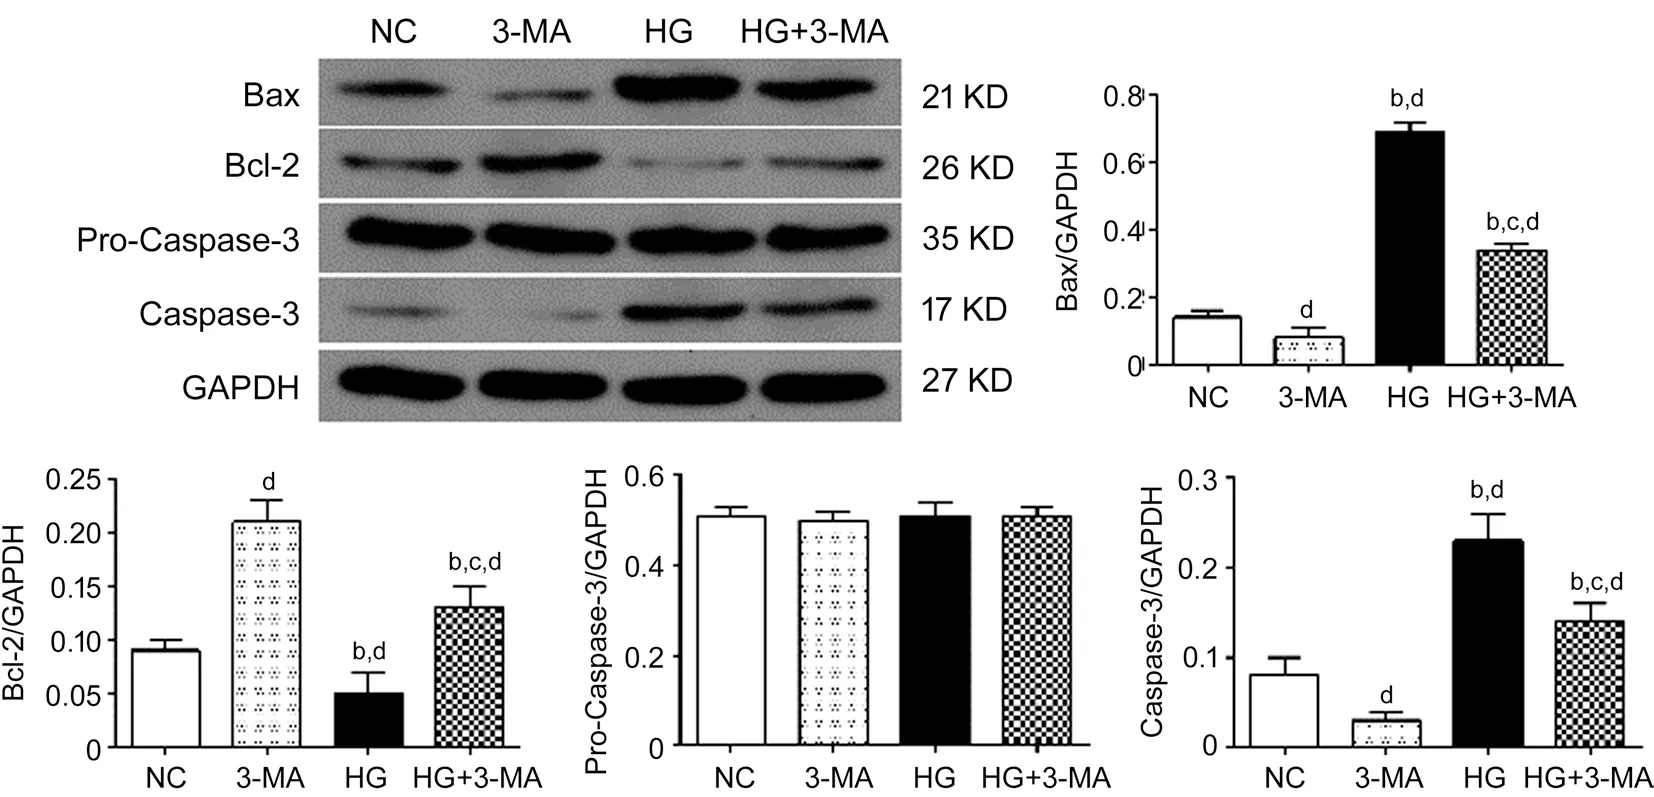
Figure 3 Comparison of the expression of apoptosis markers including Bax, Bcl-2, and Caspased-3 of ARPE-19 cells in each group dP<0.01 vs NC, bP<0.001 vs 3‐MA, cP<0.001 vs HG.
mTOR Pathway in the Autophagy Dysregulation Under High Glucose ConditionsIn order to investigate whether mTOR pathway is involved in high glucose induced autophagy dysfunction, the expression of total mTOR and phosphorylation mTOR (p‐mTOR) of ARPE‐19 cells was analyzed by Western blotting. The relative expression of total mTOR of the NC, 3‐MA, HG, and HG+3‐MA group was 0.34±0.02, 0.33±0.02, 0.35±0.03, and 0.32±0.03, respectively(F=0.767,P>0.05). The relative expression of p‐mTOR of the NC, 3‐MA, HG, and HG+3‐MA group was 0.12±0.02,0.22±0.02, 0.02±0.01, and 0.07±0.01, respectively (F=102.60,P<0.001). Compared with the NC group, the expression of p‐mTOR was more in the 3‐MA group (P<0.001), and less in the HG and HG+3‐MA group (allP<0.01). Compared with the 3‐MA group, p‐mTOR expression was less in the HG and HG+3‐MA group (allP<0.001). Compared with the HG group,the expression of p‐mTOR in the HG+3‐MA group was more(P<0.01; Figure 6).

Figure 4 Comparison of the expression of autophagy markers LC3 and p62 of ARPE-19 cells in each group dP<0.01 vs NC,bP<0.001 vs 3‐MA, fP<0.01 vs HG.
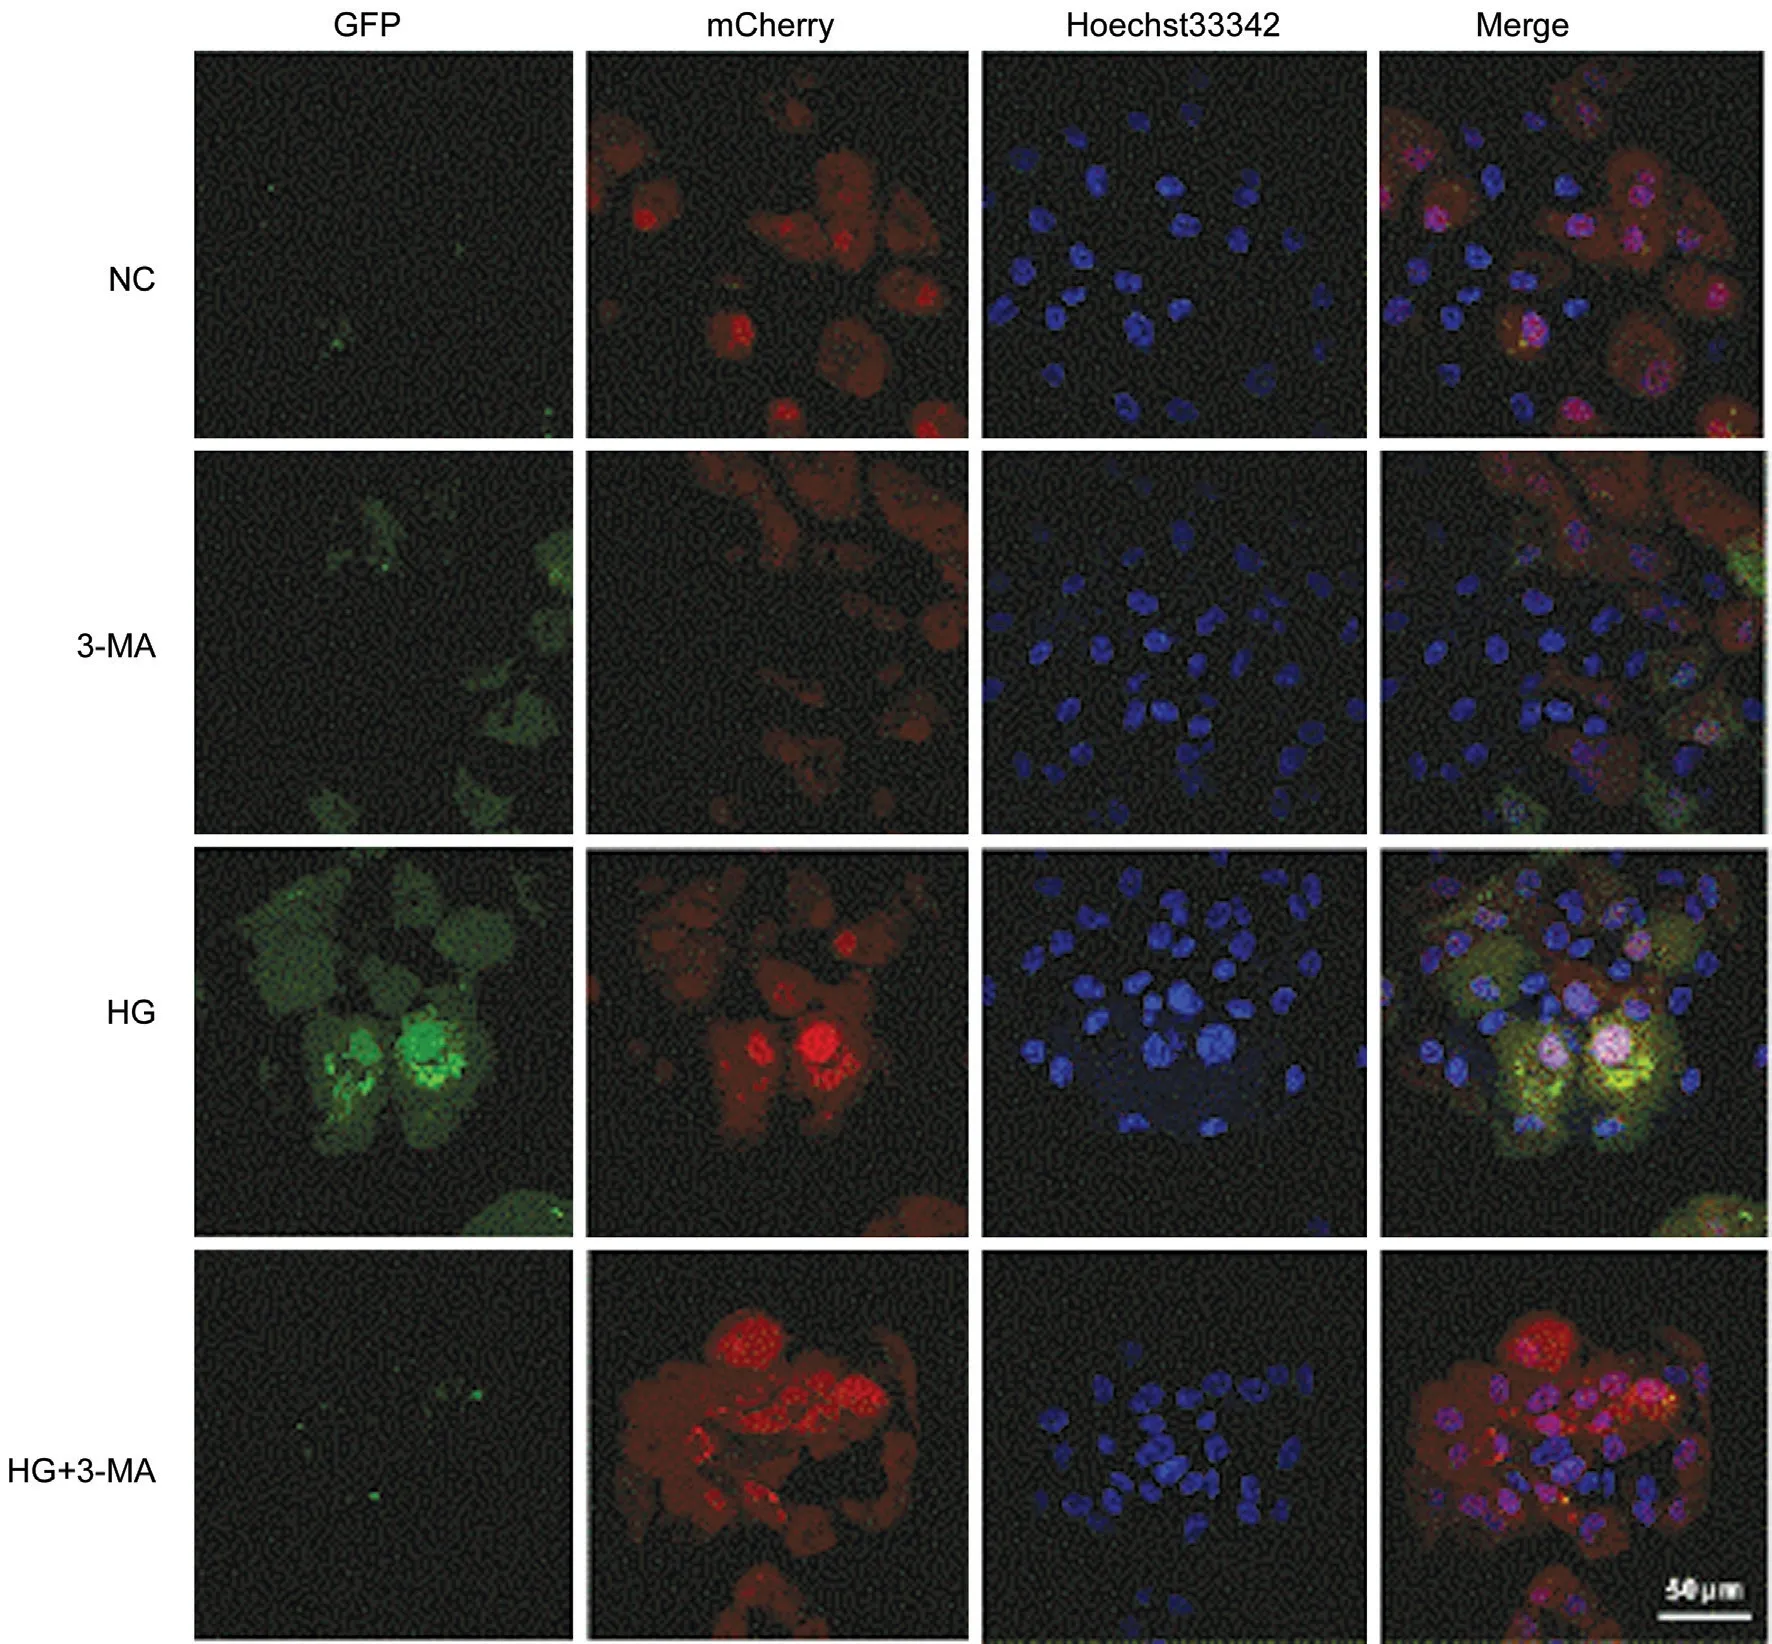
Figure 5 Comparison of autophagic flux of ARPE-19 cells in each group under a laser confocal microscope (Bar=50 μm).
DISCUSSION
With an increasing incidence of diabetes mellitus, DR is still a serious global problem leading to vision loss in the working age adults[8‐9]. High levels of blood glucose are recognized as a major cause of DR[8,10]. While researching new strategies to treat DR, the cellular stress and biochemical abnormalities caused by blood glucose and reactive metabolites need to be continuously evaluated and targeted for treatment[11].In the pathogenesis of DR and macular edema, defects in the external barrier of the retina play key roles, and RPE dysfunction is thought to increase the risk of DR development and progression. In view of the importance of high glucose in the occurrence of DR, the growth of RPE cells under high glucose conditions was observedin vitro. We adopted the most commonly used experimental method, namely adding 30 mmol/L D‐glucose in DMEM/F12 medium to simulate conditions of hyperglycemia and found the cell viability of ARPE‐19 was significantly suppressed and the apoptosis rate along with pro‐apoptotic proteins, including Bax and Caspase‐1 obviously increased while antiapoptotic protein Bcl‐2 decreased, confirming the damage of RPE cells by high glucose treatment, which was consistent with the results of previous reports[12‐13], suggesting that RPE damage is a significant event in DR pathological process.

Figure 6 Comparison the expression of mTOR of ARPE-19 cells in each group dP<0.01 vs NC, bP<0.001 vs 3‐MA, fP<0.01 vs HG.
At present, the molecular mechanism of RPE injury caused by high glucose is still not well understood. It is generally believed that high glucose leads to the dysfunction of mitochondrial electron transport chain, and finally leads to the increase of reactive oxygen species (ROS) production in cells, which damages RPE cells through oxidative stress[12,14].Autophagy is a cell protection mechanism that has been widely concerned in recent years. Studies have found that lysosomal damage and autophagy dysregulation are early events in the pathogenesis of DR[15]. Therefore, in this study, we investigated whether RPE cell damage under high glucose condition is directly mediated by autophagy. LC3, one of the most widely used autophagy marker, mainly consists of LC3‐I and LC3‐Ⅱ.Under normal circumstances, LC3‐I is mainly located in the cytoplasm, and after autophagy induction, LC3‐Ⅱ mainly locates in autophagosomes and autolysosomes. Thus, the change of LC3‐Ⅱ/LC3‐I ratio is commonly used as an autophagy indicator[16]. During autophagy, p62 in the cytoplasm binds to intracellular ubiquitinated proteins, then forms complexes with LC3‐Ⅱ positioning on the membranes of the autophagosomes,and finally degrades in autolysosomes[17]. As p62 protein is continuously degraded with the progress of autophagy, its expression level is negatively correlated with autophagy[18].
Currently, there are many research methods for autophagy,among which western blotting detection of LC3 or p62 expression belongs to the static analysis, which can only observe autophagy at a certain time point. Autophagic flux refers to the complete process from substrate being wrapped by autophagosomes to transported to lysosomes for degradation. Cells are transfected with a vector carrying GFP‐LC3B fluorescent protein label, and autophagy induction or inhibition treatment is given to realize the monitoring of autophagic flux, which can reflect the dynamic changes of autophagy to a certain extent[19]. At the early stage, LC3B localizes in autophagosomes, so both signals of GFP (green)and mCherry (red) were noticed. At the late stage, due to the relative stabilization of mCherry and the quick quenching of GFP in the acidic environments of autolysosomes, red dots can be mainly observed[20].
In this study, both static and dynamic analysis of autophagy were used. Our previous studies suggested that autophagy of retinal endothelial cells was activated under high glucose conditions, which promoted the disease progression[21].Similarly, this study suggest that high glucose activates autophagy in RPE cells, manifested by higher expression of LC3 and lower expression of p62, as well as increased intracellular autophagy flux. Consistent with previous reports,under high glucose conditions, the expression of LC3‐Ⅱ of ARPE‐19 increased, and autophagosomes increased under the electron microscope[22]. Other studies have also found that high glucose causes increased ration of LC3‐Ⅱ/I and decrease of p62 of ARPE‐19 cells. The explanation was that high glucose‐induced autophagy can remove damaged proteins,prevent the damage of oxidative stress to RPE induced by high glucose[23‐24]. However, numerous studies have shown that autophagy is a double‐edged sword in the pathogenesis of DR.Under mild stress, induction of autophagy can maintain cell survival, while under severe stress, dysregulated autophagy will cause cell apoptosis[5]. In this study, when the cells were treated with a widely used autophagy inhibitor 3‐MA, the inhibitory effect of high glucose on viability of ARPE‐19 was significantly decreased, and the enhancement of high glucose on cell apoptosis was also significantly inhibited. Together,these results suggest that autophagy dysregulation directly mediates the damage of high glucose to RPE cells.
Dysregulated retinal autophagy in diabetic patients is an extremely complex mechanism, which is closely related to endoplasmic reticulum stress, oxidative stress as well as inflammation‐related pathways[25]. As a serine/threonine protein kinase from the PI3K‐related kinase family, mTOR maintains the balance of anabolic and catabolic processes under various physiological and pathological conditions[26].mTOR pathway regulates a variety of biological processes including protein synthesis, metabolism, proliferation, cell survival, and autophagy[26‐27]. It can be inferred from the results of this study that the mTOR pathway may be involved in the damage of high glucose to RPE cells. We further investigated the molecular mechanism by which high glucose activates autophagy and found that the expression of p‐mTOR was significantly decreased and 3‐MA up‐regulated its expression under high glucose conditions.
Collectively, we observed that down‐regulation of mTOR activity under high glucose conditions was accompanied by autophagy activation and damage to ARPE‐19 cells.Furthermore, autophagy inhibitor, 3‐MA, demonstrated a protective effect on ARPE‐19 cells under high glucose conditions. Therefore, the down‐regulation of mTOR activity by hyperglycemia may be related to autophagy‐induced death of RPE cells in DR. These findings may have an impact on the development of mTOR based therapies, so as to control autophagy‐related cell death in early DR. However, the results of cell experiments cannot fully reflect the situation of DRin vivo, and the role of autophagy dysregulation in DR needs to be further studied using animal models and human tissue samples.
ACKNOWLEDGEMENTS
Foundations:Supported by National Natural Science Foundation of China (No.82070973); Key Research and Development Plan of Shaanxi Province (No.2021SF‐157).
Conflicts of Interest: Zhang Q,None;Li HS,None;Li R,
None;Du JH,None;Jiao C,None.
 International Journal of Ophthalmology2021年6期
- International Journal of Ophthalmology的其它文章
- A decrease in macular microvascular perfusion after retinal detachment repair with silicone oil
- Evaluation of retinal and choroidal changes in patients with Alzheimer’s type dementia using optical coherence tomography angiography
- Dr. Father Wacław Szuniewicz, a forgotten pioneer in refractive surgery and his work in China
- Deterioration of Avellino corneal dystrophy in a Chinese family after LASlK
- A mutated CRYGD associated with congenital coralliform cataracts in two Chinese pedigrees
- Reliability of Chinese web-based ocular surface disease index questionnaire in dry eye patients: a randomized,crossover study