
Correlation of the retinopathy degree with the change of ocular surface and corneal nerve in patients with type 2 diabetes mellitus
2021-05-15 02:50JiaXinHanHeWangHuanHuanLiangJianXinGuo
Jia-Xin Han, He Wang, Huan-Huan Liang, Jian-Xin Guo
1Xuzhou Medical University, Xuzhou 221002, Jiangsu Province, China
2Department of Ophthalmology, Affiliated Hospital of Xuzhou Medical University, Xuzhou 221002, Jiangsu Province, China
Abstract
● KEYWORDS: type 2 diabetes; retinopathy; ocular surface; corneal nerve; in vivo confocal microscopy
INTRODUCTION
T he World Health Organization (WHO) defines diabetes mellitus (DM) as a chronic disease that occurs when the pancreas does not produce enough insulin, or when the body cannot effectively use the insulin it produces[1]. According to the International Diabetes Federation (IDF), there were approximately 463 million DM sufferers in 2019, and it is estimated that 578 million adults will have diabetes by 2030,and 700 million by 2045[2]. The global prevalence of diabetic retinopathy (DR) among diabetics is about 34.6% (93 million people), of which the prevalence of vision-threatening DR is about 10.2% of the population (28 million people)[3]. If a diabetic patient does not have retinopathy, studies suggest that the risk of developing new retinopathy ranges between 5% and 10% annually[4]. Several factors including age, duration of DM,glycemic, and lipidemic profiles have been associated with the onset and progression of DR[5]. DM can cause a variety of ocular complications, affecting retina, anterior segment,especially the ocular surface and cornea. According to relevant studies, when in a diabetic state, superoxide accumulation leads to the activation of the polyol pathway, the accumulation of late glycosylation end products, protein kinase C activation and increased hexosamine flux, thus resulting in damage to the ocular surface and corneal nerves, including decreased tear film stability, corneal nerve fiber length (CNFL) and corneal nerve fiber density (CNFD)[6-9]. Factors which lower the risk of disease progression in diabetic patients include optimal blood glucose and blood pressure control beside regular ocular examinations and prompt laser treatment of macular edema as well as proliferative retinopathy[4].
In this study, different DR levels were grouped into groups and control subjects were selected. Through the Ocular Surface Disease Index (OSDI) questionnaire and clinical examination of the ocular surface and corneal nerve, the differences between the ocular surface and corneal nerve were analyzed,and the damage to the ocular surface and corneal nerve caused by DM was assessed. The relationship between the degree and the extent of DR was explored. This study is expected to provide some assistance in the diagnosis and treatment of ocular surface and corneal neuropathy in clinical diabetic patients.
SUBJECTS AND METHORDS
Ethical ApprovalThe study was approved by the Ethics Committee of Xuzhou Medical University (No.XYFY2018-KL033-01) and registered with the China Clinical Trials Registry (No.ChiCTR1900021243). In compliance with the Declaration of Helsinki, all subjects signed informed consent.
SubjectsA total of 129 type 2 DM patients (257 eyes)who visited Xuzhou Medical University Hospital between 2019-06 and 2020-08 were enrolled. All subjects accepted the dry eye analyzer and thein vivoconfocal microscopy(IVCM) examination, and then performed post-dilated fundus examination and fundus fluorescence angiography (FFA).The diagnosis of DR was based on FFA and was consistent with the staging criteria in the 2019 US DR Clinical Practice Guidelines[3]. According to the degree of retinopathy, subjects were divided into no diabetic retinopathy (NDR) group: 33 cases (66 eyes); non-proliferative diabetic retinopathy (NPDR)group: 32 cases (64 eyes); proliferative diabetic retinopathy(PDR) group: 34 cases (67 eyes). Healthy normal individuals(30 cases, 60 eyes) were screened as the control group (Table 1).
Inclusion criteria1) Diabetic group: Type 2 DM diagnostic criteria refer to the 2017 American Diabetes Association (ADA)proposed diagnostic criteria: typical diabetes symptoms(polyphagia, polyuria, polyphagia, weight loss), random glucose test ≥11.1 mmol/L or fasting glucose test ≥7.0 mmol/L or 2h postoral glucose tolerance test ≥11.1 mmol /L (all of the above refer to venous plasma glucose levels)[10]. No other systemic diseases. 2) Normal control group: normal subjects without DM.
Exclusion criteria1) Patients who have used any ocular topical medications within the past 3mo; 2) Patients with the history of ocular laser therapy and ocular surgery; 3) Patients with the history of ocular trauma; 4) Patients with the past history of wearing contact lenses; 5) Patients with ocular inflammation, pterygium, glaucoma, corneal dystrophy andother ocular diseases; 6) Patients with diseases that affect fundus examination (such as heavy clouding of the lens and vitreous,etc.); 7) Patients with systemic diseases (such as hypertension, and hyperlipidemia, systemic immune system diseases, connective tissue diseases,etc.) .

Table 1 Basic information of each group
Methods
Ocular surface disease indexThe OSDI questionnaire was completed independently by all subjects, and administered by the same physician. The questionnaire consists of three subscales and 12 questions: ocular symptoms, which include grittiness or pain; visual function, which measures performance limitations of common activities such as reading and watching TV; and environmental triggers, which assesses the impact of environmental triggers such as wind or drafts on dry eye symptoms[11]. The questions are asked with reference to a oneweek recall period. The OSDI score =(25×total score)/number of questions answered, and subscale scores are computed similarly. The higher the score, the more severe the ocular surface symptoms[12-13].
Dry eye analyzerBy using the dry eye analyzer (DED-1L,KangHua, China), different modes were selected and tested: 1)Tear meniscus height (TMH): TMH was measured vertically from the middle of the cornea, just below the lid margin, to the upper visible tear using the measurement tool provided in the measurement software of the machine; 2) The non-invasive tear film break-up time (BUT) was recorded as first tear breakup time (FTBUT) and average tear break-up time (ATBUT)based on the principle that the circle projected by Placido’s ring on the cornea appears to be fissured when the tear film breaks up; 3) Lipid layer analysis: The software provided 7 levels of contrast templates that were compared on the basis of different lipid layer colors; 4 levels are critical, 5-7 levels are lipofuscin, and 1-3 levels are thin lipid layers; 4) Meibomian gland analysis: All subject’s lid margin was turned over, and infrared camera technology was applied to form a direct image of the meibomian glands, using enhanced contrast mode to observe the absence of the glands. The degree of meibomian glands loss (MGL) in each eyelid was scored as meiboscore based on the following criteria: grade 0 (no loss of meibomianglands); grade 1 (<1/3 loss of the total area of meibomian glands); grade 2 (between 1/3 and 2/3 loss of total area of meibomian glands); grade 3 (>2/3 loss of the total area of meibomian glands). The upper and lower eyelid scores were added up to a total score of 0 to 6 for each eye[14-15].
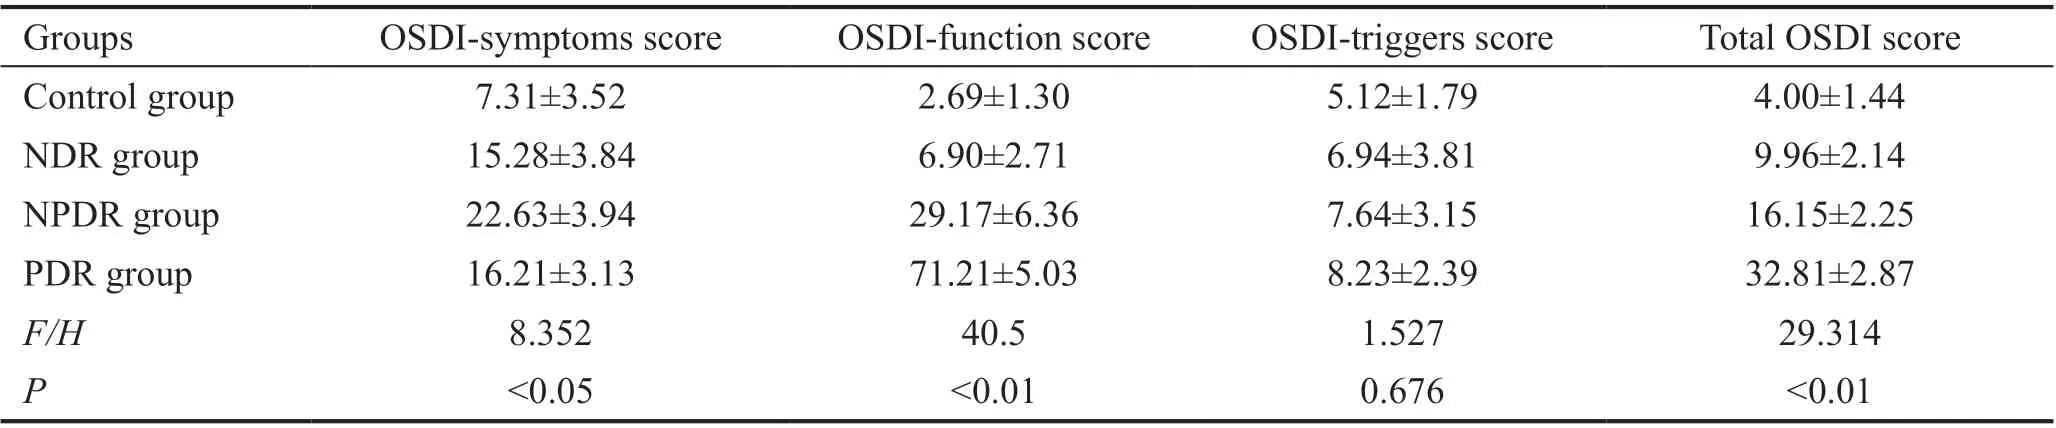
Table 2 OSDI subscale score and total score mean±SD
In vivoconfocal microscopyAll study subjects underwent examination with the IVCM (HRT II, Heidelberg, Germany).The scanning area was the epithelial subbasal nerve plexus of the corneal pupil region, and the scanning depth was about 30-90 μm. Three clear images from different locations were selected for each eye, and the acquired images were analyzed using Image J image analysis software. Quantitative observations were made using a semi-automated neural tracking system (Neuron J) plug-in, and an average of 3 image data was taken. Analysis of recording parameters: 1) CNFD:described as the total number of nerve fibers observed within a frame (/mm2); 2) corneal nerve branch density (CNBD):described as the total number of nerve branches, emanating from major nerve trunks, per square millimeter of corneal tissue (/mm2); 3) CNFL: characterized as the total length of nerve fibers and branches within a frame (mm/mm2); 4)corneal nerve fiber tortuosity (CNFT): the degree of nerve fiber tortuosity in the image, divided into 0-4 grades. The higher the grade, the greater the degree of tortuosity[16-17].
Statistical AnalysisPASS (version 16.0 for Windows; NCSS LLC, Kaysville, Utah, USA) was applied to calculate the sample size, the test level was set to 0.05, the test efficiency was 0.9, and the statistical method was set as the analysis of variance of multi-group mean comparison. The sample size required for calculation was at least 42 eyes in each group,and at least 60 eyes in each group in this study, so it met the requirements of sample size calculation. Data analysis was conducted using the Statistical Product and Service Solutions(version 26.0 for Windows; SPSS Inc., Chicago, Ill., USA).The gender differences were analyzed by Chi-square test.Kolmogorov-Smirnov test confirmed that the data profile of the continuous variables was normally distributed and expressed as mean±standard deviation (SD). The data profile of the continuous variables was also certified by conducting Kolmogorov-Smirnov test. The significance of the differences among groups was tested by using one-way analysis of variance (ANOVA), and comparisons between two groups were made using LSD test or the Tamhane T2 test. Data for grade variables was presented as median (Q1, Q3); Kruskal-WallisHtest was used for more than two independent samples and for comparisons among groups. Data which are not normal distribution was performed using non-parametric tests. Two variables were continuous and normally distributed, Pearson’s correlation analysis was conducted for correlation analysis.Spearman’s correlation analysis was used if one of the two variables was a ranked variable.P<0.05 indicated a statistically significant difference.
RESULTS
Ocular Surface Disease IndexThe results showed that there were statistically significant differences in the ocular symptom OSDI score, visual function OSDI score, and total OSDI score in the four groups (HOSDI-symptomsscore=8.352,POSDI-symptomsscore<0.05;HOSDI-functionscore=40.5,POSDI-functionscore<0.01;FtotalOSDIscore=29.314,PtotalOSDIscore<0.01). There was no statistically significant difference in the environmental trigger OSDI score among the four groups (HOSDI-triggerscore=1.527,POSDI-triggerscore>0.05).Further comparison of the groups showed no statistically significant difference in the ocular symptom OSDI score in the groups (P>0.05), except in the NPDR and the normal control groups (P<0.05). Regarding the visual function OSDI score,the groups showed no significant difference (P>0.05), except the PDR and control groups (P<0.05) and the PDR and NDR groups (P<0.05). Regarding the total OSDI score, the groups showed a significant difference (P<0.05), except the NDR and NPDR groups (P>0.05) and the NDR and control groups(P>0.05). The OSDI score increased with the progression of DR. The symptoms of ocular surface discomfort were progressively worse in diabetics (Table 2).
Comparison of Dry Eye Analyzer Results
Tear meniscus heightAmong the four groups, the difference in TMH was statistically significant (F=6.530,P<0.01).Comparing TMH among the four groups, there was no statistically significant difference (P>0.05) in the four groups apart from PDR groupvsNDR group (P<0.05) and PDR groupvscontrol group (P<0.05), and the TMH decreased as the degree of DR increased (Table 3, Figure 1).

Figure 1 Tear meniscus height A: Control group, 0.43 mm; B: No diabetic retinopathy group, 0.21 mm; C: No proliferative diabetic retinopathy group, 0.17 mm; D: Proliferative diabetic retinopathy group, 0.11 mm.
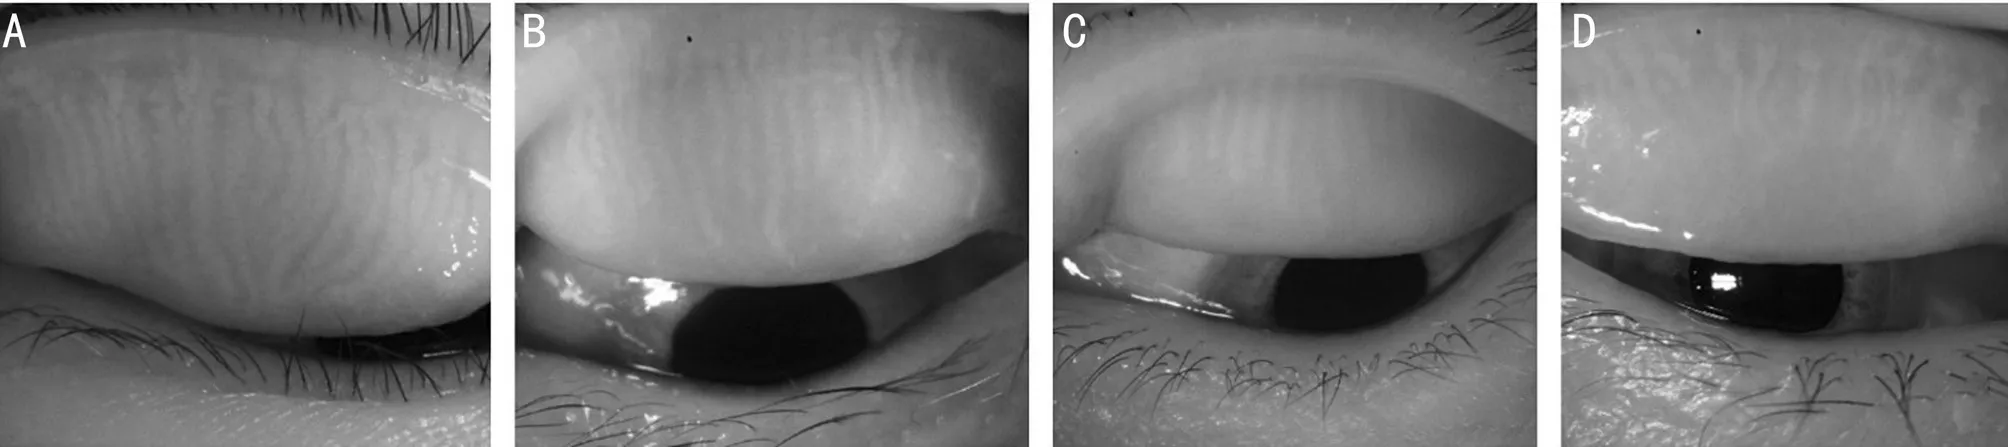
Figure 2 Infrared meibography of the upper eyelids were performed by dry eye analyzer A: Healthy control group; B: No diabetic retinopathy group; C: No proliferative diabetic retinopathy group; D: Proliferative diabetic retinopathy group. With the progress of diabetic retinopathy,the Meibomian glands are shortened, the arrangement is sparse, the glands are twisted and deformed, and the loss of the meibomian glands increases.
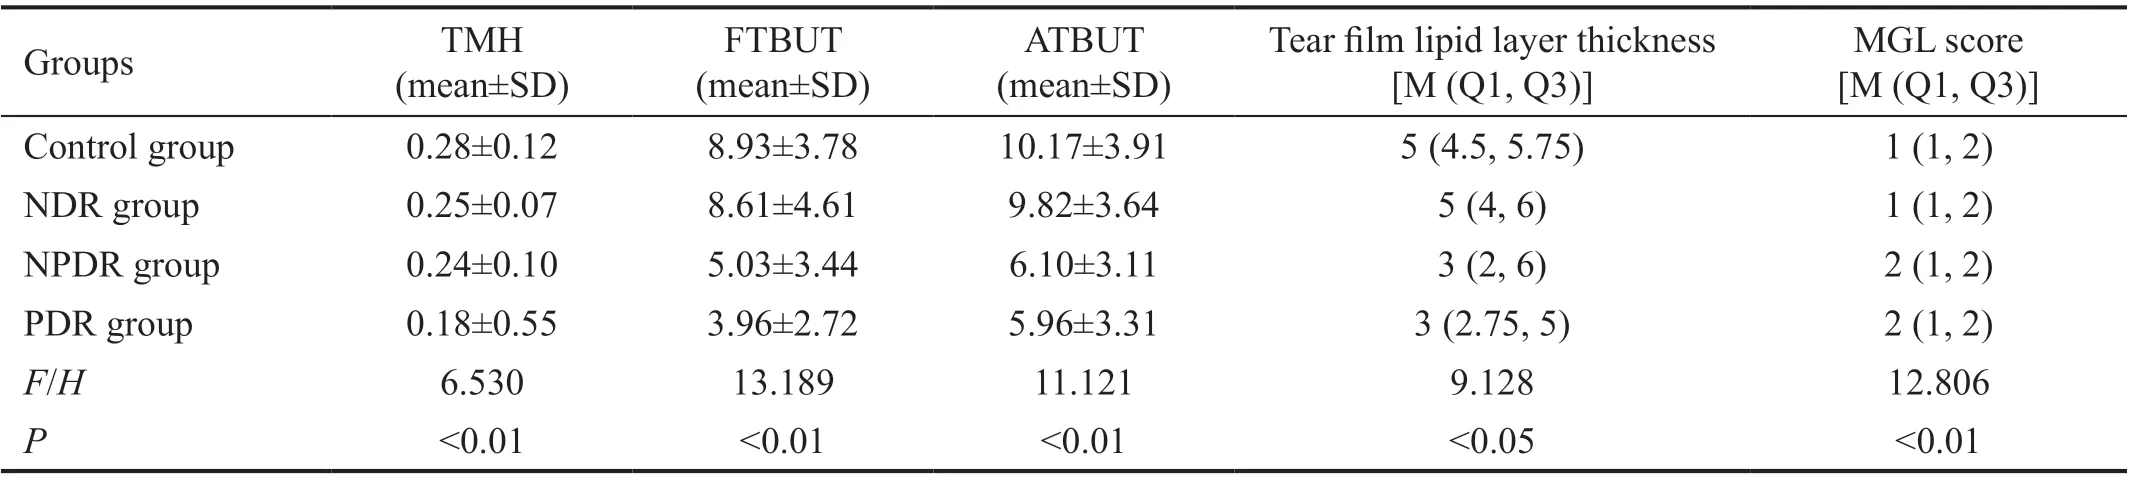
Table 3 Comparison of relevant parameters of dry eye analyzer
Non-invasive tear break-up timeThe differences between the FTBUT and the ATBUT of the four groups were all statistically significant (FFTBUT=13.189,PFTBUT<0.01;FATBUT=11.121,PATBUT<0.01). There were no statistically significant differences between PDR and NPDR groups(PFTBUT>0.05;PATBUT>0.05) and between NDR and control groups (PFTBUT>0.05;PATBUT>0.05), except that there were statistically significant differences among other groups.FTBUT and ATBUT had the same change, which showed a decreasing trend between the two groups. The results indicated that, with the progression of DR, the tear film in diabetic patients became more unstable, and the tear film damage increased (Table 3).
Grading of tear film lipid layer thicknessThe differences in the lipid layer thickness of tear film among the four groups were statistically significant (H=9.128,P<0.05). By further comparison of the groups, it was obvious that there were no statistically significant differences among the groups (P>0.05)except for PDR groupvsNDR group (P<0.05) and PDR groupvscontrol group (P<0.05; Table 3).
Meibomian gland loss scoreThe differences in the MGL score of the four groups were statistically significant(H=12.806,P<0.01), and further comparison of the groups displayed that there were no statistical differences among the groups, except for PDR groupvscontrol group (P<0.01;Table 3, Figure 2).
Comparison of Results of IVCM-Related Parameters
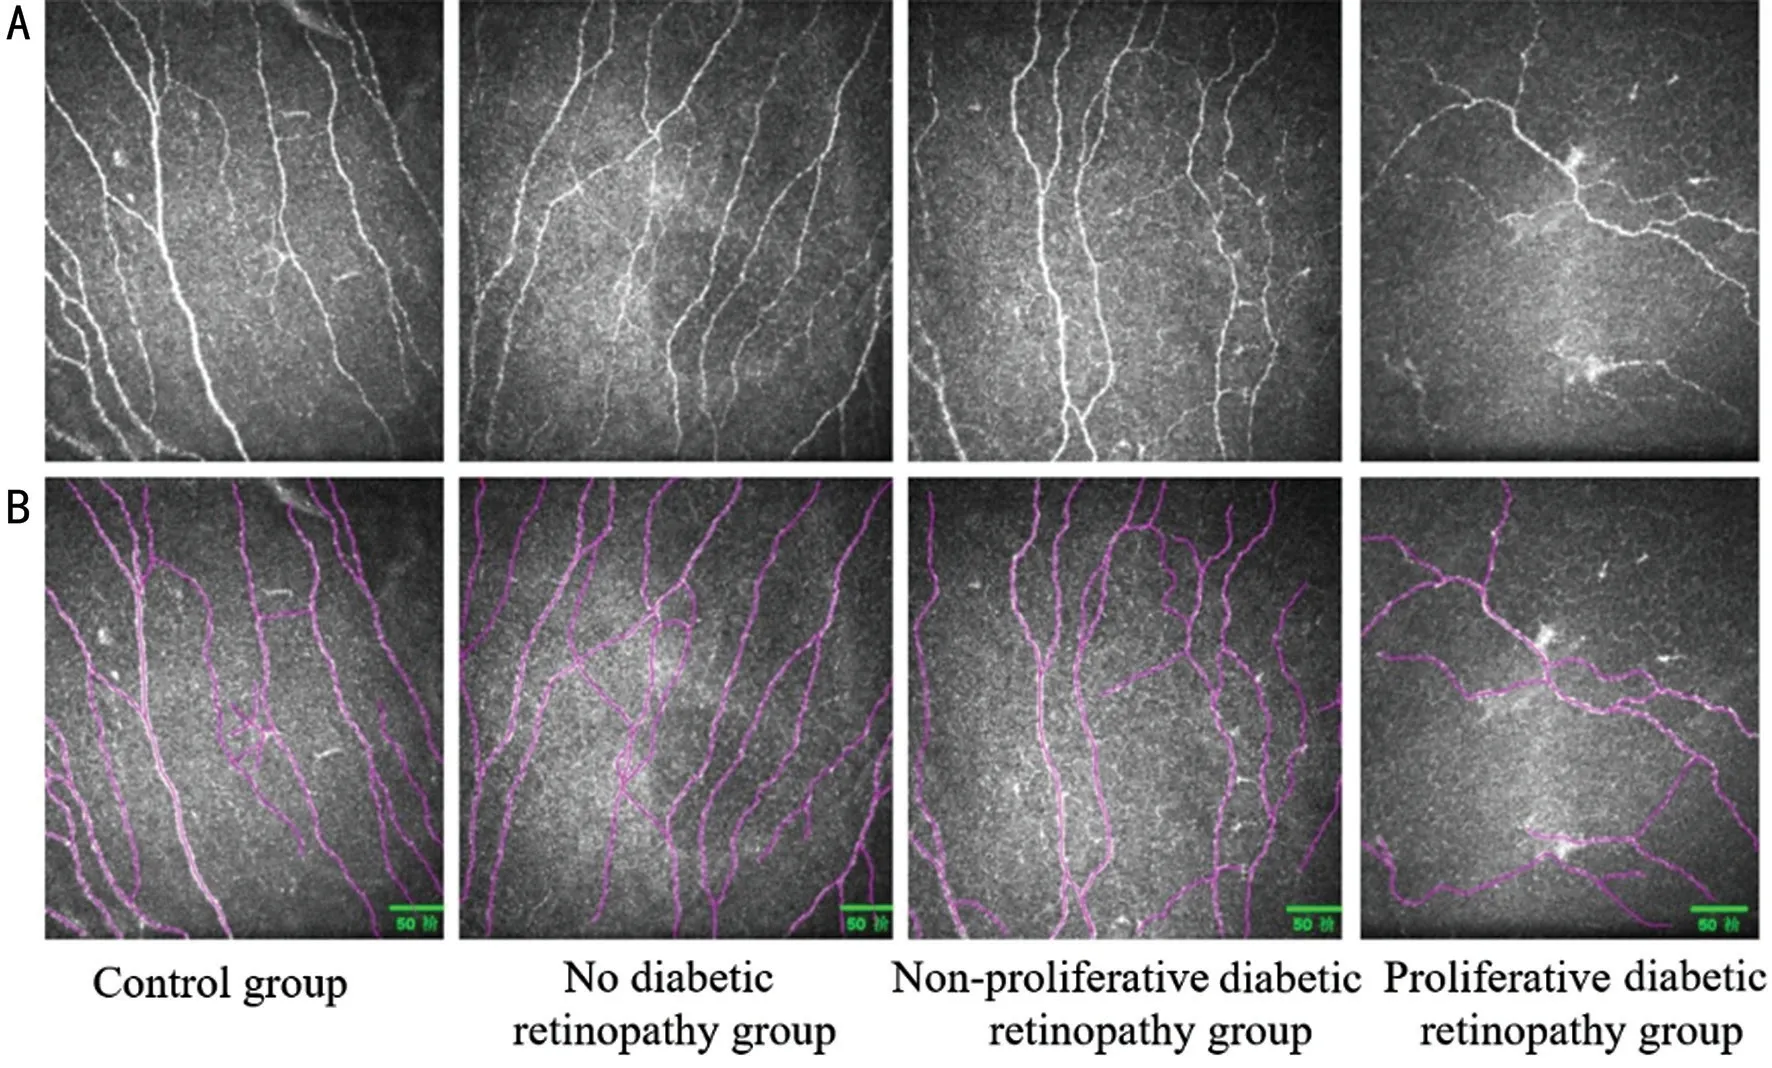
Figure 3 Corneal subbasal nerve plexus analysis A: The original image of corneal subbasal nerve plexus morphology; B: Nerves detected with the Image J image analysis software and Neuron J are shown in purple. With the gradual aggravation of diabetic retinopathy, the number and density of corneal nerve fibers decrease, and the nerve fibers becomes deform and irregular.
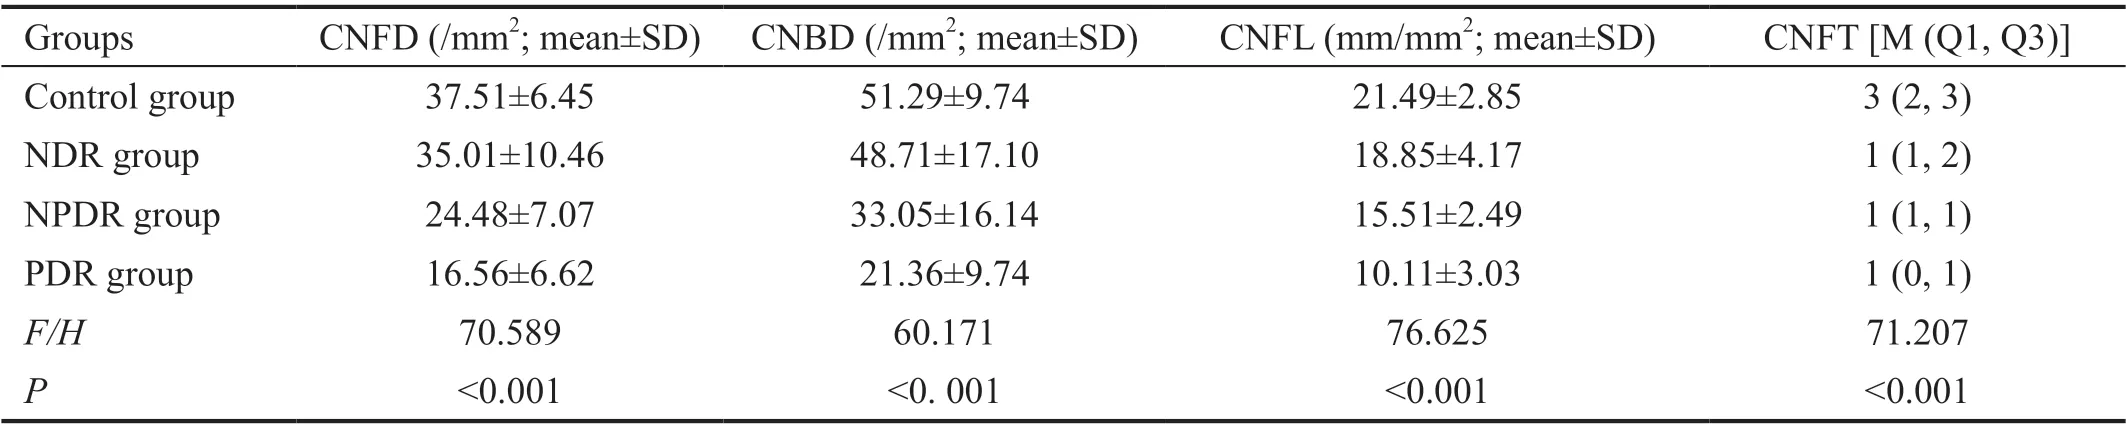
Table 4 Comparison of IVCM parameters
Corneal nerve fiber density and corneal nerve branch densityThere were statistically significant differences in CNFD and CNBD among the four groups of subjects(HCNFD=70.589,PCNFD<0.001;HCNBD=60.171,PCNBD<0.001).Comparisons between two groups revealed that the differences were statistically significant (P<0.05), except for the comparison between the NDR group and the control group(P>0.05). According to the mean between groups, CNBD and CNFD exhibited a decreasing trend with the progression of diabetic retinopathy (Table 4).
Corneal nerve fiber lengthThe CNFL was statistically different among the four groups (F=76.625,P<0.001). When the CNFL of the four groups were compared, the differences were statistically significant (P<0.05) except for NPDR groupvsPDR group (P>0.05). The above results proved that as the degree of DR increased, the CNFL decreased accordingly(Table 4).
Corneal nerve fiber tortuosityThe difference in CNFT among the four groups was statistically significant (H=71.207,P<0.001). Further comparison of each group revealed that the differences were statistically significant (P>0.05) except for NPDR groupvsPDR group (P>0.05) and NDR groupvscontrol group (P>0.05), and the CNFT increased with the progression of DR (Table 4, Figure 3).
Correlation of CNFL with Total OSDI Score and Dry Eye Analyzer ParametersThe results revealed that there was no correlation between CNFL and OSDI score, TMH, ATBUT,lipid layer thickness and MGL scorein normal control subjects(rCNFL/totalOSDIscore=0.113,P=0.574;rCNFL/TMH=0.262,P=0.368;rCNFL/ATBUT=0.2,P=0.373;rCNFL/lipidlayerthickness=0.004,P=0.984;rCNFL/MGLscore=-0.135,P=0.538). In NDR group, CNFL was positively correlated with TMH (r=0.493,P<0.01), ATBUT(r=0.437,P<0.05), no correlation with OSDI score (r=0.139,P=0.516), no correlation with tear film lipid layer thickness(r=0.148,P=0.389), and no correlation with MGL score (r=-0.151,P=0.482). In NPDR group, CNFL was positively correlated with TMH (r=0.642,P<0.01), ATBUT (r=0.6,P<0.01), OSDI score (r=-0.238,P=0.262), and with tear film lipid layer, and there was no correlation between thickness(r=0.107,P=0.619) and MGL score (r=-0.161,P=0.453). In PDR group, CNFL showed a low positive correlation with TMH (r=0.364,P<0.05), a low negative correlation with MGL score (r=-0.331,P<0.05), a positive correlation with ATBUT(r=0.589,P<0.01), and no correlation with OSDI score (r=-0.086,P=0.703), which did not correlate with the thickness of the lipid layer of the tear flim (r=0.168,P=0.276).
DISCUSSION
DM can lead to various ocular complications, of which ocular surface complications are very common and include dry eye,corneal erosions, persistent epithelial defects, and even visionthreatening corneal ulcers. The ocular surface is the mucosal epithelium on the surface of the eye between the gray line of the upper and lower lid margins, including corneal epithelium,corneal rim epithelium, and conjunctival epithelium[18]. The cornea is rich in nerve endings that come from the first main branch of the trigeminal nerve[19]. Sternet al[20]defined the concept of the functional unit of the lacrimal gland as a complex, stable system of lacrimal glands, ocular surfaces(cornea, conjunctiva and palpebral glands) and eyelids, and the sensory and motor nerves that connect them, which are anatomically continuous and share a common feedback mechanism. In this study, it was discovered that TMH, BUT,tear film lipid layer thickness, CNFL, CNFD, and CNBD in the three groups of diabetic patients were significantly lower than those in the control group, while the total OSDI score,MGL score, and CNFT were significantly lower than these in the control group. With the progress of DR, TMH, BUT, tear film lipid layer thickness, CNFL, CNFD, and CNBD gradually decreased, and total OSDI score, MGL score, CNFT increased.CNFL in diabetic patients was correlated with TMH and ATBUT, but the total OSDI score had no correlation with tear film lipid layer thickness.
In this study, according to the OSDI score, the higher the degree of retinopathy is, the greater the ocular surface discomfort is. In our study, it was clear that subjects in NDR and NPDR groups complained of significant ocular surface discomfort in windy or dry conditions, while subjects in PDR group complained of poor vision and limited reading. This may be due to that the early DR corneal nerve damage is less severe[21-22], and the corneal sensitivity decline less and can feel external stimuli. DR early tear film instability has appeared[23-24], so the subjects without DR group and NPDR group mostly complain that ocular surface discomfort in a windy or dry environment is obvious. In PDR group, DR is more severe such as vitreous hemorrhage, vision loss and the corneal nerve damage are obvious, and perception is reduced, so most of them complain of poor vision and limited reading[25-27]. For diabetic patients complaining of dry eyes or decreased vision, ophthalmologic fundus examination should be performed promptly.
The present study was conducted by using a dry eye analyzer to collect relevant parameters from the ocular surface in terms of function and morphology. According to the findings, with the progression of DR, TMH, BUT, and tear film lipid layer thickness gradually decreased, and MGL score increased,with the results being similar to other studies[14,28-31]. The decrease in TMH may be partly due to decreased corneal and conjunctival sensitivity in diabetic patients and partly due to impaired function of the tear gland microvasculature[30]. The decrease in tear BUT may be due to the prolonged state of hyperglycemia levels as well as tear hypertonicity in diabetic patients, with high expression of inflammation-related cytokines, which activates inflammatory signaling pathways and promotes the development of immune inflammation and apoptosis, thus leading to a decrease in cup cell density and mucin and in turn a decrease of the stability of the tear film.The decrease in the thickness of the lipid layer of the tear film may be due to a decrease in lipid secretion as a result of insulin resistance/deficiency and hyperglycemia damage to human palpebral gland epithelium[32]. In the animal model,Yıldızet al[33]observed that the meibomian gland genes of type 2 DM mice were changed compared with the healthy group. In type 2 DM mice, the up-regulated genes were mainly related to fatty acid metabolism, inflammation and apoptosis,and the downregulated genes were mainly related to cell growth and differentiation. The difference of tear film lipid layer thickness between PDR group and control group was statistically significant. This may be due to the lack of specific quantification in terms of the meibomian gland structure and function, which is also the limitation of this project. The abnormal tear film is an important feature of diabetic ocular surface diseases, which also suggests that, in addition to the changes of the fundus in clinical work, doctors should pay attention to the changes of the ocular surface.
This study quantified corneal neuromorphometric parameters by corneal confocal microscopy and Image J. Nitodaet al[5]believed that alterations in the corneal subbasal nerve plexus in DM are related to DR stage. It appears that, as the retinal status deteriorates, the alterations observed in confocal microscopic images that are obtained from the corneal subbasal nerve plexus of diabetic patients become more prominent. Similarly,this study revealed that CNFL, CNFD, and CNBD were found to decrease with the increase of DR duration, and CNFT increased with the increase of DR duration. Although CNFL,CNFD, and CNBD decreased in DR patients and increased in CNFT compared with controls, the difference between the nonproliferative phase of diabetic retinopathy and the proliferative phase was not statistically significant, which may be due to the fact that this experiment did not distinguish among the mild, moderate, and severe non-proliferative phases. Some studies divided the non-proliferative phase into mild and moderate non-proliferative phase (mNPDR) and severe nonproliferative phase (sNPDR) and illustrated that corneal nerve loss was more severe in sNPDR phase than that in mNPDR phase. Still, there was no significant difference between sNPDR and PDR groups[17]. Similar to the study by Bitirgenet al[21], it was obvious that CNFL had been reduced even in the absence of DR and was statistically different from normal controls, suggesting that corneal neuropathy may be an early and sensitive indicator of diabetic visual complications[34].The loss of corneal nerves may be due to metabolic and vascular disturbances, thus leading to impaired neurological function and the loss of neurotrophic support, which in the long run can mediate apoptosis of glial cells of the peripheral nervous system, neurons and Schwann cells[35]. Through the study, it was clear that nerve fiber loss will develop with the progression of DR. If the refractive stroma is unclear or the fundus examination is difficult, IVCM quantification of the corneal nerve can also predict the severity of the diabetic disease. In conclusion, we believe that the corneal nerve fibers of type 2 DM patients are damaged, and the occurrence is earlier than DR, which is related to the degree of DR and can provide guidance for the diagnosis and treatment of DR.
In the study of the correlation between the ocular surface and corneal nerve-related parameters, except for the control group,CNFL and TMH were correlated in other groups. We consider the change of corneal peripheral nerve mainly through two aspects: On the one hand, the decrease of CNFD and CNFL leads to the decrease of corneal sensitivity, the decrease of blink frequency and the excessive evaporation of tear. On the other hand, a decrease in lacrimal gland innervation for autonomic neuropathy and a decrease in corneal perceptual ability on lacrimal gland stimulation cause inadequate tear secretion[8,23,36]. This study proved that except for the control group, other groups of CNFL and ATBUT were correlated.The decrease of tear film stability and tear rupture time may be due to the decrease of mucin produced by goblet cells, and the decrease of corneal innervation could lead to the decrease of goblet cell function[8,37]. However, there was no significant correlation between CNFL and OSDI score or tear film lipid layer thickness. No correlation in any of the groups was found except for the PDR group, which showed a low positive correlation with palpebral gland deficiency score.
Dry eye analyzer and IVCM can directly observe the changes of the shape and structure of ocular surface and cornea,which include various advantages, including objectiveness,non-invasiveness, and good comfort. They are conducive to understand the shifts in the structure and pathophysiological functions of living cornea and ocular surface, and can provide basis for disease diagnosis, treatment, and efficacy judgment.This study remains some shortcomings. First, the tear film lipid layer thickness is only graded without quantitative measurement. Subsequently, Lipiview interferometer can be applied to quantitatively measure the tear film lipid layer[38].Second, only in diabetes, THM was measured in patients, and the tear film thickness was not explored. In the future, the tear film thickness can be measured when combined with optical coherence tomography and the correlation between the two can be investigated[39]. Third, this study marks a cross-sectional study, thus involving certain limitations. Further longitudinal follow-up studies are required to dynamically observe the changes of ocular surface. Fourth, HRT series IVCM is adopted in this study to observe the SBP morphology of central cornea,and image analysis software of Image J was applied to analyze the images. However, the international evaluation of corneal nerves still lacks a unified quantification standard, with poor repeatability of IVCM. The inability to automatically analyze images need to be further resolved as well. If fundamental social and political changes are available, the prevention of diabetes would be the best approach to prevent DR[4]. In recent years, the mechanism of how diabetes causes ocular surface diseases has become a hot spot in scientific research,while its pathogenesis is numerous and complex. They do not act independently but are closely related to each other. With the gradual deepening of research on diabetic ocular surface diseases, it is believed that, in the near future, we will have clearer understanding about diabetic ocular surface diseases, so as to prevent them at pathogenesis level.
ACKNOWLEDGEMENTS
Conflicts of Interest: Han JX,None;Wang H,None;Liang HH,None;Guo JX,None.
 International Journal of Ophthalmology2021年5期
- International Journal of Ophthalmology的其它文章
- Comprehensive evaluation of intravitreal conbercept versus half-dose photodynamic therapy for chronic central serous chorioretinopathy
- Lipid accumulation and protein modifications of Bruch’s membrane in age-related macular degeneration
- Via pars plana anterior iris enclavation lOL fixation
- Role of microRNA-25 in high glucose cultured Müller glia
- Protective effects of piperine on the retina of mice with streptozotocin-induced diabetes by suppressing HlF-1/VEGFA pathway and promoting PEDF expression
- Expression levels of pro-inflammatory interleukin-8 and certain antimicrobial peptides in concurrent with bacterial conjunctivitis