
Applications of the isolated-check visual evoked potential in primary open angle glaucoma with or without high myopia
2021-05-15 02:50XiaWangRuoShiLiYaHuiWeiYuanFangTianTianMeiLiYingZiPan
Xia Wang, Ruo-Shi Li, Ya-Hui Wei, Yuan Fang, Tian Tian, Mei Li, Ying-Zi Pan
Department of Ophthalmology, Peking University First Hospital, Beijing 100034, China
Abstract
● KEYWORDS: primary openangle glaucoma; high myopia; isolated check; visual evoked potential; diagnosis
INTRODUCTION
High myopia (HM) is thought to be closely related to the onset of primary open angle glaucoma (POAG)[1-4],which is one of the leading causes of irreversible blindness worldwide. The incidence of POAG has been reported to increase with the axial length (AL)[2,5]. However, in populations with HM, the variations in structure caused by axial enlargement, such as optic disc tilt, torsion, atrophic arc and reduction of the retinal nerve fiber layer (RNFL)thickness, makes it challenging to diagnose POAG with structural indicators[3,6-8]. Further, false positives may occur in the visual field (VF) test due to retinal atrophy[3]and artifacts of optical correction in highly myopic eyes[9-10]. All these factors might cause overdiagnosis of glaucoma for eyes with HM. In addition to VF, visual electrophysiological tests,such as pattern electroretinograms (PERGs) and multifocal visual evoked potentials (mfVEPs), have been demonstrated to be capable of detecting glaucomatous visual function damage[11-15], but none have been clinically accepted as a routine examination for glaucoma, potentially due to the fact that they are time consuming and difficult to perform well[16-19].Recently, isolated-check visual evoked potential (icVEP), a new VEP examination, has emerged and is thought to be less time consuming and easier to perform[20].
There are mainly two types of cells in human retinal ganglion cells (RGCs), magnocellular (M) cells and parvocellular (P)cells, which correspond to two different parallel pathways in the brain[21-22]. The M pathway transmits information at a low spatial/high temporal frequency, while the P pathway conveys high spatial/low temporal frequency information[23]. Some studies demonstrated that the M pathway is more susceptible to damage in the early stage of glaucoma[21-22,24-27], but this hypothesis is controversial[28-29]. The icVEP was reported to be able to specifically examine the function of the M pathway by providing a low spatial/high temporal frequency stimulation and may therefore provide a basis for the diagnosis of glaucoma[20-22,24-26]. Previous studies showed that the signalto-noise ratio (SNR) from icVEP devices (such as EvokDx and Neucodia) had diagnostic potential for POAG, with sensitivities and specificities of 53.1%-83% and 84.6%-100%,respectively[20,30-35]; however, all of these study subjects were limited to non-highly myopic populations.
In this study, we used a new device to assess the icVEP in POAG patients both with and without HM and compared the diagnostic efficacy of the SNR from icVEP with those of parameters assessed by optical coherence tomography (OCT)and Heidelberg retinal tomography (HRT).
SUBJECTS AND METHODS
Ethical ApprovalThis cross-sectional study was approved by the Ethics Committee of Peking University First Hospital and was performed in accordance with the Helsinki declaration. All participants signed a consent form prior to participation.
Participants and CriteriaAll participants were recruited from the Department of Ophthalmology at Peking University First Hospital from November 2017 to December 2019.POAG patients were consecutively recruited and must meet the following criteria: typical glaucomatous optic disc appearance (C/D >0.6 or intereye cup asymmetry >0.2, and other typical features such as rim notching, thinning or disc hemorrhage) with a corresponding peripapillary RNFL defect on stereoscopic fundus photographs; and at least 2 consecutive reliable VF examinations that reveal repeatable glaucomatous VF defects and open angle on gonioscopy. Age-matched control subjects were recruited from the physical examination population, and those with an intraocular pressure (IOP) of≤21 mm Hg, cup to disc ratio <0.6, normal VF results and no family history of glaucoma were included. HM was defined as an AL of ≥26.5 mm[33]. According to the AL, the POAG participants were divided into a highly myopic POAG group(HM-POAG) and a non-highly myopic POAG group (NHMPOAG), and the control subjects were divided into a high myopia group (HM) and a non-high myopia group (Normal).The exclusion criteria were as follows: best corrected visual acuity (BCVA) of less than 20/40; poor fixation; a pupil diameter of less than 2 mm (measured under bright indoor light); retinal diseases (such as diabetic retinopathy, macular edema, or other vitreoretinal abnormality); optic nerve diseases other than glaucomatous optic nerve atrophy; a history of ocular trauma and intraocular surgery; congenital or secondary glaucoma (such as uveitis and the use of corticosteroids);opacity of refractive media, which may affect the structure examination; and intracranial disease or other systemic diseases that may affect the VF test results.HM control subjects were all bilateral. One eye of each subject was randomly selected to be enrolled. In unilateral glaucoma subjects, the affected eye was selected. For each subject, all the data were collected within 2mo.
Eye ExaminationsAll the subjects underwent a complete ophthalmic examination, including a subjective refraction,an IOP examination by Goldmann applanation tonometry on the day after receiving VF and icVEP examination, slit lamp biomicroscopy, gonioscopy, stereoscopic fundus photography(CR-2, AF Digital Non-Mydriatic Retinal Camera, Canon Inc.,Tokyo, Japan), and AL measurement (IOL Master, Carl Zeiss,Co., Ltd., Dublin, CA, USA); the mean value was calculated after 5 repeated measurements, and a central corneal thickness(CCT) measurement (ultrasound pachymetry, US-500, Ninek,Co., Ltd., Japan) under topical anesthesia and the average of five consecutive readings were recorded.
Visual field testingThe Humphrey perimetry (Humphrey Field Analyzer model 750i, Carl Zeiss Meditec, Inc., Dublin,CA, USA) Swedish Interactive Threshold Algorithm standard(SITA) 24-2 FAST procedure was used. Glaucomatous VF defects were defined as conditions meeting the following criteria: glaucoma hemifield test (GHT) results showing“outside normal limits”; a normal probability of <5% in at least three nonedge cluster points on the pattern deviation probability plots, of which at least one point has aP<0.01;andP<0.05 for the pattern standard deviation (PSD) analysis.Normal VF results were determined as GHT results “within normal limits” with a mean deviation (MD) and PSD within the 95% range of the healthy population. A reliable VF output was defined as fixation loss and false-positive and falsenegative error values of less than 20%.
To analyze the correlation of visual function tested by icVEP and VF, the central 10° VF was further defined. The central 16 points on the 24-2 VF test represented the central 10° of the VF[36]. An “abnormal” central 10° VF was defined as a cluster of at least three contiguous points among the 16 points around the center of the pattern deviation plot, with a retinal sensitivity depression value worse than -5 decibels (dB) at each point[37-38],regardless of the defect in the peripheral field (Figure 1). All other cases were considered “normal” on central 10° VF.
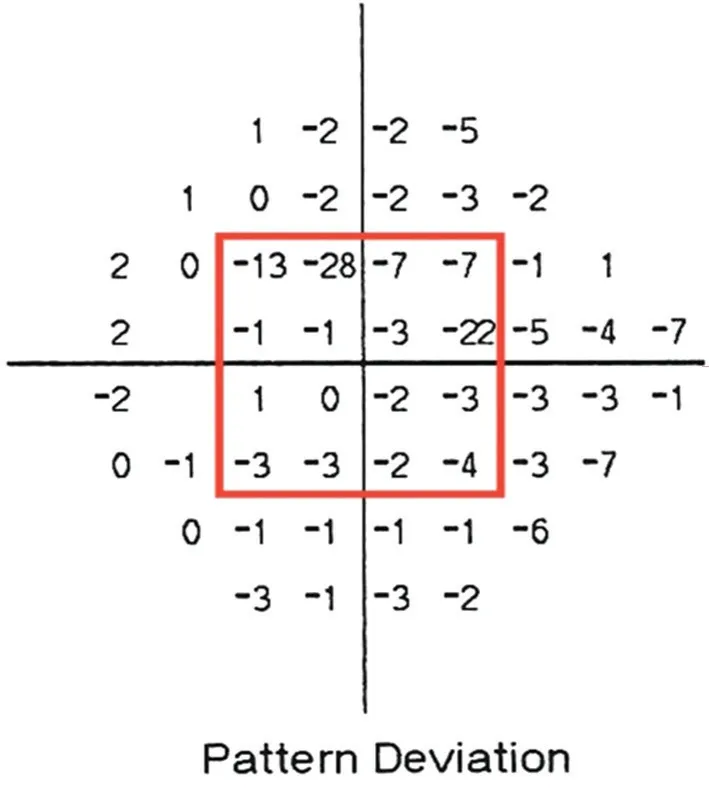
Figure 1 Pattern deviation plot of the 24-2 VF report (left eye)In the red box, 16 points surround the center, which represents the central 10° VF. If a cluster of more than 3 contiguous points had a retinal sensitivity depression value of less than -5 dB, the central 10°VF was defined as abnormal.
Optical coherence tomography measurementAll the subjects underwent frequency domain OCT scans (FD-OCT,RTVue100, Optovue, Fremont, CA, USA) with nondilated pupils and chose “Chinese” as their race. The scanning wavelength was 840±10 nm, and the speed was 26 000 A-scans per second. The peripapillary RNFL and macular ganglion cell complex (GCC) parameters were obtained by scanning models of the optic nerve head (ONH) and GCC, respectively. The GCC was composed of the RNFL, ganglion cell layer (GCL)and inner plexiform layer (IPL). Three scans of each model were repeated and only clear, nonreflective images with a signal strength indicator (SSI) of ≥40 were stored. The RNFL parameters included the average RNFL thickness (avgRNFL),superior hemifield RNFL thickness (supRNFL) and inferior hemifield RNFL thickness (infRNFL); the GCC parameters included the same types of parameters: avgGCC, supGCC, and infGCC. The qualitative results of the RNFL and GCC were classified into three categories based on a normative database:outside the normal limits (ONL), borderline (BL) or within the normal limits (WNL). ONL, BL, and WNL corresponded to the probability of the measurement being within the normal limits being less than 1%, 5% and more than 5%, respectively.Heidelberg retina tomography measurementHRT-3(Hedelberg Engineering, GmbH, Heidelberg, Germany) was used for the rim measurements in this study. The scanning depth was 0.4-4 mm, and the diopter value ranged from -12 D to +12 D.Three images were obtained, and the average tomographic image was used for analysis. The structural parameters of the ONH from this topographic image were obtained using a standard reference surface. The images were considered to be of acceptable or good quality when the standard deviation(SD) was ≤40[39]. Moorfields regression analysis (MRA) was performed with the HRT-3 data to compare the topography of the optic disc with that generated from a normative database.The three categories, ONL, BL and WNL, were defined as the probability of the measurements being within normal limits being less than 0.1%, 0.1%-5%, and more than 5%, respectively, for the MRA. The rim area (RA) was selected for quantitative analysis.Isolated-check visual evoked potential examinationThe second generation of the Neucodia visual electrophysiological device (MKWH-BMD, Huzhou Medconova Medical Technology Co. Ltd, Huzhou, China) was operated by one trained operator, and an isolated-check pattern (10 Hz sinusoidal temporal signal, 24×24 array of isolated checks)with a 15% positive contrast (brightness, depth of modulation 7.5%, luminance offset 7.5%) was chosen as the stimulation.The test field was 10 degrees around the point of fixation (a 2×2 array red cross without a sinusoidal temporal signal), and the viewing distance was 55 cm.
This version of the device was designed to have a relatively closed interspace between the head fixture and the stimulus screen with a specific internal lighting to reduce the interference of the test environment or other noise. A display stimulator of SONY OLED with 16-bit digital-to-analog converters per display, 60 Hz frame rate and 51 cd/m2luminance of the display’s static background was used, with 20 total cycles. Before the test, visual acuity was corrected to verify that subjects could see at least 20/40 at the viewing distance, and gold cup electrodes filled with electrolytic paste were placed at the midline sites on the scalp according to the International 10-20 system[40]to comprise a single electrophysiological channel with the following parameters:active electrode at Oz (occipital), reference electrode at Cz(vertex) and ground at Pz (parietal). A filter with a bandwidth from 1 to 40 Hz was used. The subjects were asked to focus on the cross on the center of the screen for each 2-secondlong stimulation, and each eye was tested separately. Cortical electroencephalography signals were recorded during each run. The time-domain signal was converted to the frequency domain, and the fundamental frequency component (FFC)was calculated by discrete Fourier transform. An FFC was calculated for each run, and a total of 8 valid runs were performed during each test. If there was significant noise,interference, fixation loss or an outlier FFC in a run, the system recognized the signal as invalid and excluded it and then automatically assessed the next cycle until eight qualified runs were recorded. The whole process was completed in approximately 2min. The instrument calculated the mean FFC and the radius of the 95% confidence circle. It was important that once the program started running, the operator could not intervene at any point in time until 8 qualified FFCs were collected. Thus, the results were not influenced by subjective judgment during the data collection. If there were ≥4 runs with invalid signals during the test process, the result was considered to be unreliable, and the participant was asked to rest for 20min before undergoing the test again. At least two tests with reliable results were performed for each eye.To avoid the study curve effect, the second set of results was recorded. The SNR, the observation index of the icVEP, was defined as the ratio of the mean amplitude of the FFC to the radius of the 95% confidence circle. In the output of the icVEP(Figures 2A, 3), the green area corresponds to an SNR of >1,indicating a significant response to the stimulus exceeding the normal distribution probability of <0.05. Red corresponds to an SNR of ≤0.85 (nonsignificant atP≥0.1). The small yellow area indicates 0.85<SNR≤1, with results that are nonsignificant atP<0.05 but significant atP<0.10. In our study, green (SNR>1),red (SNR≤0.85) and yellow area (0.85<SNR≤1) corresponded to WNL, ONL and BL values, respectively.
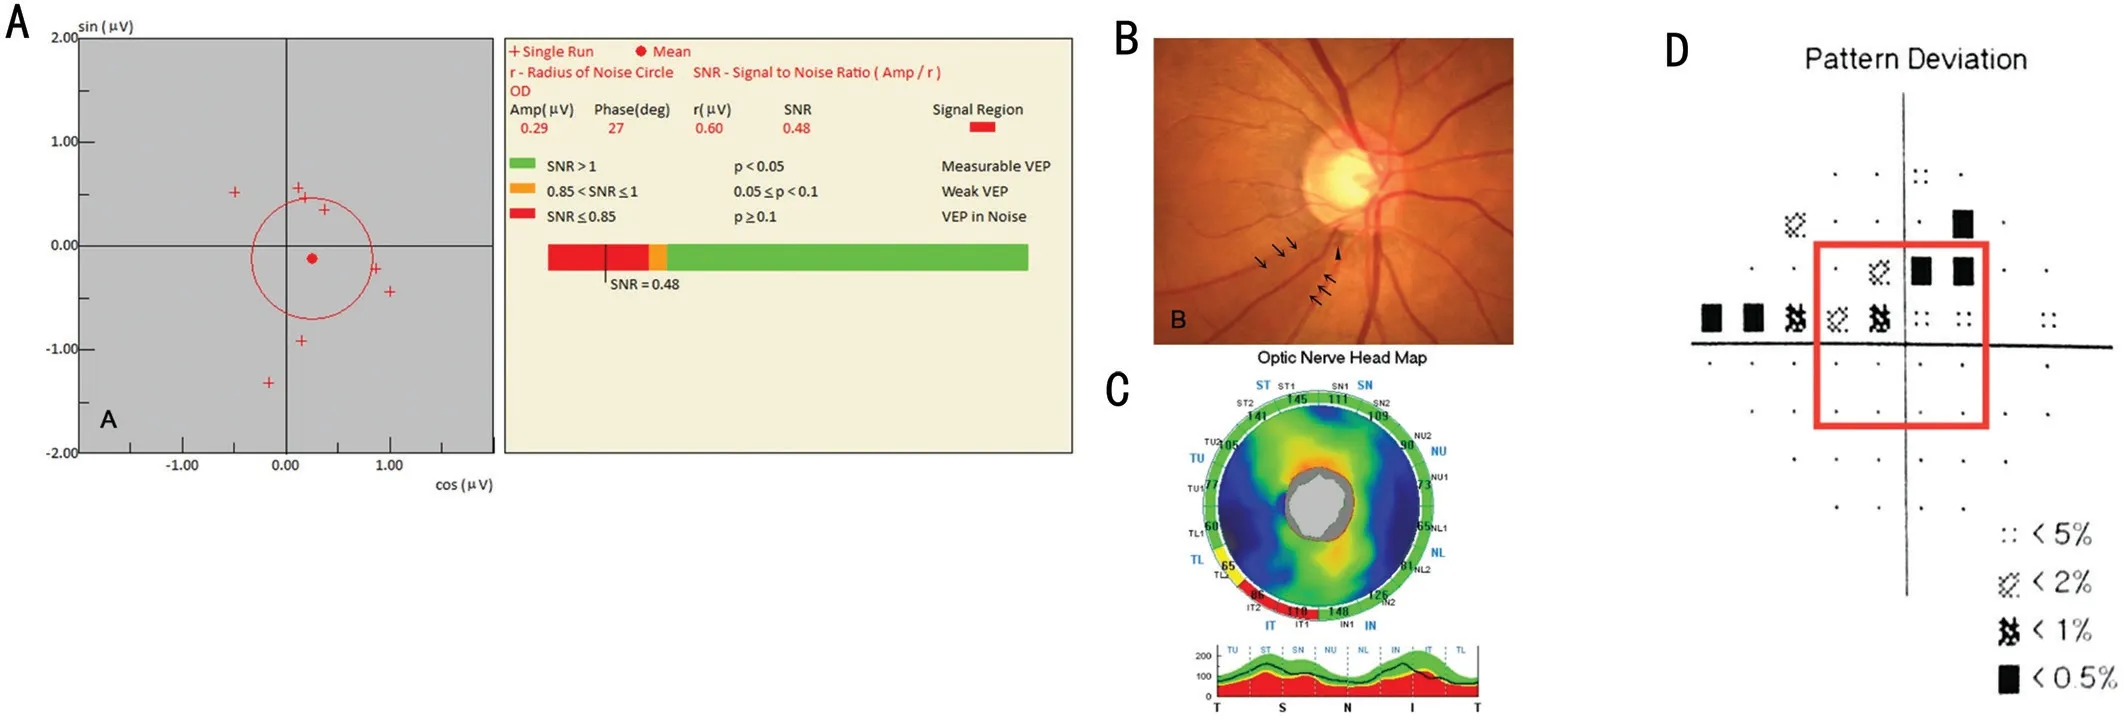
Figure 2 The results of a typical case of POAG (right eye) A: Abnormal icVEP result; B: Optic disc photography, the black arrows point to the RNFL defect, and the black triangular symbol indicates optic disc hemorrhage; C: Optic nerve head map on the OCT report; D: Pattern deviation on the Humphrey Field Analyzer 24-2 SITA program. The central 16 points correspond to the central 10° VF.
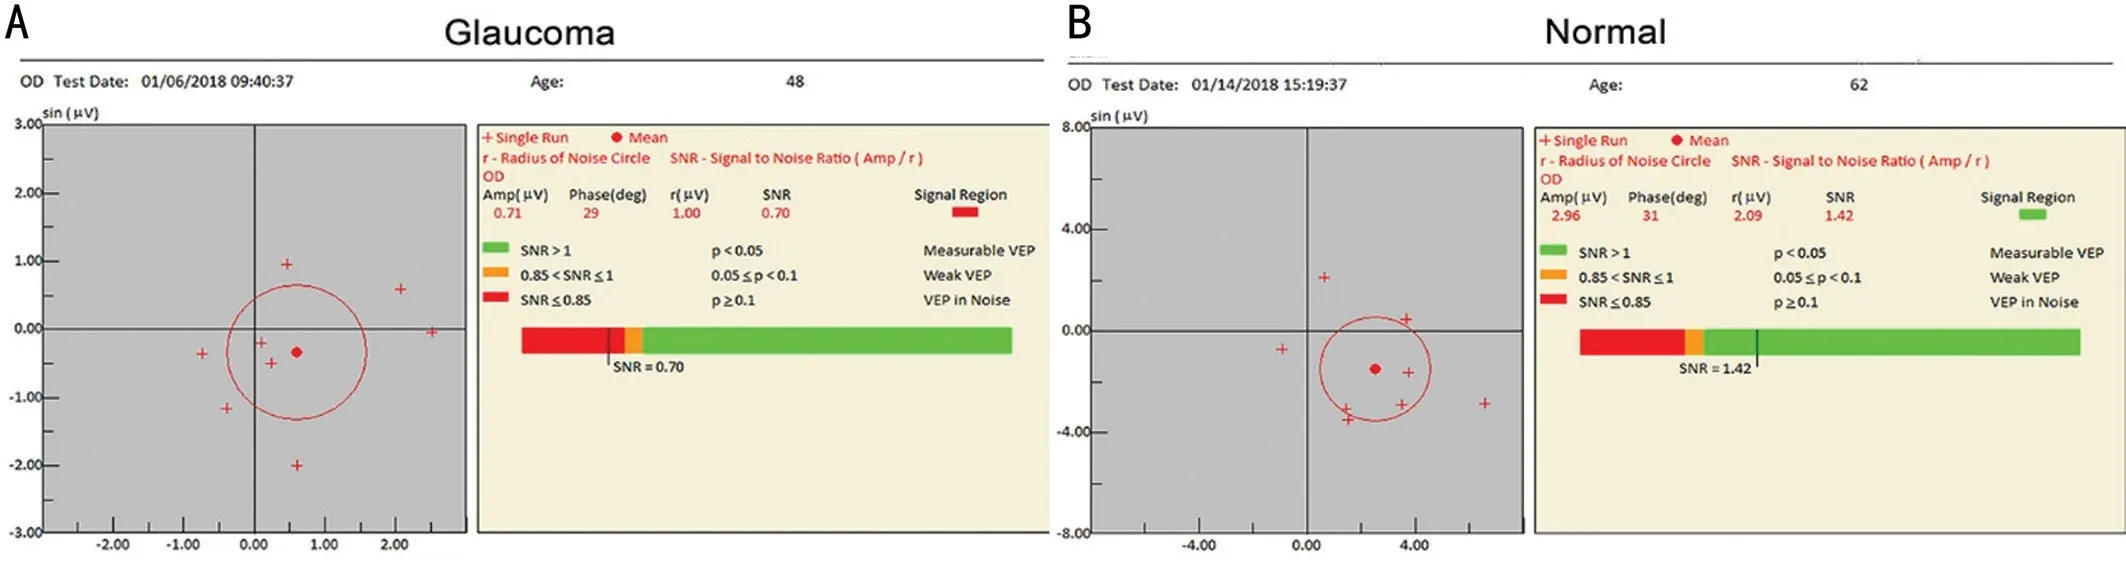
Figure 3 Samples of icVEP outputs (right eye) A: A report from a patient with glaucoma; B: A normal output.
Statistical AnalysisData were analyzed using SPSS 20.0.The Shapiro-Wilk test was used to assess the normality of the continuous variables in each group. Continuous variables are expressed as the means±SDs. Student’st-test,the Mann-WhitneyUtest, and the Chi-square test were used for comparisons between groups. Correlations between the parameters were analyzed using the Pearson correlation test.To investigate the capability of the SNR from the icVEP and the structural parameters obtained by OCT and HRT to distinguish between POAG participants and healthy subjects with or without HM, receiver operating characteristic (ROC)curve analysis was performed with the DeLong test using MedCalc (version 15.8). The areas under ROC curves (AUCs)were evaluated, and those of the SNR and other parameters were compared. The consistencies of the icVEP categories with VF were analyzed using the kappa identity test and the McNemar test. The results of the univariate comparisons were considered significant ifP<0.05.
RESULTS
A total of 126 subjects were finally enrolled, including 36 NHM-POAG participants, 31 HM-POAG participants, 25 highly myopic participants without POAG (HM), and 34 normal participants without HM (Normal), and the last two groups served as the control groups.
The demographic characteristics of each group are shown in Table 1. There were no significant differences between the groups in any of the demographic characteristics. The MD and visual field index (VFI) were significantly worse in both POAG groups than in both control groups (P<0.001), but no significant differences were found between the POAG subtype groups (MD:P=0.821, VFI:P=0.855) or between the HM and Normal control groups (MD:P=0.89, VFI:P=0.916).
Table 2 shows all the continuous and categorical parameters assessed in this study. The SNR was significantly smaller in the POAG groups than in the control groups (P<0.001), and there were no significant differences in the SNR between thePOAG subgroups (P=0.41) or between the HM and Normal control groups (P=0.701). All the OCT and HRT parameters showed significant differences between the HM-POAG and HM groups and between the NHM-POAG and Normal groups(P<0.001).

Table 1 Demographic characteristics of the subjects (n=126)

Table 2 The icVEP, OCT, and HRT parameters for each group (n=126)
Table 3 shows the correlation between icVEP (SNR) and related factors for patients with POAG. The SNR value showed a significant positive correlation with MD, avgRNFL and avgGCC (r=0.246-0.337,P<0.05). There were no significant correlations between the SNR and RA, AL, IOP and CCT(P>0.05).
Diagnostic indicators of the SNR in subjects with and without HM are shown in Table 4. The diagnostic capability of the icVEP was better in distinguishing the HM-POAG and HM groups (AUC=0.862) than in distinguishing the NHMPOAG and Normal groups (AUC=0.789). The best criterion was selected on the basis of the Youden index (YI), and the corresponding sensitivity, specificity, positive likelihood ratio(+LR) and negative likelihood ratio (-LR) were calculated.The best criterions of SNR in our study were ≤0.99 in the HMPOAG groupvsthe HM group and ≤0.96 in the NHM-POAG groupvsthe Normal group. In addition, with the criterion of an SNR of ≤1 (set by the instrument), the diagnostic consistency of the SNR in subjects with and without HM was 80.4% and 80%, respectively.
The qualitative comparison results are shown in Table 5. The AUC of the SNR (0.844) for differentiating the HM-POAG and HM groups was comparable to that of the RNFL, GCC and MRA parameters assessed by OCT and HRT (P>0.05);however, it was significantly smaller than avgRNFL andinfRNFL in distinguishing the NHM-POAG and Normal control groups (P<0.05). The specificity was the best for the SNR compared with all the other parameters explored, but the sensitivity was moderate or poor (Table 6).

Table 3 Correlations between icVEP (SNR) and related factors in patients with POAG (n=67)
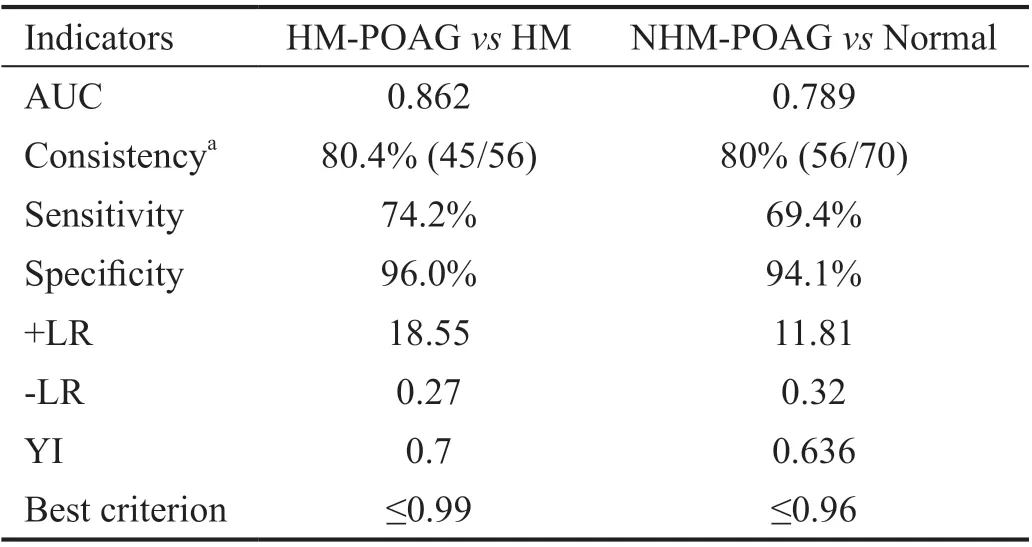
Table 4 Diagnostic performance of icVEP (SNR)
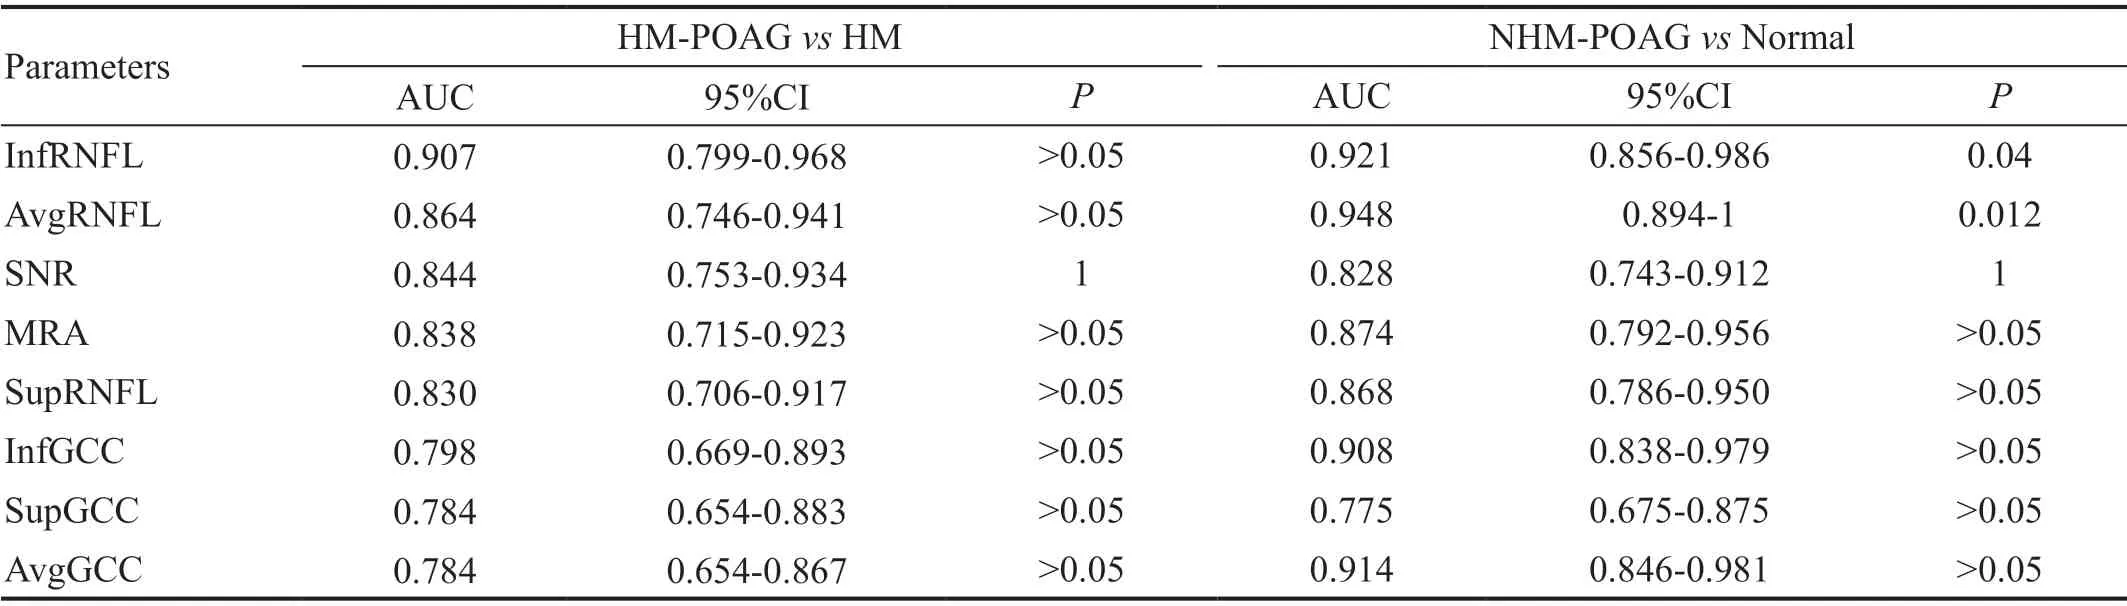
Table 5 Ranking of the AUCs in a qualitative comparison

Table 6 The sensitivities and specificities of categorical indicators when BL was defined as ONL or WNL
The quantitative comparison results are shown in Table 7. No significant differences were found between the AUC of the SNR and those of other parameters in discriminating between the HM-POAG and HM groups (P>0.05). However, the AUC of SNR was larger than that of RA but smaller than those of the most parameters assessed by OCT in distinguishing between the NHM-POAG and Normal groups.
The disagreement between 24-2 VF and icVEP was 19.8%(25/126) in all the subjects, and the positive rate of the icVEP among the 67 POAG patients was 71.6% (48/67). We compared the consistency of the icVEP classification (SNR≤1 as abnormal) and VF results. As shown in Table 8, in all theparticipants, although the icVEP and 24-2 VF (glaucomatous VF defects as abnormal) showed general consistency(kappa=0.607;P<0.001), the two methods were significantly different in their performance in assessing visual impairment(McNemar test,P<0.05). Considering that the icVEP could detect only visual function in the central 10° VF, the central 10°VF damage described in detail above was used to rationalize the comparison. As Table 9 shows, in all the subjects, the central 10° VF and icVEP were not significantly different(McNemar test,P>0.05) and had good consistency in detecting visual function damage in all subjects and the populations with and without HM (kappa=0.695-0.747,P<0.001).

Table 7 Ranking of the AUCs in a quantitative comparison
DISCUSSION
In our study, MKWH-BMD equipment was used with 15%positive-contrast (bright) stimulation, and the results showed that the SNR values from the icVEP in the POAG groups were significantly smaller than those in the control groups (Table 2,P<0.05), which indicated that glaucomatous functional impairment can be detected by the icVEP. Zemonet al[20]reported that the icVEP can be used to distinguish individuals with glaucoma from controls by detecting functional damage to the M pathway. They also obtained optimal classification accuracy under 15 positive-contrast(bright) conditions in the comparison of different brightness and contrast stimulus parameters[20]. In our study, the SNR value showed significant positive correlations with MD of VF,avgRNFL, and avgGCC (Table 3;r=0.246-0.337,P<0.05),indicating that the SNR value decreased with the severity of glaucoma.
When the “abnormal” threshold set by the device manufacturer,an SNR of ≤1, was used as the criterion, the AUC of the SNR for discriminating the POAG in non-highly myopic subjects was 0.789, and the sensitivity and specificity were 69.4% and 91.2%, respectively. This result was similar to those of several other studies[31,34]. With the same stimulus parameters and SNR≤1 as the criteria, the sensitivity (53.1%) and specificity(84.6%) of the icVEP reported by Chen and Zhao[32]were slightly lower than those in our study; we inferred that this discrepancy may be attributed to the difference in devices and inclusion criteria for POAG participants. The MKWHAMD device was used in Chen and Zhao’s study, and optic disc photography along with the MRA classification of HRT were used as the diagnostic standard for POAG. In our study,we used the MKWH-BMD device and a combination of glaucomatous optic abnormalities and VF defects as diagnostic criteria. However, with the same stimulation, Kolomeyeret al[35]obtained a higher AUC (0.92) and sensitivity (83%) but a lower specificity (85%) of the icVEP than we did in our present study, and the possible reasons for this discrepancy may be as follows: first, there were differences in equipment and the detection environment between the two studies. Unlike the EvokDx device, the MKWH-BMD device that we used was equipped with a relatively closed testing interspace and internal lighting and, therefore, had a relatively closed testing environment and stable level of illumination, which can reduce the level of interference due to the external lighting of the environment; thus, the number of false positives caused by noise may be reduced, and a relatively higher specificity and lower sensitivity were obtained. Second, population differences may also affect the results. In our study, the absence of preperimetric glaucoma may have contributed to an increased specificity.

Table 8 Contingency table of the central 24-2 VF and icVEP results in different populations
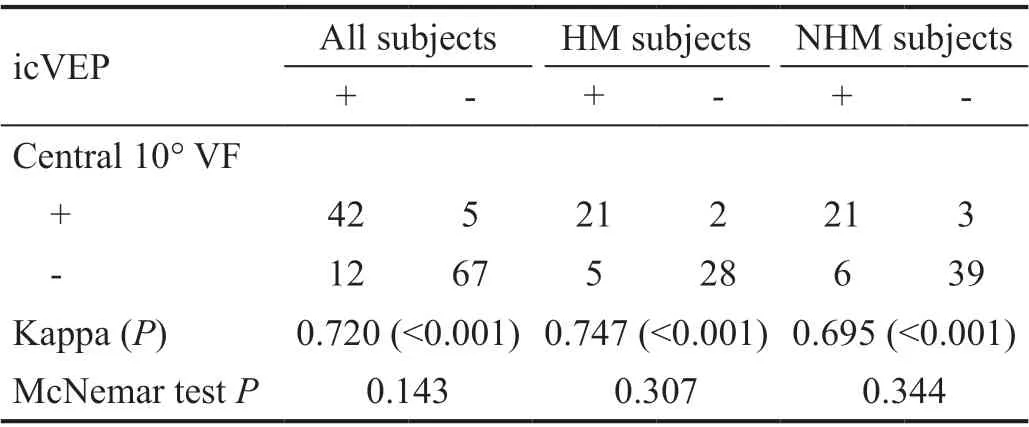
Table 9 Contingency table of central 10° VF and icVEP results in different populations
We compared the diagnostic ability of the icVEP for POAG subjects with or without HM. Table 4 shows that the diagnostic indicators of the SNR (including AUC, +LR, -LR and YI) in subjects with HM were all better than those in the subjects without HM; thus, we demonstrated that the SNR has better diagnostic performance in HM subjects than non-HM subjects.The findings of previous studies on VF and RNFL defects may explain this result. Specifically, in the early stage of non-HM POAG,VF defects are typically located in the Bjerrum area and nasal steps, and the central area around the point of fixation is often not affected until the late stage[3]. However, in POAG with HM, central or paracentral scotomas are often found in the early stage due to defects of the papillomacular bundle being more common[41-43]. Therefore, the central visual function abnormality may be more common in POAG patients with HM than in those without HM. The icVEP may be sensitive to central visual function damage because it can be used to detect only damage to the M pathway around the fixation. As a consequence, some early-stage non-HM POAG cases without central visual function impairment may be missed by icVEP assessments, which may be the reason why the diagnostic performance of the icVEP is better in highly myopic subjects than in subjects without HM.
The results of both qualitative and quantitative comparisons between the icVEP, OCT and HRT parameters are shown in Tables 5 and 7. In the subjects without HM, the AUC value of the SNR assessed by the icVEP was smaller than that of most structural parameters and comparable to only the RA assessed by HRT (AUC: SNR=0.789, RA=0.747,P>0.05). In the subjects with HM, there was no significant difference in the AUC between the SNR and OCT and HRT parameters in both the qualitative and quantitative analyses (P>0.05), and the AUC of the SNR (0.844) was comparable to that of MRA assessed by HRT and most parameters assessed by OCT in the qualitative comparison.
In addition, a specificity of 85%-100% in distinguishing the POAG population from the normal population was obtained by icVEP in this study and in previous studies[20,30-32]. In our qualitative comparison, Table 6 shows that the specificity of the icVEP was higher than those of all the OCT and HRT structural parameters (compared with their respective databases), especially in subjects with HM, in which the specificities of the OCT and HRT structural parameters were relatively lower. The possible reason for this discrepancy may be that in populations with HM, atrophy or thinning of the retinal tissues and significant variation in the optic disc structure (such as tilt, torsion and atrophic arc) due to an elongated ocular axis usually result in large inter-individual differences in the structural parameters[3,7-8,39,44]. Therefore, for subjects with HM, the RNFL and GCC parameters assessed by OCT may exhibit pseudo-thinning, and the MRA results of the HRT may show incorrect classification results compared with the data in standard databases. The icVEP has potential to be used for screening POAG in patients with HM or poor cooperation in the VF test.
In the present study, the consistency between the icVEP and VF was further analyzed. The results of the two functional tests showed disagreement with each other in 25 participants(19.8%), 19 of whom had POAG and definite VF defects but were classified as “normal” cases by the icVEP and 6 of whom were non-POAG subjects with normal VF who were judged as“abnormal” cases by the icVEP. Previous studies also reported that approximately 23.3%-33% of subjects have VF results that are inconsistent with the icVEP classification[30,32,34]. The sensitivity and specificity of the icVEP were comparable to those of the VF test in a study conducted by Chen and Zhao[32]when the disc photograph grade and MRA results of the HRT were used as the criteria for POAG, but the consistency of the two examinations was not analyzed any further. We compared the VF and icVEP results in Tables 8 and 9. In all the participants, 24-2 VF and icVEP were generally consistent with each other (kappa=0.607;P<0.001) but were significantly different in their performance in assessing visual impairment(McNemar test,P<0.05). The central 10° VF and icVEP results had good consistency (kappa=0.695-0.747,P<0.001), and the two functional tests showed no significant differences in their performance in detecting central visual function damage in all subgroups with different diopters. We speculated that false negatives of the icVEP may occur because the function of M cells in the central field area is not involved or plays a compensatory role in early POAG. Fanet al[34]also confirmed that icVEP results are closely related to central VF damage.Therefore, the icVEP may cause missed diagnoses in some patients with POAG, especially those who have only peripheral functional damage in the early stage. This may also be an explanation for the relatively low sensitivities of the SNR in both the present study and previous studies.
One limitation of this study is that it was a cross-sectional study, and the sample sizes were relatively small. Therefore,longitudinal studies with large sample sizes need to be conducted to confirm the diagnostic performance of the icVEP.In addition, we realized that there are still some disadvantages of the icVEP test in terms of its clinical application. First,the test requires relatively good visual acuity and transparent ocular media in the subjects; thus, the application of the icVEP in patients with poor visual acuity (such as those with moderate or severe cataracts) may be limited. Second, although the icVEP device has been designed to reduce interference,the signal may still be affected by noise in the assessment process. More advanced techniques may be needed to reduce interference and improve the reliability of the device in the future.In conclusion, the icVEP can detect visual function damage in most POAG cases. The diagnostic performance of the icVEP in subjects with HM was better than that in non-HM subjects.In subjects with HM, the diagnostic performance of the icVEP was comparable to those of the OCT and HRT parameters.Compared with the OCT and HRT structural parameters,the SNR of the icVEP showed a relatively higher specificity.Therefore, the icVEP examination has the potential to be an auxiliary method in distinguishing individuals with and without POAG, especially in HM populations or patients with poor VF coordination.
ACKNOWLEDGEMENTS
Conflicts of Interest:Wang X,None;Li RS,None;Wei YH,None;Fang Y,None;Tian T,None;Li M,None;Pan YZ,None.
 International Journal of Ophthalmology2021年5期
- International Journal of Ophthalmology的其它文章
- Comprehensive evaluation of intravitreal conbercept versus half-dose photodynamic therapy for chronic central serous chorioretinopathy
- Lipid accumulation and protein modifications of Bruch’s membrane in age-related macular degeneration
- Via pars plana anterior iris enclavation lOL fixation
- Role of microRNA-25 in high glucose cultured Müller glia
- Protective effects of piperine on the retina of mice with streptozotocin-induced diabetes by suppressing HlF-1/VEGFA pathway and promoting PEDF expression
- Expression levels of pro-inflammatory interleukin-8 and certain antimicrobial peptides in concurrent with bacterial conjunctivitis