
Optimizing the intraocular lens formula constant according to intraocular lens diameter
2021-05-15 02:50AbdulElKhayatPaulTesha
Abdul R El-Khayat, Paul Tesha
1Department of Ophthalmology, Leicester Royal Infirmary,Leicester, LE1 5WW, UK
2Department of Ophthalmology, Lincoln County Hospital,Lincoln, LN2 5QY, UK
Abstract
● KEYWORDS: intraocular lens; formula constant;optimization; cataract surgery
INTRODUCTION
The position that an intraocular lens (IOL) takes within an eye affects the refractive outcome of that eye[1-2].Misalignments of IOLsin vivo i.e., decentration, tilt and axial translation have been shown to impact on the refractive outcome of the eye[3-4]. Studies have also shown that the configuration of an IOL in the capsular bag depends on three factors: size, shape and rigidity of the IOL[5]. This suggests that the size of an IOL may affect its configuration/position in the eye and hence the refractive outcome of the eye.
Certain plate haptic IOL designs vary in size in discrete steps across their range of diopteric powers[6]. This difference in size may affect the IOL position in the eye and hence the accuracy of predictions of postoperative refraction.Estimating the postoperative IOL position after cataract surgery from preoperative measurements is the main limiting factor for refractive predictability[7-9]. IOL formulas use constants for specific IOLs to predict the effective lens position postoperatively. These constants are usually refined from refractive outcomes of a large number of cases and hence represent the mean effective position of the specific IOL inside the eye[10-11]. The optimization of this constant by comparing the predicted post-operative spherical equivalent with the actual spherical equivalent is recommended to improve accuracy of refractive predictions[12-13].
The main aim of this study was to determine whether optimizing A constants separately for the discrete sizes of IOLs within one design would lead to statistically significant differences in the A constants and whether these can be used to improve refractive outcomes.
SUBJECTS AND METHODS
Ethical ApprovalWritten informed consent for surgery was gained from all participants and the study was conducted according to the principles outlined in the Declaration of Helsinki.
Table 1 Inclusion and exclusion criteria
Data from the 1stof January 2011 until the 31stof December 2012 from an on-going cataract audit at Lincoln County Hospital were used for this study. These data were collected prospectively on a pro forma and included the following preoperative and post-operative information: demographics,refraction, visual acuity, keratometry, axial length, A constant used and any surgical complications. Biometry was performed and recorded by different nurses. IOL power calculations were performed according to The Royal College of Ophthalmologists (RCOphth) and The National Institute for Health and Care Excellence (NICE) guidelines (SRK/T formula used for axial lengths of 22 mm and above and Hoffer Q formula used for lengths below 22 mm)[13-14]. The starting point for the A constant that was used in the SRK/T formula was a constant that had been optimized locally for all sizes of the Akreos AO MI60 lenses collectively. The cataract operations were carried out by the different ophthalmologists who perform this procedure at Lincoln County Hospital. Data relating to choice of IOL implant and complications were recorded by the surgeon. Post-operative refraction was completed by community optometrists at least four weeks after the operation and recorded on a form that was given to the patient upon completion of their surgery. Data collected on all pro-forms were entered into a customised database. Table 1 highlights the inclusion and exclusion criteria for the study.
This study was aimed at highlighting how the size of an IOL affects refractive outcomes, hence only one lens that varies in size was included. The Akreos AO MI60 IOL is the first line IOL used at Lincoln County Hospital and comes in three distinct sizes according to its dioptric power. The different sizes of the IOL are detailed in Table 2.
Analysis of the data consisted firstly of dividing it into three groups according to MI60 IOL size. Then, the difference between predicted post-operative spherical equivalent and actual post-operative spherical equivalent (assessed by community optometrists) was calculated for each IOL size individually. This “error” in prediction was fed back to calculate what, in retrospect, the “ideal” or “optimized” Aconstant should have been (i.e., the A constant that would have given the most accurate refractive predictions). This produced three separate A constants for each size of the MI60 IOL. Oneway analysis of variance (ANOVA) was used to compare the significance of the difference between the A constants.
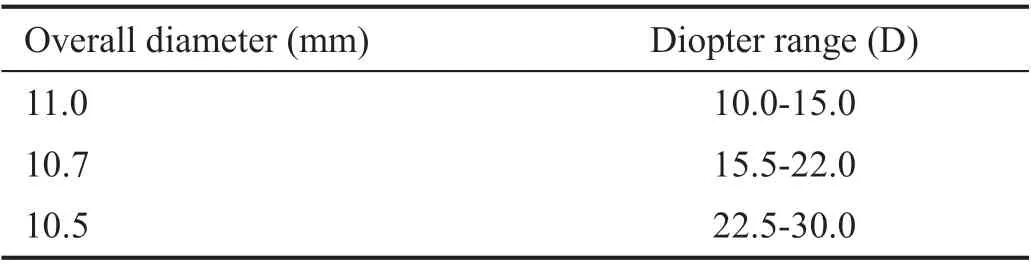
Table 2 Different sizes of the Akreos AO MI60 IOL according to dioptric value
Data for errors in predicted post-operative spherical equivalent after A constant optimization were also analysed for the previous 5y. This was done to determine whether using the new A constants would continue to improve refractive predictions. Errors were divided into prediction within 1.5 D,1.0 D, and 0.5 D of actual post-operative spherical equivalent.Initially, optimization from 2008 until 2010 was carried out for all the MI60 lenses collectively. During 2011 and 2012, two separate A constants were optimized for the medium and small MI60 lens. Optimization was not done for the large MI60 lens as the number of the lenses used was low.
RESULTS
During 2011 and 2012, 2398 cataract operations were performed at Lincoln County Hospital. After applying the inclusion and exclusion criteria, this number was reduced to 1131.
Table 3 shows the demographics of the individuals included in the study. One-way ANOVA between mean age, post-operative days to refraction and laterality showed no significant difference between the groups with different sized IOLs.
Table 4 and Figure 1 show the three A constants optimized for IOL size. One-way ANOVA for both mean biometry errors and optimized A constants showed highly significant statistical differences ofP=0.014 andP≤0.0001 respectively.
Table 5 and Figure 2 show the accuracy of refractive predictions over the last 5y after using successively optimized A constants. The trend in results showed increasing accuracywith successive optimization. This remained the case during 2011 and 2012 when two A constants were optimized and used.
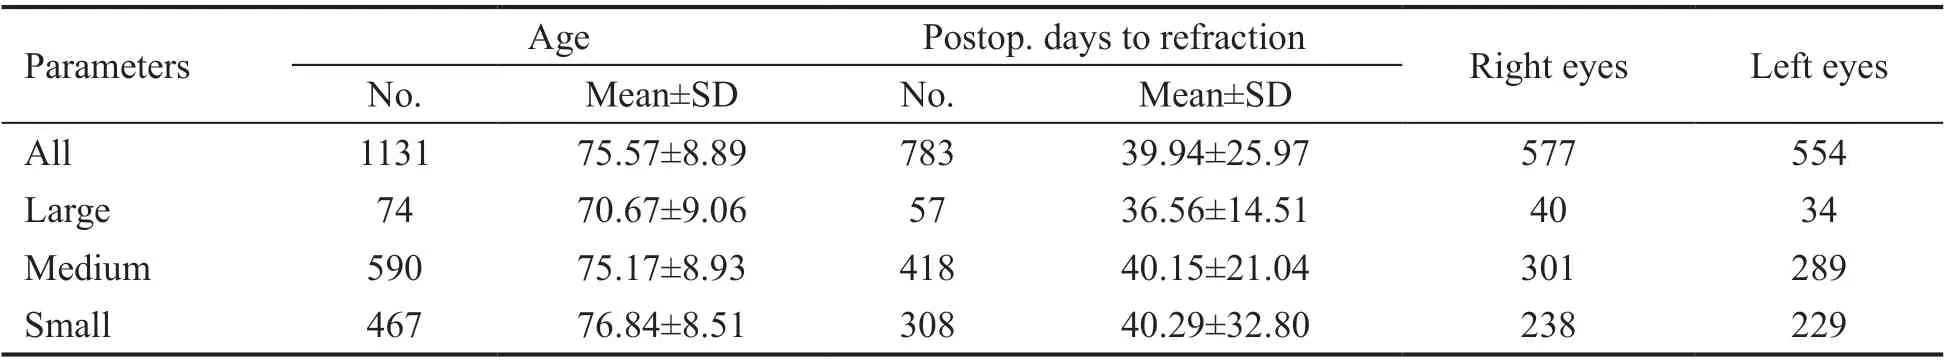
Table 3 Demographics of individuals with respect to size of MI60 IOL

Figure 1 SRK/T A constants individually optimized for the 3 different sizes of MI60 lenses.
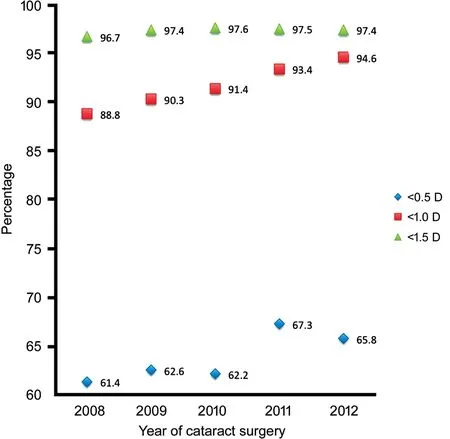
Figure 2 Accuracy of predicted spherical equivalents with successive optimization of A-constants Results for 2011 and 2012 derived from 2 A-constants optimized according to 2 different sizes of the MI60 lens.
DISCUSSION
This study shows that optimizing the SRK/T A constant for the three distinct sizes of the Bausch & Lomb Akreos MI60 lens leads to three significantly different A constants. Since theoptimization process of A constants utilises errors in refractive predictions, in theory, this could mean that using a different sized MI60 lens leads to a different refractive outcome.

Table 4 Optimized A constants according to IOL size
This study also shows that using one A constant that is optimized for all MI60 lenses and two constants that are optimized for two sizes of the MI60 lens leads to better refractive outcomes than no optimization. Demonstrating that even better refractive outcomes can be achieved through three different A constants would be ideal, however using three A constants in our practice at Lincoln County Hospital did not lead to improved refractive outcomes and hence is not being used at present.
Lens formula constants published by manufacturers are typically intended for use with contact ultrasound biometry[15].Using optical biometry with these constants will lead to outcomes that are more hypermetropic[12]. Optimized constants for different lenses and methods of biometry are available online and probably provide a better starting point to manufacturer constants[16]. However, optimization according to local clinical outcomes is still recommended[15]. Most clinicians who optimize lens constants do so for all eyes collectively[17].Optimizing different constants for subsets of patients is more controversial but, in certain situations, may give better outcomes for variations in corneal power[18-19], surgeon[12,20], and axial length (e.g., very short or long eyes)[17,21-24]. Varying lens formula constants according to lens size, to our knowledge,has not been described in the literature.
One limitation to the conclusions drawn from this study is that the statistical differences found in refractive outcomes could be due to differences in axial length rather than the size of the IOL. As there is a correlation between required IOL power and axial length, IOL size may simply be a surrogate marker for axial length. Further studies could look into different sizes of IOLs in eyes with similar axial lengths, for example, patients with bilateral cataracts who have different sized IOLs in each eye. A second limitation is the small number of subjects in thelarge IOL group, which limited the inclusion of this group in this study.
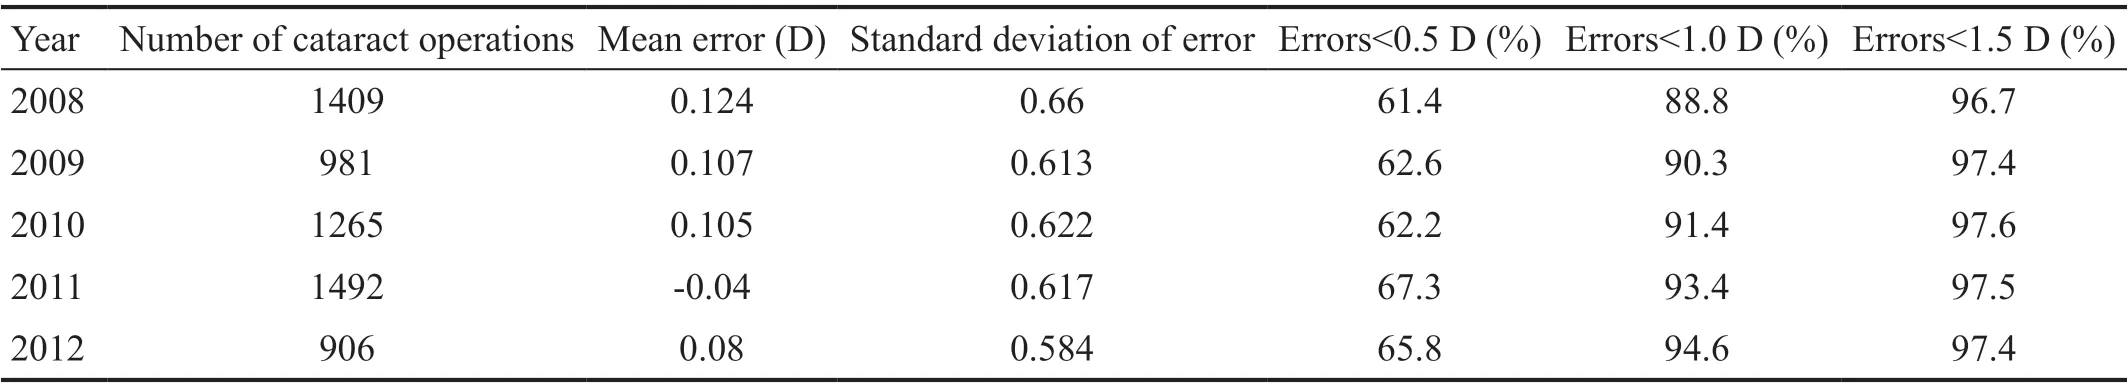
Table 5 Errors in predicted spherical equivalents (actual postop. spherical equivalent minus predicted spherical equivalent)
ACKNOWLEDGEMENTS
Conflicts of Interest: El-Khayat AR,None;Tesha P,None.
 International Journal of Ophthalmology2021年5期
- International Journal of Ophthalmology的其它文章
- Comprehensive evaluation of intravitreal conbercept versus half-dose photodynamic therapy for chronic central serous chorioretinopathy
- Lipid accumulation and protein modifications of Bruch’s membrane in age-related macular degeneration
- Via pars plana anterior iris enclavation lOL fixation
- Role of microRNA-25 in high glucose cultured Müller glia
- Protective effects of piperine on the retina of mice with streptozotocin-induced diabetes by suppressing HlF-1/VEGFA pathway and promoting PEDF expression
- Expression levels of pro-inflammatory interleukin-8 and certain antimicrobial peptides in concurrent with bacterial conjunctivitis