DFF-EDR:An Indoor Fingerprint Location Technology Using Dynamic Fusion Features of Channel State Information and Improved Edit Distance on Real Sequence
Ke Han,Yunfei Xu,Zhongliang Deng,Jiawei Fu
School of Electronic Engineering,Beijing University of Posts and Telecommunications,Beijing 100876,China
Abstract:Positioning technology based on wireless network signals in indoor environments has developed rapidly in recent years as the demand for locationbased services continues to increase.Channel state information (CSI) can be used as location feature information in fingerprint-based positioning systems because it can reflect the characteristics of the signal on multiple subcarriers.However,the random noise contained in the raw CSI information increases the likelihood of confusion when matching fingerprint data.In this paper,the Dynamic Fusion Feature (DFF) is proposed as a new fingerprint formation method to remove the noise and improve the feature resolution of the system,which combines the pre-processed amplitude and phase data.Then,the improved edit distance on real sequence (IEDR) is used as a similarity metric for fingerprint matching.Based on the above studies,we propose a new indoor fingerprint positioning method,named DFF-EDR,for improving positioning performance.During the experimental stage,data were collected and analyzed in two typical indoor environments.The results show that the proposed localization method in this paper effectively improves the feature resolution of the system in terms of both fingerprint features and similarity measures,has good anti-noise capability,and effectively reduces the localization errors.
Keywords:channel state information;indoor positioning;edit distance on real sequence;dynamic parameters;feature resolution
I.INTRODUCTION
With the rapid development of mobile internet and wireless communication technologies,location-based services (LBS) have become a part of people’s lives[1].In recent years,in view of the demand for accurate location information and the increase in indoor activities,Indoor Location Based Services(ILBS)has received a lot of attention.However,non-sight distance,obstructions,signal interference,and other factors contribute to a more complex indoor environment than outdoor.While global navigation satellite systems (GNSS) can achieve precise positioning outdoors,the complex environment affects the effective coverage of the satellite signal,which leads to a weakening of its positioning effectiveness.As a result,many methods for indoor positioning have been proposed to achieve better positioning results.Currently has been applied to the complex environment for positioning technology and methods are mainly the use of infrared[2],radio frequency identification(RFID)[3],ultrasonic [4],Bluetooth [5],ultra-wideband (UWB)[6],Wi-Fi [7]and other wireless signals.Among them,Wi-Fi-based location technology has clear advantages in the field of indoor location due to easy access and deployment.
In a positioning system using Wi-Fi signals,Receive Signal Strength(RSS)and Channel State Information(CSI) are the two basic types of location information that can be used for positioning today.RSS-based Wi-Fi positioning technologies have received some research due to their low hardware requirements,simplicity of location information and low computational complexity,such as methods Horus[8]and Radar[9].However,RSS is a superimposed value of a multipath signal for the information receiver,and the degree of signal fluctuation is heavily influenced by the multipath effect,and therefore produces a certain amount of error.With the development of indoor positioning technology and the improvement of positioning accuracy requirements,the coarse-grained and unstable characteristics of RSS information limit the further improvement of positioning accuracy [10].As hardware devices begin to support the acquisition of physical layer channel state information (CSI),CSIbased positioning techniques provide new ideas for the study of positioning in complex environments.Using orthogonal frequency division multiplexing (OFDM)and multiple input multiple output (MIMO) systems on the IEEE802.11a/n protocol,CSI information can be obtained on existing commercial Wi-Fi devices.CSI can provide phase and amplitude information on multiple subcarriers with higher dimensional position characteristics than RSS.The use of CSI information with fine-grained characteristics to establish highprecision indoor positioning methods has become an important research direction in the field of indoor positioning.
Based on the research results of recent CSI-based Wi-Fi indoor positioning methods,the current positioning methods are mainly divided into geometrybased positioning and fingerprint-based positioning.The geometry-based positioning method is based on estimating the position of a target by triangulation or triangulation by obtaining geometric information(e.g.distance,angle,etc.) from the collected CSI data.Wu et al.proposed the FILA model,which weighted the average CSI amplitude information of 30 subcarriers to obtain effective CSI,and then proposed the relationship between effective CSI and distance to achieve submeter-level localization most in the indoor environment[11].Kotaru et al.used the reconstructed CSI signal matrix and eigenvalue decomposition to jointly estimate the angle of arrival(AOA)and time of flight(TOF)to establish the SpotFi localization method and achieve submeter-scale localization [12].Vasisht et al.proposed a Chronos method based on non-uniform discrete Fourier inverse commutation to obtain sub-nanosecond level TOF by measuring discontinuous frequency bands [13].Tian et al.performed AOA estimation of the measured CSI data in the PILA positioning method and added a twodimensional spatial smoothing method in the position estimation process to achieve a positioning accuracy of 0.7m [14].Geometric-based positioning methods can obtain geometric information from CSI data to locate a target,and accurate geometric measurements can enable high-performance positioning of the target.The indoor environment is more complex than the outdoor one,with many non-line-of-sight distance signals,obstacles and other influencing factors,so the way of computing for geometric information is not fixed.To adapt to complex environments,CSI positioning based on geometric measurements requires the help of an appropriate empirical model selection,on the other hand,TOF or AOA measurements usually require the arrangement of additional equipment[15].The above influencing factors may affect the cost of the positioning system and the efficiency of positioning.
Fingerprint-based CSI positioning technology is a process that involves feature extraction and matching,which is mainly divided into two stages:offline training and online matching.During the offline training stage,the CSI data collected at specific locations are integrated to form a location fingerprint information that is stored in the fingerprint database.In the online matching stage,the CSI data collected during the online testing stage is matched with the data from the fingerprint database to achieve the final location calculation.In recent years,several fingerprint-based CSI location methods have emerged.Xiao et al.first proposed the FIFS method,used the amplitude information from CSI to build the fingerprint mapping and used the probabilistic model in the fingerprint matching stage [16].The CSI-MIMO method proposed by Chapre et al.collects and utilizes both amplitude and phase data from CSI,using the difference between the amplitude and phase adjacent subcarriers as fingerprint data to complete the positioning [17].The PhaseFi method proposed by Wang et al.completes the training of a neural network with three hidden layers,using the calibrated phase information of CSI as the fingerprint data for localization [18].In addition,they have built a DeepFi positioning method using CSI amplitude information,which uses neural networks to obtain fingerprint weights,and ultimately uses the weights to achieve precise positioning [19].The CSI amplitude information was further processed by Xiao et al.to build a fingerprint library using the size distribution intervals of the amplitude at different locations and to use KL divergence(Kullback-Leibler Divergence) as a measure of similarity [20].The Amp-Phi method proposed by Zhou et al.uses CSI amplitude and phase to build a database and then completes the position matching by Euclidean distance and KNN algorithm [21].The HATRFLA positioning method of Zheng et al.takes the product of the time reversal resonating strength (TRRS) values of amplitude and phase as a measure of similarity [22].Dang X et al.combine CSI amplitude and phase through weights to generate fingerprint data,and in their proposed FapFi method,iteratively optimize the weight values to improve the matching effect [23].Our team has previously proposed the CC-DTW method[15],which proposes a calibrated CSI feature (CCF) combined with amplitude and phase as fingerprint data,and a new similarity calculation metric based on modified dynamic time warping (MDTW) in the matching stage,further improving the feature resolution and accuracy of fingerprint positioning.
Fingerprint-based CSI positioning is a process in which features are formed and then matched.The feature resolution of the fingerprint data represents the probability of successful feature matching and determines the positioning accuracy of the system.The higher the resolution,the smaller the range that will be confused and the higher the positioning accuracy.The method of formation of fingerprint data and the development of similarity metrics are important ways to improve feature resolution.Amplitude and phase information is an important part of CSI’s initial information.In recent years,a lot of work has begun to build fingerprint data using both amplitude data and phase data rather than just one,like the previous works done in [15,17,21–23].At the same time,this approach also creates several problems,as too much unprocessed CSI data can significantly increase the complexity of fingerprint data,reduce system operational efficiency,and more data can be more susceptible to noise.It is therefore necessary to develop appropriate fingerprinting methods to minimize the complexity of the data and reduce the impact of noise.On the other hand,fingerprint similarity measurement via Euclidean distance (ED) is the main approach taken by CSI fingerprint positioning in the online matching stage.Some other types of similarity metrics have recently been used in CSI fingerprinting studies,such as the TR-based similarity measure in [22]and [15],which introduces the DTW method into the calculation of similarity.Due to the complex indoor environment,the fingerprint data in the online stage can contain uncertain noisy data when performing similarity matching,which in turn leads to fluctuations in the online fingerprint data.Therefore,the development of more environment-adapted similarity metrics can help to improve the resolution of positioning system features and ultimately achieve more accurate positioning.
To improve the feature resolution of the positioning system,both the method of formation of fingerprint data and the similarity metrics are studied and improved simultaneously in this paper.On this basis,a CSI fingerprint-based localization method called DFFEDR is proposed,which improves the feature resolution and localization accuracy from two aspects and has good noise immunity at the same time.The main contributions of this paper are summarized below:
1.Dynamic Fusion Feature (DFF) is proposed as a new fingerprint formation method.By establishing context-adapted dynamic weight values that incorporate amplitude and phase information,the location characteristics of fingerprints are enhanced while reducing data complexity.
2.Edit Distance on Real sequence(EDR)is used to measure the similarity between fingerprint data for the similarity metric determination.To our knowledge,this is the first time EDR has been used in CSI fingerprint data matching efforts.On the other hand,to better adapt to the complex environment,we set the matching threshold required during the computation of EDR to a dynamic value that varies with the data characteristics,using the improved edit distance on real sequence(IEDR)as the metric of similarity.
3.An indoor fingerprint positioning method based on DFF and IEDR called DFF-EDR is proposed,and a Wi-Fi system with a frequency band of 2.4 GHz and a bandwidth of 20 MHz is built in two indoor scenes.The experimental results show that the method proposed in this paper further improves the fingerprint feature resolution and positioning accuracy in terms of both fingerprint data formation and similarity metrics and has stable performance in noisy environments.
The remaining parts of the paper are as follows:Section II introduces the preparatory work,including the introduction of CSI position information and the pre-processing of amplitude and phase;Section III investigates the fingerprint library formation method DFF and the similarity measure IEDR;Section IV introduces the experimental verification and analysis of experimental results;Section V summarizes the work.
II.PRELIMINARY PREPARATIONS
2.1 CSI Basic Introduction
Because of the multipath effect,CSI utilizes a Wi-Fi system that takes multiple paths from the transmitter to the receiver.The complexity of the indoor environment results in each path having a different time delay,phase shift and power attenuation.For complex and variable multipath signals,we need to build spatial linear filters to distinguish the paths[24].In the case of constant time,the channel impulse response(CIR)of the wireless channel can be expressed as follows:

whereNdenotes the total number of transmission paths andαi,θi,andτidenote the amplitude,phase,and delay information of pathi,respectively.The channel impulse response specifically describes the time domain characteristics of each path.By performing a Fast Fourier Transform(FFT)on the CIR,we can obtain the channel frequency response(CFR),which is expressed as:

whereH(ω)represents CFR,and the remaining variables have the same meaning as in Eq.(1).
In the actual measurement process,CFR data is obtained by sampling at predetermined time intervals to obtain the amplitude and phase data of each subcarrier.In this way,the required CSI data can be collected.The CSI data collected through the Wi-Fi-OFDM system can be expressed as follows:

whereH(fk)represents the CSI value on carrierfk.A complete CSI value contains both amplitude and phase information and is expressed as follows:

Where|H(fk)|and ∠H(fk) represent the amplitude and phase values of CSI data on the carrier,respectively.
In summary,CSI can reflect the characteristic information of the channel during the signal transmission.Under the multipath effect,CSI is determined by distance,scattering,decay and power attenuation.In complex indoor environments,different locations can reflect unique CSI data characteristics,and therefore can be used for indoor positioning.
This paper’s CSI collection relies on the IEEE 802.11n protocol for the transmission and reception of CSI signals via commercial Wi-Fi devices and IWL 5300 NICs.After each measurement point is completed,a file containingPpackets is generated,and each packet contains aQ×Rmatrix,whereQandRrepresent the number of antenna pairs and the number of subcarriers,respectively.In this paper,three antennas are used to collect 30 subcarriers.The specific environmental arrangement and packet parameters are described in Section IV.
2.2 Amplitude Preprocessing
The numerical information on the amplitude of each CSI subcarrier is spatially specific in a region due to the different multipath conditions at different spatial locations.Figure1a,1b shows the amplitude data for 500 packets collected from two different locations.Obviously,the amplitude data from the different locations are distinctly different.On the other hand,different levels of noise information are also included in the raw amplitude data of CSI.

Figure1.CSI amplitude data measured at different positions.
Figure1c,1d is a box plot representation of the amplitude information at two different locations in Figure1a,1b.The box plots can reflect the dispersion of the data.It can be seen from the figurethat the distance between the upper quartile and the lower quartile of the data is short and relatively stable.Combining the above analysis,the characteristics of the centralized distribution of amplitude information can be used to filter it,to achieve noise removal and improve the characterization of the data.
The effectiveness of the pre-processing of amplitude data depends on whether the valid data is truly separated from the noise data.Several methods for processing CSI amplitude information have also emerged in recent years.The work in[23]averages the amplitude data packets at a point in time with the packets at the before and after moments to generate filtered data,and the packets are filtered by calculating the covariance values of the amplitude data packets and the filtered data.The work in[15]enables lightweight pre-processing of CSI amplitude data by counting the plurality of amplitude data on each sub-carrier.
Since the effective data distribution of CSI amplitude is concentrated,the processing of amplitude information using density-based clustering algorithm can achieve good results.Therefore,we consider preprocessing the CSI amplitude data using the DBSCAN[25]algorithm,which can filter out data clusters with higher density through the tightness of the data distribution and has good anti-noise ability.Using the DBSCAN algorithm,we filter several data clusters from the measured data and form them into collectionsC=C1,C2,...Cm.Taking advantage of the concentration of the effective data distribution of the amplitude,the clusters with the largest amount of data in them are selected and extracted by the following formula.

whereµindicates the number of samples contained in theith data cluster.For all 30 subcarriers,the data of each subcarrier is formed into data clusters using DBSCAN,then the data clusters with the largest number of samples are obtained and the pre-processed amplitude data can be obtained by averaging the data in them.The specific expressions are as follows.

whereAmppre(fk)represents the amplitude data after pretreatment on thekth subcarrier.Ampj(fk) represents thejth amplitude data of the largest data cluster on thekth subcarrier,andNfkrepresents the number of samples contained in the largest data cluster on the different subcarriers.In summary,the pre-treatment amplitude of positions A and B based on density clustering is shown in the following figure.
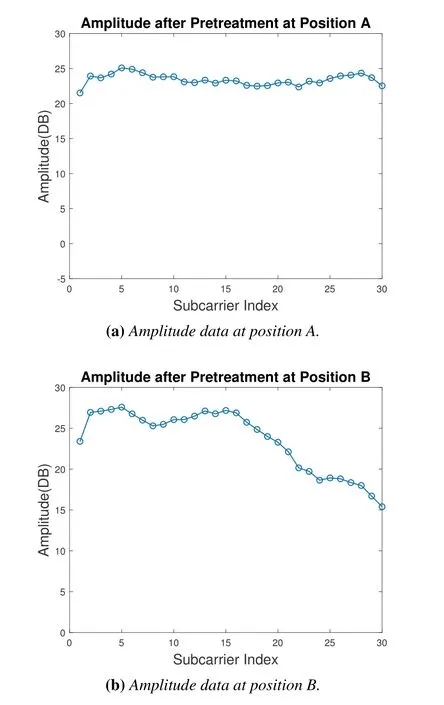
Figure2.Pre-processed CSI amplitude data at two test locations.
It can be seen from the pictures that the preprocessed amplitude data retains the trend and characteristics of the original data and succeeds in suppressing the noise data.On the other hand,by reducing the amount of data on each sub-carrier in the CSI amplitude information,the system calculation speed is improved.
2.3 Phase Preprocessing
For the measured CSI phase data,we collected phase information for the three receiving antennas at the same two position points (position A and position B)as in section 2.2.The raw phase information is shown in the figurebelow.
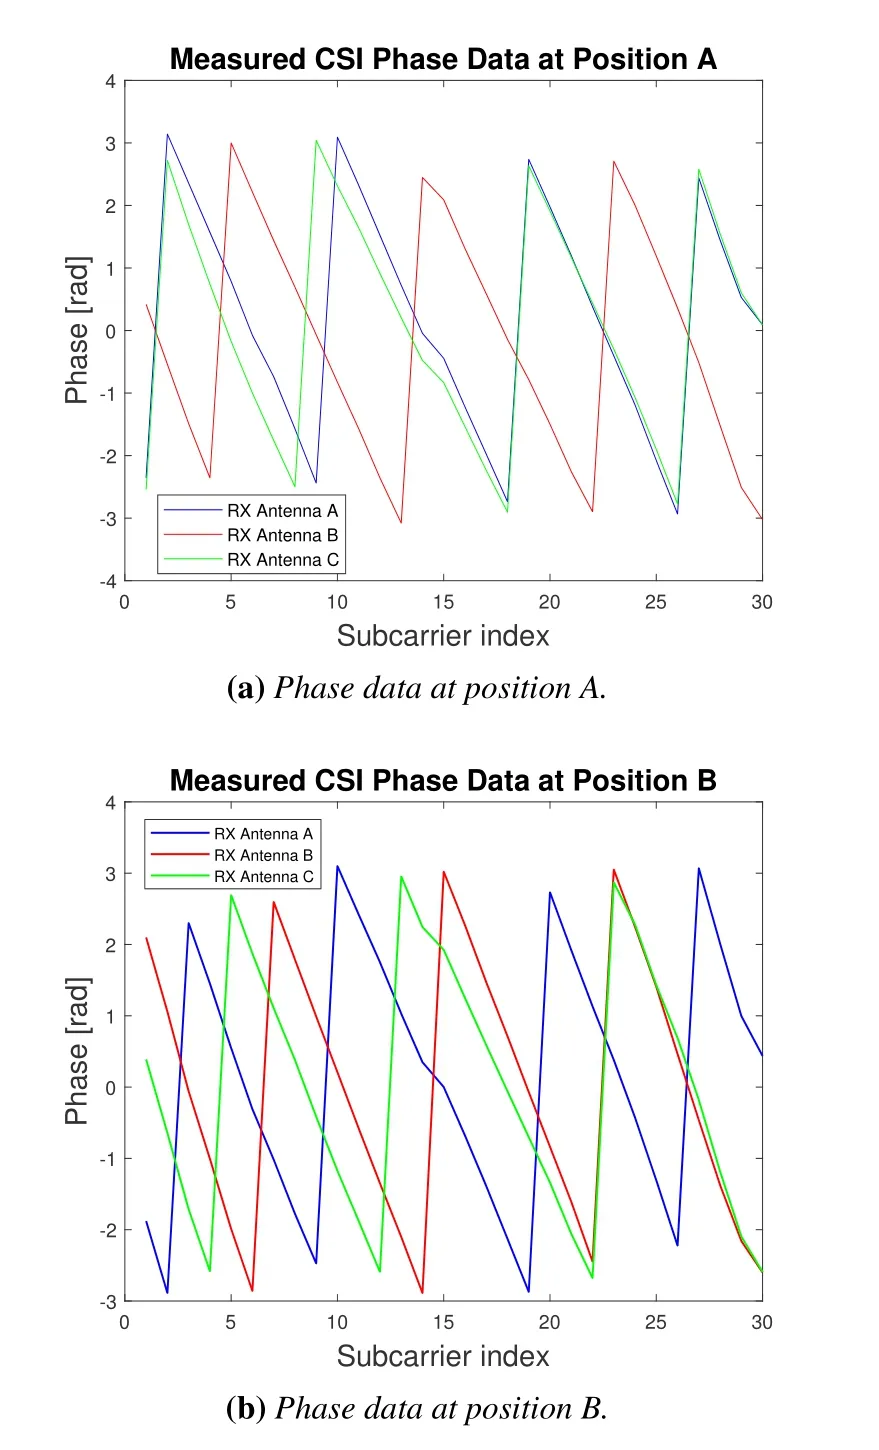
Figure3.The raw phase data at two test locations.
As can be seen from Figure3,the phase data derived from direct measurements will have a folding phenomenon due to their own recurrence characteristic [26],which keeps the size of the phase in the region of [−π,π].Therefore,in order to characterize the phase,further unwrapping of the phase is required.The phase values after unwrapping are shown in the figurebelow.
Due to the carrier frequency offset(CFO)caused by the transmitter and receiver center frequencies not being perfectly synchronized and the sample frequency offset (SFO) caused by the clock not being synchronized,the value of the phase after unwinding tends to decrease with the subcarrier index.The true measured phase information[27]for each subcarrier is expressed as follows.

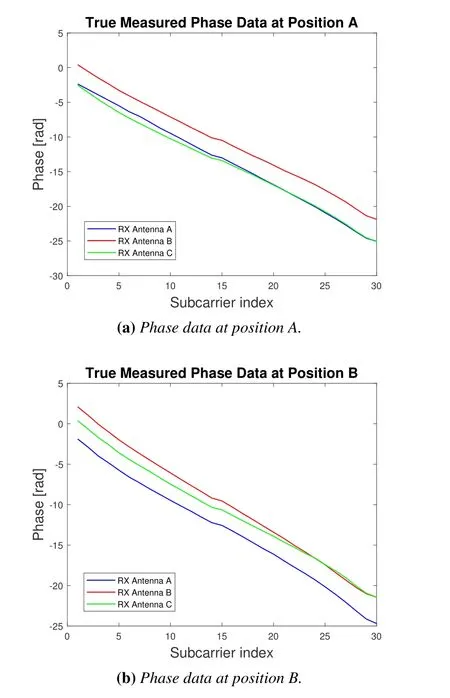
Figure4.The unwrapped phase data at two test locations.
whereψkdenotes the true phase value,Kkdenotes the index value of the th subcarrier,Nis the fast Fourier transform size,δis the time lag due to the SFO,βis the unknown phase shift due to the CFO,andZis some measurement noise.δ,βare difficult to measure,and existing works typically eliminate the error through a linear transformation.The slope of the linear calibration of the phase and the value of the offset are calculated as follows.
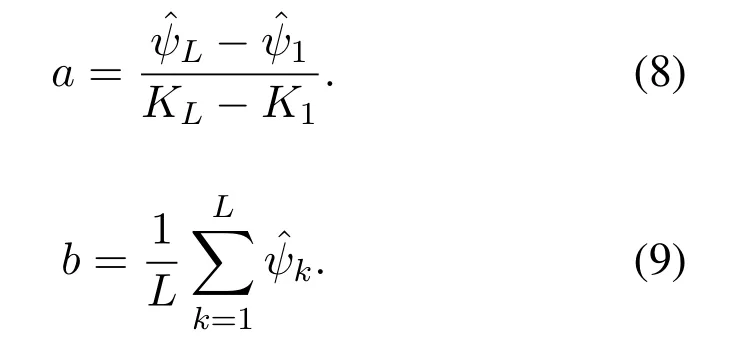

whereais the slope,bis the offset,andis the corrected phase value.The last calibrated phase values of position A and position B are shown in Figure5.It can be concluded that by unwrapping and linearization,the calibrated phase effectively removes the error factor of the original measurement data and has the position characteristics that can be used as fingerprint data.The resulting phase dataPhapre(fk)=will be fused to the pre-processed amplitude data with the fusion algorithm in Section 3.2.
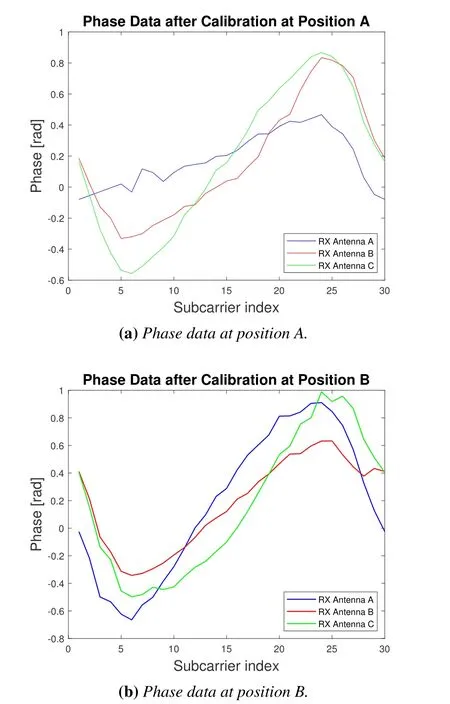
Figure5.The calibrated phase data at two test locations.
III.INTRODUCTION AND DESIGN OF THE DFF-EDR METHOD
Based on the collection and pre-processing of CSI amplitude and phase data,this section first introduces the DFF-EDR positioning method,and then introduces the DFF features that integrate amplitude and phase information in the fingerprint database building process and the IEDR similarity calculation metric used in the positioning matching stage,including the specific implementation process of the algorithm and the selection of relevant parameters.
3.1 Overview of the DFF-EDR Method
The flow diagram of the DFF-EDR localization method proposed in this paper is shown in Figure6,which is mainly divided into two stages:offline data collection stage and online fingerprint matching stage.The specific operating steps for each stage are given in Figure6.During the offline data collection stage,CSI data were collected at several defined locations,and the data were then filtered using pre-processing algorithms for amplitude and phase as described in Section II.Next,the pre-processed amplitude and phase data for each location are fused to form a fingerprint data DFF,which is used to store location-specific information in the fingerprint database.In the online fingerprint matching stage,the CSI data are collected at a random location and the phase preprocessing work described in Section 2.3 is performed,the same fingerprint data DFF is generated as in the offline stage,the IEDR similarity metric is used to calculate the similarity between the CSI fusion data in the measurement phase and each location in the fingerprint database,and finally the location information is confirmed based on the matching results.Two key components of the positioning method,the”DFF fingerprint data”and the”IEDR similarity measure”,will be described in detail next.
3.2 Establishment of the DFF
The amplitude and phase information of CSI are two important pieces of information with certain positional specificities that are obtained by measurement.By pre-processing the amplitude and phase information for each location in Section 2.2 and 2.3,followed by inductive integration,the resulting results can be stored in the fingerprint library as fingerprint information for each measured location.Due to the relative stability of amplitude information,there are many fingerprint location techniques based on amplitude information in past studies,such as works in [16,19,20].In recent years,as phase information measurement and pre-processing techniques began to become available,several phase-based fingerprint positioning techniques have emerged,such as works in[18].In addition,more techniques have emerged to fuse amplitude and phase information,and the construction of a fingerprint library from the information features of both amplitude and phase can improve positioning performance to a certain extent.
In past research,there are roughly three types of amplitude and phase fusion techniques:the first type is the direct formation of position fingerprints from the pre-processed amplitude and phase information,such as works in [17,21].This type of approach enriches the characteristics of the data by expanding the amount of data in the fingerprint.However,too much data can affect the timeliness of positioning,and more complex data may be more susceptible to receiving noise points;The second type is the combination of amplitude and phase using arithmetic (e.g.,summing,multiplying),which combines the two sets of data to form a location fingerprint,such as works in [22].This approach incorporates information on amplitude and phase without compromising computational efficiency,but simple arithmetic combinations do not achieve the objective of effectively reducing the impact of noise data;The third category achieves the effect of reducing data complexity while also reducing noise impact by assigning separate weights to amplitude and phase information.The work in [23]utilizes this combination of weight-based amplitude,but this method is implemented gradually by setting initial weights and then reusing iterations,which greatly increases computational complexity.On the other hand,considering that each location point environment is different,the degree to which the amplitude and phase information acquired at different locations reflects the feature should be variable,so the definition of weights should also be dynamic rather than static.Combining the above analysis,this paper proposes a new dynamic fusion feature (DFF) that combines amplitude and phase information as a new way of fingerprint formation,where the amplitude and phase information of each location are fused using dynamic weights without iteration,and DFF can ensure the characterization of fingerprint data as much as possible while ensuring computational efficiency.
After preprocessing the CSI data of a location point,assuming that the preprocessed amplitude data on thekth subcarrier isAmppre(fk) and the preprocessed phase data isPhapre(fk),the weighted fusion of the amplitude and phase data using the method proposed in this paper can obtain the new fused location feature dataDFF(fk)as follows.

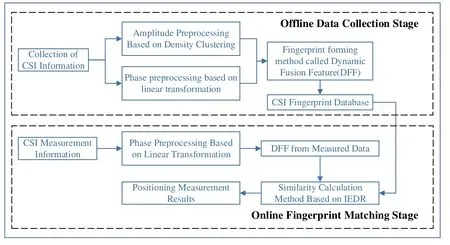
Figure6.The flow diagram of the DFF-EDR localization method.
whereαandβare called the fusion weight values for the amplitude and phase data,respectively,which represent the proportion of the amplitude and phase data adopted in the fusion feature data.On the other hand,αandβalso satisfy the following numerical constraints.

The new method of fingerprint formation called DFF proposed in this paper is mainly reflected in the fact that both a and b are location specific by weighted fusion.Our hardware device can collect three sets of amplitude and phase data at each location with three antennas,and the three antennas will not change position during data collection.Then for the amplitude and phase data,if the correlation between the three antennas collected at a test location between the three sets of Class A data is smaller than the correlation between the Class B data,indicating that the Class A data in this test location of the location discrimination is stronger than the Class B data,then it can be considered in the establishment of the fingerprint data at that location,making the weight of Class B data lower than the Class A data.With the above analysis,we consider the correlation between the data as a reference for the fusion weight values.A certain type of data(amplitude data or phase data) collected at a test location,after preprocessing,can be expressed as follows.

whereDm,nrepresents the value of the data collected by themth root antenna on thenth subcarrier.For the vector data{D1,D2,D3}corresponding to the three antennas,to ensure that the correlation measures of amplitude and phase are at one order of magnitude,we normalized the vectors to obtain the normalized vector data{η1,η2,η3}before performing correlation analysis.The covariance was then calculated for the three sets of normalized vector data,resulting in the following covariance matrix.

whereCov(ηa,ηb) denotes the covariance factor of vectorsηaandηb.Since the covariance matrix is symmetric,and because of the prior normalized treatment,the values on the diagonal are all 1.Next,the eigenvalue operation is performed on the covariance matrix to obtain the eigenvalueλ1,λ2,λ3.By analyzing the covariance matrix and the vector data features,we know that the eigenvalue of the covariance matrix reflects the category distribution of the multidimensional data features,and if the correlation between the data is stronger,then the category distribution will be more concentrated,and conversely,it will be more distributed.As the sum of the elemental values of the main diagonal of the matrix is constant 3,the sum of the eigenvalue values is also constant 3.Under the same conditions,the degree of concentration of the eigenvalue value magnitude can be used as an indication of the correlation between the vector dataη1,η2,η3.After obtaining the eigenvalue of the covariance matrix,we obtain the maximum eigenvalue by the following formula.

λmaxrepresents the maximum eigenvalue of the covariance matrix.Obviously,the more concentrated the eigenvalue value size distribution,the larger the value ofλmaxwill be.Through the above analysis,λmaxcan be used as a parameter to measure the correlation between the data collected by the three antennas.Considering that the correlation between the data and the weight values are negatively correlated,the calculation of the dynamic weight values can be expressed by Eq.(16).

whereλamp,λpharepresent the maximum eigenvalues obtained by correlation analysis of the amplitude and phase data,respectively.Through the data correlation analysis described above and the calculation of dynamic weights,corresponding weight values for the amplitude and phase data can be derived at each test location,resulting in fusion data.Since the weight values are dynamic and location specific,it improves the characterization and robustness of the location fingerprint data to some extent,which helps to improve the accuracy of positioning.We finally collated the data from the three antennas to form the new CSI location fingerprint data DFF as follows.

whereDFFijrepresents the fused fingerprint data on thejth subcarrier collected by theith antenna.DFFcsiis a 1×90 vector data that represents the DFF fingerprint information of the CSI at the fixed location.The specific algorithm for calculating the similarity metric for fingerprint information matching will be presented next.
3.3 IEDR:A New Metric of the Similarity of Location Fingerprints
In the online fingerprint matching stage of the fingerprint location method,CSI data collected online at unknown locations need to be matched to the location fingerprint data in the fingerprint library by similarity metrics.So,the way the similarity metric determines the effectiveness of the match is also an important factor that affects the positioning accuracy.
There are many similarity metrics that have been used in the past for the online matching stage (e.g.Kullback-Leibler scatter).More common,however,are similarity metrics based on Euclidean distances,because Euclidean distance calculations are simpler and surprisingly competitive with other,more sophisticated methods,especially when the database size is large [28].Of course,the Euclidean distance has its limitations.Because the mapping between sequence points based on Euclidean distance is fixed,similarity analysis is an accumulation of data distances under the same label for the sequence,which may result in cumulative errors due to fluctuations in data noise.In recent years,the use of time reversal resonating strength (TRRS) [29]as a similarity metric has been proposed,which is somewhat better than the Euclidean distance-based approach.However,this approach is more limited by bandwidth,and the matching effect deteriorates as bandwidth decreases.The work in[22]mitigates the accuracy degradation due to limited bandwidth with a spatial clustering approach for TR-based methods but does not really address the impact of bandwidth.
In response to the above problem,a similarity metric is needed that significantly outperforms Euclidean distances in terms of similarity matching performance and is not overly constrained by constraints such as limited bandwidth.The Euclidean distance is a lockstep measure that uses ”one-to-one” mapping of data points and is sensitive to bias and noise in the data.In order to better reduce the impact of noise,we have constructed a similarity metric called IEDR based on the EDR distance,which is based on the idea of editing distance [30],on the one hand,we use the ”oneto-many” data mapping method and allow the throwing of anomalous data points,and on the other hand,we quantify the distance between elements as 0 and 1,which avoids the superposition of anomalous values and reduces the impact of anomalous data to some extent.Next,an IEDR was formed by changing the fixed matching threshold parameters in the EDR to dynamic parameters influenced by the environment,further improving the environmental adaptability of the fingerprint matching stage.
3.3.1 EDR Implementation Process
EDR is a modified computational metric based on edit distance to measure the similarity between two sequences and is widely used in bioinformatics and speech recognition.Edit distance is used to measure the number of operations (insertion,output,and substitution) required to convert from stringAto stringB[31].Since what is actually required is a matching of trajectory sequences rather than strings,in the definition of EDR,assuming thatriandsjare a pair of trajectory elements on the trajectory vectorsRandS,respectively,and defining a matching threshold parameterε.The matching criteria between the elements on the trajectory vectorRandSare consistent with the following equation.

wherematch()is used to determine whether the two elements meet the match criteria andd(ri,sj) is the Euclidean distance between the two element points.Based on Eq.(18),the EDR between the trajectory vectorsRandSis defined as Eq.(19).
whereRndenotes the trajectory vector consisting ofnelements before the trajectory vectorRandSmdenotes the trajectory vector consisting ofmelements before the trajectory vectorS.The value of the variableρis chosen with respect to the matching criterion of the elements on the trajectory vector.According to Eq.(18),in calculating the EDR values for the trajectory vectorsRnandSm,ρ=0 whenmatch(rn,sm)=trueandρ=1 otherwise.Solving the EDR between two complete vectors is a dynamic programming process,where the EDR values of the sub-vectors are computed to arrive at the EDR value calledEDR(R,S) between the complete trajectory vectors R and S,which completes the measurement of the similarity of the trajectory vectors.
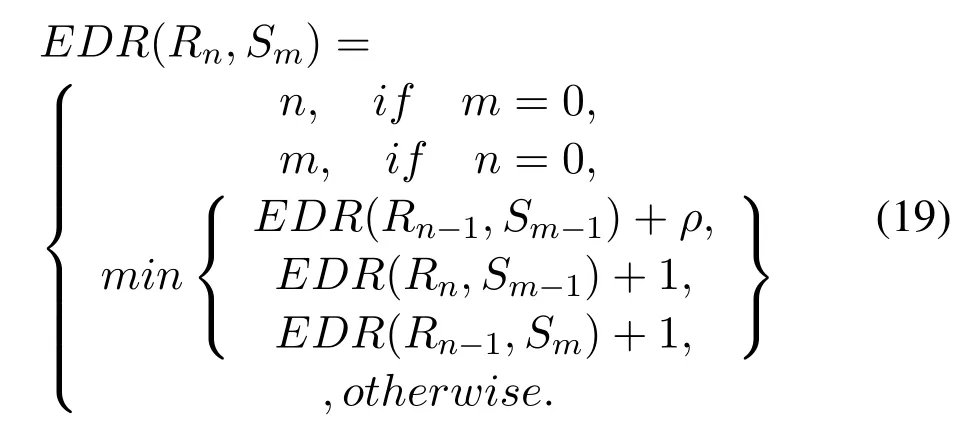
As shown in Figure6,after collecting and processing online data at unknown locations,we used EDR to perform similarity calculations between the online data fingerprint and the offline location fingerprint database.Since the distance values derived from EDR represent the shortest edit distance between two CSI fingerprint data,which is inversely related to the similarity between the fingerprints.The EDR of the two CSI fingerprints was calculated and the similarity was then derived,as shown by the following formula.

whereγ(P,Q)denotes the similarity between the fingerprint dataPandQcalculated by the EDR method.θdenotes a number infinitely close to zero and greater than zero,to avoid a situation where the denominator is zero.Using the similarity metric above,fingerprint data can be matched in our CSI fingerprint location method to confirm location.
3.3.2 Selection of Matching Threshold Parameters
The specific implementation process of the EDR is described above.However,for different types of trajectory vectors,different matching threshold parametersεneed to be configured when measuring with EDR,which has achieved a more ideal matching effect.
To better complete the selection of matching threshold parameters,it is necessary to observe the basic characteristics of the offline and online data involved in the measurement.CSI data were collected and preprocessed for two location points,and then DFF fingerprint information was generated.The DFF data obtained from the same location point during the offline data collection stage and the online fingerprint matching stage are shown in the following figure.
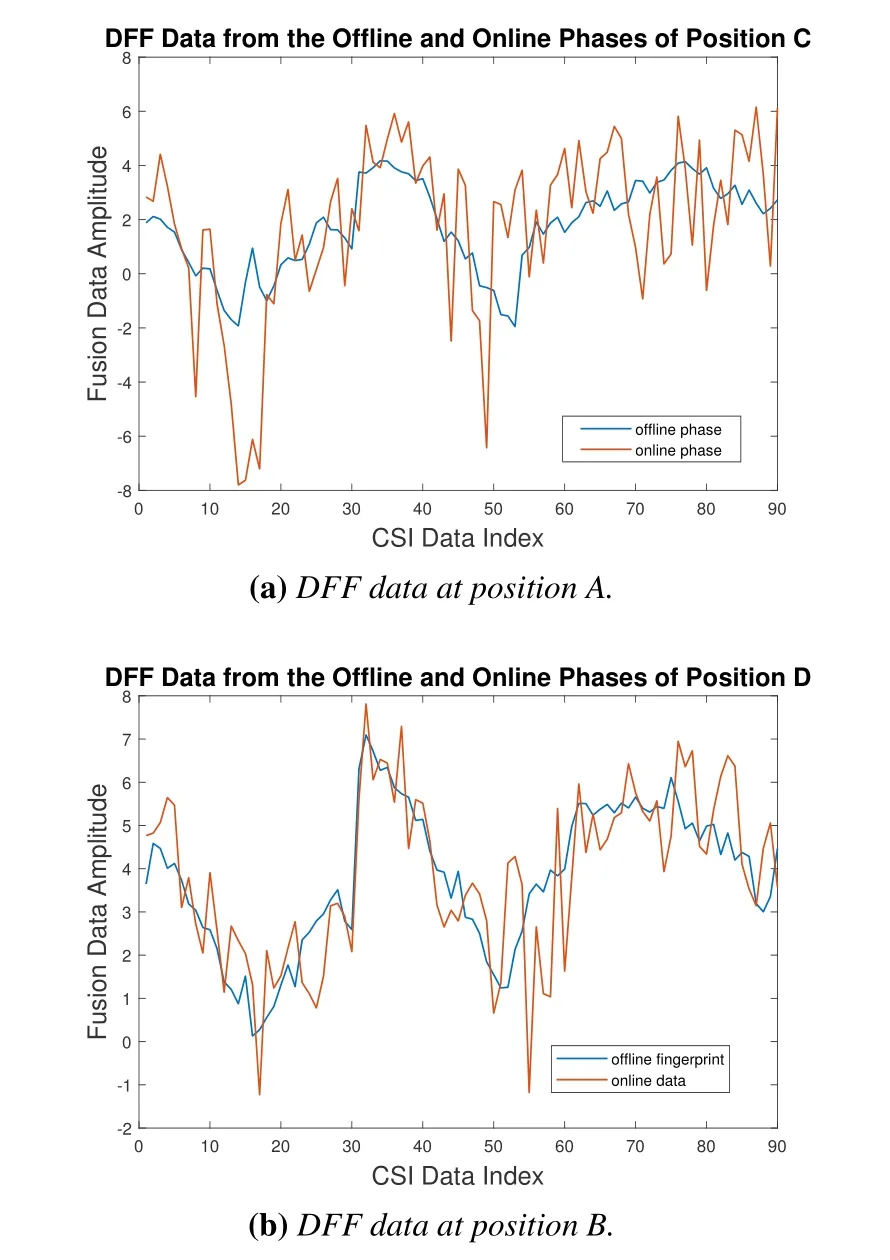
Figure7.DFF data from the offline and online stages at two test locations.
Looking at the above images,the offline stage has a similar trend to the online stage,while the data collected in the online stage contains some noise information that can cause fluctuations in the data because it is not denoised.Due to the complexity of the indoor environment,the degree of fluctuation caused by noise information from different locations is uncertain.In the EDR calculation process,the match threshold parameterεis the criterion for determining whether a pair of data points on two sets of track vectors is a ”successful match”.Therefore,in this paper,static matching threshold parameters are not fully adaptable to complex indoor environments when using EDR for similarity calculations.Because for data measured from different locations to online stages,different levels of volatility imply different criteria for”match success”.Therefore,formulating the selection criteria for the dynamic matching threshold parameterεcan further improve the accuracy of the matching compared to the fixed parameter.
Considering that dynamic matching threshold parameters need to be adapted to the degree of signal fluctuation of the online stage DFF data,this paper reflects the degree of signal fluctuation by obtaining the variance data on each subcarrier of the online stage DFF data,and then using averaging to obtain the mean variance of the online data at a location.The specific formula is as follows.

whereMdenotes the number of packets collected in the online stage,Ndenotes the total number of subcarriers contained in the fingerprint data,Lijdenotes the size of thejth subcarrier data on theith packet,¯Ljdenotes the mean value of all packets on thejth subcarrier,and ¯σ2denotes the mean variance of the online measurement data on all subcarriers.With the above calculations,since the number of packets collected in the online stage is sufficiently large,and with reference to the central limit theorem,the difference between the online data and the fingerprint data at the same location at each subcarrier approximates a Gaussian distribution with a variance of ¯σ2and a mean value of 0.According to the Pauta criterion (3σcriterion),the matching threshold parameter can be obtained from Eq.(22).

In summary,a similarity metric called IEDR based on EDR distance is established by generating dynamic matching threshold parameterε,which can better characterize and match signals in complex environments.The next part of the experiment will verify the advantages of the positioning methods proposed in this paper by comparing and analyzing the performance of different positioning methods in a real experimental scenario.
IV.EXPERIMENTAL VALIDATION AND ANALYSIS OF RESULTS
In this section,the experimental procedure and results are presented.First,the layout of the experimental scenario and the implementation of the CSI data collection system are introduced.Next,the evaluation and analysis of the DFF fingerprint formation method and the IEDR similarity calculation metric proposed in this paper are carried out,mainly focusing on the comparison of the fingerprint matching resolution in the same scenario and the anti-noise ability of the localization method in different scenarios.Finally,the performance of the proposed localization method is compared with various localization methods.
4.1 Test Scenario and Implementation
In the experiment,we chose two indoor scenarios,one is located on the 9th floor of the research building of Beijing University of Posts and Telecommunications (BUPT),named Test-bed 1,and the other is located on the ground floor of the same building,named Test-bed 2.The CSI data collection experiment was mainly conducted in the above indoor scenario.Both the transmitter and receiver of the signal use mobile devices carrying Intel 5300 NICs,with one antenna installed in the transmitter device and three in the receiver device.With the Linux CSI tool,we can control the device and extract CSI data by modifying the NIC driver.In two indoor scenarios,data acquisition was performed using a 2.4GHz signal with a 20MHz bandwidth,and CSI data was measured twice at each reference point for the offline stage to establish a fingerprint library and the online stage for fingerprint matching.With a sampling rate of 100 packets per second at each test site and a duration of approximately 1 minute per test,6000 CSI packets can be collected at each location for further data processing.On the other hand,the environment in the test area will remain relatively stable during the measurement.
As shown in Figure8,Test-bed 1 is a rectangular area of 18.2m by 8.4m,containing three test environments:an office,a meeting room,and a corridor,where the meeting room and office are separated by a glass wall.The test environment had many computers,desks and cabinets and was one of the more complex indoor environments.We laid out 59 test points(blue dots in the picture)and four fixed devices for signal reception,and one as a mobile device to transmit signals to other devices,keeping the distance between most of the reference points at 1.2m.In order not to interfere with the normal work of the office,our experiment was conducted during non-working hours,during which a small number of people moved around,and the environment was relatively stable.
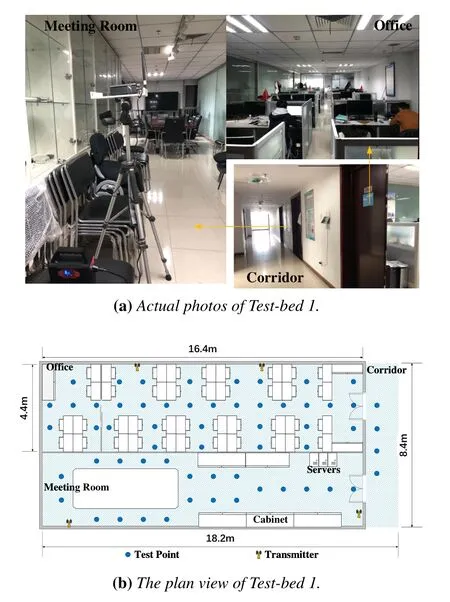
Figure8.Schematic diagram of the experimental scenario of Test-bed 1.
To more fully evaluate the applicability of the methods presented in this paper in different environments,we also performed CSI signal collection in Test-bed 2.The specific environmental arrangement is shown in Figure9,where the signal collection area is a rectangular area of 19.50m by 4.50m with 59 test points(blue dots in the picture).Three fixed devices(yellow icons in the figure) were placed in the area for signal reception,and another device was used as a mobile device to transmit signals to the other three devices,with 1.5 m between two adjacent reference points.The experimental environment was more complex than Testbed 1 because of the frequent movement of vehicles in the underground garage and the number of vehicles parked there.
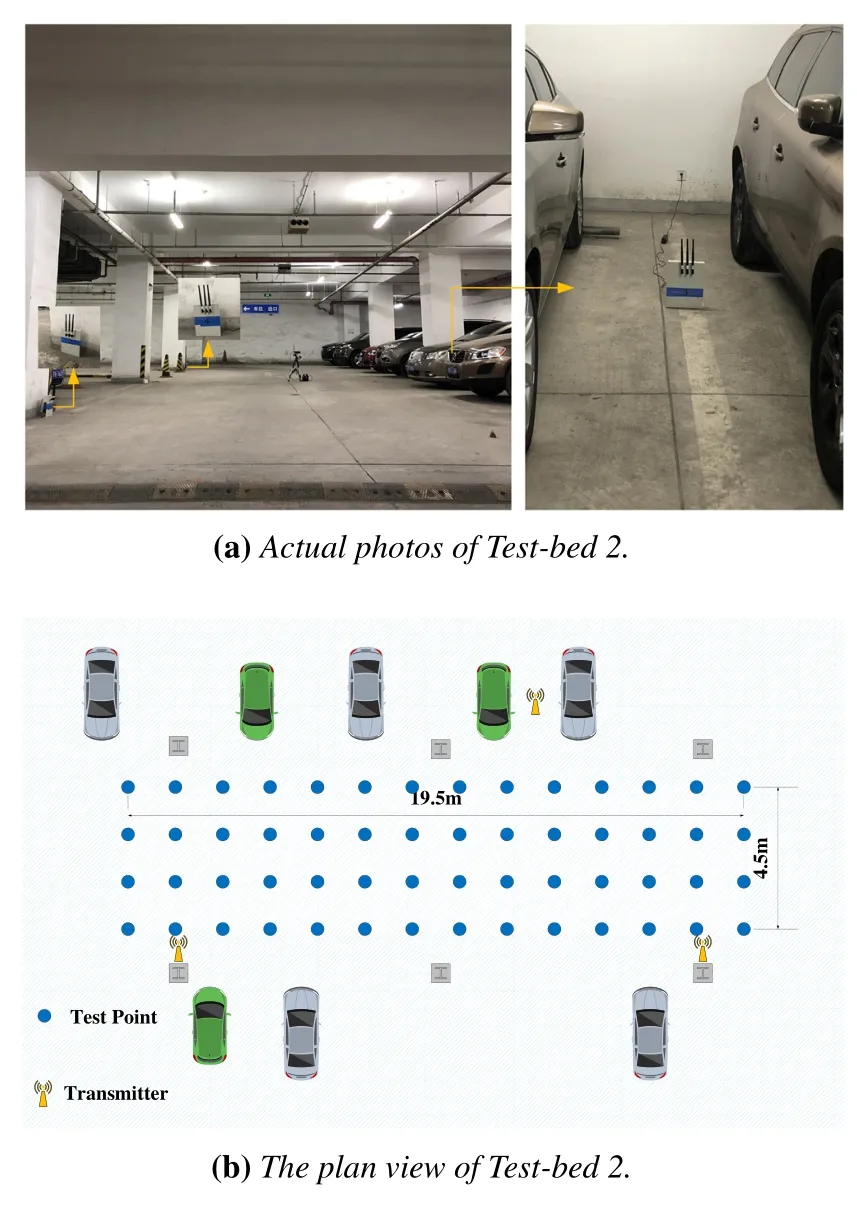
Figure9.Schematic diagram of the experimental scenario of Test-bed 2.
4.2 Feature Resolution Analysis and Evaluation
In order to effectively evaluate the positioning performance of the proposed positioning method,the CSI data collected in the scenario during the offline training stage and online matching stage were preprocessed for amplitude and phase according to the method in Section II,and then the pre-processed data were sorted according to the location of the reference points to facilitate the processing and matching of the CSI data from each reference point.
This section provides a comparative analysis in terms of both fingerprint data formation and similarity metrics.In terms of fingerprint data formation,the improvement in feature resolution of DFF fingerprint information compared to amplitude information versus phase information is discussed,and in terms of similarity metrics,the improvement in feature resolution using the IEDR method compared to TRRS,Euclidean distance (ED),and DTW is discussed.The receiver operating characteristic(ROC)curve and the area under curve(AUC)value will be used to compare the characteristic resolution.Among them,the ROC curve is widely used in screening classification models,reflecting the performance of the classification in terms of true positive rate(TPR)and false positive rate(FPR),and the AUC value is the integral area of the ROC curve.The closer the overall curve is to the coordinate point(0,1)and the value of the AUC is closer to 1,the better the screening performance of the model.
In summary,similarity matrices are generated by matching CSI fingerprint data from each reference point in the offline training stage and the online testing stage,and in order to compare the similarity matrices formed by the different methods,we normalize the similarity matrices.The ROC curves and AUC values of the normalized matrix are then compared to complete the evaluation and analysis of the performance of different positioning methods.
4.2.1 Improvement in Feature Resolution by DFF Fingerprints
This section is concerned with the improvement of feature resolution by positioning methods in the formation of fingerprint data.We used the CSI position data obtained from two experimental scenarios to form three different types of fingerprint data:DFF fingerprint data,amplitude data,and phase data.In order not to lose the generality,the similarity between fingerprints is calculated by the IEDR method.Next,the evaluation of positioning performance under different fingerprint data conditions was completed by comparing ROC curves and AUC values against a normalized similarity matrix.The normalized similarity matrices for the two test scenarios are shown in Figure10,and the ROC curve versus AUC values are shown in Figure11 and Table1.
Figure10 shows the similarity matrix of the two test scenarios in the form of color map.In this figure,the color of each grid indicates the magnitude of similarity between the fingerprint data in the training stage and the testing stage,and closer to the red grid area means more similarity between the corresponding fingerprint data.Ideally,CSI data collected during the training and testing stages from the same reference points should have more similarity,in other words,good positioning methods should guarantee as high a similarity value as possible on the diagonal of the similarity matrix.By comparing the color distribution of the color maps formed under different conditions,a preliminary comparison of the resolution of the features embodied in the positioning results can be made.
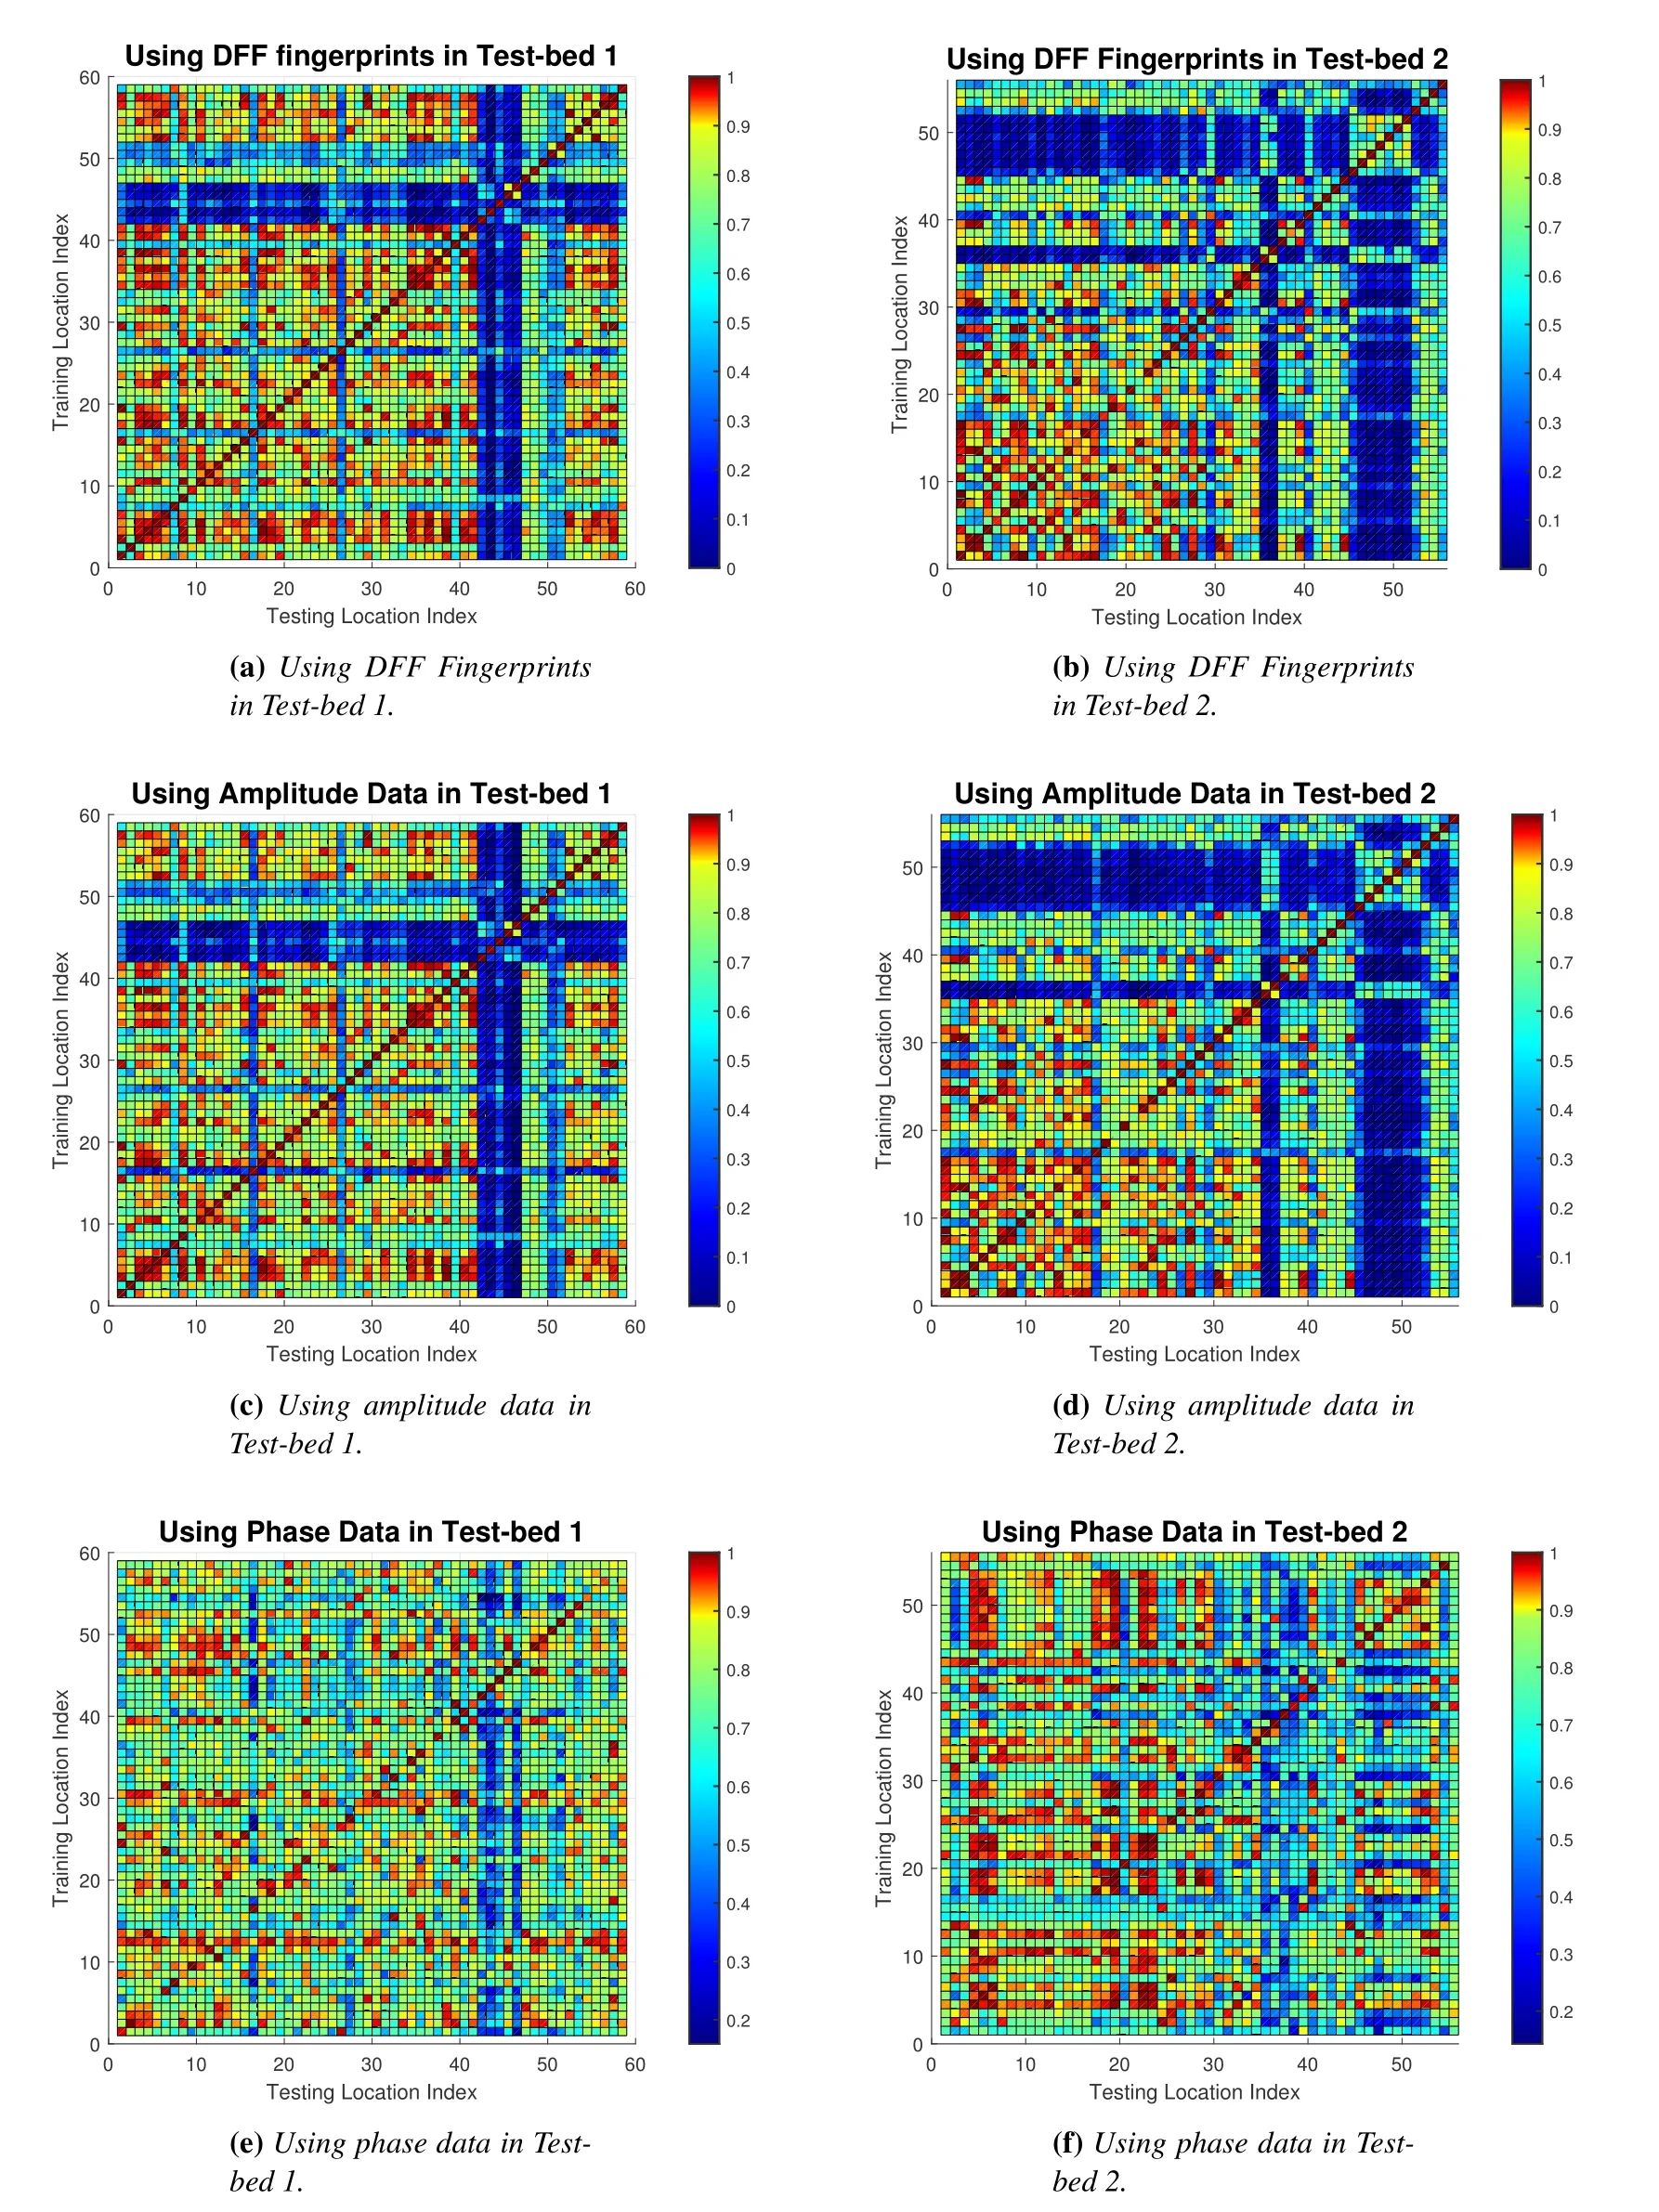
Figure10.The color map of normalized similarity matrixes for different fingerprints in the two experimental scenarios.
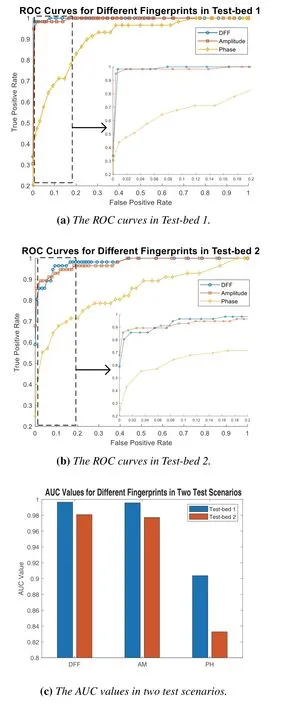
Figure11.Comparison of ROC curves and AUC values between different fingerprints in two test scenarios.
In Figure10,Test-bed 1 has a better similarity matching effect compared to Test-bed 2 under the same positioning method,mainly because Test-bed 2 belongs to the garage environment,where there is a condition of large object motion and the position signal will be more disturbed.On the other hand,the characteristic resolution of the phase data is the lowest in the same positioning environment,while the characteristic resolution of the DFF fingerprint and the amplitude data is not sufficiently significant to be compared in Figure10,and we will next compare them more closely by ROC curves and AUC values.
The ROC curves and AUC values for the three types of fingerprint data in the two positioning scenarios are shown in Figure10 and Table1.By looking at Figure11a,11b,we can see that the ROC curves of the DFF fingerprints are closer to the coordinate points(0,1)both in Test-bed 1 and Test-bed 2.Figure11c and Table1 show that the AUC values of DFF,amplitude and phase are 0.9966,0.9957,

Table1.Comparison of AUC values between different fingerprints.
Figure11c and Table1 show that the AUC values of DFF,amplitude and phase are 0.9966,0.9957,and 0.9037 in Test-bed 1,and 0.9808,0.9772,and 0.8328 in Test-bed 2,respectively,which is an improvement of 0.09% and 10.28% using DDF fingerprint compared to amplitude and phase in Test-bed 1 and 0.37%and 17.78% in Test-bed 2.On the other hand,Figure11c also shows the variation of AUC values for the same fingerprint data in different scenarios,which reflects the environmental adaptability and noise resistance of the different methods.Compared with Testbed 1,the AUC values of the three types of fingerprint data in Test-bed 2 decreased by 1.59%,1.86%and 7.85%,respectively.
From the above analysis of the experimental results,the use of phase information alone has a poorer performance than that of amplitude and DFF,which combines both amplitude and phase information but is not affected by the noise data included in the phase information.On the contrary,the feature resolution and the noise resistance of DFF are further improved compared to the amplitude.In future studies,if higher quality phase information can be extracted and used,the performance of the DFF will be better demonstrated.Summing up the above analysis,the DFF fingerprint can achieve good feature resolution in both test scenarios and has a certain resistance to noise.
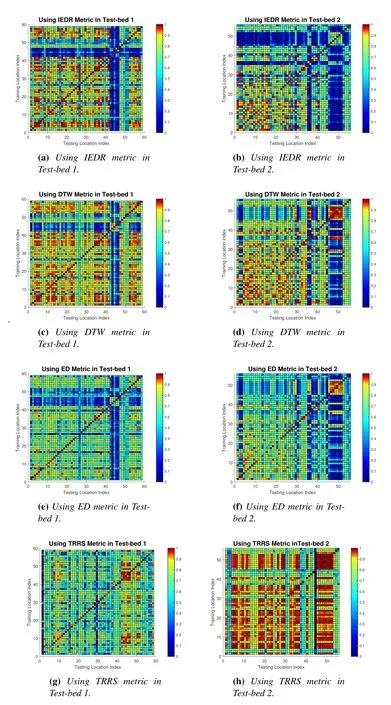
Figure12.The color map of normalized similarity matrixes for different similarity metrics in the two experimental scenarios.
4.2.2 Improvement in Feature Resolution by IEDR Metric
This section focuses on the improvement of feature resolution by positioning methods in terms of similarity metrics.As in Section 4.2.1,we will still evaluate the system performance through the similarity matrix,ROC curve,AUC values.The difference is that this section uses DFF as fingerprint data and compares the feature resolution under different similarity metrics.Comparing the IEDR metric proposed in this paper with the traditional ED,TRRS in [22]and DTW in[15],the color maps of the different metrics for the same fingerprint data are shown in Figure12,and the ROC curve and AUC values are shown in Figure13 and Table2.
Figure12 shows the similarity matrices for the different measures in the two experimental scenarios.Due to less environmental interference,the different measures all exhibit better matching in Test-bed 1,and in Test-bed 2,the similarity matrix generated using the IEDR method has the highest number of high matching points on the diagonal and fewer points with higher off-diagonal matches,Figure13b also shows that the ROC curves for the IEDR measures are closer to the coordinate points(0,1).Figure13c and Table2 showthat the AUC values for IEDR,DTW,ED,and TRRS were 0.9966,0.9847,0.9987 and 0.9903 in Test-bed1,which were 1.2% and 0.6% higher for IEDR compared to DTW and TRRS,respectively.ED had the highest value among the four values,approximately 0.2% higher than IEDR.In addition,the AUC values were 0.9828,0.9601,0.9749 and 0.8988 in Test-bed 2,which was a numerical improvement of 2.4%,0.8%,and 9.3% for the IEDR method compared to DTW,ED,and TRRS,respectively.

Table2.Comparison of AUC values between similarity metrics.
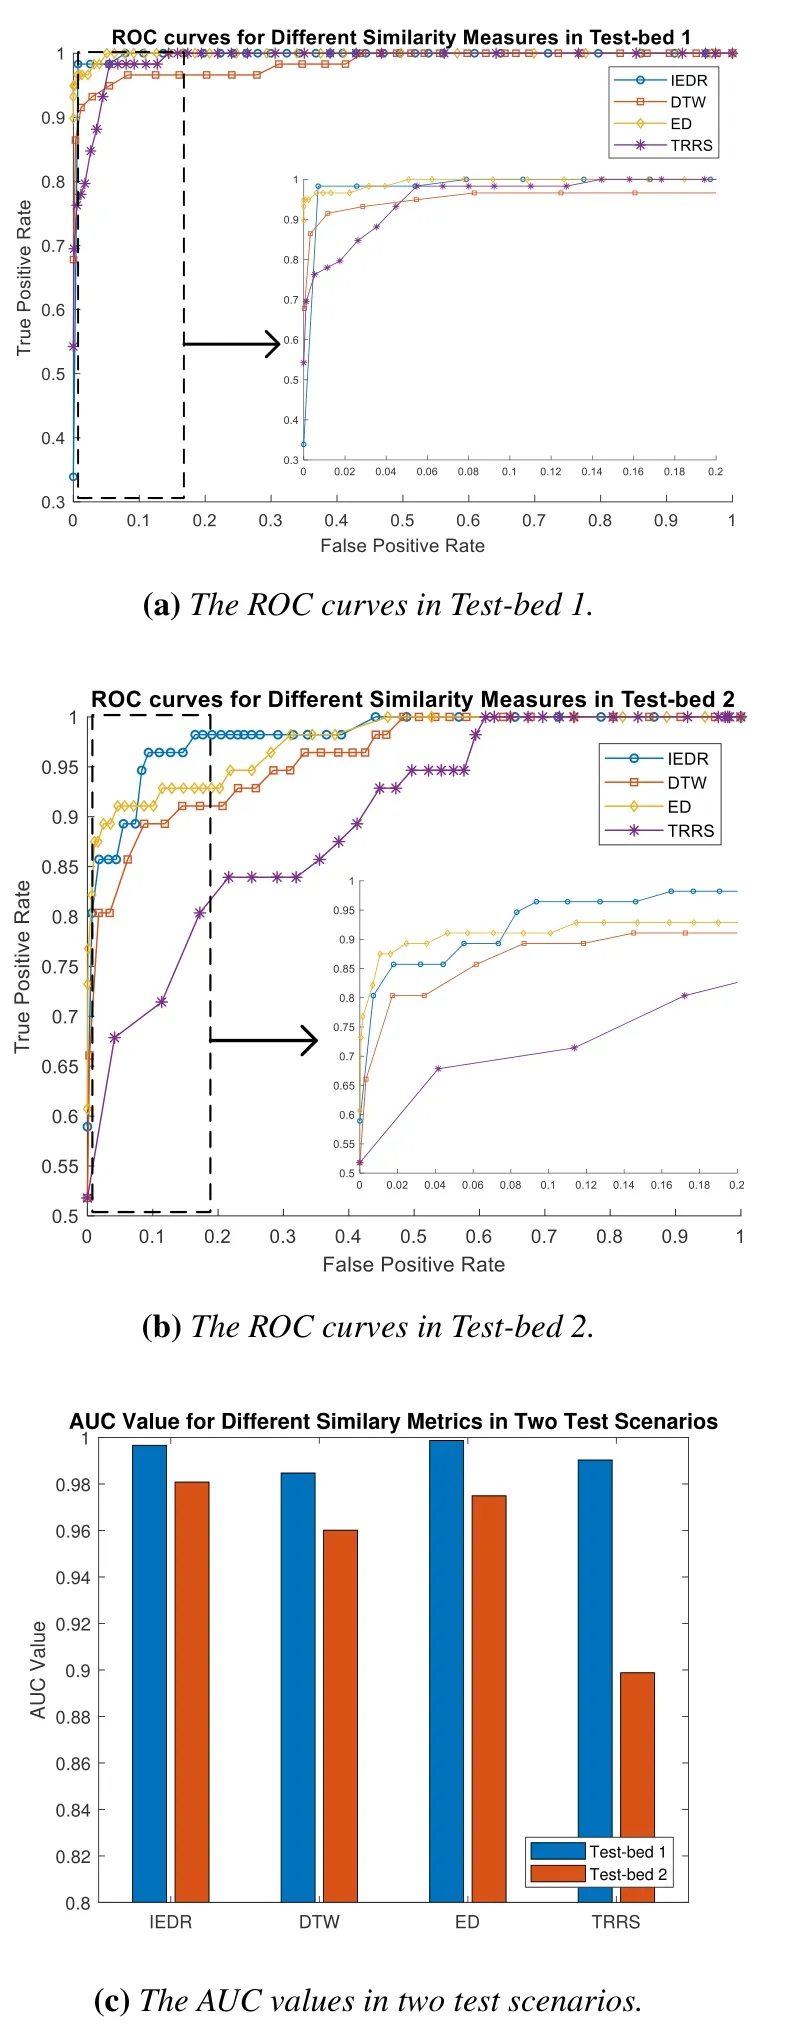
Figure13.Comparison of ROC curves and AUC values between different similarity metrics in two test scenarios.
By comparing the different metrics in the two test environments,it can be found that the IEDR metric has excellent performance in Test-bed 2,and in Testbed 1,both IEDR and ED have higher AUC values,but ED seems to perform better.The reason for this is that Test-bed 1 has less environmental interference and noise data can be filtered out more easily,and the excellent performance of ED also reflects the improved positioning performance of DFF fingerprints proposed in this paper.On the other hand,by comparing the AUC values of Test-bed 1 and Test-bed 2 for the same metrics,the AUC values of IEDR,DTW,ED and TRRS in Test-bed 2 were reduced by 1.6%,2.5%,2.4%and 9.2%,respectively,compared with Test-bed 1,indicating that EDR has better anti-noise interference performance.Taken together,the IEDR metric achieves good feature resolution and better stability in both test environments.
Since we introduced dynamic matching threshold parameters in the calculation of the similarity metrics,in order to analyze the effect of dynamic threshold parameters on the feature resolution enhancement,we additionally set multiple fixed threshold parameters and compared the experimental results with the AUC values in the Test-bed 2 scenario.The results are shown in Figure14.It can be concluded from the figurethat the process of parameter configuration is avoided by using dynamic threshold parameters.On the other hand,the IEDR metric has a better performance on the improvement of feature resolution compared to the fixed threshold parameters,as the dynamic threshold parameters improve the environmental adaptability of the fingerprint matching algorithm.
4.2.3 Improvement in Feature Resolution by DFFEDR
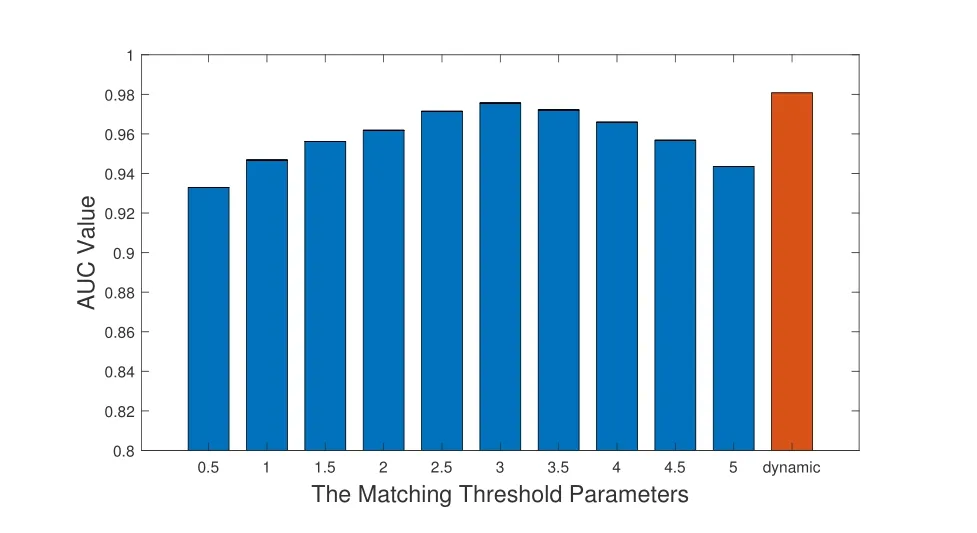
Figure14.Comparison of AUC values between dynamic parameters and multiple fixed parameters.

Table3.Comparison of AUC values between different positioning methods.
The DFF-EDR localization method proposed in this paper combines the DFF fingerprint and IEDR measures.In this section,the improved feature resolution of the DFF-EDR method is evaluated by comparing it with the HATRFLA method in[22]and the CC-DTW method in[15].As in subsections 4.2.1 and 4.2.2,the feature resolution of DFF-EDR,CC-DTW,and HATRFLA is compared by the CSI data obtained in the two experimental scenarios.The color maps for the three positioning methods in the two test scenarios are shown in Figure15,and the ROC curves and AUC values are shown in Figure16 and Table3.
By observing Figure15 and 16,it can be concluded that DFF-EDR has a higher feature resolution in both Test-bed 1 and Test-bed 2 compared to CC-DTW and HATRFLA.For AUC values,DFF-EDR improved by 0.4% and 3.3% compared to CC-DTW and HATRFLA in Test-bed 1 and by 2.3%and 19.8%in Test-bed 2,respectively.On the other hand,the three different localization methods decreased the AUC values by 1.59%,3.27%and 15.15%in Test-bed 2 compared to Test-bed 1,respectively.Obviously,the localization method DFF-EDR,which combines the DFF fingerprint and IEDR metrics,has a higher performance than the other methods and maintains a good resistance to noise in different environments.
4.3 Performance Evaluation and Analysis of the DFF-EDR Method
To further demonstrate the improvement of the DFFEDR method on location performance,we collected CSI data from two test scenarios and then performed IEDR metrics on each reference point using the CSI fingerprint database.The evaluation of the location was completed by filtering high-matching reference location information by performing the k nearest neighbor(KNN)matching algorithm on the matching results.Finally,the performance of the location method is measured by generating the cumulative distribution function(CDF)of the location error and calculating the average location error.Similarly,the CCDTW method and the HATRFLA method will be used for comparison,and the CDF images of the positioning errors obtained by the different positioning methods in the two experimental scenarios as well as the average positioning errors are shown in the Figure17.
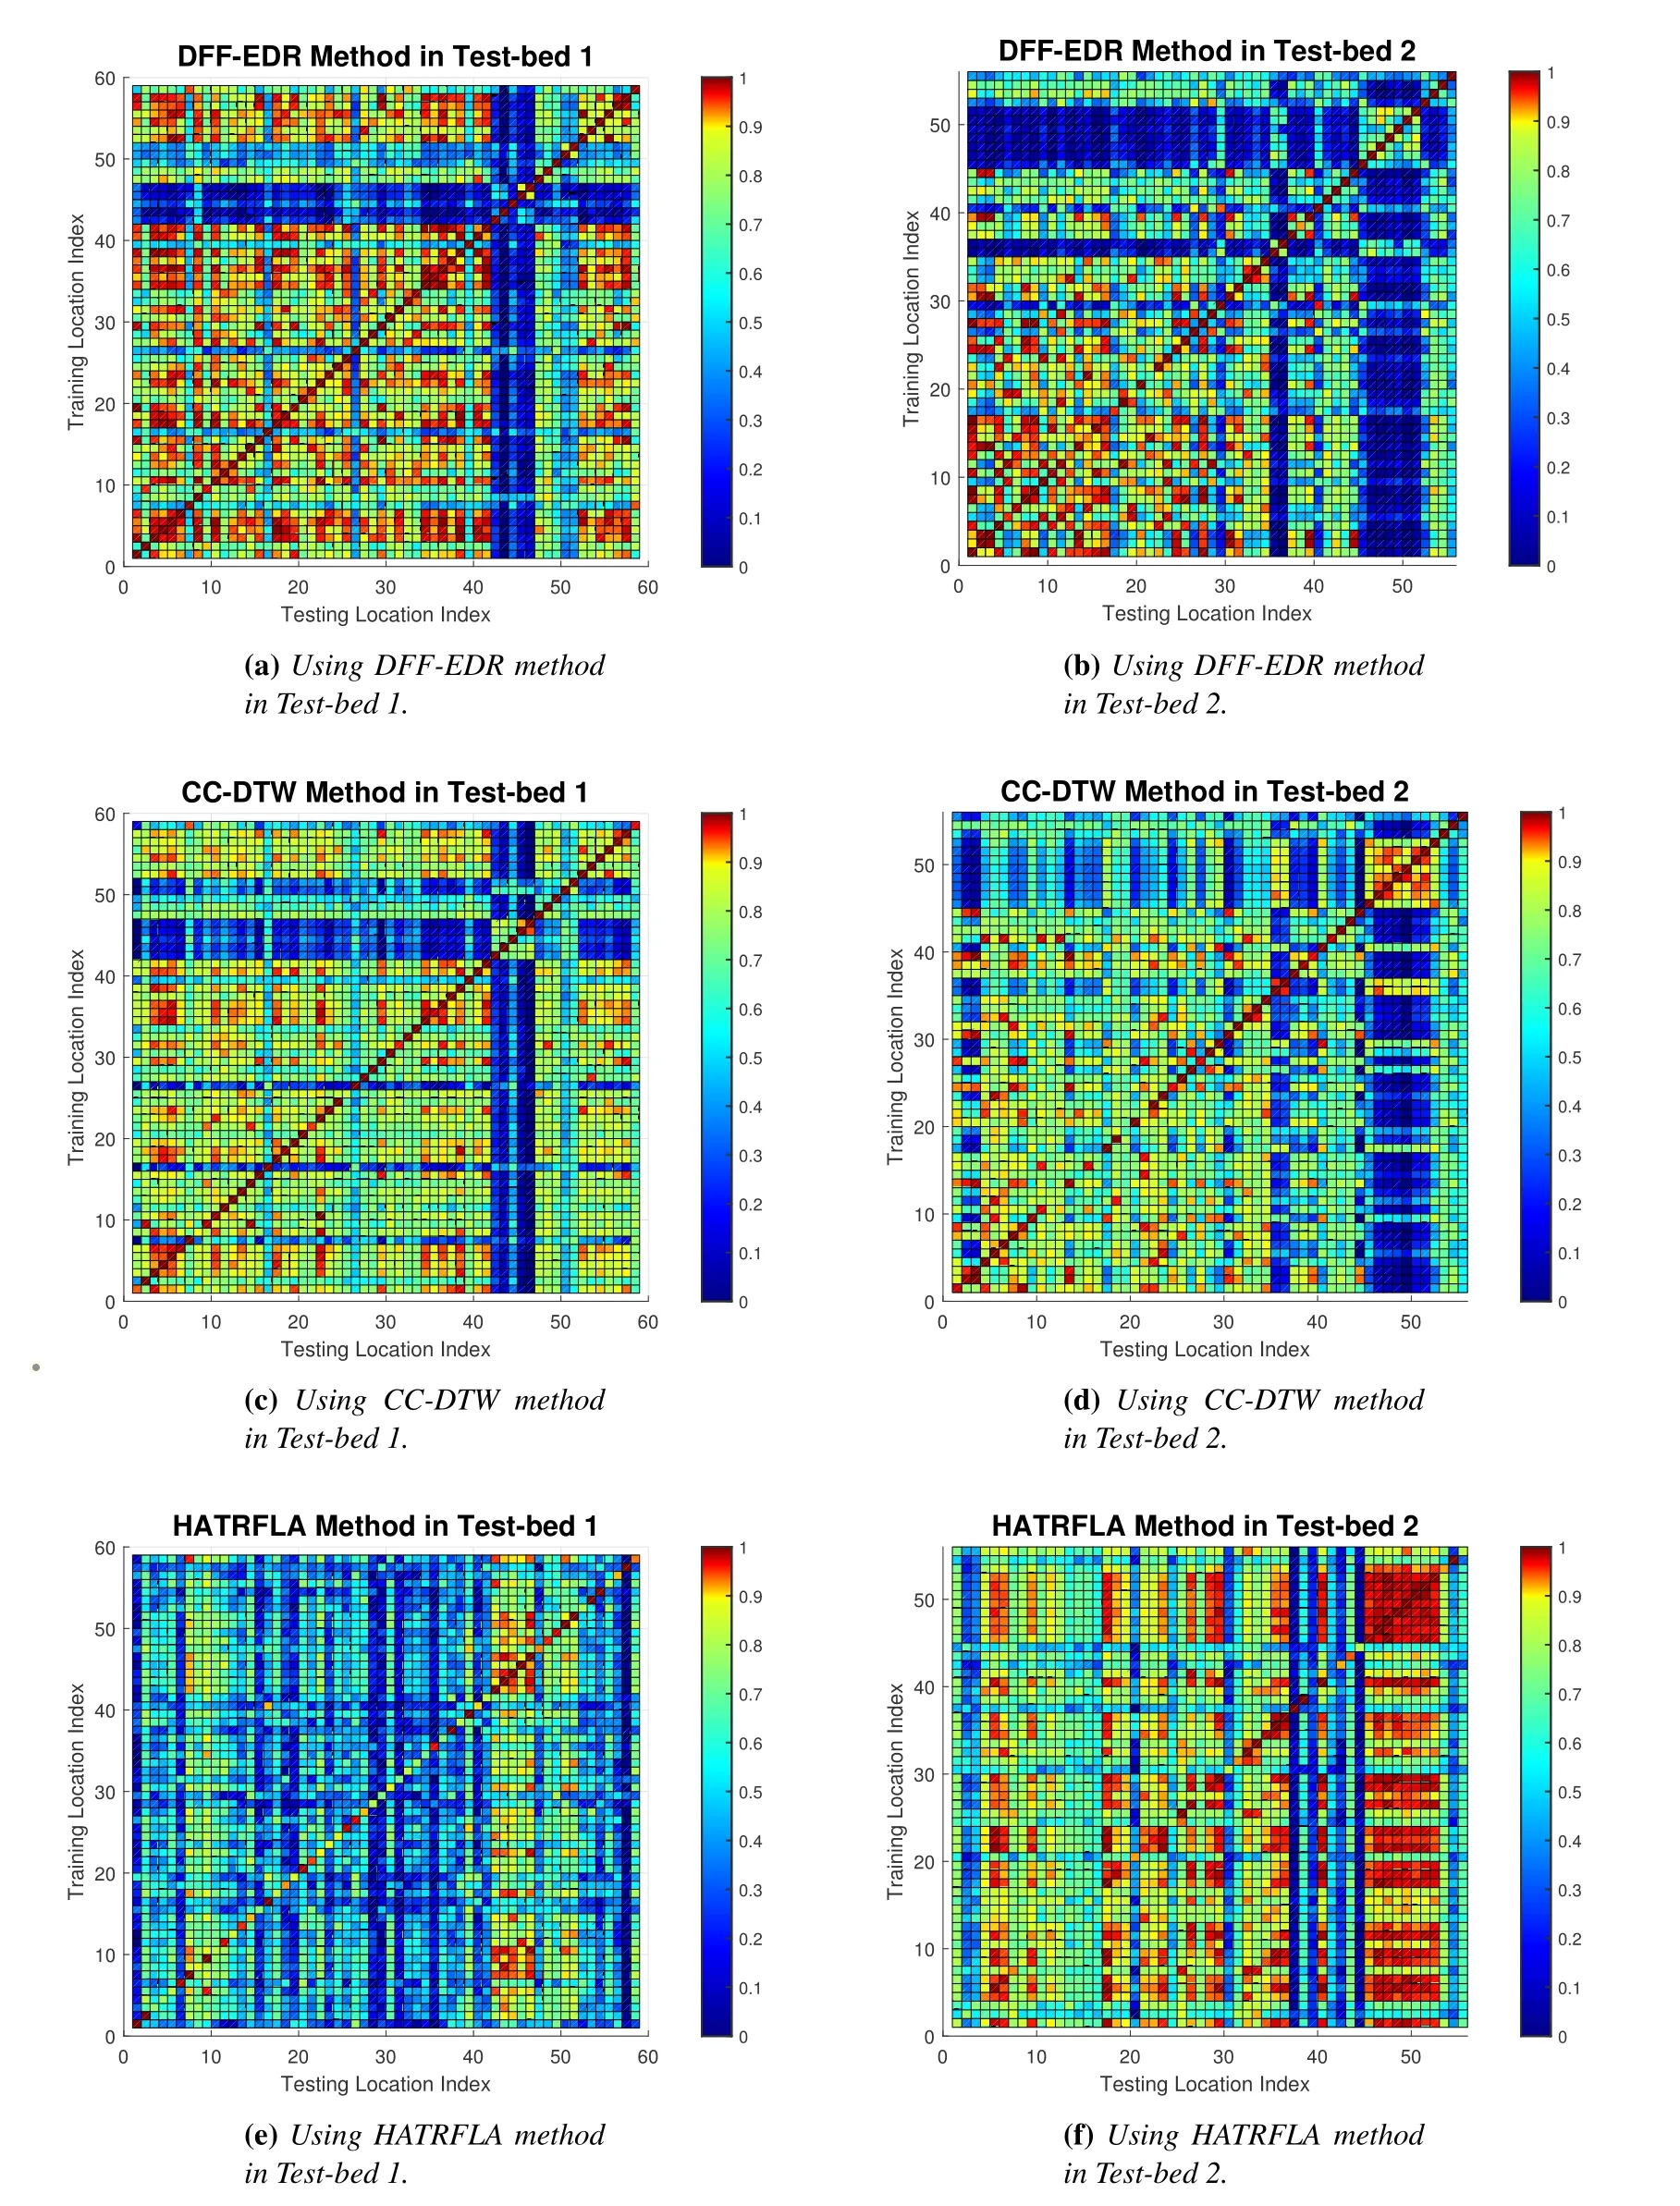
Figure15.The color map of normalized similarity matrixes for different positioning methods in the two experimental scenarios.
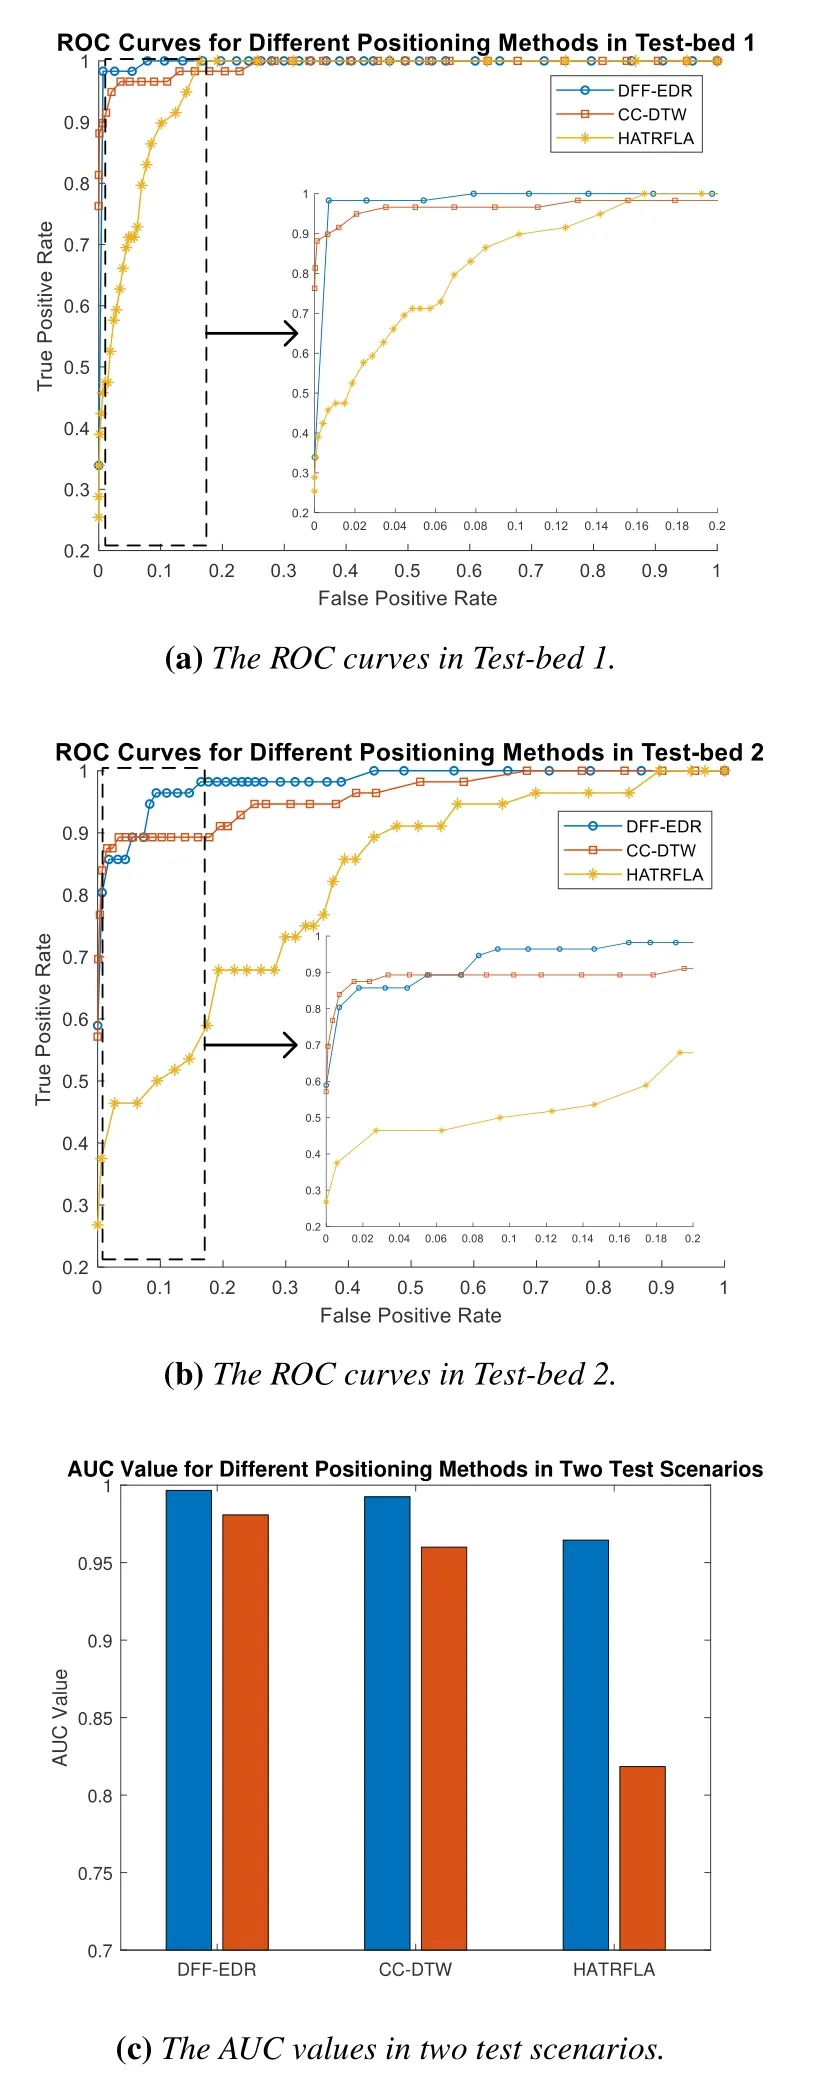
Figure16.Comparison of ROC curves and AUC values between different positioning methods in two test scenarios.
To more fully evaluate the performance of the positioning method,we used the KNN algorithm with different k-values during the position estimation process.The comparison of CDF and average positioning error for Test-bed 2 at k=1 is shown in Figure17a,17b,where the average positioning error for the DFF-EDR,HATRFLA and CC-DTW methods is 0.9129m,0.9314m,and 1.0647m,respectively.compared to the other two methods,DFF-EDR has a decrease in average positioning error of 2.0%and 14.3%.Since Testbed 1 has less environmental interference,the above positioning methods yielded correct matches at each reference point,so no comparison of the estimated position of Test-bed 1 at k=1 with the data was performed.For k=2,the comparison of CDF and mean positioning error in the two test scenarios is shown in Figure17c,17d,17e,17f.The average positioning error of DFF-EDR,HATRFLA and CC-DTW methods in Test-bed 1 is 0.5897m,0.7247m,and 0.6256m,respectively,and DFF-EDR is 18.63%and 5.73%lower than the other two methods.In Test-bed 2,the average positioning errors at k=2 is 1.3745m,1.4569m and 1.4648m,respectively,which were 5.66% and 6.16%lower than the other two methods.
From the combined analysis of the above results,the DFF-EDR method has a smaller localization error in both experimental scenarios.It can therefore be concluded that DFF-EDR has higher positioning accuracy and more stable system performance.
4.4 Summary and Discussion
In this experimental validation,feature resolution was first used as an evaluation criterion,and the DFF-EDR localization method was evaluated in two experimental scenarios from three aspects:fingerprint data characteristics,similarity metrics and overall method.In terms of fingerprint data characteristics,DFF fingerprint combines the amplitude and phase data of multiple antennas and adds dynamic weights with position specificity to provide richer information on position characteristics than traditional amplitude and phase data.In terms of similarity metrics,the IEDR metric parameterizes the matching degree of feature data on each subcarrier to”0”and”1”through threshold judgment,which reduces the influence of noise on the matching effect.In addition,the calculation of dynamic threshold parameters improves the environmental adaptability of IEDR,and the matching performance of IEDR is better than that of DTW and TRRS through comparison experiments.In the overall approach,the DFF-EDR proposed in this paper combines DFF fingerprint and IEDR metric,which effectively improves the feature resolution from two aspects.
Based on the improved feature resolution,we evaluated the DFF-EDR method for the positioning accuracy.The DFF-EDR method was compared with two localization methods,HATRFLA and CC-DTW,under two experimental scenarios.The experimental results show that the DFF-EDR method with higher feature resolution produces smaller positioning errors,illustrating the effectiveness of the DFF-EDR method in improving positioning accuracy.
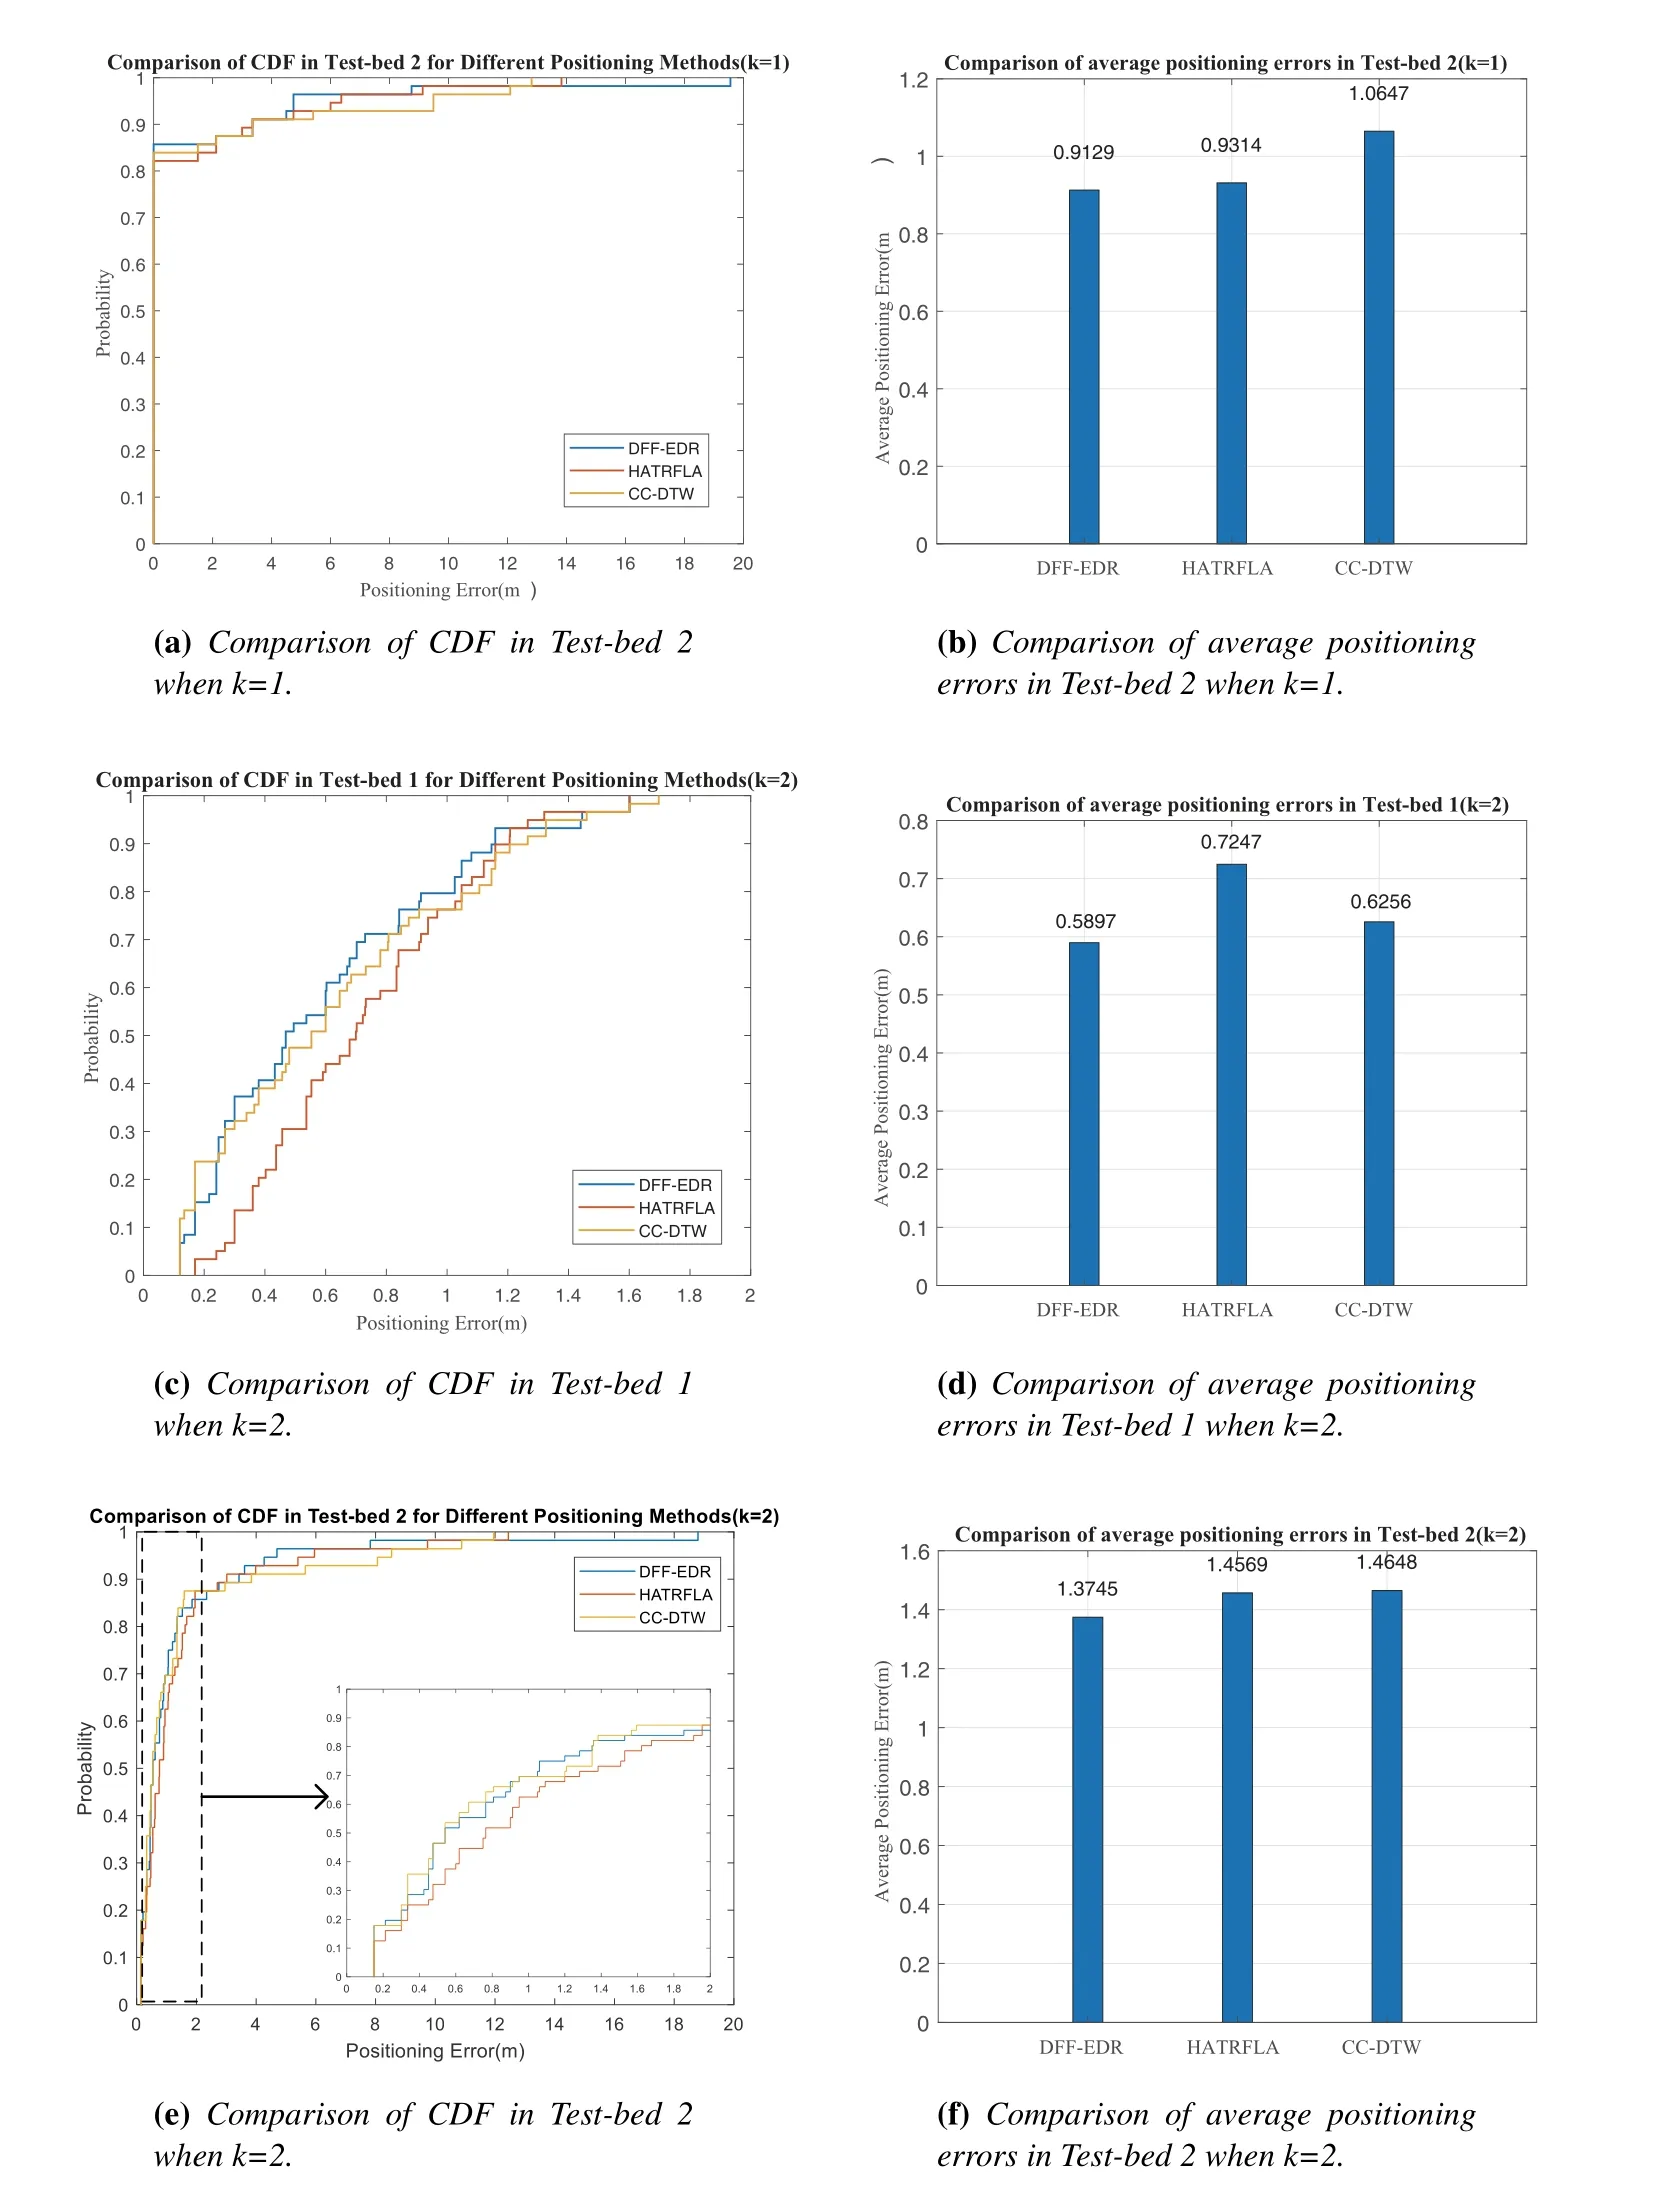
Figure17.Comparison of positioning performance between different positioning methods in two test scenarios.
V.CONCLUSION
In this paper,we propose a positioning method DFFEDR based on CSI location fingerprint information by collecting and processing the CSI information of multiple locations,and since the resolution of fingerprint features affects the performance of the fingerprint positioning method,DFF-EDR method addresses the problem of matching confusion generated by random noise in complex environments,and investigates the improvement of feature resolution in terms of both fingerprint data features and similarity metrics.For the fingerprint data,a new type of fingerprint data DFF is proposed by combining CSI amplitude and phase information,considering the relationship between the feature data collected by different antennas.In addition,for the similarity metric,an environment-adaptive metric called IEDR is established by using the EDR algorithm to measure the similarity and setting the matching threshold in the algorithm to dynamic.To demonstrate the universality of the localization method,we conducted location information acquisition and experiments in two indoor scenarios and evaluated and compared the feature resolution and noise immunity of the fingerprint data by ROC curves and AUC values in terms of features,similarity measures and overall method,and the results showed the advantages of DFF-EDR in feature resolution and noise immunity.On this basis,we further evaluated the positioning performance of the DFFEDR method using CDF images and the average positioning error.The results show that the localization error of the DFF-EDR method also decreased in both scenarios compared to the HATRFLA and CC-DTW methods.The work in this paper will effectively improve the characteristic resolution of fingerprint positioning,reduce the influence of noisy data on the feature matching process,and provide a theoretical reference for improving the positioning accuracy of indoor positioning methods.
This paper focuses on the study of fingerprint formation and feature matching of the collected CSI signals.In the future,the effectiveness measurement of CSI raw signal under multiple transmitter conditions and the base station preference strategy will be considered to further improve the performance of the positioning method by improving the quality of the received signal.
ACKNOWLEDGEMENT
This work was financially supported by the National Key Research &Development Program of China under Grant No.2020YFC1511702 and the Beijing Municipal Natural Science Foundation under Grant No.L191003.
- China Communications的其它文章
- Precoder Design and Impulsive Noise Mitigation Scheme for Industrial Wireless Communications
- Shortest Link Scheduling in Wireless Networks with Oblivious Power Control
- A Proactive Selection Method for Dynamic Access Points Grouping in User-centric UDN
- Energy-Efficient Power Allocation for IoT Devices in CR-NOMA Networks
- A New Solution Based on Optimal Link-State Routing for Named Data MANET
- NOMA-Based UAV Communications for Maritime Coverage Enhancement

