Cross-Ice Acoustic Communication:Cascade Acoustic Channel Model and Experimental Results
Jingwei Yin,Wei Men,Guangping Zhu,*,Xiao Han
1 Acoustic science and Technology laboratory,Harbin Engineering University,Harbin 150001,China
2 Key Laboratory of Marine Information Acquisition and Security(Harbin Engineering University),Ministry of Industry and Information Technology,Harbin 150001,China
3 College of Underwater Acoustic Engineering,Harbin Engineering University,Harbin 150001,China
Abstract:Cross-ice acoustic information transmission is an effective means of communication in polar sea areas covered by ice.However,the channel is extremely complicated because of the combined influence of water,ice,and air.Based on the normalmode theory,this paper establishes a cascade acoustic channel (CAC) model for the transmission of underwater acoustic waves across ice layer.The model can calculate the displacement response of the ice layer’s upper surface by separating the upward waves from normal modes in the water and multiplying it by a transmission coefficient matrix.The relationship between the displacement response of the upper surface of ice layer and the acoustic frequency is calculated by the finite-element method,and the calculation result was consistent with that of the CAC model.To verify the applicability of the model,a cross-ice acoustic communication experiment was conducted in Songhua River in January 2019.Experimental results show the energy of the acoustic signals received by geophones is closely related to sound frequency and crossice acoustic communication is feasible.The result of present research is important for understanding crossice acoustic channel characteristics and developing future cross-ice acoustic communication in polar sea areas.
Keywords:cross-ice acoustic communication;normal mode;CAC model;transmission coefficient
I.INTRODUCTION
Affected by global warming,the melting of Arctic glaciers is accelerating and the Arctic Ocean is gradually attracting global attention.With the opening of new polar shipping routes,the strategic position of the Arctic region is also improving.The Arctic Ocean and its various shallow passages offer unique and challenging environments for underwater acoustic propagation and long-range acoustic communications[1].The Arctic Ocean is covered with ice all year round,unlike the open-water acoustic environment,and the acoustic propagation characteristics are extremely complex because of the physical and acoustic properties of ice related to its topology and seasonal variations[2–4].Consequently,to support monitoring of the Arctic regions,there is an urgent need to carry out research on communication technologies that are applicable to the polar environment.Desharnais et al.conducted bottom-loss and transmission-loss experiments in shallow water under ice cover in April 2002,and the results showed that the ice cover greatly limited the amount of data that could be collected[5].Freitag et al.used a relatively inexpensive and compact layout of a hardware implementation of 10–100 km underwater acoustic communication and navigation under the ice cover[6].Liu and colleagues built an acoustic communication channel model for the under-ice environment to simulate the influence on sound propagation[7].Meanwhile,a number of studies have been reported about using hydrophones to realize underwater acoustic communication in the case of ice cover,whereas to the best of our knowledge few work has been published considering cross-ice acoustic communication.
In the summer of 2018,during ninth Chinese national Arctic Research Expedition organized by the Ministry of Natural Resources,a conductivitytemperature-depth (CTD) profiler was used to measure the under-ice sound speed profile.The Figure1(a)shows the under-ice sound velocity profiles within 500 km of the Canadian basin,with a significant positive sound velocity gradient.Because of an essentially positive sound speed gradient in the Arctic sea area covered by an ice layer,the acoustic ray paths are generally refracted upward as shown in the Figure1(b).When the sound wave propagates,it interacts frequently with the sea ice,and the energy is constantly reflected and absorbed[8].Therefore,it’s an effective means of communication in the Arctic ice area to use ice-mounted geophones to obtain the displacement information of the upper surface of the ice layer.In addition,ice cover can present logistical difficulties for deploying hydrophone systems(i.e.,buoys)in the water column for receiving data,but the ice can also provide a stable platform for deploying geophones,and its material properties facilitate the transmission and conduction of sound waves.In the polar regions,it is far less difficult to deploy ice-mounted geophones than hydrophones because of the thick ice cover.To date,geophones have been used widely in many applications,for example,seismic detection[9,10],resource exploration[11],and so on.
Recently,some related work has been carried out on cross-ice sound-source localization and communication in the Arctic with ice-mounted geophones.Dosso and his colleagues estimated the bearings of acoustic sources in the water column by using ice-mounted geophones.The results indicate that their method has an excellent ability of bearing estimation and requires no knowledge of the environmental properties[12–14].Han et al.used three-component ice-mounted geophones to conduct a short-range single-carrier crossice acoustic communication experiment.The experimental results indicated that it was feasible to realize cross-ice acoustic communication by means of ice-mounted geophones at short ranges[15].However,there was few study of the acoustic channel model of underwater acoustic signal cross-ice propagation.For the acoustic field in low-frequency and shallow water waveguide,it’s more accurate to be expressed by normal mode theory[16].Normal mode propagation is a natural property and limited in a vertical dimension by boundaries.A discrete number of normal modes propagate in shallow water,each with a different group velocity[17].According to normal mode theory,this paper establishes a water-ice-air cascade acoustic channel(CAC)model for cross-ice transmission of acoustic information and verify it through simulations and a field experiment.
We summarize the main contributions of this paper as follows.
1) The CAC model for underwater acoustic signals cross-ice transmission is established based on the normal-mode theory.The model is helpful to understand cross-ice acoustic channel characteristics.
2)Successful experimental demonstration on crossice spread spectrum acoustic communication by using ice-mounted geophones.Experimental results also show the energy of underwater acoustic signals refract into ice is closely related to acoustic frequency.
II.WATER–ICE–AIR CASCADE ACOUSTIC CHANNEL MODEL FOR CROSSICE ACOUSTIC COMMUNICATION
The Arctic sea ice has an extremely complex structure,including a rough surface,delamination,and anisotropy.Furthermore,the acoustic and physical properties of sea ice are affected by the weather and water conditions[18].Compared with underice acoustic communication,the channel of cross-ice acoustic communication is more influenced by the physical properties of the ice layer.In order to establish the water-ice-air CAC model,we herein ignore the scattering caused by random fluctuations in the ice and assume that the upper and lower surfaces of the ice layer are smooth and horizontal.
2.1 Water–ice–air Cascade Acoustic Channel Model
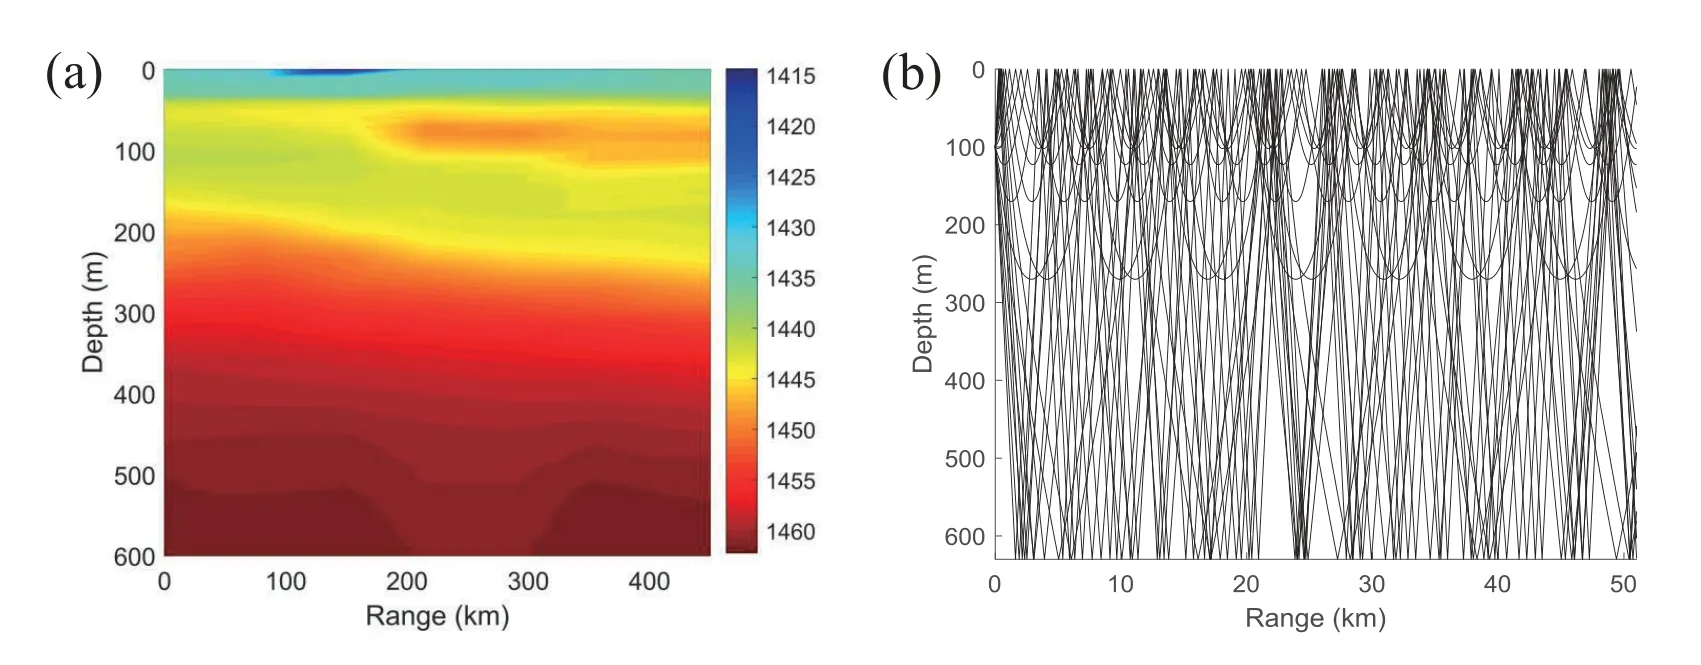
Figure1.Typical sound speed profile and corresponding ray diagram for sound propagation in the Arctic:(a)The sound speed profile for different areas in the Arctic Ocean(b)Under-ice sound ray trajectory simulated using BELLHOP.
Figure2 shows the schematic diagram of a typical underwater waveguide sound field covered by ice layer,the vertical axis represents the distribution of each layer of media,and the horizontal axis represents the horizontal distance from the sound source.It is assumed that an elastic ice layer of a certain thickness lies at the surface of a water layer.The water layer has a depthz1and longitudinal wave speedcwat.The ice layer has a thicknessz2−z1,longitudinal wave speedcice,land transverse wave speedcice,t.Above the ice layer is a homogeneous air medium of semiinfinite,and air has longitudinal wave speedcair.The seafloor sediment layer is also assumed to be a homogeneous semi-infinite medium,have a longitudinal wave speedcsed,land a transverse wave speedcsed,t.The wave equation of the particle-displacement potential functions in the air,ice,water,and seafloor sediment shown in Figure2 is given by

where∇2is the Laplacian operator,φ(→r,t)is the displacement potential functions of sound wave in different medium andcis the sound speed in the medium.Furthermore,there are two wave equations of longitudinal wave and transverse wave in ice and seafloor sediment layer.
According to the wave equation and the boundary conditions,the displacement potential function in the ice-covered shallow-water waveguide is given by

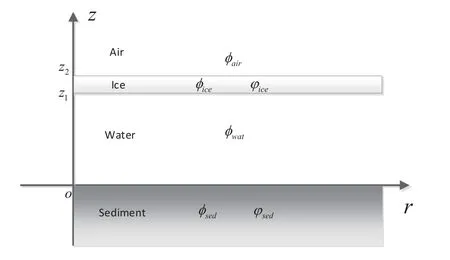
Figure2.Schematic diagram of a typical underwater waveguide sound field covered by ice layer.φsed,ϕsed,φwat,φice,ϕice and φair are the displacement potential functions in the seafloor,water,ice and air,respectively.
For each normal wave in the water,it can be separated into an upward wave and a downward wave:

wherez0is the depth of the sound source,is the wave number of them-th normal mode along theraxis;is the wave number of them-th normal mode along the z axis,here

whereis wave number of them-th normal mode,tion of the first kind,andare the upward wave and the downward wave,respectively.Figure3 shows the upward and downwardis the zeroth-order Hankel funcwaves propagation schematically.Θmis the angle between the propagation direction of them-th normal mode and thezaxis.For uniform water layer,Θmcan be given by

here,ωmis the cutoff frequency of them-th normal mode.
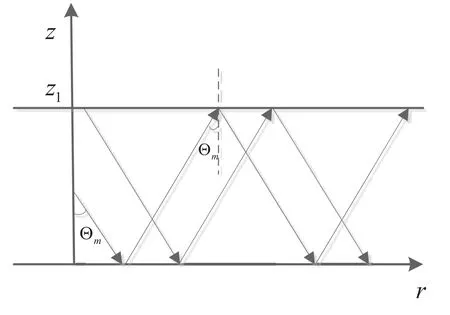
Figure3.Schematic diagram of upward and downward waves propagation.
The underwater acoustic signal can transmit into the ice surface through the ice layer,the normal displacement component of the ice upper surface can be obtained by separating the upward waves from normal modes in the water and multiplying they by corresponding transmission coefficients,and it can be written as

whereWmis the transmission coefficient of the ice layer for them-th normal wave.
When the intensity of the sound source is constant,the change in the amplitude of the displacement received on the ice surface with the sound frequency is called the displacement response.Eq.(6) shows the displacement response of the ice layer’s upper surface,which is the upward waves of normal modes in the water multiplying by the transmission coefficient matrix of the ice layer.Therefore,the number of normal modes that can be refracted into the ice layer and the transmission coefficient will directly affect the displacement of the ice layer’s upper surface.Next,we study the transmission coefficient of the ice layer and its relationship with the ice thickness,acoustic frequency,and incident angle.
2.2 Transmission Coefficient
Let’s start with a simple case.Supposing there is semi-infinite water under the ice layer,semi-infinite air above the ice layer,and the ice layer is a uniform layer.Since the characteristic impedance of ice is much greater than that of air,it can be assumed that the iceair interface is an absolute soft boundary for the convenience of calculation.When a plane acoustic wave with angular frequencyωis incident obliquely from water to the lower surface of the ice layer,different acoustic impedance between the water and ice means that the incident sound wave can be reflected by the interface,while some acoustic energy penetrates into the ice layer.The refracted waves in ice layer contain longitudinal waves and transverse waves propagating in the positivezdirection.We assume thatϕiis the upward wave andϕris the downward wave,they are the incident wave and reflected wave at the ice-water interface,respectively.Then we only need to solve the relationship betweenϕiandSzto get the transmission coefficientW,W=[W1,W2,···,WM].
The displacement potential function of the sound wave in water can be expressed as:

whereθiandθrare the incident angle and the reflection angle in the water,respectively.In the ice layer,the transverse wave displacement potential function is:

whereθtiandθtrare the incident angle and the reflection angle of transverse wave in the ice layer,respectively.ktis wave number of transverse wave,andctis the sound speed of transverse wave.In the ice layer,the longitudinal wave displacement potential function is:

whereθliandθlrare the incident angle and the reflection angle of longitudinal wave in the ice layer,respectively.klis wave number of longitudinal wave,andkl=is the sound speed of longitudinal wave.
In the ice,the components of the displacement vector and stress tensor along thezandrdirections are given by


whereµis the Lam´e constants of an elastic solid.
So we define the transmission coefficient of the ice layer as:

whereddenotes ice thickness.According to the boundary conditions and displacement potential functions,a five-element linear equation forA2,A3,B1,B2,B3can be obtained:

Solving this linear Eq.(13),then Substituting the results for Eq.(12),we can get the transmission coefficientW.
Arctic sea ice can be as thick as 2–3m,and the sound speed profile is often layered because of the uneven distribution of temperature and salinity of sea ice.Setting up the coordinate system as shown in Figure4,we assume that the sound speed profile of ice layer can be divided intonlayers,each of which is homogeneous,and the air medium above the ice layer is a semi-infinite space.For the n-th ice layer,the displacement potential functions of transverse and longitudinal wave are:

and

whereandare wave number of transverse and longitudinal wave,respectively.
The components of the displacement vector and stress tensor remain unchanged through the interface of each ice layer,the relationship between the components of the displacement vector and stress tensor of the upper surface of the(n−1)-th ice layer and that of the upper surface of the n-th ice layer are given in the book[19].Then,the relationship between the components of the displacement vector and stress tensor of the upper surface of then-th layer and that of the upper surface of the 1-th layer can be obtained,and the result can be written as

where matrixais the product of matrixAin each layer,so we have

whereA(n)is a 4×4matrix,its specific forms can refer to the book[19].So,the transmission coefficient of ice surface normal displacement can be obtained by Eq.(16)when ice layer is non-uniform.
To simplify the calculation,the following simulations consider that the ice layer is a uniform layer.The transmission coefficient is closely related to the frequency of the sound wave,the incident angle,and the thickness of the ice.Figure5 shows the calculation results for(a)the amplitude of the transmission coefficients versus the incident angle for different frequencies and(b)the phase of the transmission coefficients versus the incident angle for different frequencies.The legends “100Hz”,“200Hz”,“500Hz” and “1000Hz”represent sound frequency of 100Hz,200Hz,500Hz and 1000Hz,respectively.In this calculation,the ice was 1 m thick and had no layered structure,the density and sound speed were 1000.0 kg/m3 and 1500 m/s,respectively,in water,the sound speeds of longitudinal and transverse waves in ice were 3600 m/s and 1800 m/s,respectively,and the density of ice was 910 kg/m3.As shown in Figure5(a),when the incident angle increases within a certain range,the amplitude of the transmission coefficient decreases;when the incident angle approaches 90◦,the sound wave is totally reflected and the transmission coefficient tends to zero.Figure6 shows the amplitude and the phase of transmission coefficients versus sound frequency at incident angle ofθi=20◦under different ice thickness.The legends“0.5 m”,“1.0 m”,“3.0 m”and“5.0 m”represent ice thickness of 0.5m,1 m,3 m and 5m,respectively.It can be seen from Figure6 that transmission coefficient of ice layer has certain frequency selection characteristics.
III.SIMULATION ANALYSIS
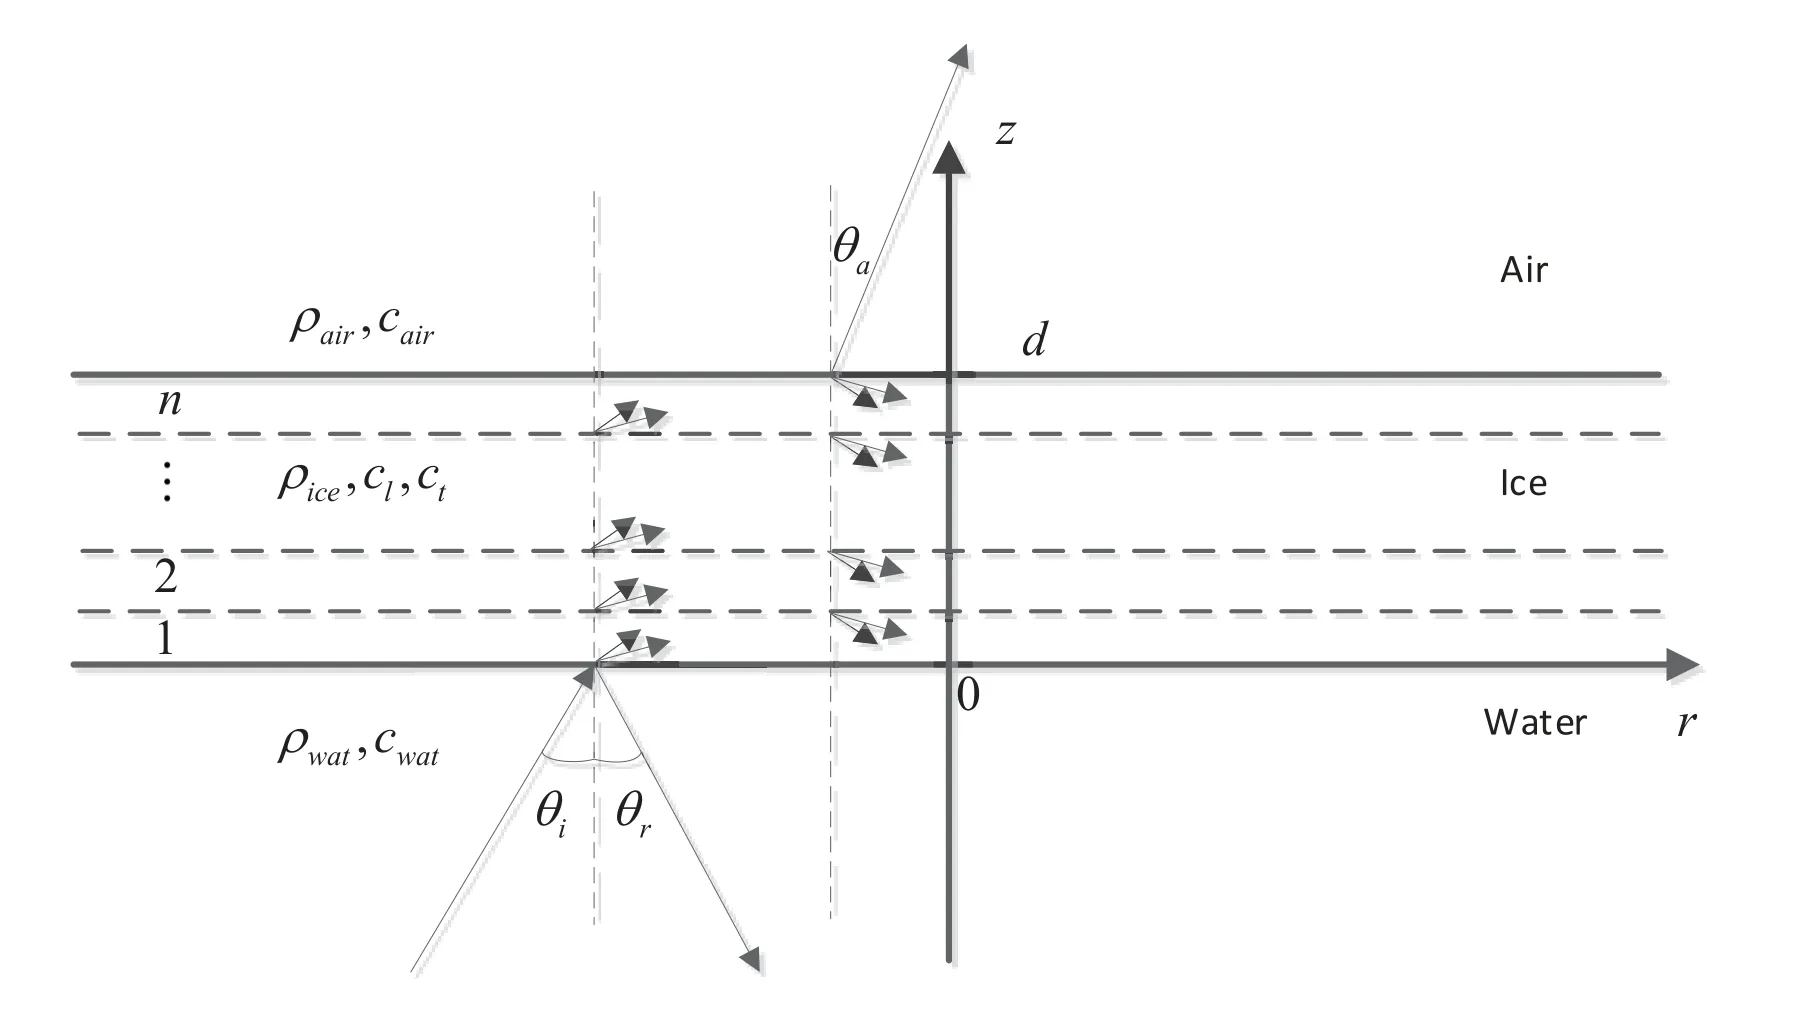
Figure4.Schematic diagram of reflection and refraction of sound propagation.
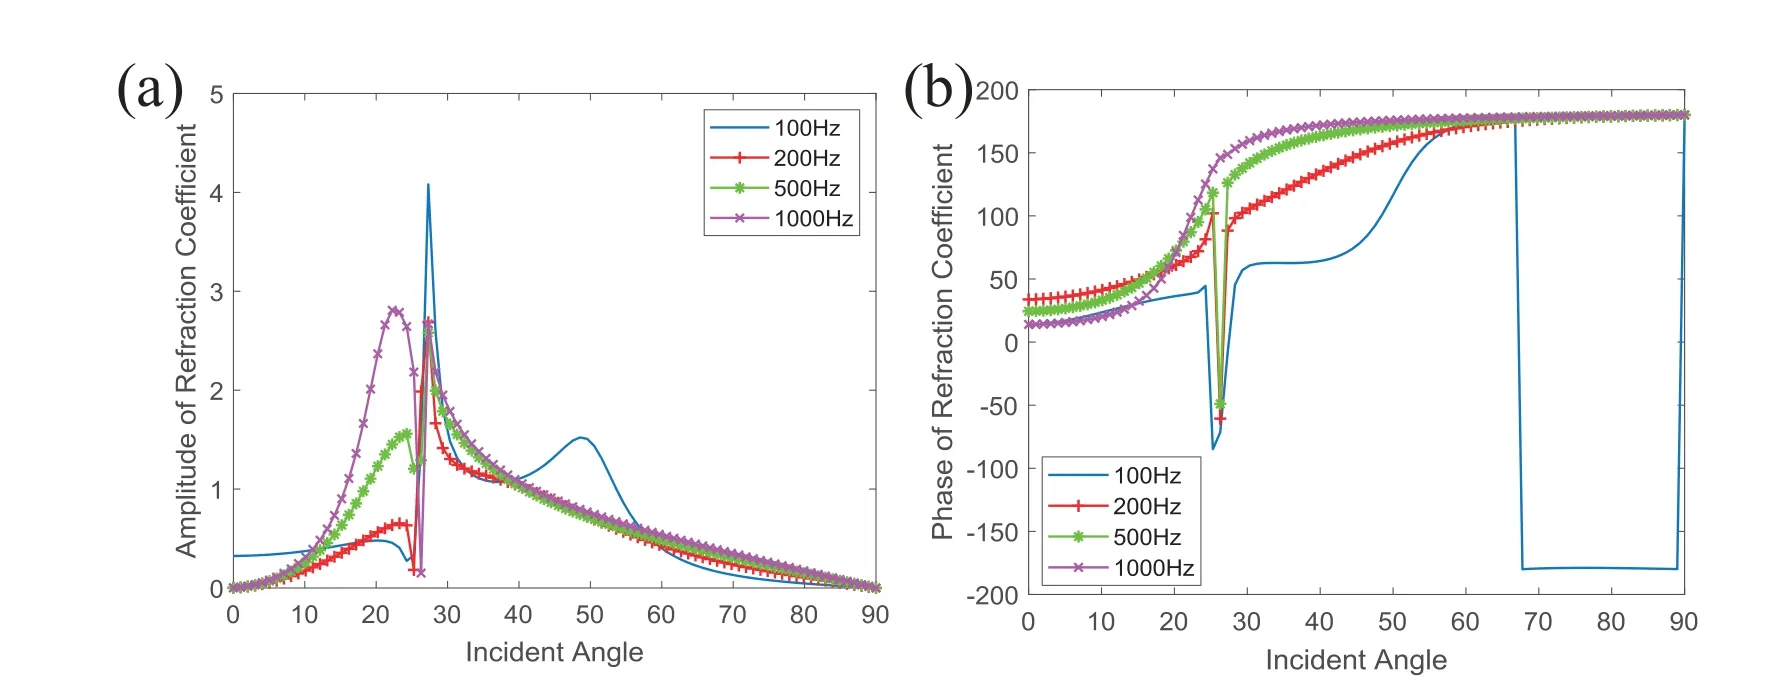
Figure5.Transmission coefficient’s (a) Amplitude and (b) Phase versus incident angle for different frequencies when ice thickness is 1 m.
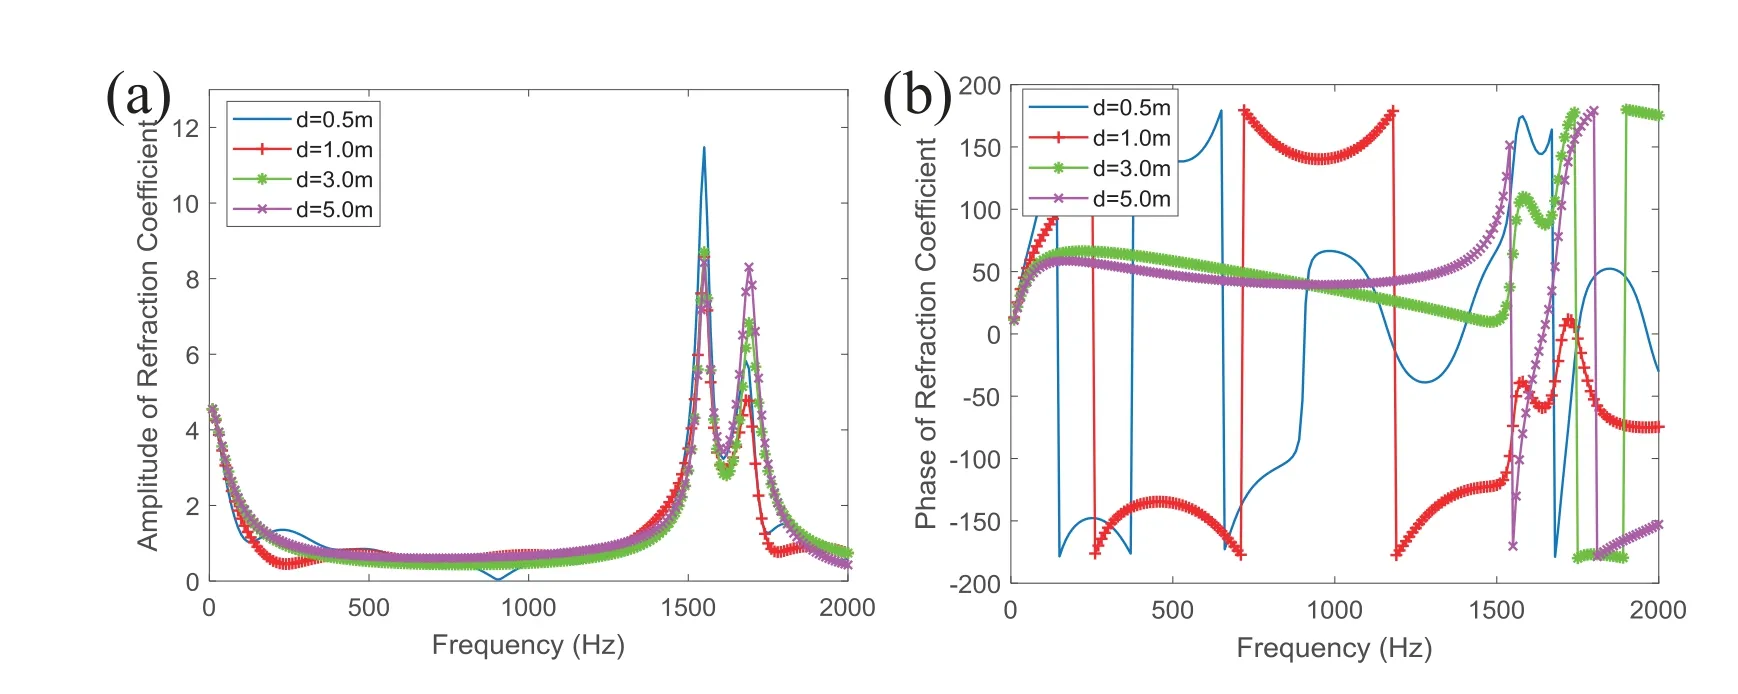
Figure6.Transmission coefficient’s (a) Amplitude and (b) Phase versus frequency for different ice thickness when the incident angle is 20 degrees.
Herein,we used the finite-element method (FEM) to calculate the displacement of the upper surface of the ice layer in cross-ice acoustic information transmission.The result of established CAC model was compared with the FEM to verify correctness of our model.The Comsol software is used in the FEM simulation on the cross-ice acoustic propagation.The maximum size of the mesh is less than 1/6 of the wavelength,the linear elastic model is used for the ice layer,and the fluid model is used for the water medium.A point sound source is used in the FEM simulation.The values of the remaining parameters used in the simulations are given in Table1,and we assume that the ice is not layered.Figure7 shows the normalized displacement response of the ice-layer surface versus sound frequency at 50 m.The red line is the FEM result,and the blue line is the CAC model result.It can be seen from Figure7 that the calculation results of the CAC model are basically consistent with the FEM calculation results,which shows in turn that the model has certain applicability.And the calculation results of these two methods show clearly that the displacement is closely related to the incident sound frequency:the higher the frequency,the smaller the displacement of the icelayer surface.For the CAC model,the propagation angle Θnof the normal modes increases with the sound frequency.Figure5(a)shows that the amplitude of the transmission coefficient in the CAC model decreases with incident angle,thereby reducing the amount of energy that penetrates into the ice layer.Therefore,a suitable frequency band should be selected in the cross-ice acoustic communication.
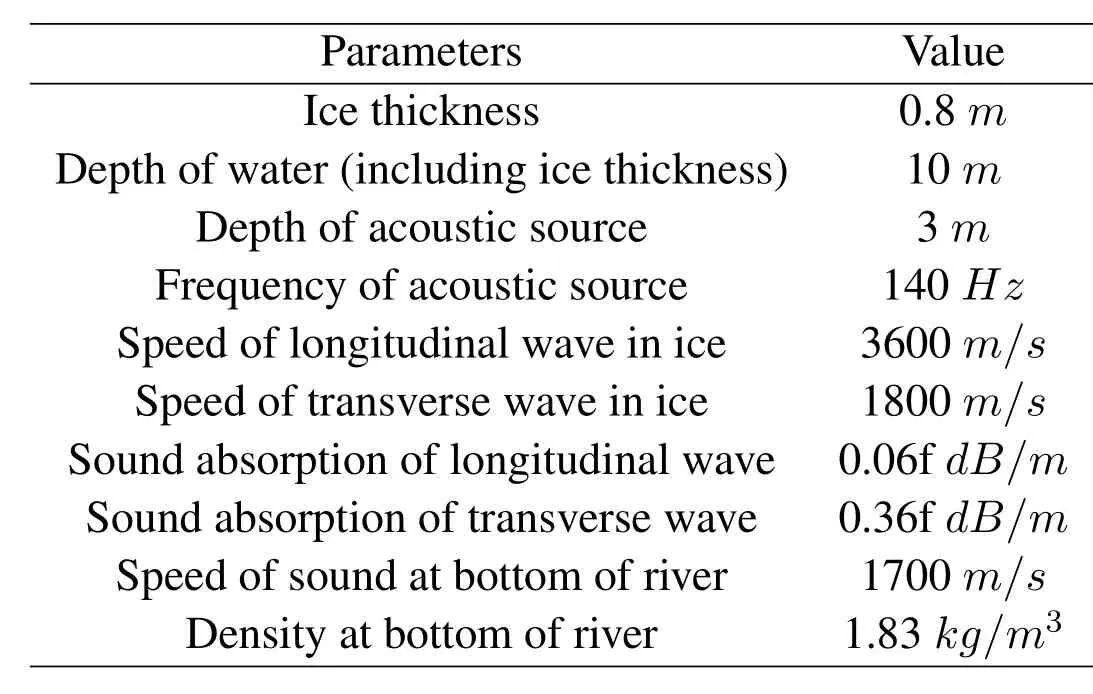
Table1.Simulation parameters.
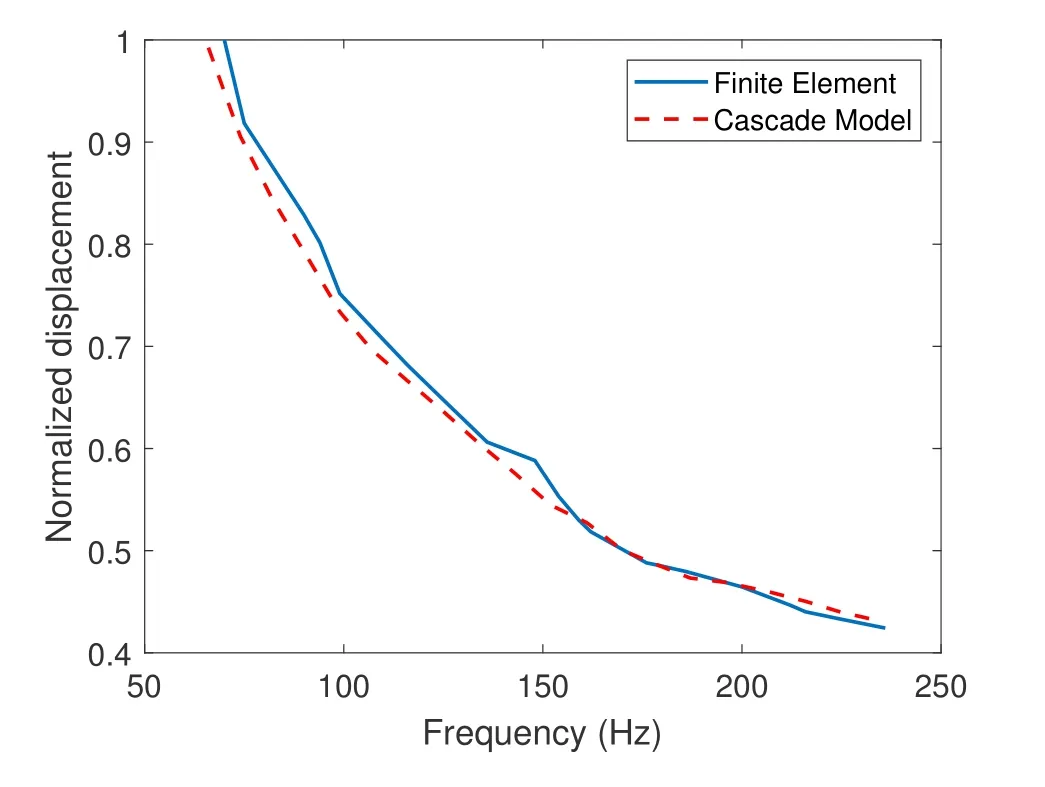
Figure7.The calculation results of normalized displacement of ice layer’s upper surface at 50 m for different frequencies of incident sound.The blue line is from FEM,and red line is from CAC model.
IV.EXPERIMENTAL RESULTS
A cross-ice acoustic communication experiment was carried out on the ice cover of the Songhua River in Heilongjiang Province,China in January 2019.The experimental layout is shown schematically in Figure8.The acoustic source was a low-frequency transducer with a frequency band of 100–1000 Hz,and it was placed at 3 m under the ice surface.Geophones G1 and G2 were deployed 50 m away from the acoustic source,and G3 was deployed 75 m away.The distance between the geophones in the experiment was measured roughly.In addition,two hydrophones(H1 and H2) were deployed through the ice to a depth of 3 m near the geophones.Geophones G1–G3 are single-component geophones that were synchronized by GPS and between which there was almost no delay.The data received by the geophones and hydrophones were saved automatically in memory cards.The frequency band of the geophones was 10–240 Hz and the sampling rate was 2 kHz.Considering the frequency band of the geophones and the sound source together,the 40–240 Hz band was used to carry information in the experiment.During this cross-ice acoustic communication experiment,the direct-sequence-spreadspectrum(DSSS)signals with the differential-binaryphase-shift-keying modulation were used to transmit digital information.Transmitted signal carries 10 bits of information,and m-sequence of length 127 is chosen as spreading code to improve Processing gain and avoid sidelobe interference.
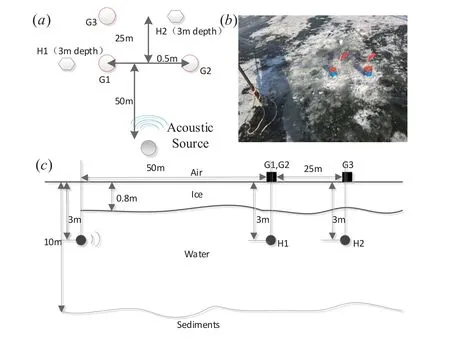
Figure8.Cross-ice acoustic communication experiment:(a) Schematic diagram of experimental layout (G1,G2 and G3 represent geophones with single components,H1 and H2 represent hydrophones);(b)Picture of two ice-mounted geophones during experiment;(c)Profile view of experimental layout.
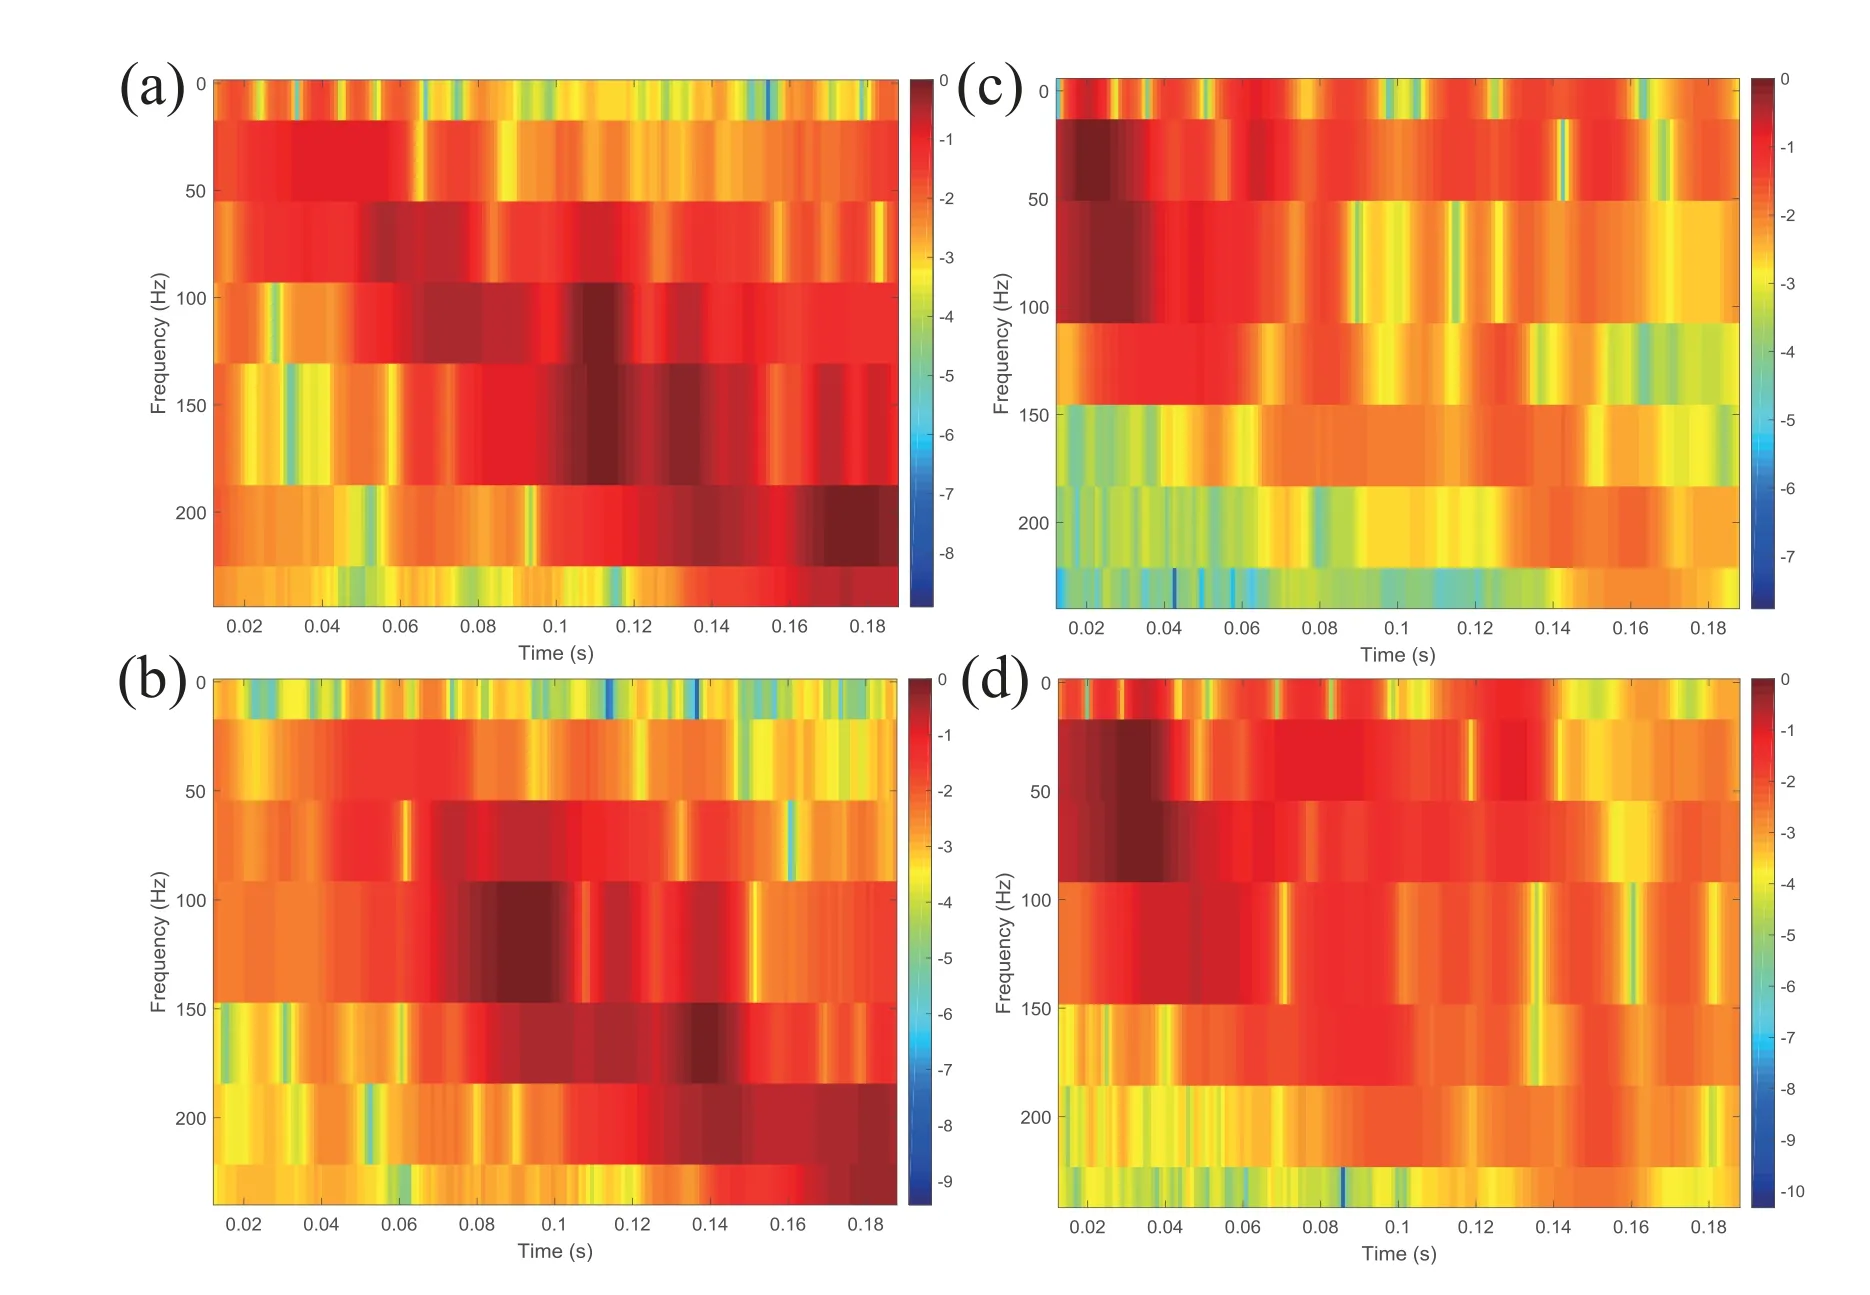
Figure9.Time-frequency analysis of the signal received by hydrophones(a)H1 and(b)H2 and geophones(c)G1 and(d)G3.Received signal is the LFM signal with a duration of 0.2s and a frequency band of 40–240 Hz.
The linear frequency modulation(LFM)signal with a duration of 0.2s and a frequency band of 40–240 Hz is transmitted as a synchronization signal in this experiment.The time-frequency characteristics of the LFM signals received by hydrophones and geophones were analyzed,respectively.The results are shown in Figure9.It can be seen from Figure9(a) and (b) that there is a positive correlation between the energy of the acoustic wave in the water and the sound frequency,and the energy of the acoustic wave at high frequency is relatively strong.On the contrary,as can be seen from Figure9(c) and (d),the energy of the acoustic wave received by the geophones is more intense in the low frequency portion than that in the high frequency portion.This result is consistent with our CAC model and the law presented in our simulation results in Figure7.
Figure10 shows the measured sound speed proflie of the Songhua River under ice,it can be seen that the sound velocity does not change signifciantly over the whole water depth.Normal mode model KRAKEN was used to calculate waveguide at the experimental site.The environmental parameters are given in Table1 and Figure10.The characteristics of the ice layer regarding the sound speed and sound absorption were those given by McCammon and McDaniel[20].The calculation results show that underwater acoustic signals consist of two wave packets,which correspond to the frist two normal modes,and the group speeds of the frist and second normal modes are 1360.57m/sand 805.97m/s,respectively.Eq.(4) lead to the incident angles of the frist and second normal modes,which are Θ1=75◦and Θ2=41◦,respectively.The calculation of Incident angles used an averaged value of the sound-speed proflie.Figure5(a)shows that the amplitude of the transmission coeffciient is as low as 0.1 when the incident angle of the acoustic wave is 75◦.However,the amplitude of the transmission coeffciient is about 1.3 when the incident angle of the acoustic wave is 41◦.Therefore,only a small part of the energy of the frist normal mode is received by the geophones,and the refracted energy of the second normal mode is much higher than that of the frist normal mode.
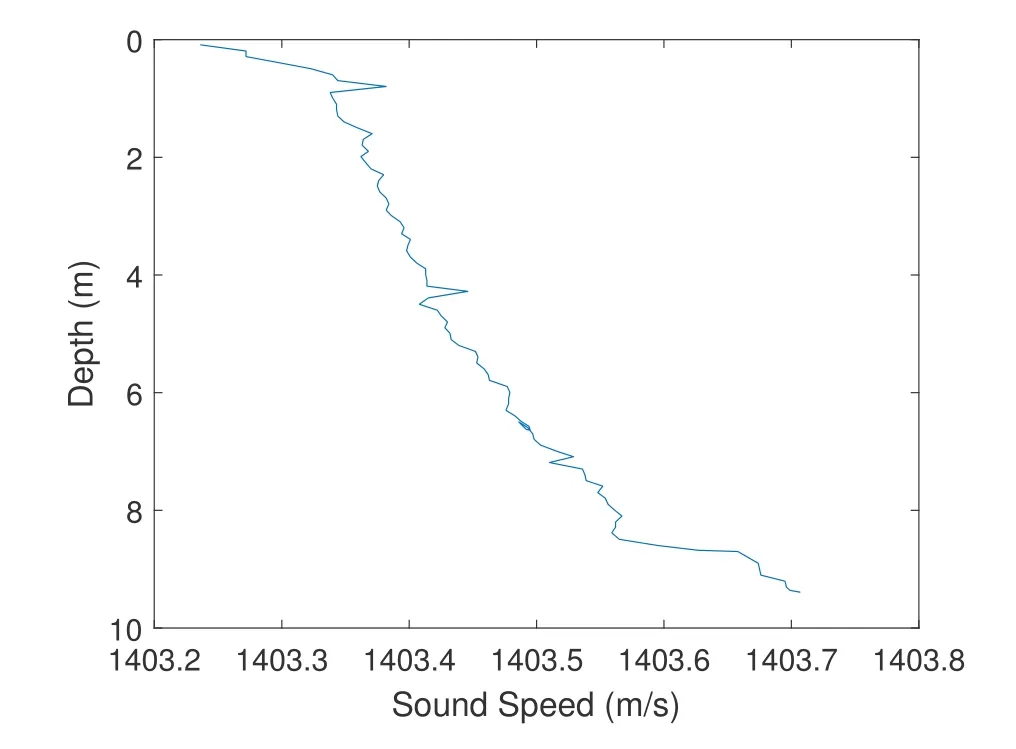
Figure10.Sound speed profile under ice,calculated from CTD collected during the experiment at the Songhua River.
In order to study the characteristics of the channels from the transducer to the geophones and hydrophones,we regard the entire transmitted DSSS signal as the training sequence and then estimate the channel impulsive response (CIR).We take G1 and H1 as an example to compare the channel of underice acoustic communication with cross-ice acoustic communication,and the estimated CIR results for G1 and H1 are shown in Figure11.Figure11(a) shows that the channel structure of cross-ice acoustic communication is simple and stable and has only one major path.Figure11(b) shows the estimated CIR results for under-ice acoustic communication;there are now two major paths that are separated by approximately 26ms.The results from Kraken show the group speeds of the first and second normal modes are 1360.57m/sand 805.97m/s,respectively.H1 was deployed 50 m away from the acoustic source,and 50/805.97−50/1360.57=25.5ms,considering the measurement error of equipment installation,the above calculation results of Kraken are correct.It can be seen from Figure11(a) and (b),the difference of channel structures from transducer to G1 and H1 accord with the aforementioned conclusion that the refracted energy of the second normal mode is much stronger than that of the first normal mode.Hence,our CAC model based on normal-mode theory could be used for Cross-ice acoustic information transmission in a shallow water environment.
In this paper,differential energy detector (DED) is used to process the data collected by 5 receivers.Figure12 shows the processing results of different receivers for G1,G2,G3,H1 and H2,the horizontal axis represents the symbols in the received signal,the vertical axis represents the different receivers and the lateral axis represents the amplitude of the energy output.It can be seen from Figure12 that the two energy outputs of the DED for each symbol of the 5 receivers are significantly different.And all receivers can realize communication with zero-bit error rates.According to the CAC model,the signal energy received on the ice surface is usually less than that received in the water.We can see from Figure12 that the processed energy output of received signal of H1 and H2 are higher than that of G1,G2 and G3.The experimental results show that ice-mounted geophones can achieve stable and effective cross-ice acoustic communication and the CAC model can be applied to cross-ice acoustic communication.
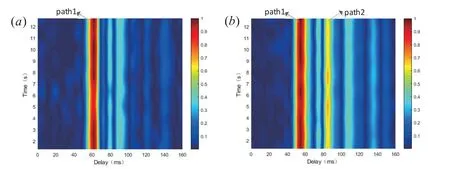
Figure11.Estimated channel impulsive response (CIR) results for (a) cross-ice acoustic signal received by G1 and (b)under-ice acoustic signal received by H1.
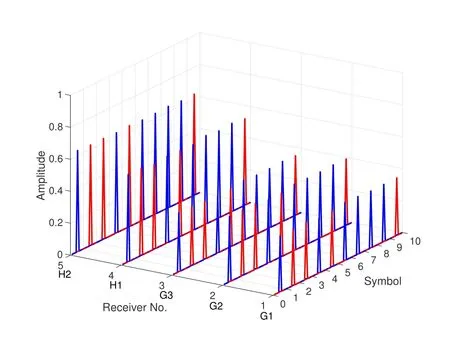
Figure12.The processing results of different receivers for G1,G2,G3,H1 and H2.
V.CONCLUSION
In this paper,we established a water-ice-air CAC model based on normal-mode theory,which can be applied to the cross-ice communication under complex and layered ice cover.It was found that the acoustic frequency,incident angle,and ice thickness have influence on the amplitude and phase of the transmission coefficient of the ice layer.We compared the calculation results of the CAC model and FEM to show correctness and applicability of the model.By inputting the environmental parameters of the Songhua River,Kraken calculation results showed that the underwater received signals consist of two normal modes.The energy of the first normal mode entering the ice layer is very small and is almost submerged in the noise.By contrast,the energy of the second normal mode entering the ice layer is much stronger.This result can explain the difference between the CIR estimated by H1 and G1 received signals.The prediction is that if the frequency of the sound source is lowered(thereby reducing the glancing angle of the first normal mode),more sound energy will be refracted to enter the ice layer,which may be effective in improving the crossice transmission performance of the sound signal at long ranges.A thorough analysis of the coupling effect between the underwater channel and the ice layer is the key to achieving effective cross-ice acoustic information transmission.The model established herein could be a useful tool for exploring the Arctic,and future work will involve establishing a cross-ice coupled CAC model that is fully applicable to the positive sound speed gradient in polar ice regions.
ACKNOWLEDGEMENT
This research was funded by the National Key R&D Program of China (2018YFC1405900),The National Natural Science Foundation of China (Grant No.61631008 and No.51779061),the Fok Ying-Tong Education Foundation,China (Grant,No.151007),The Heilongjiang Province Outstanding Youth Science Fund (JC2017017),and the Innovation Special Zone of National Defense Science and Technology.
- China Communications的其它文章
- Future 5G-Oriented System for Urban Rail Transit:Opportunities and Challenges
- Multi-Stage Hierarchical Channel Allocation in UAV-Assisted D2D Networks:A Stackelberg Game Approach
- Performance Analysis of Uplink Massive Spatial Modulation MIMO Systems in Transmit-Correlated Rayleigh Channels
- Development of Hybrid ARQ Protocol for the Quantum Communication System on Stabilizer Codes
- Coded Modulation Faster-than-Nyquist Transmission with Precoder and Channel Shortening Optimization
- Analysis and Design of Scheduling Schemes for Wireless Networks with Unsaturated Traffic

