Analysis and Design of Scheduling Schemes for Wireless Networks with Unsaturated Traffic
Jianfei Li,Juan Wen,Min Sheng
State Key Laboratory of Integrated Services Networks,Xidian University,Xi’an 710071,China
Abstract:Scheduling schemes assign limited resources to appropriate users,which are critical for wireless network performance.Most current schemes have been designed based on saturated traffic,i.e.,assuming users in networks always have data to transmit.However,the user buffer may sometimes be empty in actual network.Therefore,these algorithms will allocate resources to users having no data to transmit,which results in resource waste.In view of this,we propose new scheduling schemes for onehop and two-hop link scenario with unsaturated traffic.Furthermore,this paper analyzes their key network performance indicators,including the average queue length,average throughput,average delay and outage probability.The two scheduling algorithms avoid scheduling the links whose buffers are empty and thus improve the network resource utilization.For the one-hop link scenario,network provides differentiated services via adjusting the scheduling probabilities of the destination nodes (DNs) with different priorities.Among the DNs with same priority,the node with higher data arrival rate has larger scheduling probability.For the two-hop link scenario,we prioritize the scheduling of relay-to-destination (R-D) link and dynamically adjust the transmission probability of source-to-relay (S-R) link,according to the length of remaining buffer.The experiment results show the effectiveness and advantage of the proposed algorithms.
Keywords:markov chain;unsaturated traffic;performance analysis;scheduling
I.INTRODUCTION
The scheduling strategy allocates appropriate resource to user and coordinates the behavior of each user[1].With the rise of massive emerging traffic,the requirements of users are different [2–4].How to provide users with differentiated services and improve network performance according to the status of network and users is the key issue of scheduling strategy[5].
It is worth noting that most of the existing scheduling algorithms are proposed based on the saturated traffic,where there always has data to transmit in buffer.Although these algorithms may derive the upper bound of network performance,they are ineffective for the actual situation where the data packet of users arrives randomly and the buffer is sometimes empty.At this time,the unsaturated traffic should be considered.To model this kind of traffic,we must pay attention to the current state of buffer,especially when the queue length is empty.This is because the probability that the user is scheduled should be 0 if there is no data transmission on the link[6].
To avoid the problem of resource waste,we propose new scheduling algorithms for two unsaturated communication scenarios that may exist simultaneously in a wireless cellular network,and analyze the network performance after they are adopted.For one-hop link,each destination node(DN)has the corresponding priority,according to which the network adjusts the response speed to these nodes.In order to ensure that the busy node among the DNs with same priority can be served in time,we increase its scheduling probability.The experiment results demonstrate that the network can provide differentiated and diversified services by using this method.For two-hop link,the relay-todestination(R-D)link has higher priority,and we take the length of remaining buffer as weight to complete the scheduling of source-to-relay (S-R) link.The experiment results show that the proposed scheduling scheme effectively improves network performance,including the average queue length,average throughput,average delay and outage probability.
1.1 Related Works
In one-hop link,the scheduling algorithms can be divided into three categories:random access mechanism,opportunistic scheduling and non-opportunistic scheduling.ALOHA and its various improved versions [7,8]belong to the first kind of scheduling algorithm.The advantage of this kind of algorithm lies in the simplicity of implementation.However,its resource utilization rate is relatively low because of the conflict in resource allocation.In [9],the concept of opportunistic scheduling was proposed for the first time,which is an algorithm considering channel condition of user equipment and taking advantage of multi-user diversity to improve network performance.The algorithm in [9]selects the link with the best channel condition for data transmission.In addition,the opportunistic scheduling scheme includes the following types.Reference [10]designed a scheduling algorithm that considers the current channel information and historical throughput of each user to achieve the proportional fairness of throughput between users.The opportunistic beamforming algorithm was employed in[11]to increase the multi-user diversity gain.Some opportunistic scheduling algorithms were implemented in multiple input multiple output(MIMO)mode.For example,a scheduling algorithm based on zero-forcing beamforming (ZFBF)was given in[12].To further reduce the signaling overhead and improve network performance,some distributed opportunistic scheduling algorithms without central control node were proposed.Reference [13]introduced a distributed scheduling algorithm based on local threshold.Reference [14]adopted a distributed scheduling scheme to jointly optimize the access probability of user and threshold of base station while considering network throughput and scheduling fairness.Reference [1]proposed a distributed opportunistic scheduling algorithm in an unsaturated multi-user system,which considers the correlation between queues and calculates the performance indicators of network,such as delay and quality of service(QoS).In addition,there is an opportunistic scheduling algorithm that first provides service to the user whose product of queue length of buffer and transmission rate of channel is the largest.Reference[15]analyzed the performance of opportunistic scheduling algorithm under the worst condition.However,the opportunistic scheduling algorithms listed above requires the channel state information of users.Therefore,when the number of users is relatively large,they generate a lot of signaling overhead and increase the complexity of network design.The nonopportunistic scheduling algorithm without considering the user channel condition overcomes this shortcoming.In[16],the stochastic geometry and queuing theory were employed to model the multi-tier heterogeneous wireless network.The authors discussed the random scheduling with retransmission mechanism,first-input-first-output(FIFO)scheduling,round-robin(RR)scheduling,and analyzed their effects on the network performance.The earliest deadline first (EDF)algorithm gives higher priority to the packets that will expire soon.The queue-aware algorithm selects the user with the longest queue length for data transmission.However,to our best knowledge,in the existing non-opportunistic scheduling algorithms,there is still no scheduling scheme that considers both the QoS requirement and data arrival rate of user in unsaturated network.Although [6]uses multi-dimensional Markov chain to formulate the queue state of user,so as to analyze the performance of unsaturated network and the influence of different power control algorithms on network performance,the authors did not analyze the scheduling strategy of users.Reference[17]discussed the impact of unsaturated traffic on the uplink by using queuing theory and analyzed the stable throughput region and average delay.However,the authors did not discuss the problem of scheduling strategy.
The two-hop communication [18,19]that deploys a series of relays between source node (SN) and DN can provide diversity gain [20–22].This technology improves the coverage of wireless cell and increases the throughput of edge user[23,24],thus it has been widely used in 5G network and D2D communication.In early two-hop communication networks,the relay nodes had no buffer.In this kind of network,reference[25]proposed a link scheduling method based on max-min criterion in decode-and-forward(DF)mode,which decodes the packets received from SN and forwards them to DN.Reference [26]considers the problem of interference in amplify-and-forward (AF)mode,and a relay node is selected from all the S-R and R-D links according to the max-min scheme for data transmission.However,in a fading wireless environment,the two scheduling methods cannot guarantee that the best S-R and R-D link are chosen to complete the data transmission.For the two-hop network with buffer,its throughput and diversity gain are effectively enhanced.Because the relay is capable of buffering data,the data stored in it need not be forwarded immediately,and the selection of S-R and R-D link can be separately considered.In the network that has buffer and adopts DF mode,the max-max algorithm which takes into account the channel state was proposed in[27]to complete the relay link selection.This algorithm schedules S-R link in odd time slot,stores the received data into data buffer,and schedules R-D link in even time slot,sends the data in buffer to DN.To improve the diversity gain of network,[28]proposed the max-link algorithm,which considers the instantaneous signal strength of relay link and the current state of buffer,schedules the best link of all available S-R and R-D links.Reference [29]proposed a scheduling scheme combining max-max and max-link,which has lower outage probability and delay compared with the max-link algorithm.The link scheduling algorithm considering the buffer usually reduces the outage probability,but generally increases the delay and average queue length.Reference [30]uses channel and buffer state information to schedule the relay link,which reduces the requirement for buffer length.In[31],the available R-D link with the best channel condition is first selected to complete the data transmission.If this type of R-D link does not exist,the network schedules the available S-R link with the best channel condition.In[32],each link is given a weight according to the buffer state,and then the data transmission is completed based on the weight.The simulation results show that the performance of this scheduling algorithm is better than that of max-link.A relay link scheduling method based on maximum signal to interference plus noise ratio was proposed in [33],and it analyzed the outage probability.Reference[34]proposed a relay link scheduling method considering the state of bursty impulsive noise and channel gain,in which the former is calculated by maximum a posteriori detection algorithm.Reference [35]proposed a scheduling scheme which considers the information of the channel state and satisfies the QoS requirements of the DNs with different priorities.However,[27–35]did not make full use of buffer state information and priority of different link types to further reduce the problems of delay and queue length in the two-hop network with buffer.
1.2 Contributions
The main contributions of this paper are as follows:
• We propose the QoS-aware (QA) scheduling algorithm for one-hop network.The proposed algorithm improves the experiences of DNs with higher priority by increasing the probabilities that they are scheduled,and reduces the response speeds for DNs with lower priority at the same time.For the DNs having same priority,the node whose data arrival rate is higher has more opportunities to obtain the network service.The experiment results show that compared with RR algorithm,the network has the ability to provide individualized services for DNs with different QoS priorities.
• For the two-hop network,we first consider the link priority (LP) and select R-D link for data transmission.If no suitable R-D link,the weight of relay node is calculated according to the length of remaining buffer.After sorting these weights,the S-R link with larger weight is given a higher transmission priority.In experiment,we compare this LP/weight-aware(LPWA)scheduling algorithm with the LP-aware (LPA) scheduling algorithm without considering weight.The results show that the proposed algorithm effectively improves the key performance indicators (KPIs) of network.
1.3 Organization of This Paper
The rest of this paper is organized as follows:Section II introduces the system model.In Section III and Section IV,we respectively give new scheduling algorithm in each scenario,and analyze the corresponding network performance with Markov chain.Section V shows the experiment results,and Section VI is the conclusion of this paper.
II.SYSTEM MODEL
In this section,we introduce the system model,including the one-hop and two-hop link model.For ease of reference,the main notations used in this paper are listed in Table1-Table4.
2.1 One-hop Link Scheduling Model
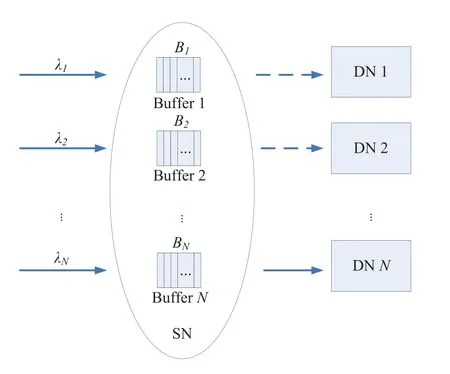
Figure1.One-hop link model.
For one-hop link model,we assumeNDNs are associated with one SN,as shown in Figure1.To effectively serve theNDNs,it is assumed that there areNbuffers with lengthBn(n=1,2,...,N) in SN.When the network provides service for DNs,the SN transmits data for only one DN in each time slot,and the length of time slot is ∆T.For each buffer,the arrived traffic follows Poisson distribution with average rateλn∆T,which is given by

The data processing rate of SN isrn(n=1,2,...,N),respectively.Because the length of buffer is limited,the newly arrived packets will be discarded when the buffer is full.IfQn(t) is used to represent the queue length of DN buffer at any time slott,then the queuelength variation of DNncan be expressed as
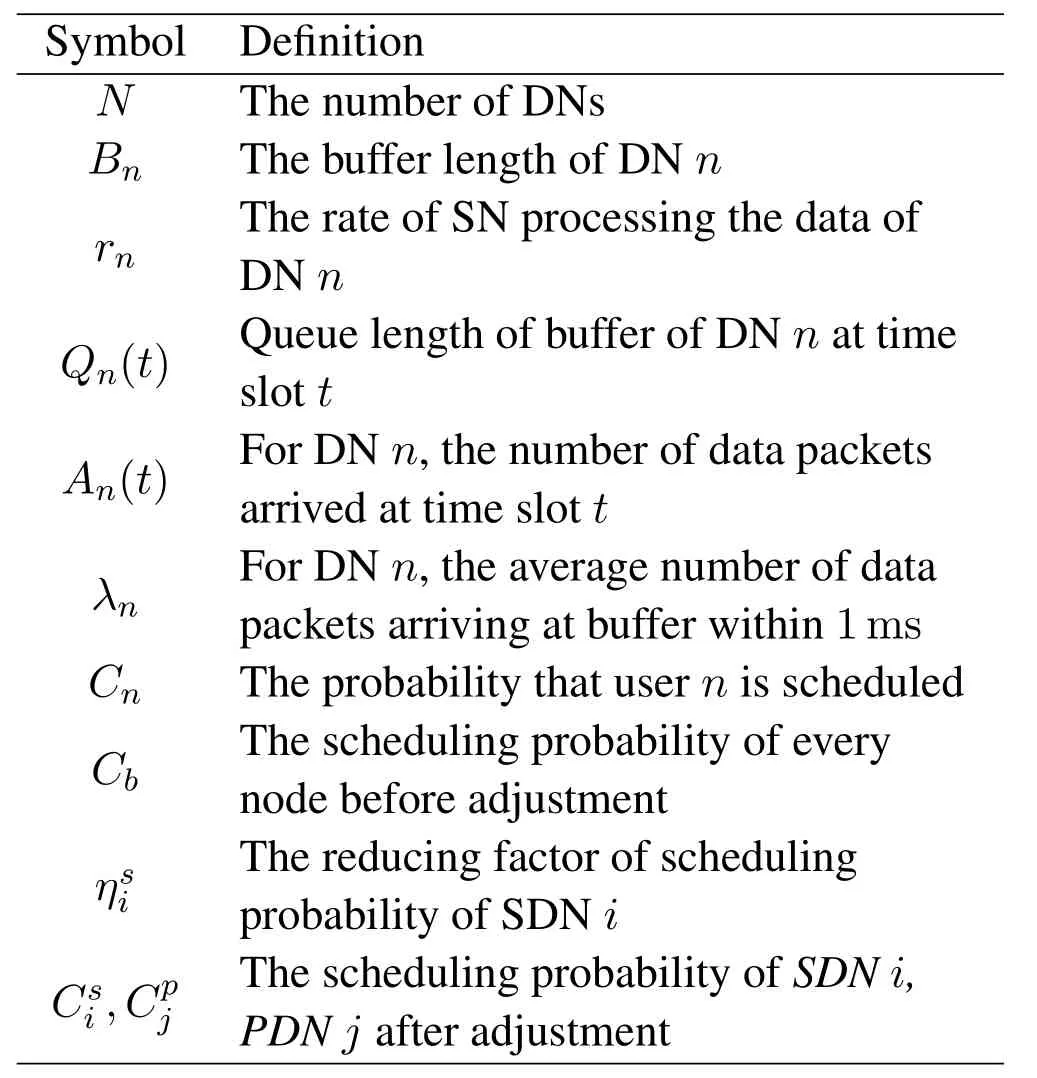
Table1.Main notations used in one-hop model.

This paper assumes that the channel state of each DN remains unchanged throughout the data transmission process,thus the queue length evolution of its buffer is a stochastic process.We can discretize this process by assuming that the queue length only changes at the sampling time.According to (2),the queue length of buffer at time slott+1 is only related to the network stateQn(t),rn,An(t) at time slott,hence it has Markov property.Therefore,the Markov chain can be used to formulate the variation of queue length.
2.2 Two-hop Link Scheduling Model
In this subsection,Figure2 gives the two-hop link model that consists of one SN,Mrelay nodes and one DN.We assume that each relay has a data buffer whose length isL.In this model,no direct transmission link exists between SN and DN,thus the transmission can only be completed through the forwarding of relay node.The relay node that works in halfduplex mode cannot send and receive data at the sametime.The relay decodes the data sent by SN and stores the decoded data into buffer,then the data can be forwarded to DN.Before the start of data transmission,each buffer is empty.If SN successfully completes the data transmission on S-R link,the queue length of buffer increases by 1 unit.If relay successfully sends data to DN,the queue length decreases by 1 unit.If no S-R and R-D link is suitable for data transmission,the queue length remains unchanged.
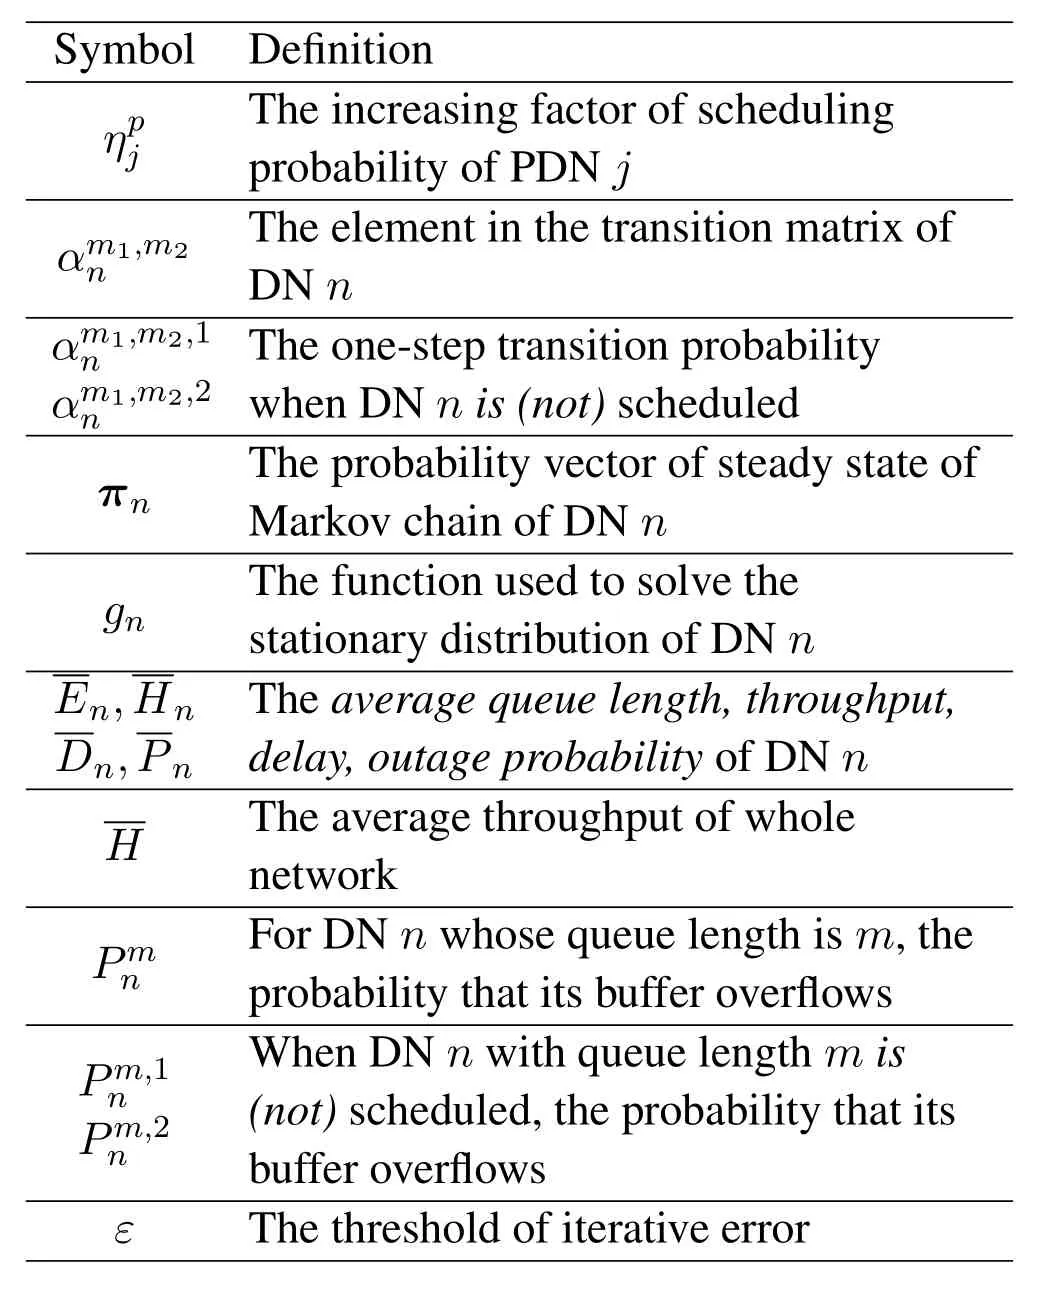
Table2.Main notations used in one-hop model(continued).
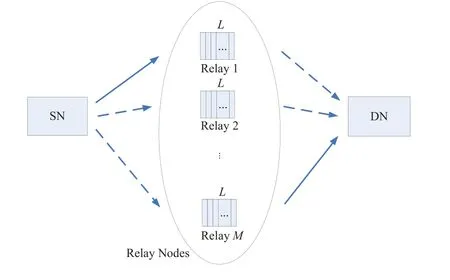
Figure2.Two-hop link model.
We assume that the SN always has data to transmit,similar to one-hop link,the time of data transmission between different nodes is also divided into time slots.This paper concatenates the number of data packets of all relays and defines it as a vector of buffer state.According to the previous system parameters,the buffers have (L+ 1)Mstate vectors in total.Thei-th state vector is defined as
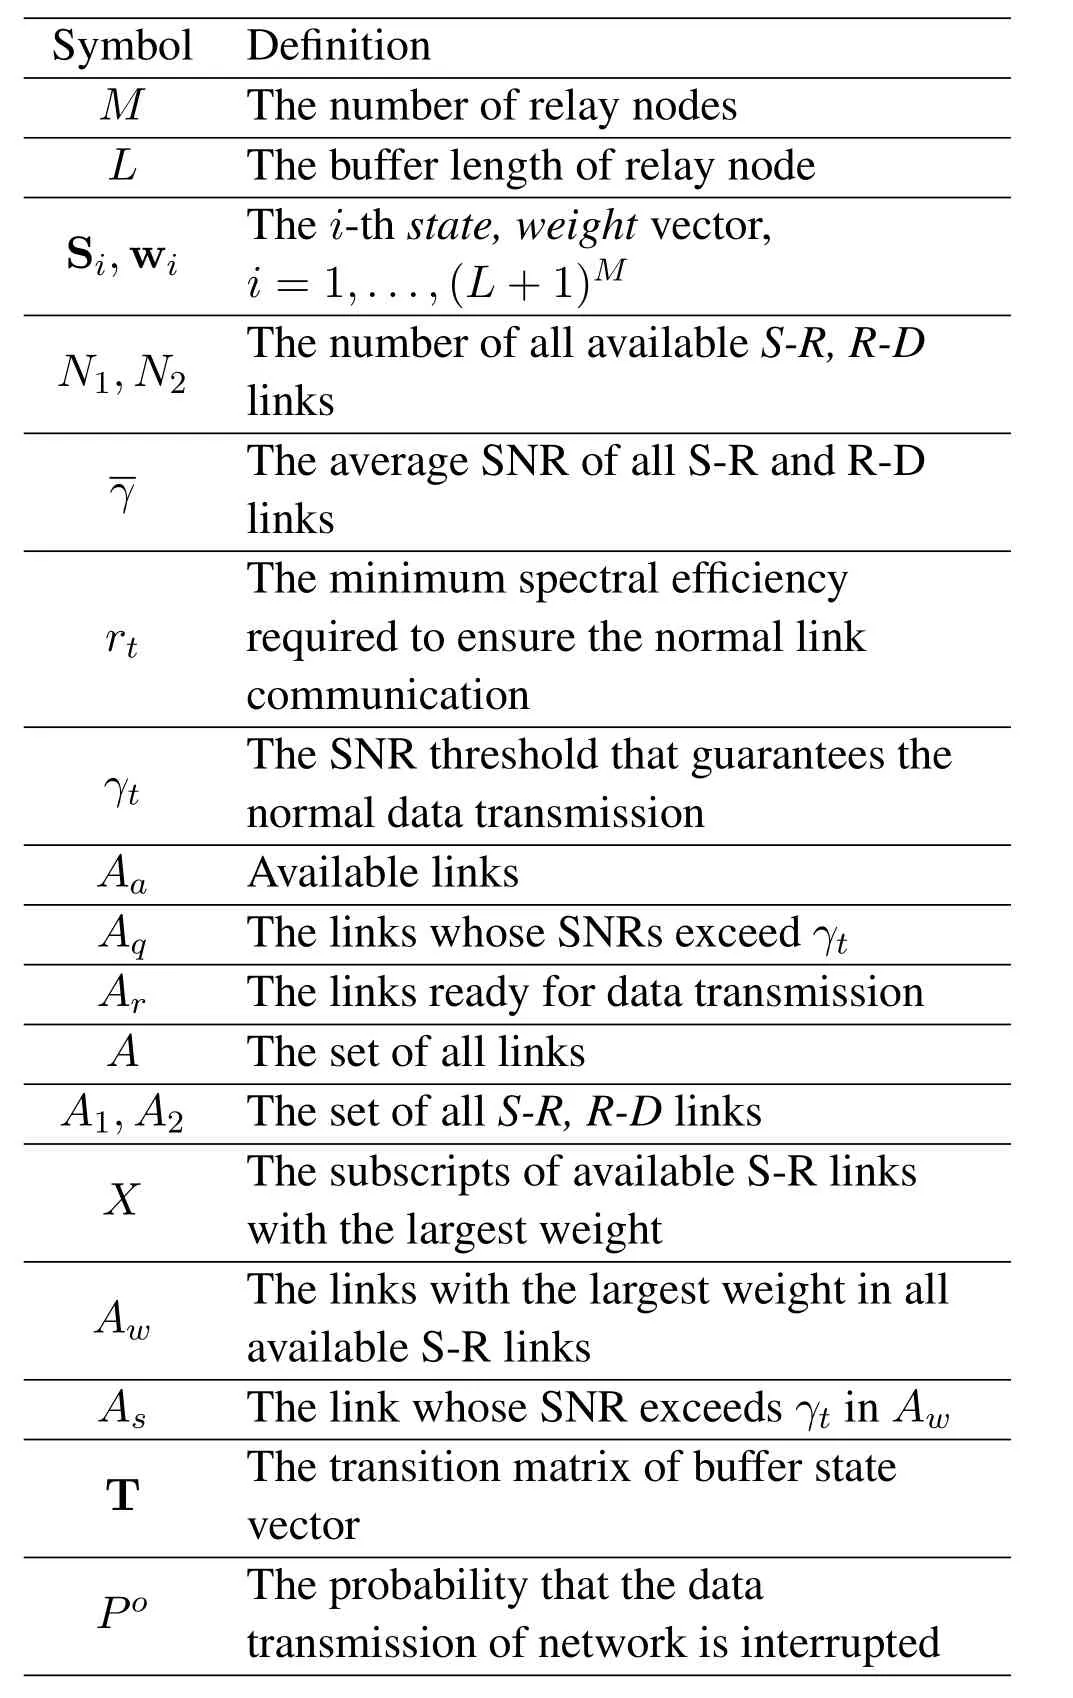
Table3.Main notations used in two-hop model.

wherei=1,...,(L+1)M,andk ≤M)represents the number of data packets in thek-th relay under statei.For each state,N1is used to denote the number of all available S-R links,andN2is the number of all available R-D links.When the buffer of a relay is not full,the link between SN and this relay is considered to be available.Similarly,when it is not empty,the link from this relay to DN is available.When the buffer is neither empty nor full,the links of both sides are available.We can see from the above discussion that 0≤N1≤Mand 0≤N2≤M.
In this paper,the length of remaining buffer is defined as the weight of this relay.SinceLki(1≤k ≤M) in Siis the length of occupied buffer of thekth relay,wki=L −Lkiis the length of remaining buffer,namely the weight of this relay.Obviously,the larger the queue length of current buffer,the smaller the relay weight.When the buffer is empty,wki=L.Andwki=0 if the buffer is full.For whole network,each Sicorresponds to one weight vector
This paper assumes that each relay link is an independent Rayleigh fading channel,whose variation of signal-to-noise ratio (SNR) at different slots is the exponential distribution.The SNRs of relay links remain unchanged within one slot,and between different time slots,the variation of SNR of every link is independent.To simplify analysis,this paper adopts the symmetrical channel model,in which all S-R and RD links have the same average SNRAccording to the definition of exponential distribution,the probability distribution function of SNR on each link can be expressed as

Suppose that the minimum spectral efficiency required to ensure the normal communication on data link isrtbps/Hz,according to Shannon formula,the SNRγcof current link should satisfy log2(1+γc)>rt.Therefore,the SNR threshold that guarantees the normal data transmission can be given by

From(4),we can get

Substituting(5)into(6),we can obtain the probability that current link cannot transmit data because the SNR does not exceed threshold

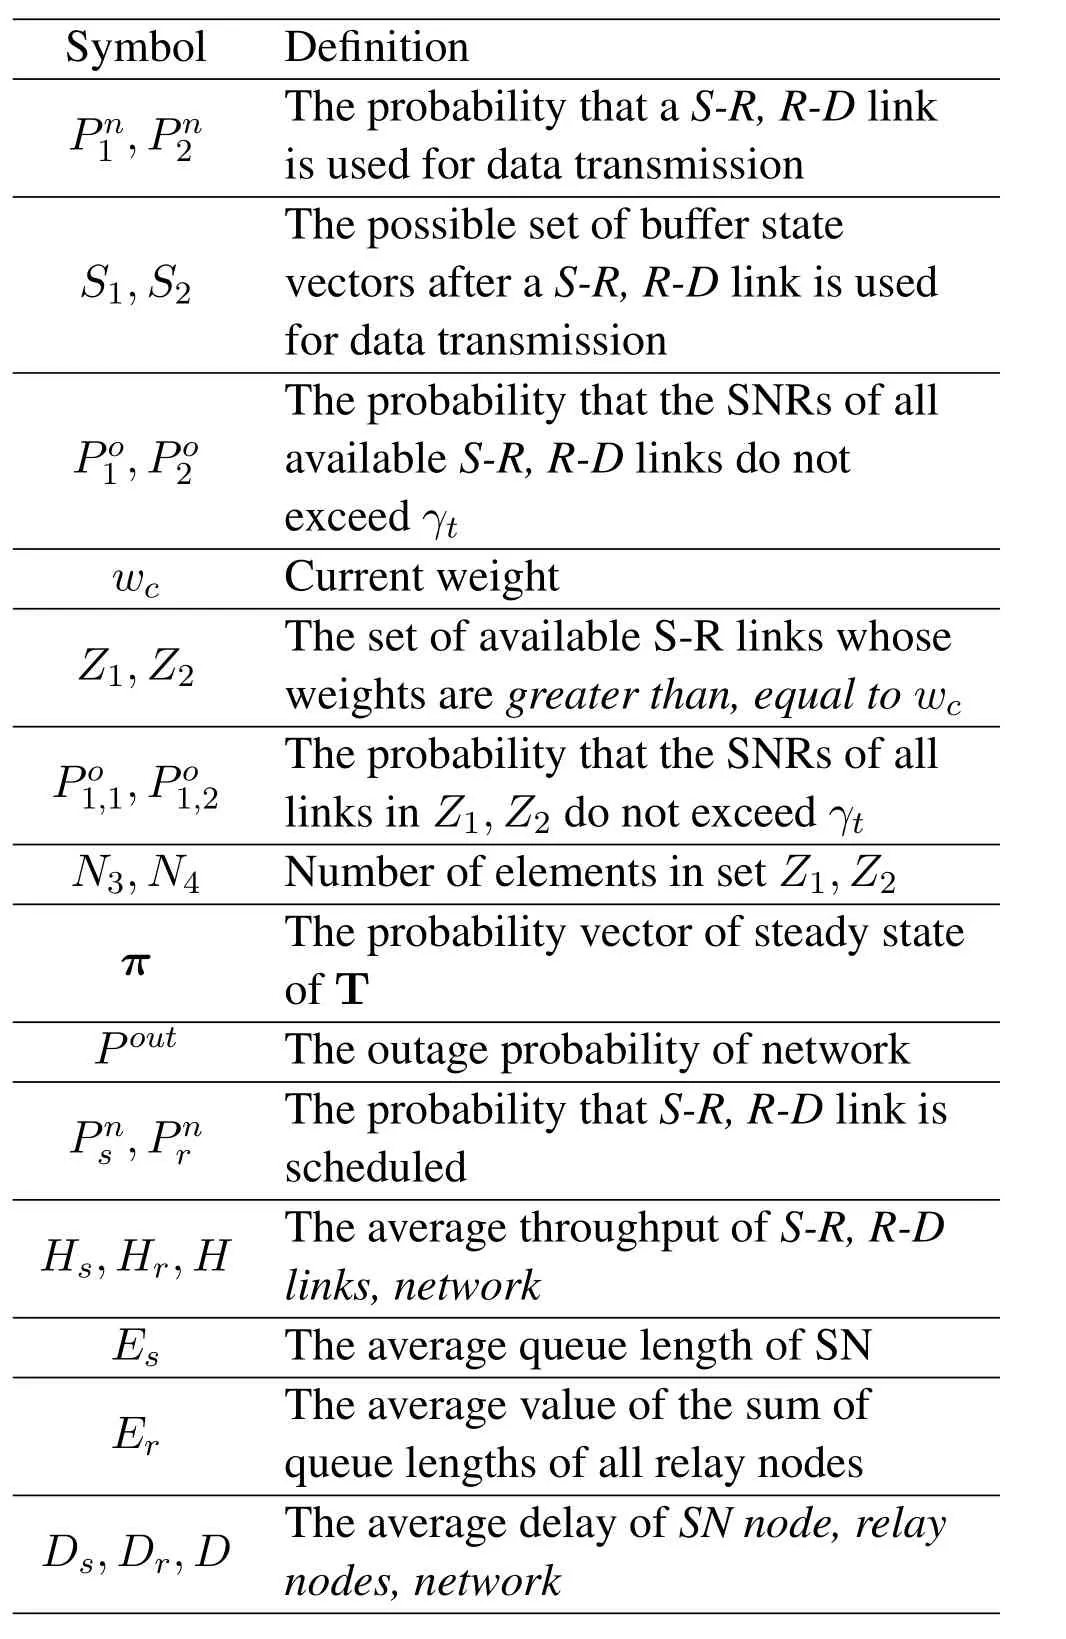
Table4.Main notations used in two-hop model(continued).
According to the above discussion,all links in the network can be divided into three types:
1.Aa:available links.
2.Aq:links whose SNRs exceed the thresholdγt.
3.Ar:available links whose SNRs exceed the thresholdγt.In other words,the links ready for data transmission.

Obviously,the following equation holds.In(9),Ais the set of all links in network.On the other hand,

whereA1andA2respectively represent the set of all S-R and R-D links in network.
Remark 1.The similarities between the two models:Both of them consider unsaturated traffic,i.e.,there is no data transmission when the buffer is empty.As discussed in later sections,we use Markov chain to analyze the variation of queue length of buffer according to the scheduling algorithm they adopted.Furthermore,four similar performance indicators are calculated by solving the stationary distribution of the Markov chain,namely the average queue length,average throughput,average delay and outage probability.
Remark 2.The differences between the two models:1)In one-hop link,one SN contains N buffers,which have one-to-one relationship with DNs.The network directly accomplishes the data transmission without relay node.This scenario considers the link scheduling problem of single side of buffer.2) The two-hop link model has M relay nodes,each of which contains one buffer,and the data transmission can only be completed by means of relay nodes.In this scenario,we should consider the link scheduling problem of two sides of buffer.
III.SCHEDULING ALGORITHM CONSIDERING QOS PRIORITIES FOR ONEHOP LINK
In this section,we propose the QA scheduling algorithm to adjust the scheduling probabilities of different types of DN.For DNSs who have same priority,we increase the scheduling probability of busy node.In addition,we use Markov chain and fixed point iteration method to calculate the KPIs when this algorithm is adopted by the network.This scheduling scheme enables the network to provide DNs with individualized services.
3.1 Scheduling Strategy and Stationary Distribution
3.1.1 Scheduling Algorithm
As we know,the performance of wireless networks is directly related to the scheduling algorithm.If network adopts the RR scheduling algorithm irrelative to wireless channel conditions,the user whose queue length is greater than 0 will be scheduled,and the scheduler provides service to users sequentially.Suppose that the queue lengths ofVusers are greater than 0,then the probability that a certain user is scheduled is 1/V.Therefore,for RR algorithm,the probability that usernis scheduled can be expressed as

whereQiandQjrespectively represent the queue length of useriand userjunder stationary distribution,S={...,n,...}is a user set that must include usernand may contain other users.In (11),the first item in summation symbol represents the reciprocal of number of users contained inS.The second term indicates that when all users inSreach the stationary distribution,separately calculate the probability that the queue length of each user is greater than 0,and then multiply the calculated results.Similarly,the third term is to calculate the probability that the length inSis equal to 0,and then perform the multiplication operation.Finally,the probability that the usernis scheduled can be calculated by summation operation.
In actual wireless networks,different users have various QoS requirements.For example,for the upload and download service based on the file transfer protocol (FTP) or sending and receiving E-mails,the resources allocation scheme of best effort(BE)can meet the requirements of these users.However,for some services requiring short delay,low jitter and high reliability,such as online games,video calls,etc.,the network must provide the corresponding service priority to ensure that the services of these users will be served in time.Otherwise,it may affect the experience of users.For the various service types in wireless cellular networks,reference[4]gave a detailed classification and summary.
After considering the QoS requirement,this paper classifies the DNs in network into two categories:primary DN (PDN) and secondary DN (SDN).And we propose a new scheduling probability adjustment algorithm,which considers the QoS priorities of DNs,so that the network has the ability to provide individualized services for different DNs.During the adjustment,we notice the data arrival rate of DN.For SDNs,the node with high arrival rate needs more network service.Hence,compared with other SDNs,its scheduling probability after adjustment is relatively large.Similarly,among the PDNs,the higher the rate is,the larger the adjusted scheduling probability becomes.For the DNs whose buffers are not empty in network,we suppose thatCbis the scheduling probability of every node,which is obtained from(11).The adjustment methods of their scheduling probabilities after considering the QoS priority will be given below.
Definition 1.The reducing factor of scheduling probability of SDN is defined as

Base on this factor,we modify the scheduling probability of SDN as

From(12)and(13),we can see that if the average arrival rate of a SDN is lower than that of other SDNs,its reducing factor will be relatively large.Therefore,it has fewer opportunities to obtain the network service after adjustment,namely the response speed of network becomes slower.
Definition 2.The increasing factor of scheduling probability of PDN is defined as

In(14),

whereV2denotes the number of PDNs whose queue lengths are greater than 0.
Based on the increasing factor and modified probabilities of SDNs obtained from (13),we increase the probability that PDN is scheduled to

In(16),

whereV1represents the number of SDNs whose queue lengths are greater than 0.
We can see from (14) that compared with other PDNs,the node with higher average arrival rate has larger increasing factor.Therefore,according to(16),it can obtain more network service after adjustment,and its network performance will be improved more significantly.
From the above discussion about probability adjustment methods,we can get the following proposition.
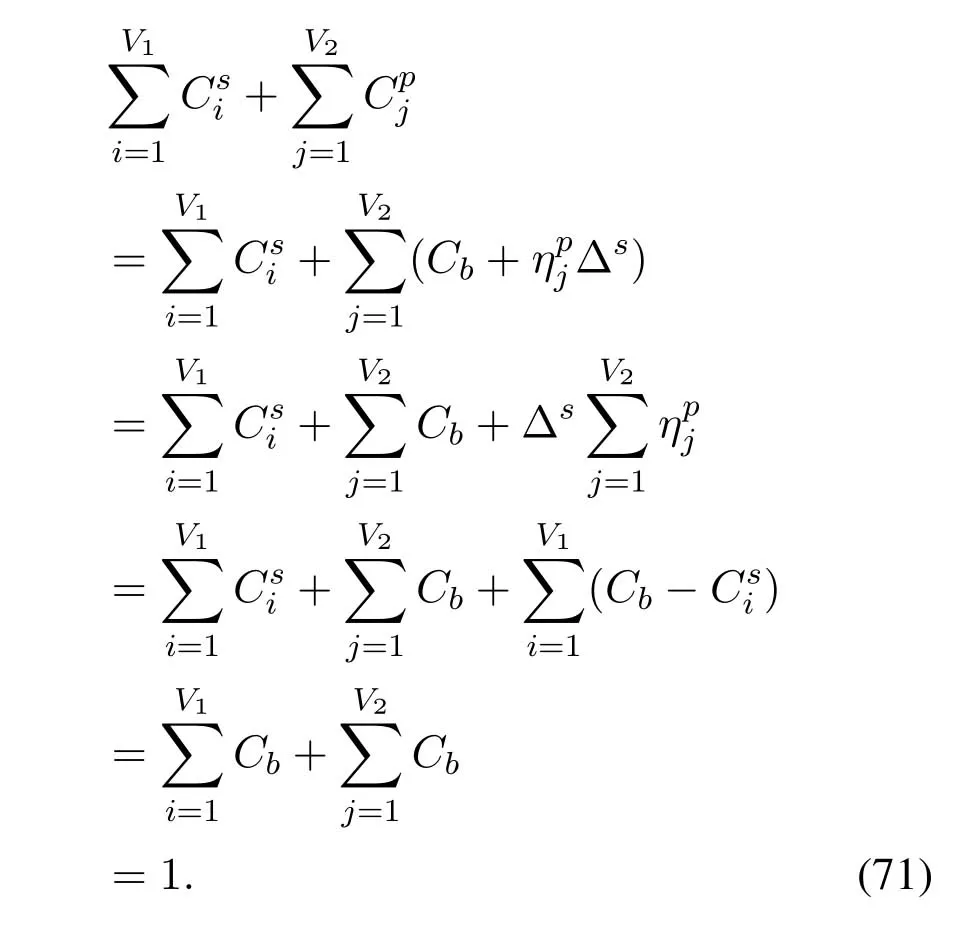
Proposition 1.For all DNs whose buffers are not empty in the network,the following equation

holds.
Proof.See Appendix.
3.1.2 Solveπ
We use

to represent the value of each element in the transition matrix of DNn,which is the transition probability of queue length fromm1tom2.After the QA algorithm is adopted,ifm1/=0,based on the formula of total probability,we can get

wheredenotes the one-step transition probability when DNnis scheduled,andis the probability when the DN is not scheduled.Because the service rate of network isrnif the DN is scheduled,otherwise it is 0,according to(2)and the definition ofBn,we can obtain[36]
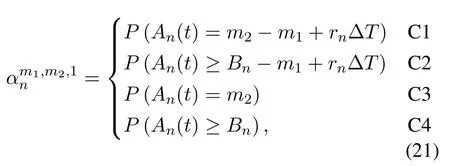
where
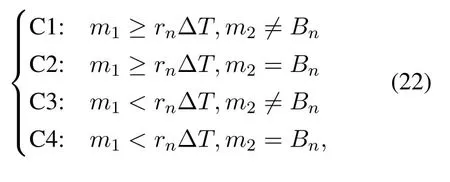
and

where

The calculation method ofP(·) in (21) and (23) is given by (1).Whenm1=0,the DNnwill not be scheduled,and according to(23),we have

The probability vector of steady state of this Markov chain can be expressed as

where

Then the stationary distribution of ergodic processQn(t)is given by the following balance equation
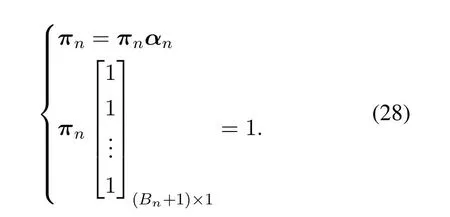
The solution of (28) can be obtained by solving the linear system of equations.
3.1.3 Fixed Point Iteration
Since there areNDNs in the network,if these stationary distributions of queue length are calculated in sequence,the stationary distribution of DNncannot be solved according to the previous formulas.The reason is that we only obtain the values of{π1,...,πn−1}when calculatingπn.According to the fixed point theorem in[37],we can use the following fixed point equation

to solve the stationary distribution ofNinterrelated Markov chains,whereπ=[π1,π2,...,πN]is the iteration vector of the equation.Therefore,this paper adopts the fixed point iteration algorithm to calculate the stationary distribution ofNDNs in network.In (29),the functiongconsists ofNindependent functions{g1,g2,...,gN},in which the functiongnis used to solve the stationary distribution of DNn.That is

The vectorπthat consists of the probability vectors of steady state ofNDNs satisfies (29),thus it is called the fixed point of (29),which can be obtained by the iteration method proposed in[37].

In the iteration process,each element in initial valueofπcan be set to any value between 0 and 1.Then in thek-th iteration,we can get where the value of left side of this equation is determined by functiong,which takes the values obtained by the last iteration as its parameters.In thek-th iteration,when solving the stationary distribution of DNn,we useas the input to calculateThen,in the vector is replaced bySimilarly,we can obtain the stationary distribution from the (n+1)-th DN to theN-th DN.If the variation of iteration vector is less than a given threshold between two successive iterations,then the iteration process stops.Proposition 2 proves the convergence of the above fixed point iteration algorithm.
Proposition 2.If rn∆T ≥Bn,then the iteration process shown in(31)is convergent.
Proof.According to Theorem 2 in [37],the proposition is equivalent to that ifrn∆T ≥ Bn,then the Markov chain that describes the evolution process of queue length of DNnis irreducible.We can prove the irreducibility by showing that there is always a state transition path of non-zero probability fromm1tom2.
In order to prove the existence of path,we only need to consider the scenario that the buffer does not overflow during the evolution process of queue length.Specifically,two cases should be discussed.
1.Ifm1=0,thenrn=0.We can get from(2)that
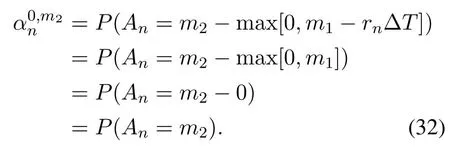
Therefore,the state transition path exists in this case.
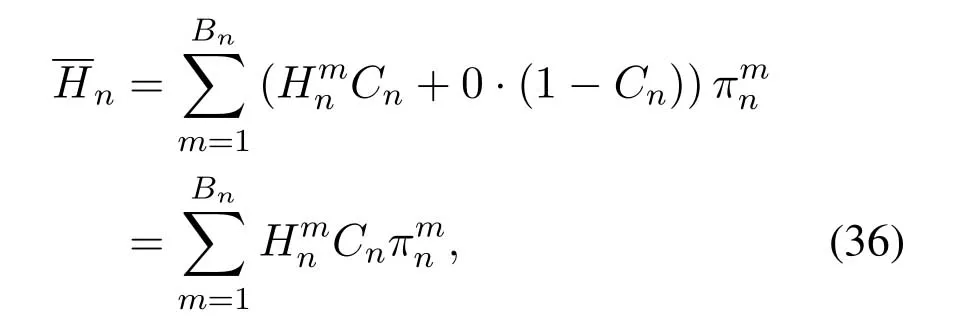
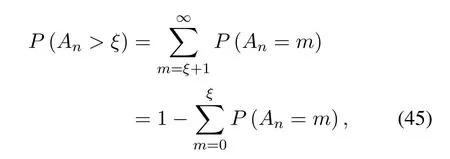
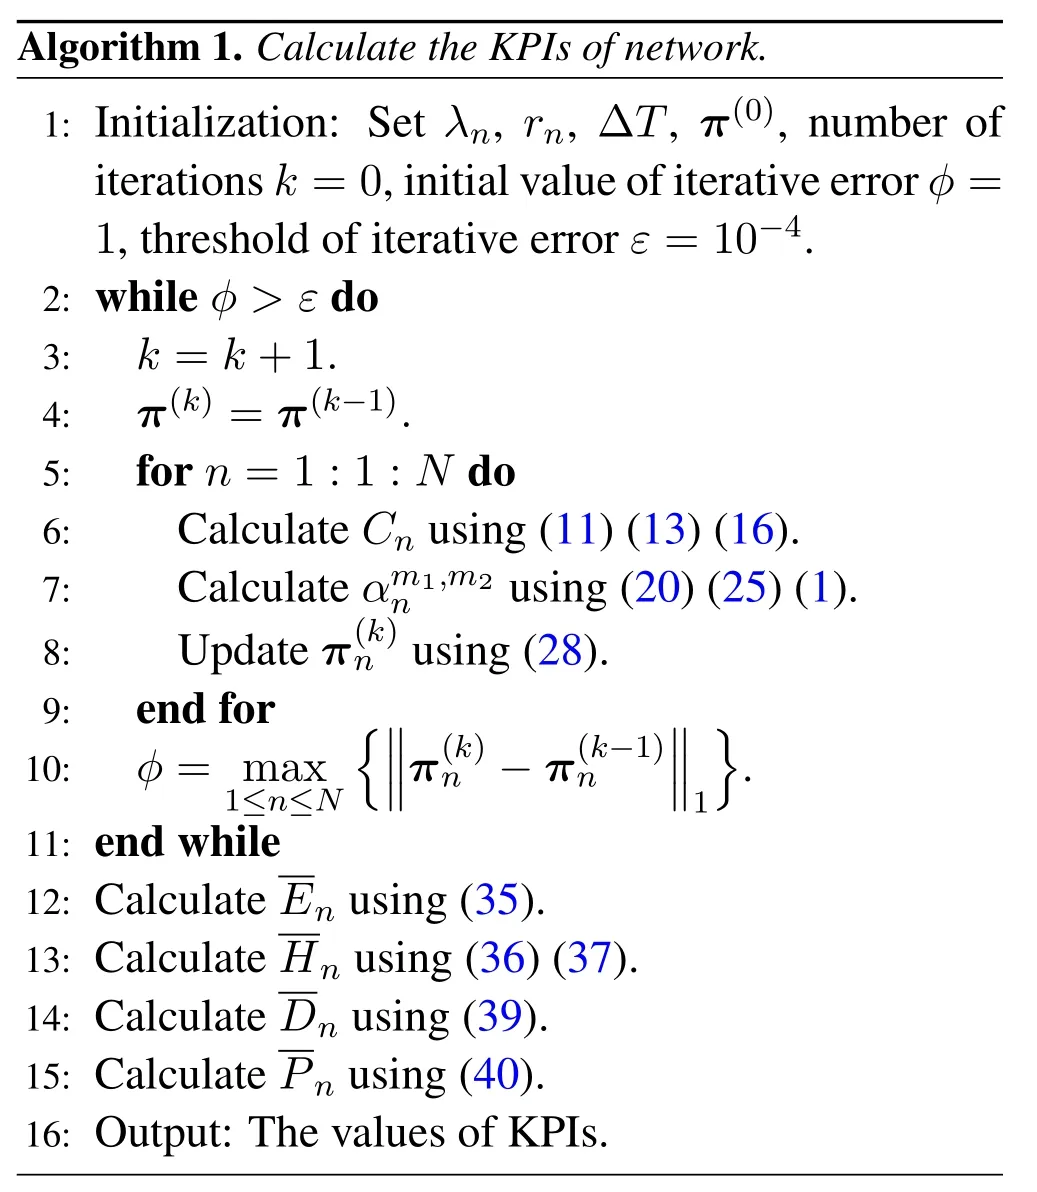
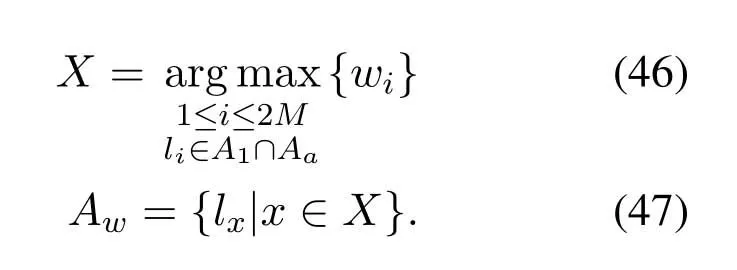
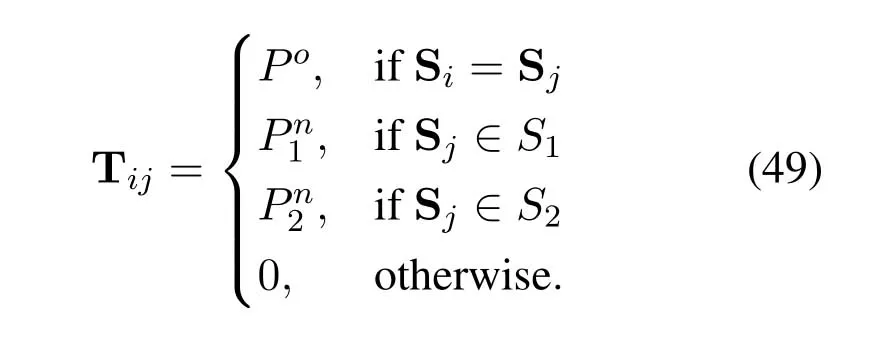
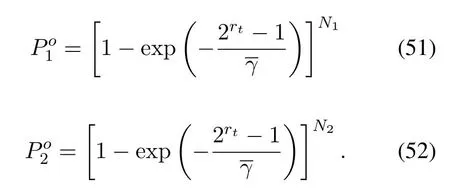
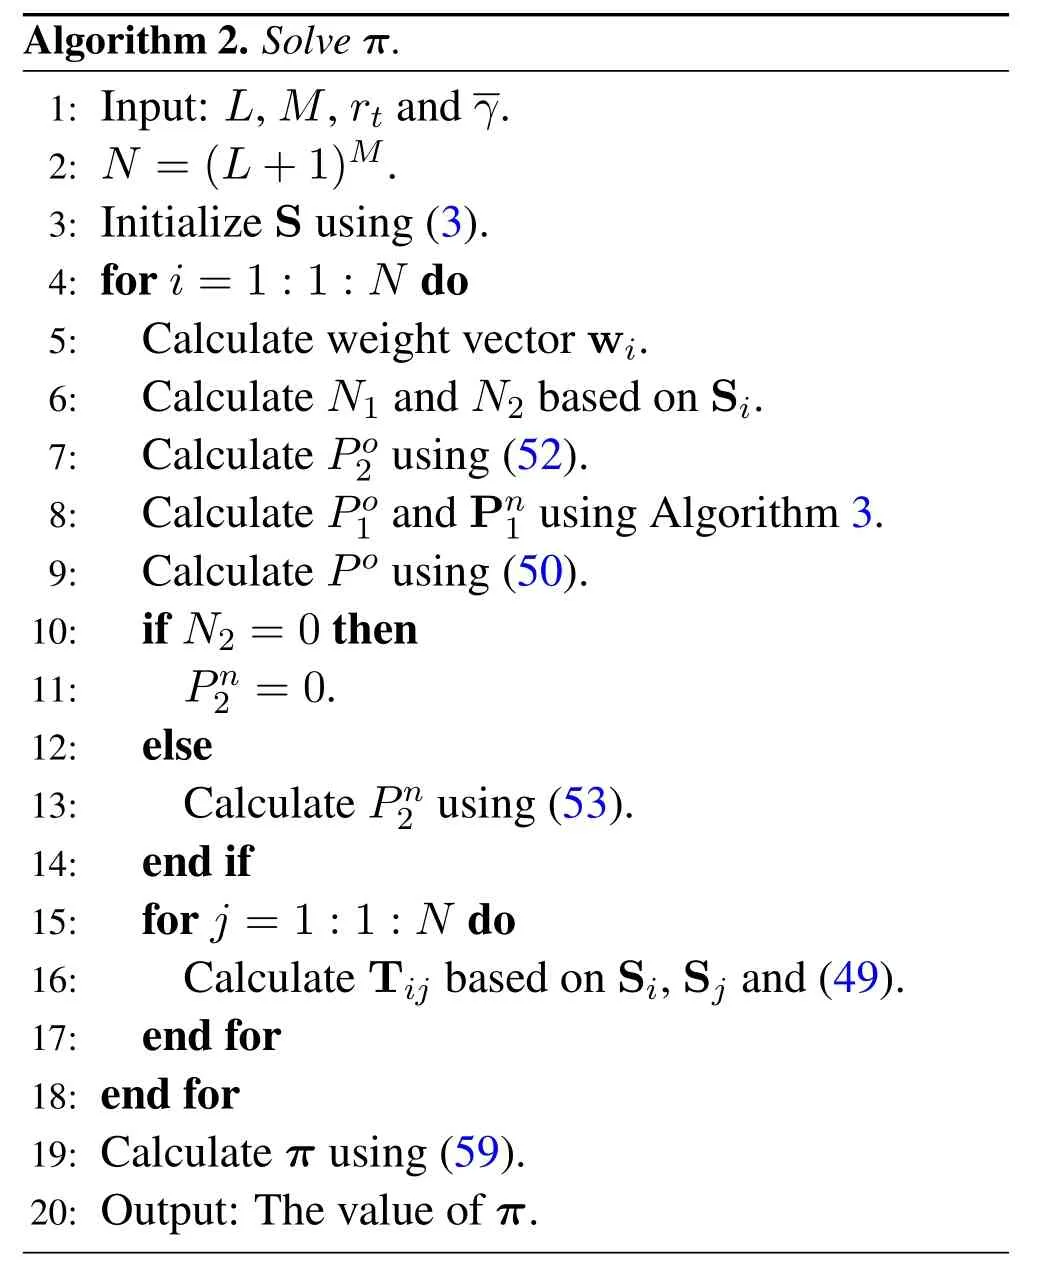
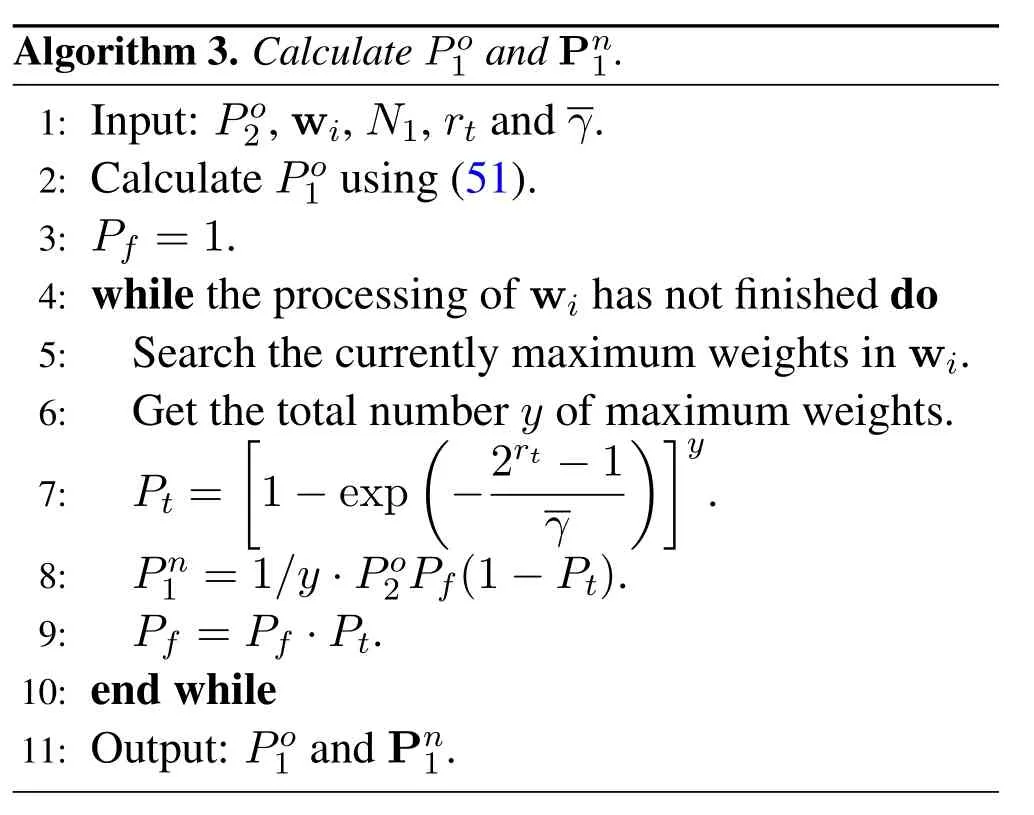
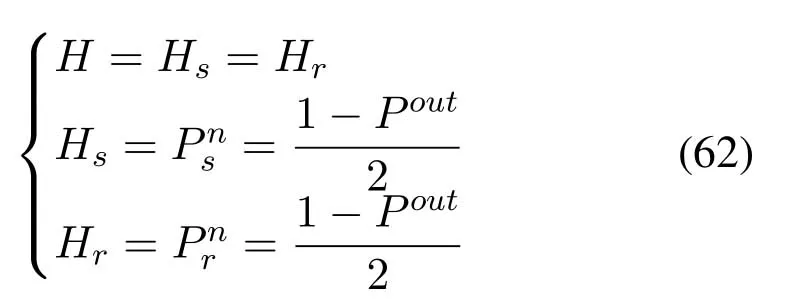
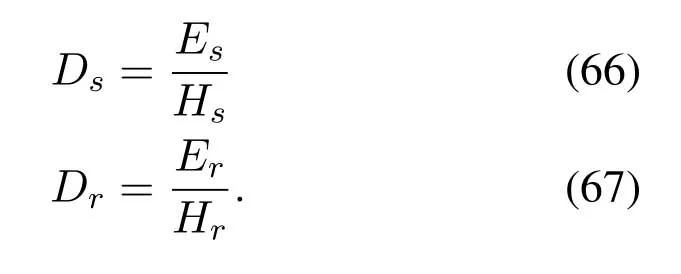
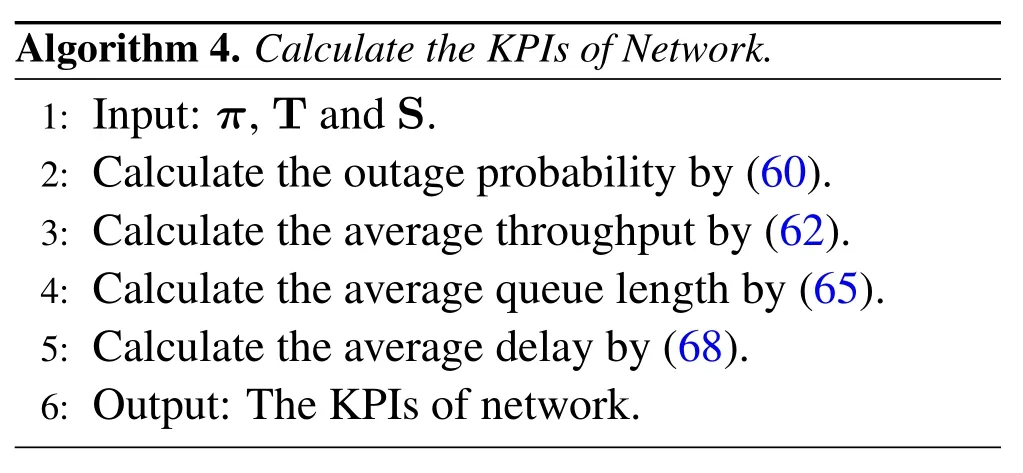
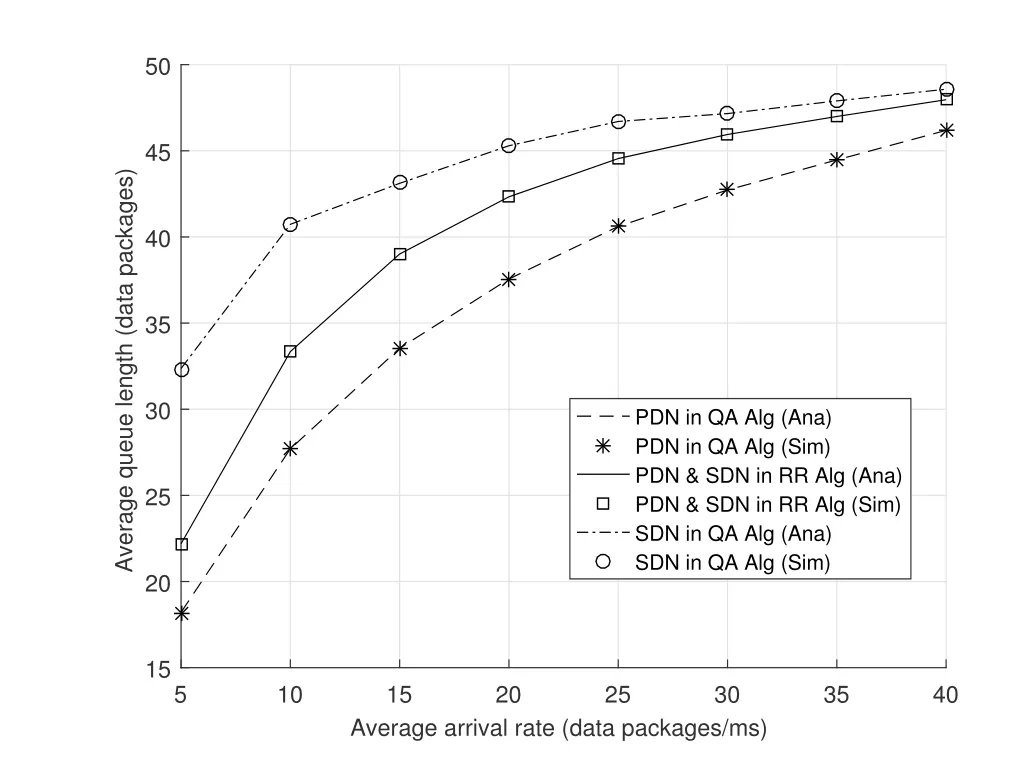
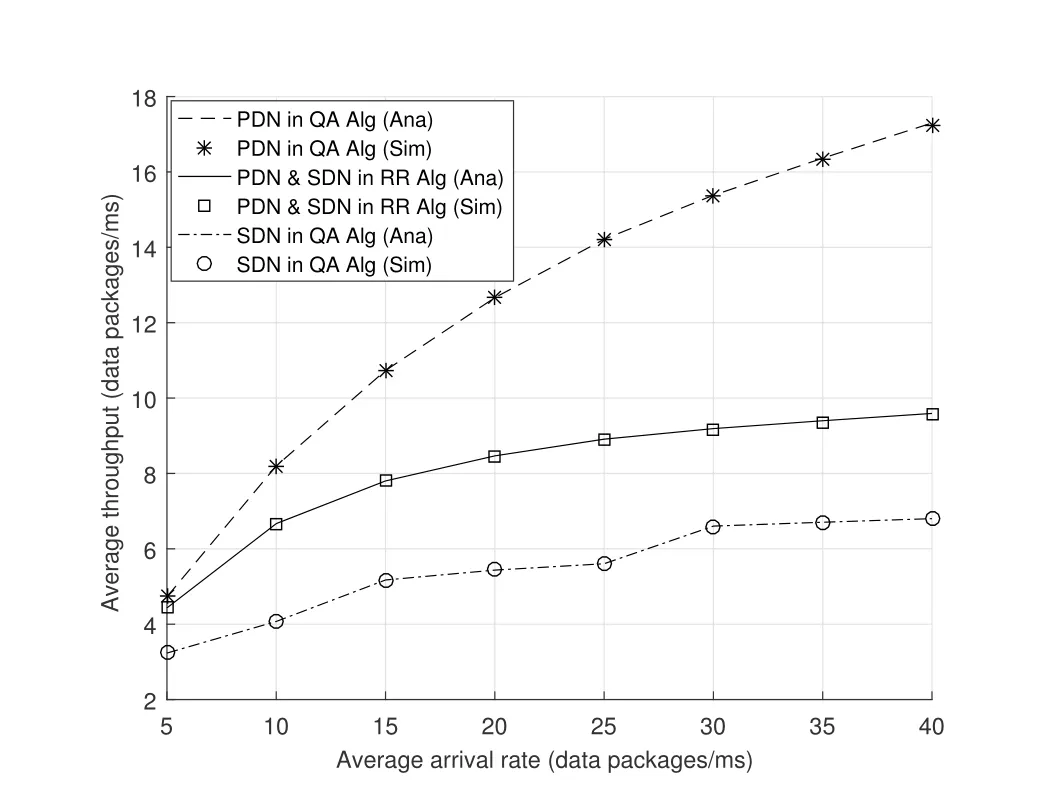
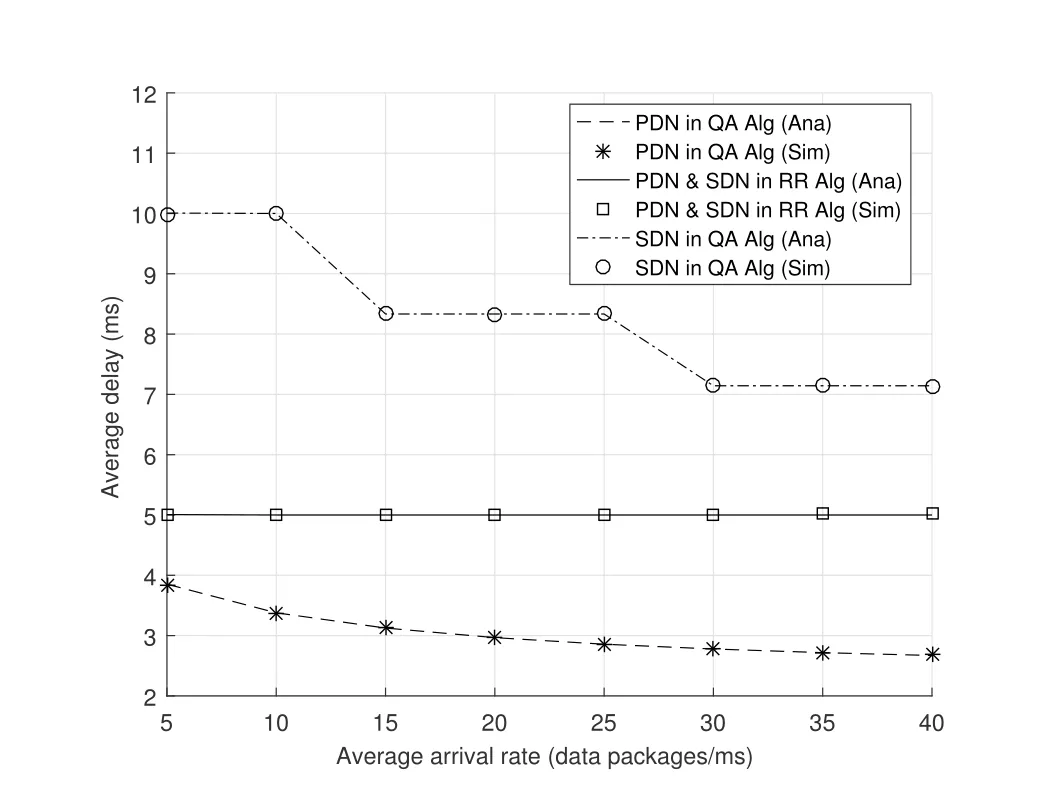
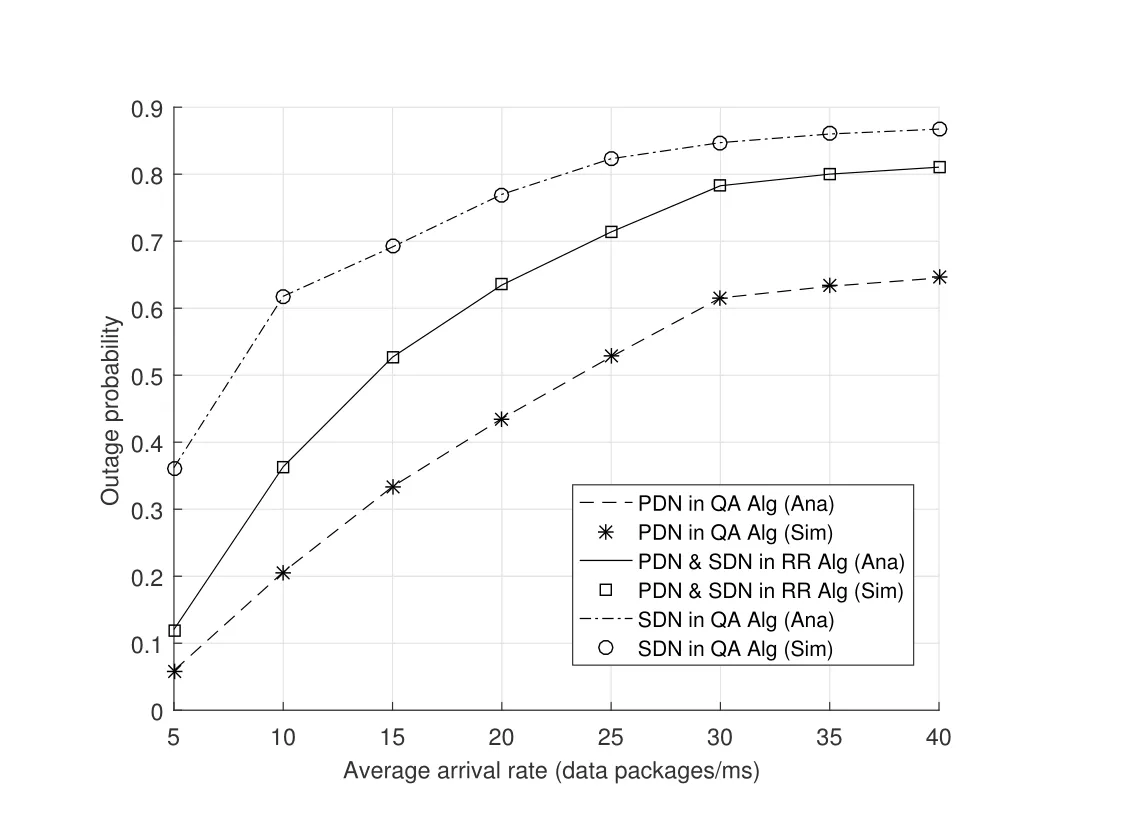
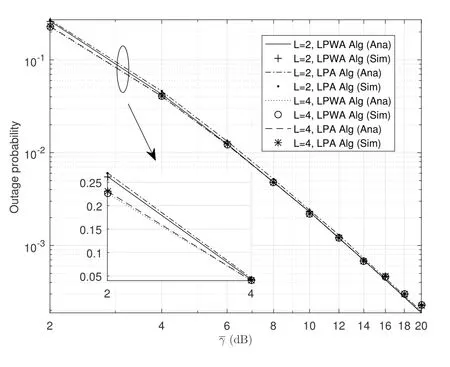
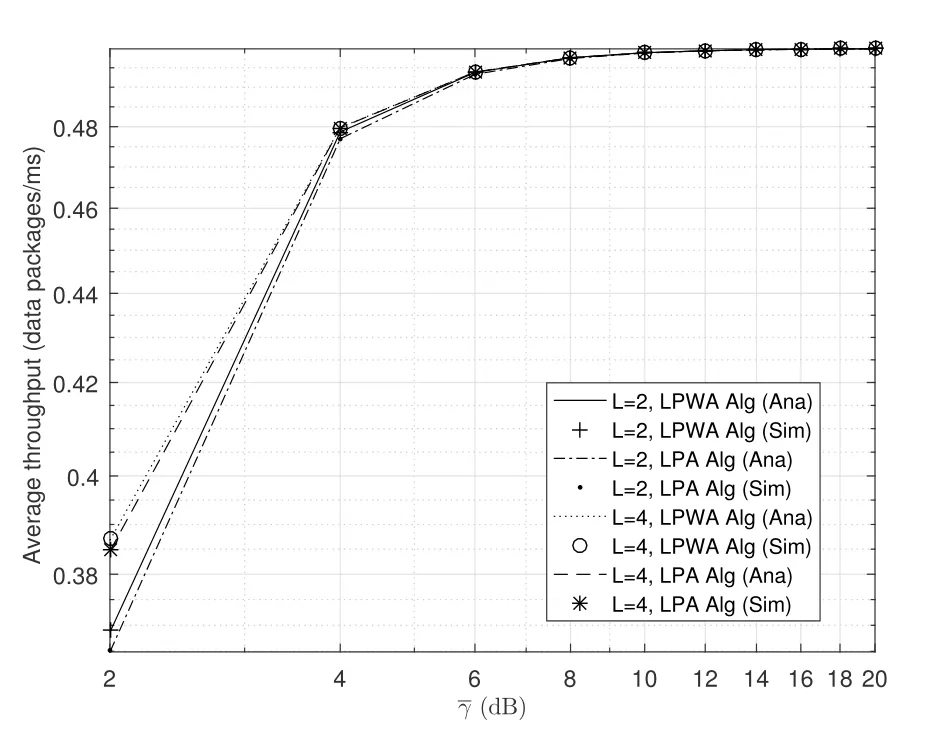
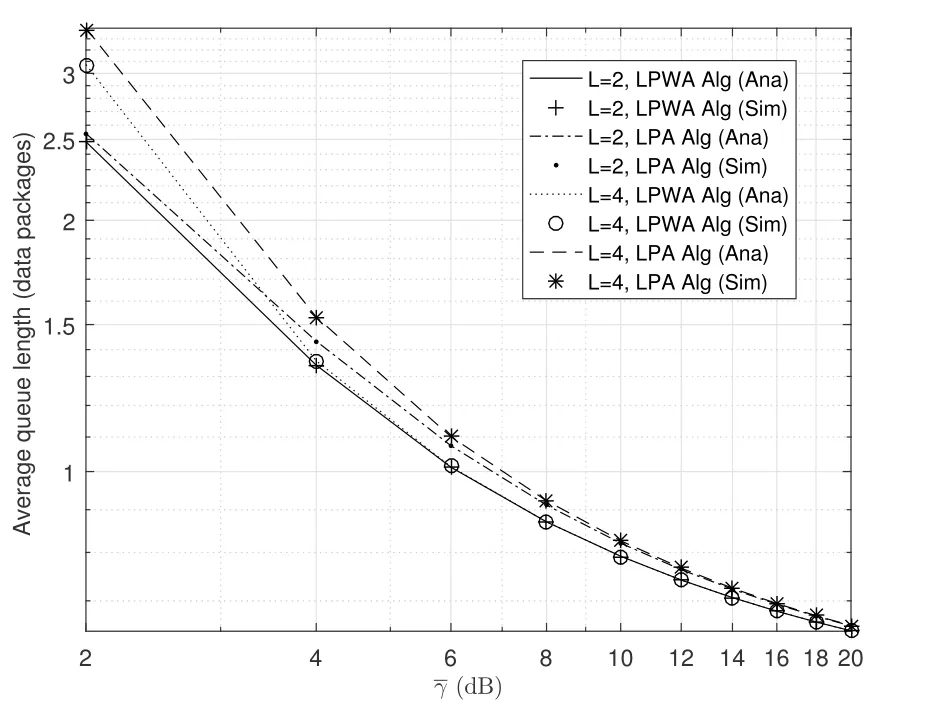
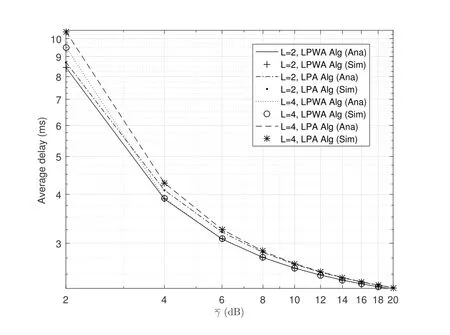
2.Ifm1>0,then 0 If 0 Therefore,the state transition path also exists in this case. From 1 and 2,we can see that the state transition path always exists in both cases,thus Proposition 2 has been proved. After the stationary distribution ofQn(t) is obtained from(20)and(28),we can calculate the KPIs of network. The queue lengthQn(t) of DNnat any time slot is a random variable.According to the basic principle of probability theory,its average queue length is the mathematical expectation ofQn(t),which can be expressed as If the queue length of buffer of DNnis 0,then this DN will not be scheduled,and its throughput also becomes 0.Thus the average throughput of DNncan be given by whereHmn Cn+0·(1−Cn)represents the mathematical expectation of throughput when the queue length of DNnism,and[38] Equation(36)shows that the average throughput is the sum of the product of the probability that the queue length ismand the mathematical expectation of corresponding data transmission rate.Equation(37)shows that when DNnis scheduled,if the amount of data in current buffer is greater than or equal to the processing capacity of SN in one time slot,its throughput is equal to the data processing rate of SN.Otherwise,it is the ratio of the amount to the length of time slot.It is obvious that the average throughput of whole network According to Little’s theorem[39],the average delay of DNnduring data transmission is According to the formula of total probability,the outage probability of DNncan be given by wherePmndenotes the probability of buffer overflow when the queue length of DNnism.Whenm=0,the DNnwill not be scheduled,thus Whenm>0,we have whereindicates the probability of buffer overflow when DNnis scheduled,andis the probability when the DN is not scheduled.They can be respectively expressed by and In(41),(43)and(44), whereξ ≥0. ? Summarizing the above discussion,we can get the calculation method of KPIs when the QA scheduling algorithm is adopted as shown in Algorithm 1. According to the formulas of Algorithm 1,within forloop,the calculation complexity of line 6 isO(2N−1×N).In line 8,the linear system of equations withBn+ 1 variables should be solved to calculateπn,and its computational complexity isO((Bn+1)3).LetL1be the number of iterations of while-loop,thus the total computational complexity of line 6 and line 8 areO(L1N22N−1) andspectively.The complexity of computing network performance is mainly dominated by line 15,whose complexity isWe can see from the above analysis that the computational complexity of Algorithm 1 isnamely Different from one-hop link,we propose the LPWA scheduling algorithm in this section,which schedules R-D link first and completes the scheduling of S-R link according to the length of remaining buffer.Furthermore,we use Markov chain to discuss the calculation method of network performance indicators when this algorithm is adopted.By reducing outage probability,this scheduling strategy improves the network performance. 4.1.1 Scheduling Algorithm In this paper,the R-D link is given higher priority,so that the data in buffer can be transmitted to DN as soon as possible.The S-R link is scheduled only when these links are unable to transmit data.By using this method,the average queue length of buffer and average delay of network can be reduced.To further optimize the network performance,when selecting a S-R link for data transmission,the network gives priority to the link with larger weight,i.e.,the relay node corresponding to this link has more remaining buffer space.Because this method reduces the probability that the buffer is full and improves throughput,the average queue length and average delay further decrease. Specifically,at any time slott,the LPWA scheduling algorithm is as follows: 1.Select the link with the largest SNR from all available R-D links.If its SNR exceedsγt,this link is utilized to complete the data transmission from relay to DN. 2.Otherwise,find the links with the largest weight from all available S-R links,which is given by Then select the link whose SNR exceedsγtfromAwto complete the data transmission,namely If more than one link satisfies this condition,i.e.,|As|>1,the link with the largest SNR is selected for data transmission. 3.IfAs=∅,then select the link with the second largest weight by repeating 2 for data transmission.And repeat in this way until the suitable SR link is selected or all S-R links have been accessed. 4.If no suitable link is found in the above procedure,the data transmission is interrupted. 4.1.2 Solveπ In this paper,T is defined as the transition matrix of buffer state vector,and both its number of rows and columns are(L+1)M.We use Sito denote the state vector of buffer at time slott;at time slott+1,the vector is Sj.Each element Tij=P(Xt+1=Sj|Xt=Si)in T represents the transition probability from Sito Sj,which can be calculated by The first case indicates that the state vector of buffer does not change and the data transmission of network is interrupted,and this probability is expressed byPo.In the second case,the network selects a S-R link for data transmission,whose probability is expressed byPn1,andS1represents the possible set of buffer state vectors after the transmission.In the third case,the data transmission is accomplished by R-D link,whose probability is expressed byPn2,andS2represents the possible set of buffer state vectors att+1.The fourth case shows that there is no transition relationship between Siand Sj,and the transition probability is 0. In the system model of this paper,the outage probability can be expressed as wherePo1andPo2respectively denote the probability that the SNRs of all available S-R and R-D links do not exceedγt.In accordance with(7),we have According to the previous scheduling algorithm,if the set of available R-D links whose SNRs are larger thanγtis not empty,then one link is selected from this set for data transmission.Based on probability theory,we know that the probability that a certain link in this set is selected can be given by Similarly,when the SNRs of all available R-D links do not exceedγt,and the SNRs of all available S-R links whose weights are larger thanwcalso do not exceedγt,one link is selected from the S-R links with weightwcfor transmission.The set of available S-R links whose weights are greater thanwccan be denoted as And we use to represent the set of available S-R links with weightwc.Therefore,the probability of using a certain link inZ2to complete the data transmission between SN and relay node is wherePo1,1andPo1,2respectively represent the probability that the SNRs of all links inZ1andZ2do not exceedγt,andN4=|Z2|.According to (7),we can get wherePo2is given by(52),andN3=|Z1|. From[28],we know that the transition matrix T of Markov chain constructed in above procedure is reversible,column stochastic,aperiodic and irreducible.Therefore,its probability vector of steady state can be obtained by solving linear system of equations To sum up the above analysis,the method of getting the solution ofπis shown in Algorithm 2 and Algorithm 3. Remark 3.If the average SNRs of S-R and R-D link are different,the probability that the SNR of available link of two sides does not exceed γt should be calculated with the average SNR of corresponding segment.We respectively useSNR of S-R and R-D links,andadjusted as follows:1)in(51)and(52)is replacedby(53)is substitutedwith(57)are replaced withline 1 of Algorithm 2 is substituted by1 and line 7 of Algorithm 3 is replaced by ? Remark 4.When the average SNRs between links may not be the same,the probability that the SNR of each available link does not exceed γt should be calculated separately using the average SNR ofthe corresponding link.If=1,...,M,then these formulas should be modified as follows:1)The calculation method of Po1in(51)is substitutedwithThe cal-culation method of Po2in(52)and(53)is replacedbyThe calcu-lation method of Po1,1and Po1,2in(56)are respec-tively substituted byandwhere S3and S4are theset constructed by the link subscripts of Z1and Z2with5)In Algorithm 3,in lines 1 is substitutedwithand the calculation method of Pt in line 7is replaced bywhich S5is the set constructed by the subscripts of re-lay node with the currently maximum weights. ? According to the formula of total probability and the first case of(49),when all buffer states are taken into account,we can get that the outage probability of network is whereπiis the probability of steady state of Siand diag(T) represents a column vector consisting of all the diagonal elements of T. For whole network,we have wherePnsandPnrrepresent the probability that the S-R and R-D link is scheduled,respectively.The average throughputHof network is equal to the average throughputHsof S-R links andHrof R-D links,thus the following equations hold[40]. The SN always has data to transmit,thus its average queue length depends on the probability that the S-R link is scheduled,which is further related to the outage probability of S-R link.Specifically,the average queue length of SN is[41] According to(62),we can get In this paper,all relay nodes are regarded as one equivalent buffer,thus the average queue length of these nodes is the mathematical expectation of the sum of all queue lengths,which can be expressed as whereLkiis defined in(3). When a data packet is waiting for transmission at the SN and relay node,two different types of delay are generated,which are represented byDsandDrrespectively.Based on Little’s theorem,we can know Therefore,the average delay of network Summarizing the above analysis,we can obtain the calculation method of KPIs of network as shown in Algorithm 4. ? In Algorithm 2,the computational complexity of initialization statement in line 3 isO((L+ 1)M).For Algorithm 3,letL2be the number of iterations of while-loop,we can obtainL2≤M,hence its computational complexity isO(L2×M).The complexity of the inner for-loop in lines 15-17 isO(M(L+1)M).Therefore,the complexity of Algorithm 3 is less than that of the inner for-loop.According to the analysis in Section 3.3,the complexity of line 19 that solvesπisO((L+1)3M).The complexity of Algorithm 4 mainly depends on line 4 whose complexity isO(M(L+1)M).From the above analysis,we can get that the total computational complexity of two-hop link scheduling model is In this section,the effectiveness and merits of proposed algorithms is verified by experiment.When comparing the performances of different scheduling algorithms,we give their analytical and simulation results.The latter are obtained by Monte Carlo method,and the number of time slots is set to 106.The experiment shows that the analytical results well match the simulation results,which shows the correctness of the proposed algorithms.Because the data amount that arrive at and leave the buffer is very large in each time slot,to simplify the experimental process,the state space of Markov chain is compressed by defining the data package.We assume that one data package contains 48 bytes,namely 384 bits of data information,and the time slot length△Tis 1 ms. In one-hop link,we assume that there are five DNs in network,i.e.,N=5.After the DNs have priorities,the first two are PDNs,and the last three are SDNs.The data processing rates of SN arern=[54,62,73,86,70],unit:data packages/ms,and the buffer lengths of DNsBn=50 data packages (n=1,2,...,5). When the QA algorithm is adopted by the network,we calculate its KPIs using Algorithm 1 and compare them with RR algorithm.Figure3 - Figure6 give the curve that shows the relationship between these indicators and the average arrival rates of data packets,in which the PDN represents DN 1 and SDN is DN 5.Whenλ1andλ5varies between[5,10,...,40]data packages/ms,the average arrival rates of the other four DNs remain unchanged at [∗,15,35,15,10]and[10,15,35,15,∗]data packages/ms,respectively.Becausern∆T ≥Bnand the symmetry of experiment parameters,when the network adopts RR algorithm,every KPI of PDN has the same value with the corresponding indicator of SDN,which is expressed by the same curve in each figure.In the process of experiment,Algorithm 1 can converge after three iterations,hence it has very fast convergence speed. Figure3.Average queue length versus average arrival rate. Figure4.Average throughput versus average arrival rate. Figure5.Average delay versus average arrival rate. Figure6.Outage probability versus average arrival rate. From Figure3,Figure4 and Figure6,we can see that the average queue length,average throughput and outage probability increase withλnin two scheduling algorithms.The reason is that if the data processing capacity of SNrnis a constant,when the number of arrived data packets increases,the average queue length of buffer becomes longer.We can see from(36)and(37)that if the queue length is less than the data processing rate of SN,the average throughput increases withλn.At the same time,when the data of DN arrive at buffer,the probability that a certain packet or some packets were discarded due to buffer overflow increases,thus the outage probability gets larger.According to(12)and(13),with the increase ofλ5,the scheduling probability of SDN respectively decreases to 0.5,0.6 and 0.7 of the original value.Whenrn∆T ≥Bn,the average delay of DNndepends on its scheduling probability,and the former decreases with the increase of the latter.Therefore,the average delay of SDN is a descending staircase distribution,and it keeps steady at each stage as shown in Figure5.According to(14)and(16),the scheduling probability of PDN gradually increases withλ1.Thus we can see from Figure5 that its delay gradually decreases with the increase ofλ1.Base on above analysis,we know that in network design,if the average arrival rates of DNs are relatively large,the throughput of system becomes higher.And it is necessary to provide a relatively long buffer for each DN to avoid the increase of outage probability. Whenλnremain unchanged,after the network gives priority to the service requirement of PDN,compared with RR algorithm,its probability of being scheduled increases,thus the average queue length becomes shorter.Therefore,the outage probability decreases,the average delay gets smaller and the average throughput increases.But for SDN,the conclusion is opposite.Based on above reasons,the actual network can adopt the proposed algorithm to provide personalized services for DNs,improve the experiences of DNs with higher priority while reducing the response speeds to DNs with lower priority. In two-hop link,we adopt the symmetrical channel model that the S-R and R-D link have the same average SNRIt is assumed that the minimum spectral efficiency of data linkrt=2 bps/Hz and the number of relay nodesM=4.When=2,4,...,20 andL=2,4 data packages,we respectively calculate the KPIs of network,including the average queue length of relay nodes,the average throughput,average delay and outage probability of network.And this paper compares the calculated results with the LPA algorithm[31]. Figure7.Outage probability versusγ. Figure8.Average throughput versusγ. Figure9.Average queue length versusγ. Figure10.Average delay versus The variation of outage probability of network is shown in Figure7.Ifremains unchanged,the data storage capacity of relay node improves with the increase of buffer lengthL.Therefore,the outage probability caused by the buffer being full or empty decreases.If keepLunchanged,the LPWA algorithm gives priority to the relay node with more remaining buffer space,and it reduces the probability that the buffer becomes full under same average SNR.Therefore,its outage probability is lower than that of the LPA algorithm.IfLis fixed,the outage probabilities of the two algorithms decrease with the increase ofγ,because with the improvement of channel condition,the probability that the SNR of relay link is less thanγtgradually decreases. The variation of average throughput of network is shown in Figure8.The throughput is improved with the increase ofLifis fixed.From Figure7,we can see that the outage probability decreases with the increase ofLin this case.Therefore,we can know from (62) that the average throughput of network increases.IfLremains unchanged,the average throughput of the LPWA algorithm is relatively high under same average SNR,because it reduces the outage probability by sending data package to the relay node with more remaining buffer space.If keepLunchanged,the average throughput of the two algorithms is improved with the increase ofbecause when channel condition become better,the outage probability decreases. From the analysis of Figure7 and Figure8,it can be seen that in order to reduce the outage probability or increase the average throughput in actual network,we can lengthen the buffer,improve the channel quality,or consider the buffer weight while scheduling relay link. The variation of average queue length of network is shown in Figure9.Ifis fixed,when the buffer lengthLincreases,the average queue length gets longer,because with the improvement of buffer storage capacity,it can accommodate more data packages in relay node to wait for transmission.At the same time,if keepLunchanged,the average queue length of the LPWA algorithm is shorter under same average SNR,because the average throughput of this algorithm is higher in this case.WhenLremains unchanged,the average queue length decreases with the increase ofregardless of whether the weight is taken into account.When the average SNR increases,the channel condition becomes better,and the average throughput is improved.Therefore,the number of data packages that have not been transmitted in buffer decreases,and the average queue length is reduced. The variation of the average delay of network is shown in Figure10.We can see that it is similar with that of average queue length.Ifremains unchanged,with the increase of buffer length,the average queue length of network gets longer,thus the average delay of network increases.IfLis fixed,under same average SNR,the average queue length of the LPWA algorithm decreases,and its average throughput becomes higher.At the same time,the outage probability of this algorithm gets lower.Therefore,we can know from (66) (67) and (68) that its average delay is shorter.Based on the similar reason,if keepLunchanged,with the increase ofthe average delay of the two algorithms also decreases. It can be know from the analysis of Figure9 and Figure10 that in actual network,we can reduce the average queue length and average delay by improving the channel quality or adopting the LPWA algorithm. Considering unsaturated traffic,we have proposed two new scheduling algorithms for one-hop and two-hop link scenario.Furthermore,we have calculated the network performance using Markov chain.In onehop link,the QA algorithm is employed to adjust the scheduling probabilities of DNs with different priorities.For the DNs whose priorities are the same,we increase the scheduling probability of busy node.The experiment results have proved that it enables the network to provide differentiated services for DNs.In two-hop link,the LPWA scheduling algorithm proposed in this paper gives priority to the data transmission on R-D links and takes the length of remaining buffer as weight to complete the scheduling of S-R links.And the experiment results have shown that this algorithm can effectively improve the network performance compared with the LPA algorithm. ACKNOWLEDGEMENT This work was supported in part by the Natural Science Foundation of China under Grant 61725103,Grant 91638202,Grant 61801361 and Grant U19B2025,and was supported by “the Fundamental Research Funds for the Central Universities”. APPENDIX From(14),we can know Thus,we have Therefore,the Proposition 1 has been proved.

3.2 Network Performance Analysis



3.3 Complexity Analysis
IV.SCHEDULING ALGORITHM CONSIDERING PRIORITY AND WEIGHT OF LINK FOR TWO-HOP LINK
4.1 Scheduling Strategy and Stationary Distribution




4.2 Network Performance Analysis





4.3 Complexity Analysis

V.EXPERIMENT RESULTS
5.1 One-hop Link
5.2 Two-hop Link
VI.CONCLUSION

