Passive Localization of Multiple Sources Using Joint RSS and AOA Measurements in Spectrum Sharing System
Kang Li,Yutao Jiao,Yehui Song,Jinghua Li,Chao Yue
College of Communication Engineering,Army Engineering University of PLA,Nanjing 210007,China
Abstract: In spectrum sharing systems,locating multiple radiation sources can efficiently find out the intruders,which protects the shared spectrum from malicious jamming or other unauthorized usage.Compared to single-source localization,simultaneously locating multiple sources is more challenging in practice since the association between measurement parameters and source nodes are not known.Moreover,the number of possible measurements-source associations increases exponentially with the number of sensor nodes.It is crucial to discriminate which measurements correspond to the same source before localization.In this work, we propose a centralized localization scheme to estimate the positions of multiple sources.Firstly, we develop two computationally light methods to handle the unknown RSSAOA measurements-source association problem.One method utilizes linear coordinate conversion to compute the minimum spatial Euclidean distance summation of measurements.Another method exploits the long-short-term memory(LSTM)network to classify the measurement sequences.Then,we propose a weighted least squares (WLS) approach to obtain the closed-form estimation of the positions by linearizing the non-convex localization problem.Numerical results demonstrate that the proposed scheme could gain sufficient localization accuracy under adversarial scenarios where the sources are in close proximity and the measurement noise is strong.
Keywords: multiple sources localization; passive localization;received signal strength(RSS);angle of arrival(AOA);measurements-source association
I.INTRODUCTION
Spectrum sharing is necessary due to the increasing wireless data consumption and limited spectrum resource[1].The shared spectrums are made available to unlicensed users(secondaries)if they don’t interfere with the transmission of licensed users(primaries)[2].However, the increasing illegal usage of wireless devices makes the shared spectrums particularly prone to unauthorized usage or security attacks.Selfish users can easily transmit data on the shared spectrum without any authorization and potentially cause harmful interference to the incumbent users[3].Such illegal spectrum usage could lead to the infiltration of computer virus or malware on working devices.However,the existing mechanisms for locating such unauthorized sources (intruders) are human-intensive and time-consuming, involving enforcement bureau detects violations via reported complaints and manual investigation[4].Therefore, we propose an effective approach to automatically locate multiple sources simultaneously.
Generally, there are two phases in the process of source localization involving a quantity of dispersed anchored sensor nodes with known locations.The first phase is to receive the source signals at each sensor node.The second phase is to cooperatively transmit the raw signals to a fusion center,and then the required signal parameter will be measured from the raw data in the fusion center and utilize it to estimate the source location[5,6].
Different measurement schemes are critical to localization, such as the measurement of received signal strength (RSS) [7, 8], time of arrival (TOA) [9, 10],time difference of arrival(TDOA)[11,12],angle of arrival(AOA)[13,14],and their combinations[15,16].Among these schemes,RSS measurement is relatively simple and low-cost since no additional device needed at each sensor node.However, RSS measurement often depends on whether the prior knowledge of the propagation channel model is sufficient, which may not be available in adversarial scenarios.Moreover,RSS measurement is not suitable for long-range localization due to power limitation, and multiple sources localization due to fuzzy feature [8].Both TOA and TDOA measurement are capable of providing high localization accuracy,but they require critical time synchronization between the sensor nodes.TOA measurement is relatively straightforward to acquire since the sensor node can determine the signal propagation time with knowing the initial signal transmission time at the source.However, such cooperativity between sensor nodes and sources is not always available[17].To solve this problem, utilizing TDOA measurement in non-cooperative localization(also known as passive localization) exploits the difference of pairwise TOA measurement.However,the noise will be strengthened in the process of TDOA measurement and usually leads to degraded performance when locating multiple sources[10].AOA measurement generally works in a non-cooperative, stealthy and passive manner,without requiring the prior knowledge of channel parameters and the inter-node synchronization,which is highly desirable in many practical applications [18].Furthermore,AOA measurement potentially improves the communication quality with directional transmission and interference suppression [14].With the development of the micro-electro-mechanical systems(MEMS)[19–21],AOA measurement using integrated antenna nowadays becomes feasible and economic.Apart from these, merging of various measurements also has been an active research area[15,16,22,23].Localization performs better by exploiting the benefits of merged measurements.For example, the advantage of RSS at short range and simple implementation, and the advantage of AOA at long range and efficient communication.Joint RSS and AOA measurements are more suitable for applications involving dynamic range communications by utilizing complementary advantages.
In spectrum sharing system, considering the limited processing capability of sensor nodes and high requirement of practical applications,it is crucial to develop localization algorithms that are not only fast and accurate within moderate computation and communication ability,but also applicable for localization in the non-cooperative scenario.Over recent years,localization algorithms fusing RSS and AOA measurements have been investigated due to its prominent advantage.The authors in[24]proposed a modified hybrid RSS/AOA-based localization method based on multiple signal classification (MUSIC).Compared with conventional methods, the proposed method lowers root mean square error(RMSE)by using a circular antenna array with smoothing capability.The authors in[25]proposed a non-convex estimator using RSS/AOA measurements for the non-cooperative network,where the estimator is transformed into a generalized trustregion subproblem based on the least-squares (LS)criterion.The performance of the proposed estimator tightly approximates the maximum-likelihood estimator for small noise.The authors in [26] and [27]derived a closed-form solution for 3-D localization.They transformed the distance of unknown target as the pseudo-linear equations for the target location with respect to the AOA and RSS measurements.Both[26]and[27]gained good performance in comparison with other estimators.
A primary motivation of the above-mentioned work is the effective utilization of RSS and AOA measurements in order to attain significantly improved localization accuracy.However,it’s worth noting that most localization algorithms in the literature consider only one source.In fact, it is more imperative to locate multiple source nodes, while sensor nodes lack prior knowledge of individual signal features from each source.The transmitted signal from multiple sources doesn’t contain unique fingerprints,which means signals from different sources may be regarded as the signals from the same source.For multiple sources localization, the localization problem becomes more complicated which is mainly due to the unknown association between the multiple signal measurements at each sensor node and the corresponding source.In other words, the challenge lies in how to select one measurement from each sensor node to form a vector of measurement data corresponding to the same source,such as 1) establishing a mapping relationship between measurements and corresponding source,2)develop a measurement association algorithm that avoids the brute-force search.
However,to the best of our knowledge,as an indispensable part of multiple sources localization, there are relatively few papers such as [28],[29] studying measurements-source association.Specifically, the authors in [28] regraded TOA measurements-source association and multiple sources localization as a joint optimization problem of minimum TOA error.They proposed a three-step approach to find the initial signal transmission time and the positions of sources.However,the performance of[28]has significant improvement at the price of a higher computational burden.The authors in[29]treated AOA measurements-source association as an optimization problem of AOA ambiguity elimination and ray classification.They applied the brute-force search in the sense of least square error to locate sources.However, the computation load of[29]significantly increases as the number of sensor nodes or sources increases.
In this paper, we propose a closed-form solution to address multiple sources localization based on joint RSS and AOA measurements,including the following essentials:
1) develop two computationally light methods to handle unknown joint RSS and AOA measurementssource association problem.One method is treating the association as an optimization problem of minimum spatial Euclidean distance summation based on linear coordinate conversion.Another method originates from supervised learning of the sequence classification problem using long-short-term memory(LSTM)network;
2)develop a simple anti-noise method to simultaneously locate multiple sources.We used the weighted least squares (WLS) approach to obtain the closedform estimation of the positions by linearizing the non-convex localization problem;
3) propose a centralized localization scheme to avoid challenge on sensor nodes’energy consumption,computation ability and control overhead.The scheme also greatly reduces communication load between the sensor nodes and the fusion center since only a few scalars(RSS and AOA measurements)instead of raw data need to be transmitted.
Our numerical results demonstrate that the proposed scheme not only can attain relatively accurate and complete knowledge of measurements-source association,but also can gain sufficient localization accuracy under adversarial scenarios where the sources are in close proximity and the measurement noise is strong.
II.SYSTEM MODEL AND PROBLEM FORMULATION
2.1 Joint RSS and AOA Measurement of Multiple Sources
Consider a wireless network withManchored sensor nodes of known locations andNsource nodes of unknown locations.They are respectively denoted bypm= [pmx,pmy,pmz]T(1≤m ≤M,m ∈N∗),andqn= [qnx,qny,qnz]T(1≤n ≤N,n ∈N∗).All sensor nodes are cooperative,but the source nodes and sensor nodes are non-cooperative.Figure 1 illustrates the diagram of joint RSS and AOA measurement in 3-D Cartesian coordinate space.Note that we focus on an electromagnetic propagation environment in which either a line-of-sight(LOS)path exists or scatterers are near the source and the sensor node to provide a near LOS path.Accordingly, utilizing the current mature AOA estimation technique[30–33],all RSS and AOA measurements can be approximately obtained at each sensor node from the(near)LOS path.In this context,the elevation angle and the azimuth angle of then-th source measured at them-th sensor take the form,respectively
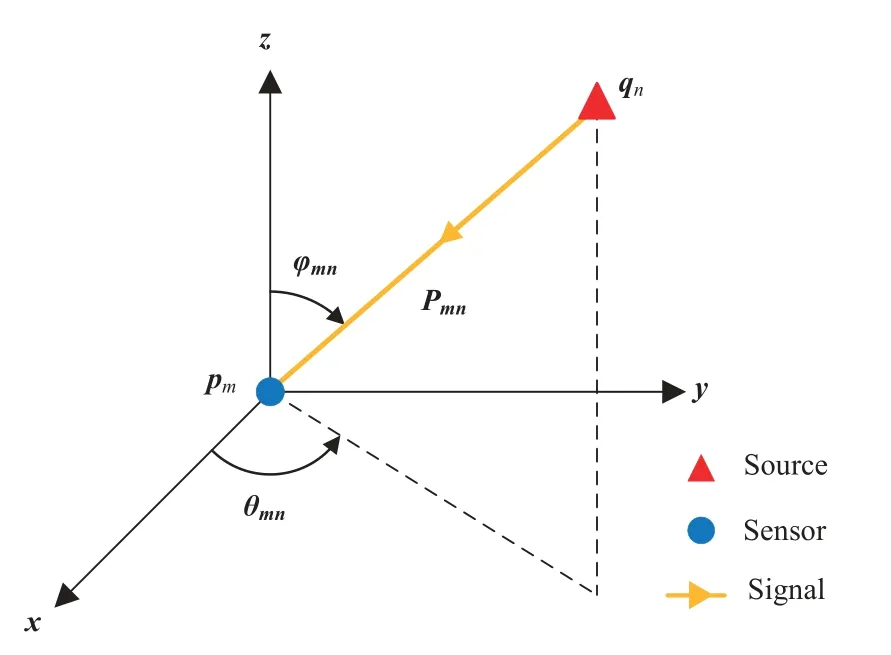
Figure 1. A diagram of joint RSS and AOA measurement in 3-D space.
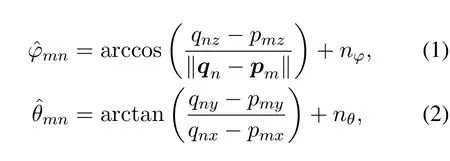

whereP0is the transmit power measured at the reference distanced0,γis the path loss exponent with slightly varying value,∥qn −pm∥denotes the Euclidean distance between them-th sensor and then-th source.np ∼is shadow fading modelled as zero-mean Gaussian random variable[35].
The unitary direction vector from them-th sensor to then-th source is defined as

2.2 Problem Formulation of Multiple Sources Localization
In general, the joint RSS and AOA-based multiple sources localization involves two stages: 1)Each sensor node measures its RSS and AOA from the sources;2) All sensor nodes cooperatively transmit joint RSS and AOA measurements to a fusion center where the measurements will be utilized to estimate the sources’locations.Here, it is important to point out that there exist two unknown factors during the localization procedure,i.e.,
• In the space dimension,the joint RSS-AOA measurements at each sensor node and the corresponding source are unknown.
• In the time dimension, the processing sequence of measurements from each sensor node in the fusion center is uncertain.
The illustration of the first uncertainty is shown in Figure 2,the measurement ofqnwith respect topmis defined by a directional rayIdeally,there would beMdirectional rays intersecting exactly atqn.However,theseMdirectional rays usually skew off at a certain angle and won’t intersect atqnbecause of the noise in practice.Nevertheless,to a large extent, they would be close to each other aroundqnwith enough signal to noise ratio(SNR).Thus,we can use geometric principle to locateqn.When only one source exists,there is no doubt thatMdirectional rays just belong to this source.ForNsources in the space,there areN ×Mdirectional rays which can be classified intoNgroups,and each group containsMdirectional rays.To locateqn,it has to correctly chooseMdirectional rays associated withqnfromNMpossible combinations.Therefore,only after correctly decidingMdirectional rays associated with each source can we locate multiple sources.
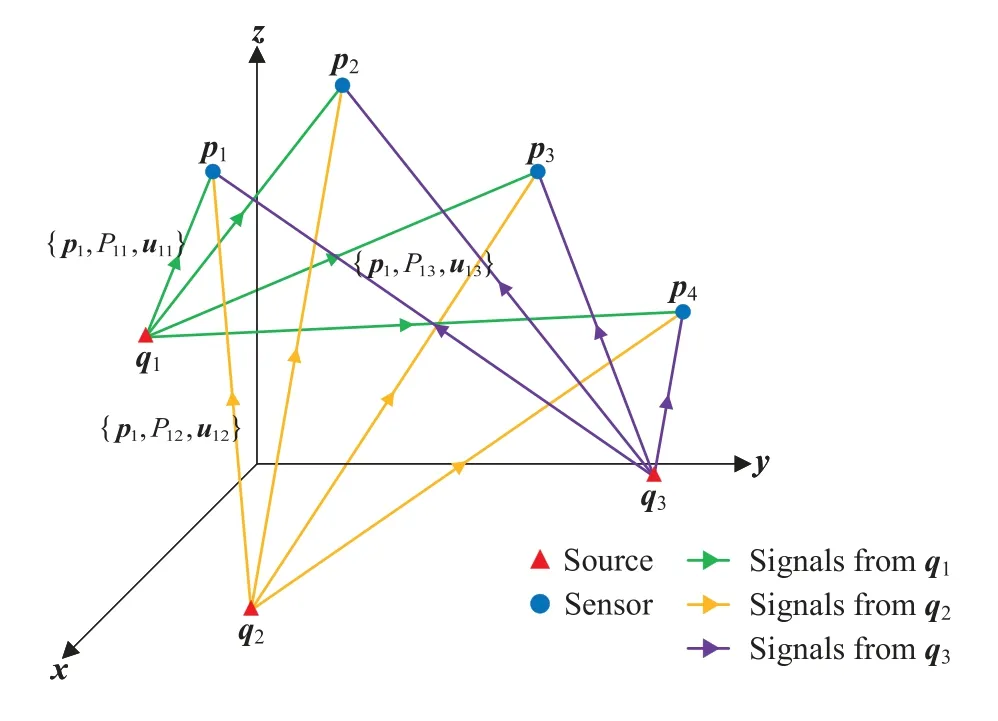
Figure 2. A diagram of multiple sources localization with N=3 sources and M=4 sensor nodes.
The illustration of the second uncertainty is shown in Figure 3, each same source is denoted by one specific color and each row denotes the measurements ofNsources measured at one sensor node.Before association, the processing sequence of measurements from each sensor node in the fusion center is random.The measurements from all sensor nodes are in disorder, too.This is mainly because the sources’ locations and their initial emission time are unknown.The order of the signals that reach each sensor node varies with the different distance and initial emission time of sources.Therefore,sensor nodes only transmit the measurements to the fusion center without labeling their arrival orders.To simultaneously locate multiple sources,it’s critical to obtain an ordered processing sequence in the fusion center.We need to discriminate the vector of measurement data corresponding to each same source by selecting and rearranging sequential data.
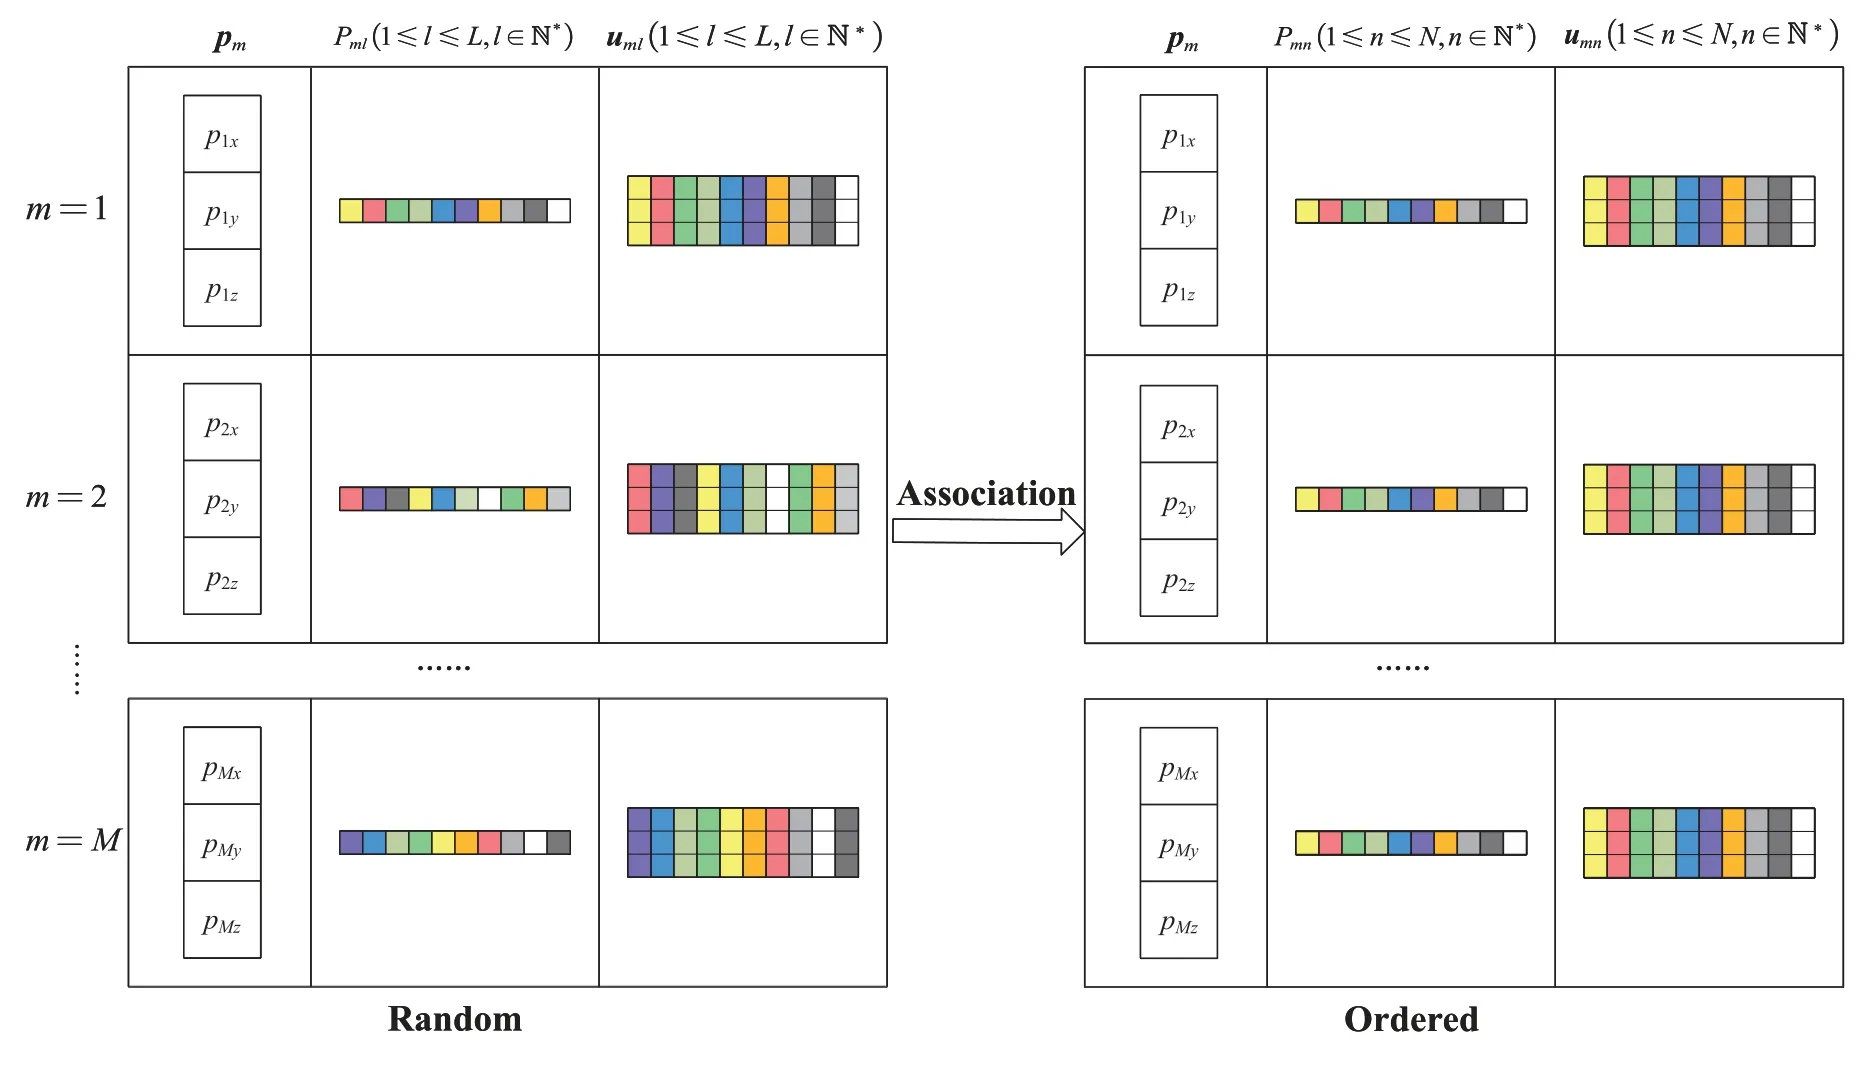
Figure 3. A diagram of processing sequence of measurements from M sensor nodes in the fusion center.
To solve the two uncertainty, let’s denote the joint RSS-AOA measurement vector at them-th sensor node ascm(1≤ m ≤M,m ∈N∗) whose entries are arranged in their arrival order,i.e.,

whereℓ(1≤ℓ ≤L,ℓ ∈N∗)is the order of the signal transmitted by a certain source that reaches them-th sensor node, andcmℓ=Note thatLshould be the number of sourcesN.Then we use a permutation matrixC ∈RM×Lto represent all measurements in the fusion center,formally
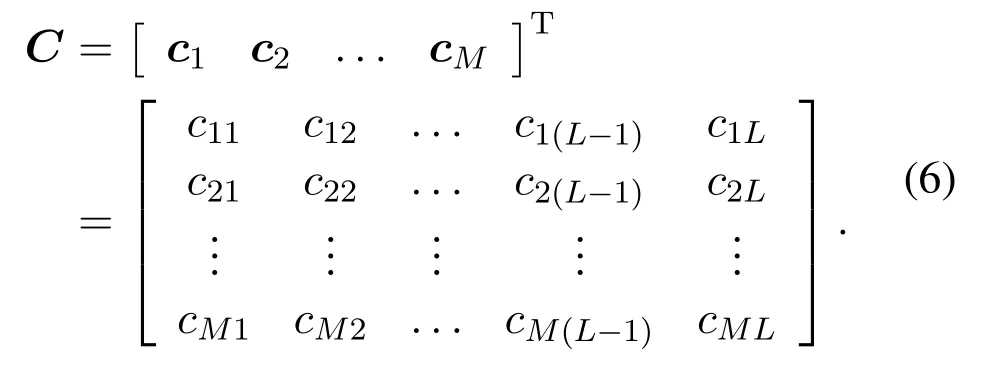
The objective is to concurretnly locateNsources by exploiting data in the new matrixB ∈RM×N.All elements ofBoriginate fromCand each column ofBrepresents a vector of measurement data corresponding to the same source.This can be formulated as
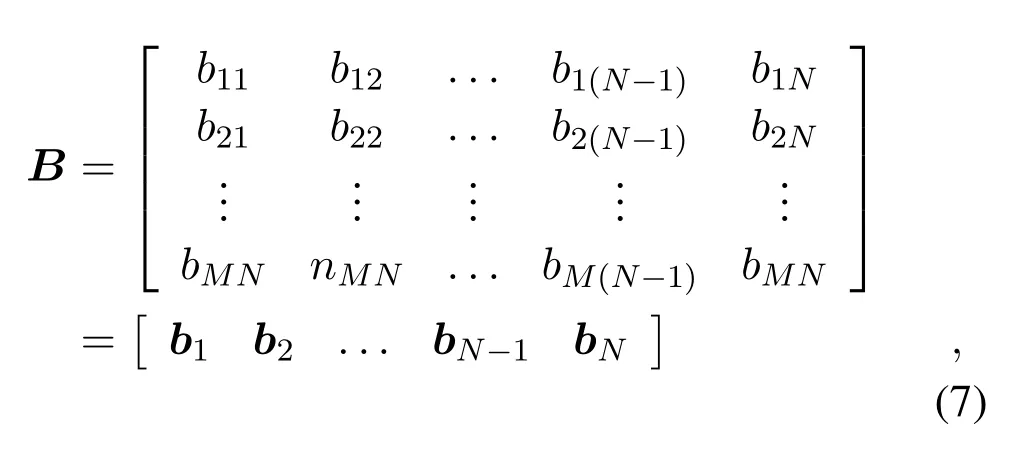
wherebmn=∈ C,bn=[b1n,b2n,··· ,bMn]T(1≤ n ≤N,n ∈N∗) represents all measurements ofMsensor nodes corresponding to one specific sourcen.Accordingly,the unknown locationcan be obtained by maximum likelihood(ML)estimator since equations(1)(2)and(3)are modelled using Gaussian distribution.
Table 1 summarizes the notations frequently used in this paper.
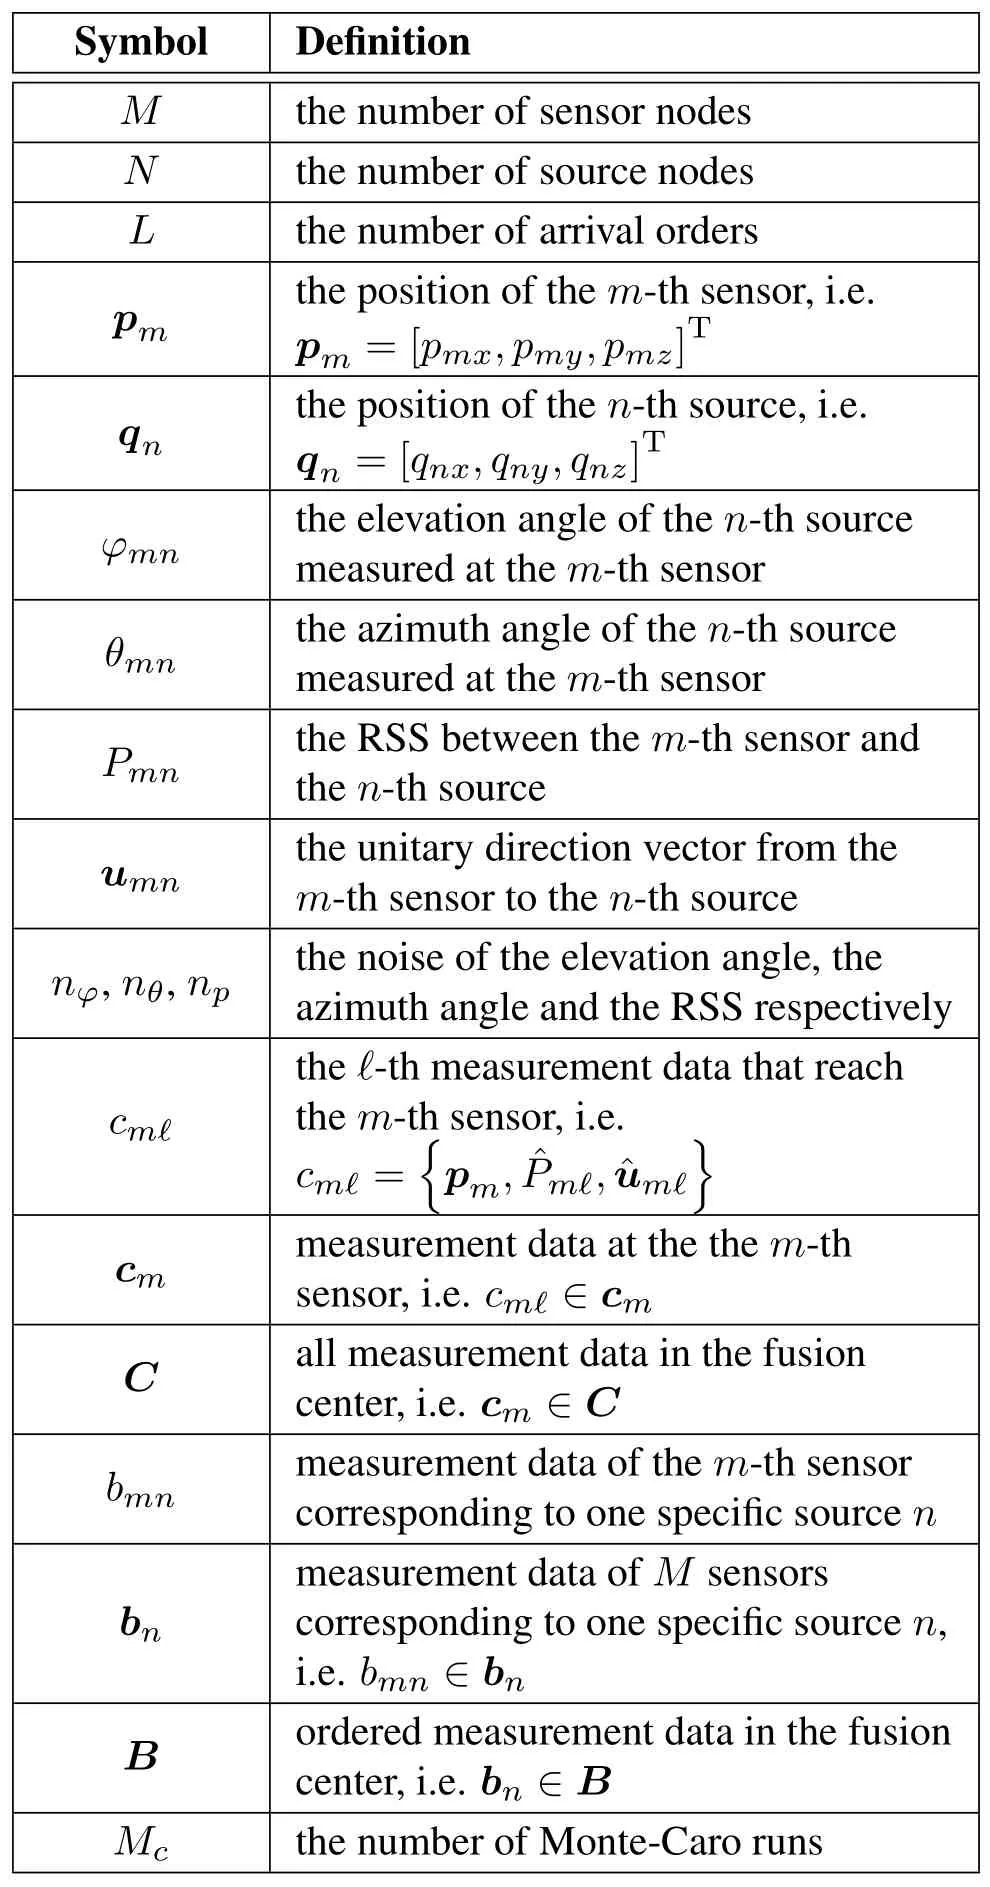
Table 1. Frequent used notations.
III.MEASUREMENTS-SOURCE ASSOCIATION ALGORITHM
In this section, we address the problem of measurements associated with one specific sourcenformulated in (7) by developing two algorithms.The first one is treating the association as an optimization problem of minimum spatial Euclidean distance summation based on linear coordinate conversion.The second one originates from supervised learning of the sequence classification problem using LSTM network.
The Minimum Converted Distance Summation Algorithm requires taking time to obtain the optimal solution iteratively.Instead,the Sequence Classification Algorithm can respond rapidly under the premise that a trained network has existed.The training dataset can be constructed from the prior knowledge supported by Minimum Converted Distance Summation Algorithm.
3.1 Minimum Converted Distance Summation Algorithm
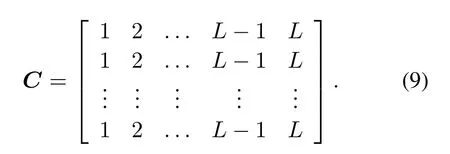
Step 1: Encoding
Encode the vector(5)in a sequential format,i.e.,

Acoordingly,matrix(6)takes the form
Step 2: Selection and Combination
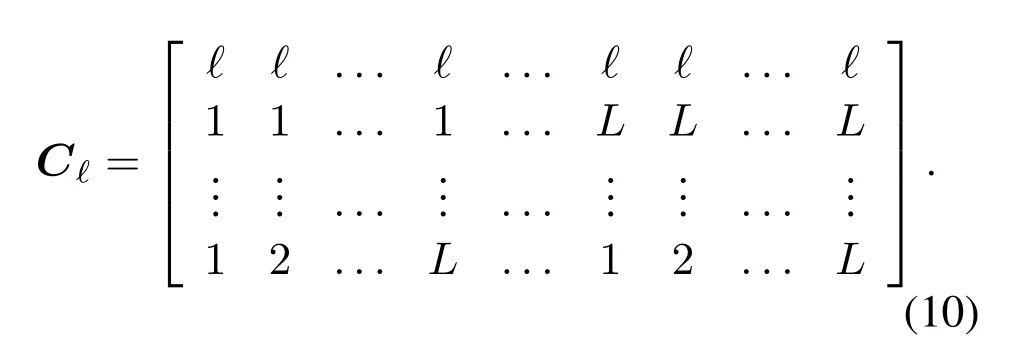
Select a certain sourceℓinc1and define a matrixCℓ ∈RM×LM−1by listing all possiblecm(2≤m ≤M,m ∈N∗)as rows,i.e.,
Step 3: Optimization
Let us denote the each column of matrix (10) as a vectorki(1≤i ≤LM−1,i ∈N∗),i.e.,
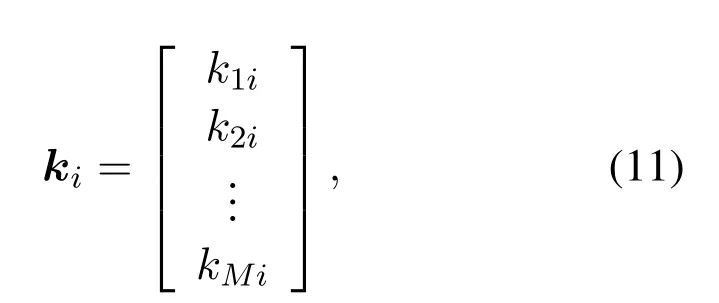


To correctly decide M directional rays with respect to sourceℓ,the following optimization function is proposed
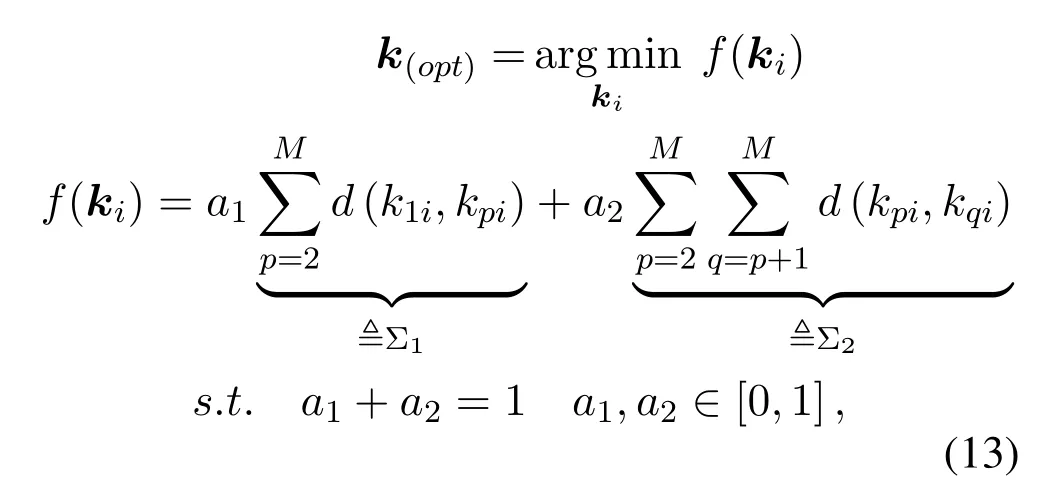
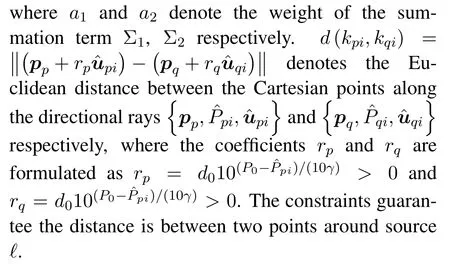
The proposed optimization function(13),f(ki)assesses the closeness between the sourceℓandMpoints along with their direction rays.The first summation term Σ1calculates the sum of distances between the point along the first directional ray(the first point) and the points along with the otherM −1 directional rays (the otherM −1 points).And Σ1assesses how close the otherM −1 points are to the first point.The second summation term Σ2computes the sum of distances between all possible pairs of the otherM−1 points,assessing the closeness of the otherM −1 points.
Summary
With the encoding of matrixCas the first step,the proposed algorithm appliesStep 2andStep 3successively to the selection of measurements associated with sourceℓ.The algorithm ends when all measurements ofNsources are associated.The steps of the proposed algorithm is summarized in Algorithm 1.
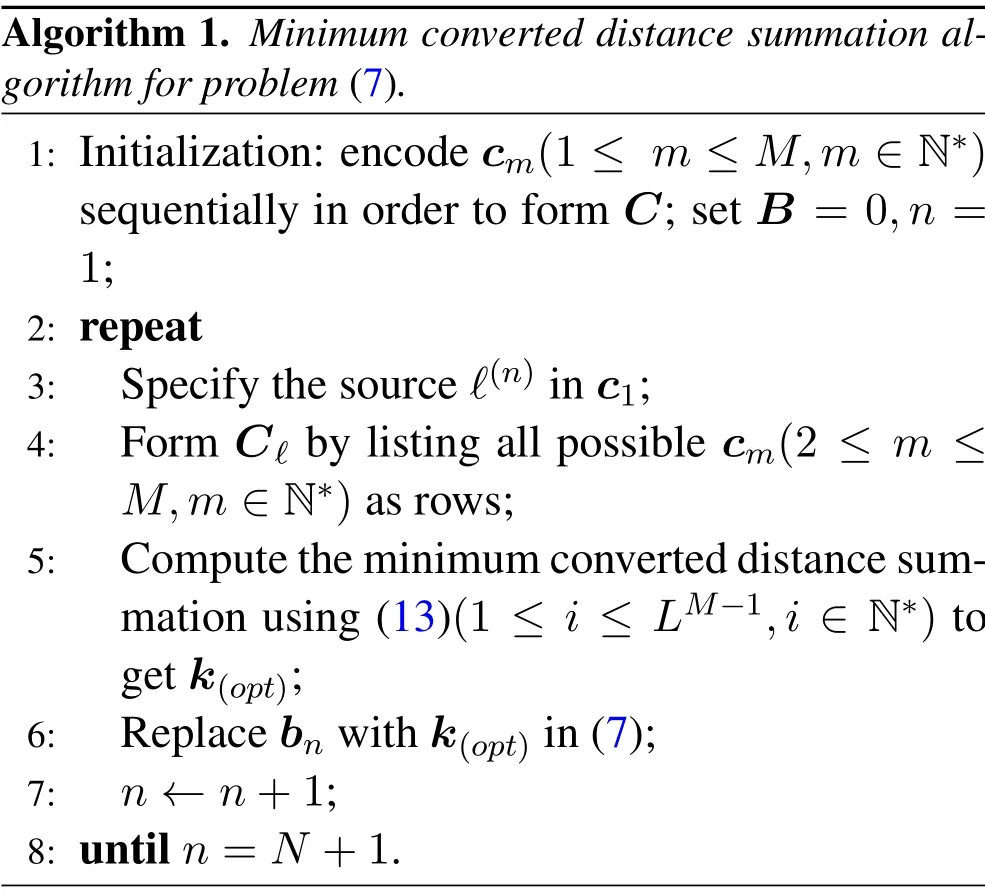
Algorithm 1. Minimum converted distance summation algorithm for problem(7).1: Initialization: encode cm(1 ≤m ≤M,m ∈N∗)sequentially in order to form C; set B = 0,n =1;2: repeat 3: Specify the source ℓ(n)in c1;4: Form Cℓ by listing all possible cm(2 ≤m ≤M,m ∈N∗)as rows;5: Compute the minimum converted distance summation using (13)(1 ≤i ≤LM−1,i ∈N∗) to get k(opt);6: Replace bn with k(opt)in(7);7: n ←n+1;8: until n=N +1.
3.2 Sequence Classification Algorithm
Step 1: Load Sequence Data
Load sequence data{CXtrain,CY train}.CXtrain ∈RM×Lis measurements training data.It’s a cell array containingM ×Lelements where each element is a three-dimensional sequence with varying lengths,i.e.,
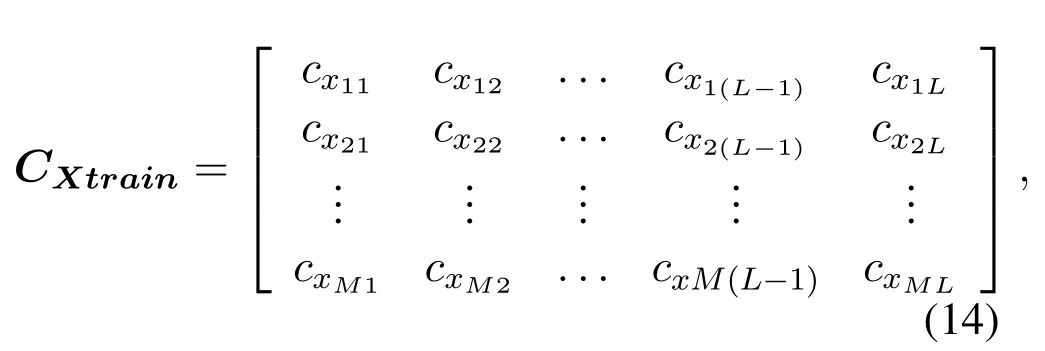
where
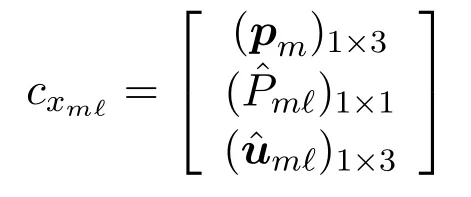
are matrices with 3 rows and varying number of columns.
CY train ∈RM×Lis the measurements label with anM ×Lmatrix of labels“1”,“2”,...,“N”in each row that correspond to theNsources,i.e.,
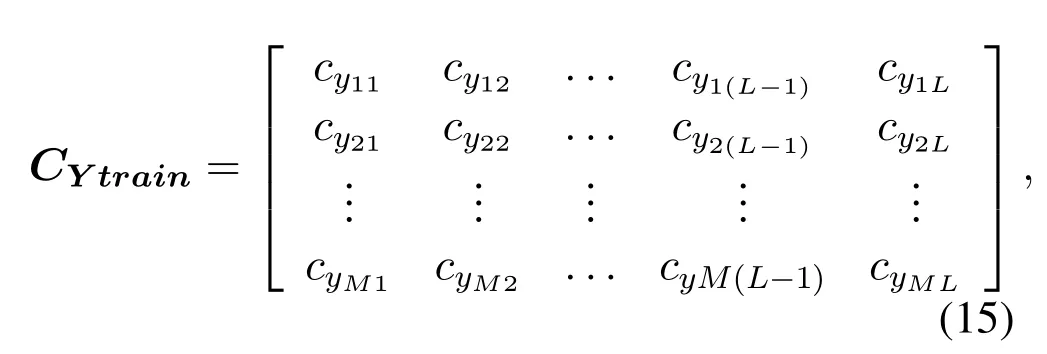
wherecymℓ=n(n ∈{1,2,··· ,N}) andcymp cymq().
Step 2: Define LSTM Network Architecture
Specify the input size to be sequences of size 3(the dimension ofcxmℓ)and normalize sequences with zero-mean method.Define an LSTM layer with 100 hidden units, and output the last element of the sequence.Finally,specifyNclasses by including a fully connected layer of sizeN,followed by a softmax layer and a classification layer.The architecture is shown in Table 2.

Table 2. LSTM network architecture.
Step 3: Train and Test LSTM Network
During training, by default, split the training data into mini-batches and pad the sequences so that they have the same length.Too much padding can have a negative impact on network performance.Now, let’s specify the training options.Specify the solver to be’Adam’, the gradient threshold to be 1, and the maximum number of epochs to be 100.To reduce the amount of padding in the mini-batches,choose a minibatch size of 20.To pad the data to have the same length as the longest sequences, specify the sequence length to be’longest’.To ensure that the data remains sorted by sequence length,specify to never shuffle the data.
After completing training process, we use the trained LSTM network to classify the measurements test dataCXtest(same size asCXtrain) to get measurements labelCY test(same size asCY train).
Summary
With the initialization of LSTM network architecture and training options,the classification of all measurements associated with the same source using the trained LSTM network is achieved.
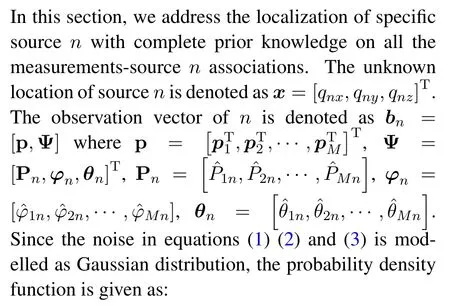
IV.CLOSED-FORM LOCALIZATION SOLUTION

where


The ML estimator in (17) is non-convex and has no closed-form solution.In the following part, we’ll show how to approximate(17)to obtain a closed-form estimator.
4.1 Coordinate Conversion
Coordinatexalong the directional ray defined by them-th sensor can be represented aspm+µmµm=(x −pm)is the projection of the vector frompmtoxto the direction ˆumn,i.e.,


4.2 WLS Estimator
According to the WLS criterion and (18)(19),we obtain the following estimator:
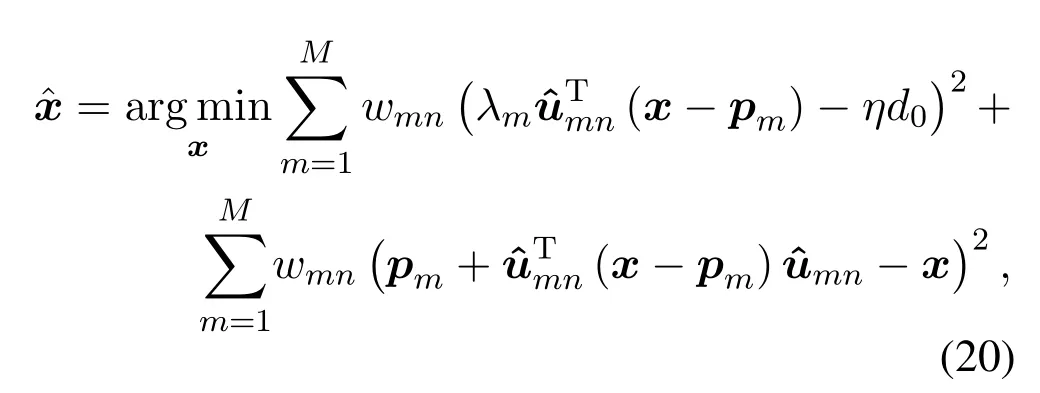
wherewmnis a weight corresponding to the accuracy of each ˆumn.By expanding and rearranging, (20)can be written in equivalent form as:

where
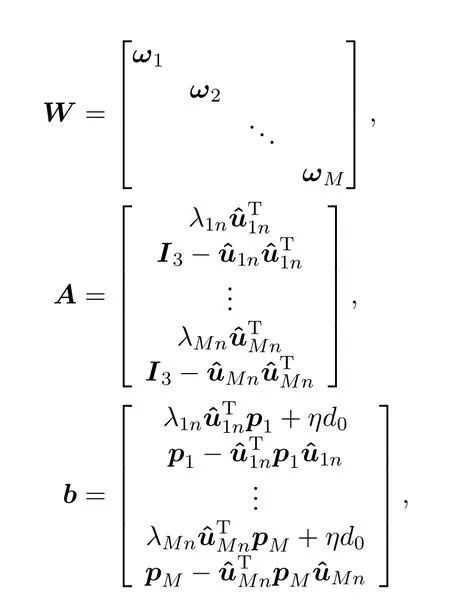
ωm=wmn·e,e ∈R4×1is the unit column vector.
The closed-form solution to(21)is derived as:

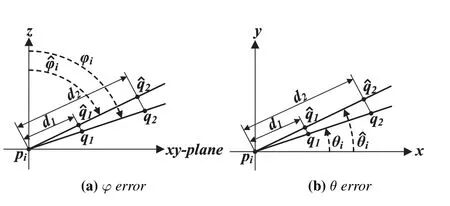
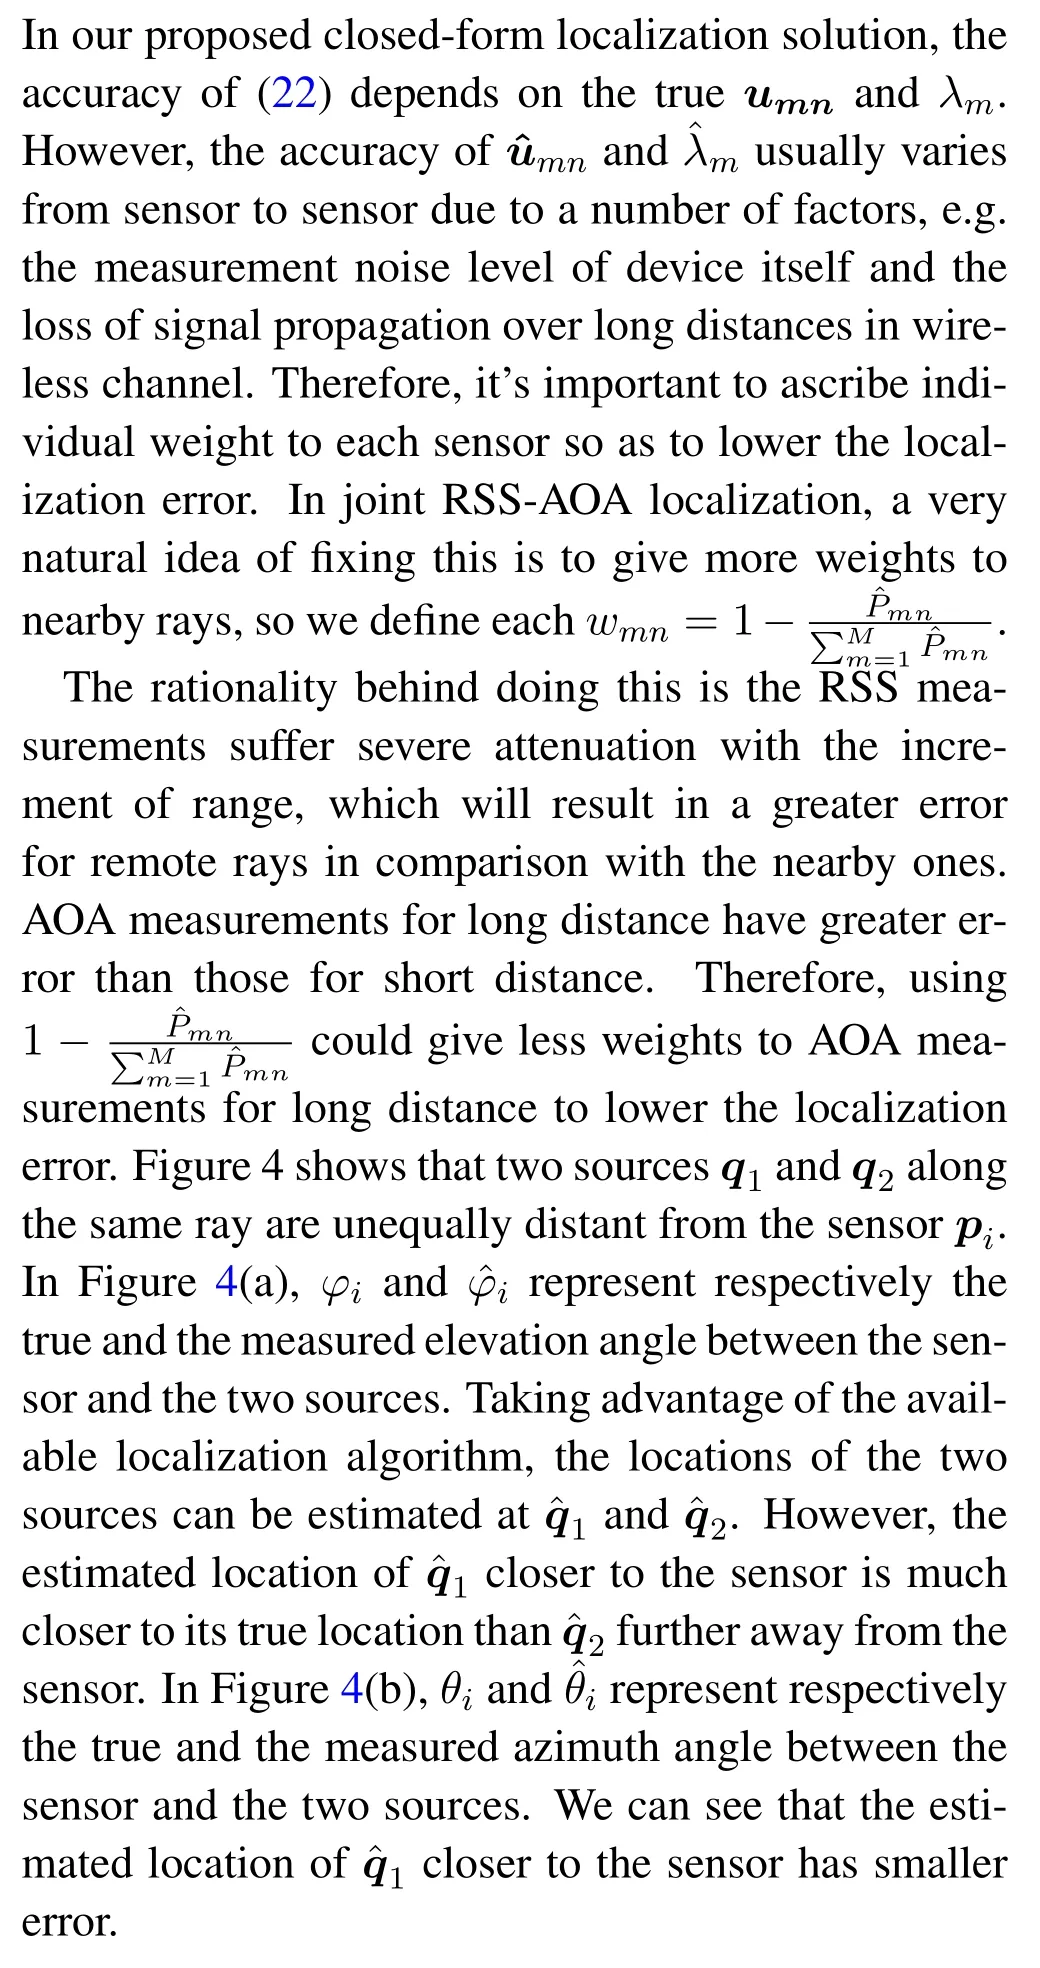
Figure 4. Illustration of AOA measurement error in same direction for different distances.
4.3 Choice of Weights
Concluding Section II to IV, the proposed multiple sources localization scheme is summarized in Figure 5.
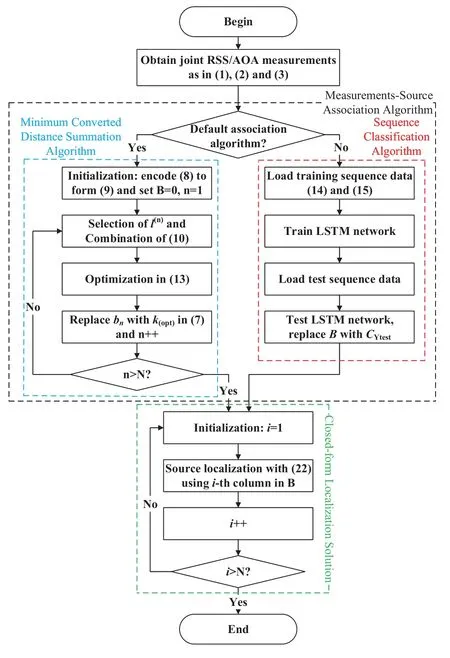
Figure 5. The flow chart of the proposed multiple sources localization scheme.
V.NUMERICAL RESULTS
In the following part, we first demonstrate the effectiveness of our proposed measurements-source algorithms in Section III.Compared with other localization algorithms, then we show the improvement of our proposed closed-form localization solution in Section IV.Finally,the performance of our proposed multiple sources localization scheme is confirmed.
5.1 The Effectiveness of Measurements-Source Algorithms
In a cubic space of 100m×100m×100m,we randomly deploy several sensor nodes in the upper space fromM= 4 toM= 18, source nodes in the lower space fromN= 5 toN= 20 with the increment of 5 nodes each time.Here,to account for a realistic joint RSS-AOA measurement model and test the robustness of measurements-source algorithm,γwas drawn from a uniform distribution on an interval [2.2,2.8], i.e.γ ∼U[2.2,2.8].Others in measurement model are set asP0=−10dBm,d0= 1m.The measurement noise respectively obeysσp= 0.3dBm,σθ= 0.5deg andσφ= 0.5deg Gaussian random variables.The minimum converted distance summation algorithm has parameters ofa1= 0.9 anda2= 0.1.The sequence classification algorithm has parameters listed in Table 3.Furthermore, each simulation result was computed after 5000 Monte-Caro runs.
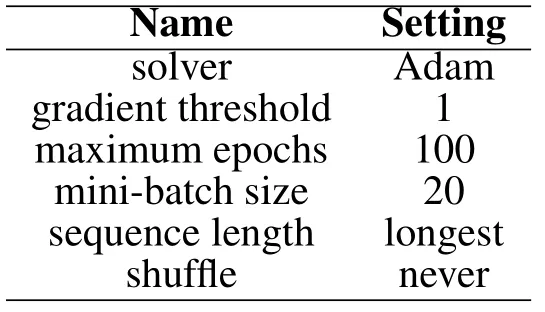
Table 3. LSTM training options.
In Figure 6 and 7, we illustrate the correct assoication of the measurements-source assoication using minimum converted distance summation algorithm and sequence classification algorithm, respectively.It can be seen from the result that, both algorithms have good performance on measurementssource assoication problem.Their average correct association rates reach above 90% and the deviation of both algorithms is less than 2%,revealing that our algorithms only incur negligible performance loss.In addition, for a certain number of source nodes, increasing the number of sensor nodes won’t decrease the correct assoication rate, indicating that our algotirhms are scalable when there are lots of measurements.This example means that our algorithms in Section II are effective and provide a good pre-stage to the joint RSS-AOA based localization problem.
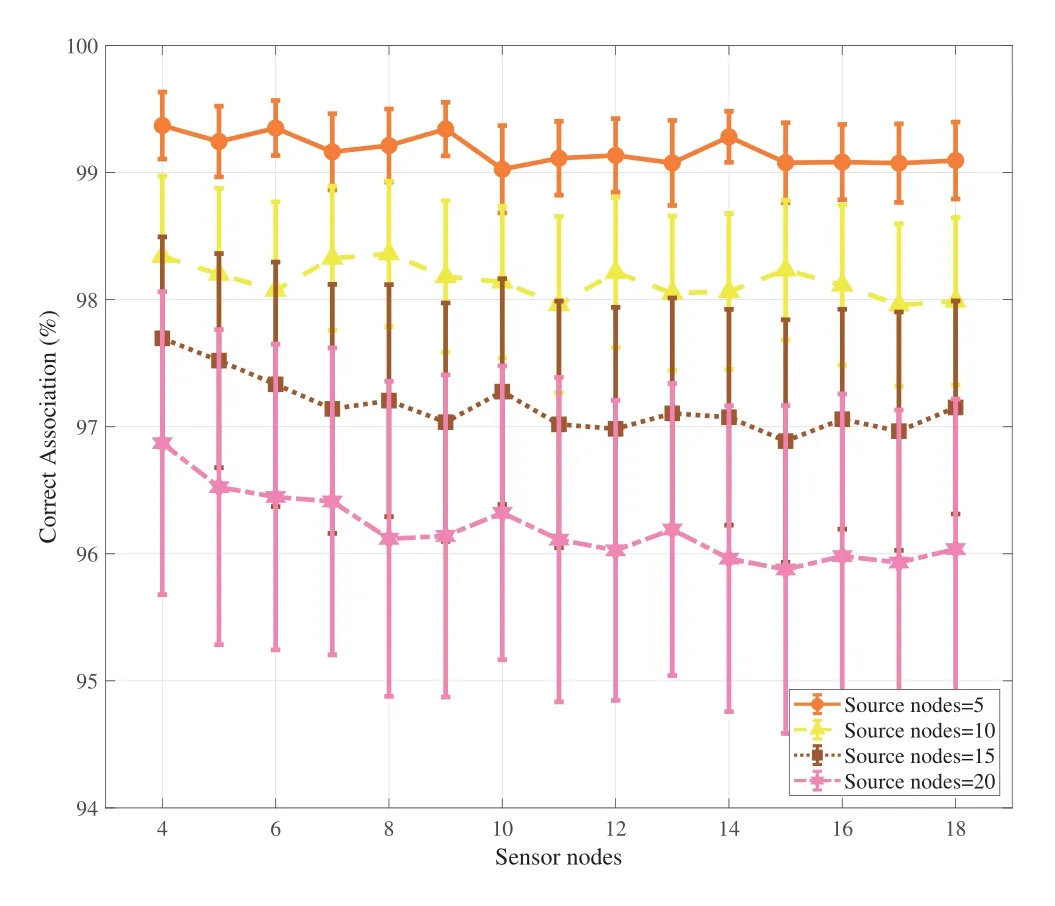
Figure 6. The average and deviation of minimum converted distance summation algorithm.
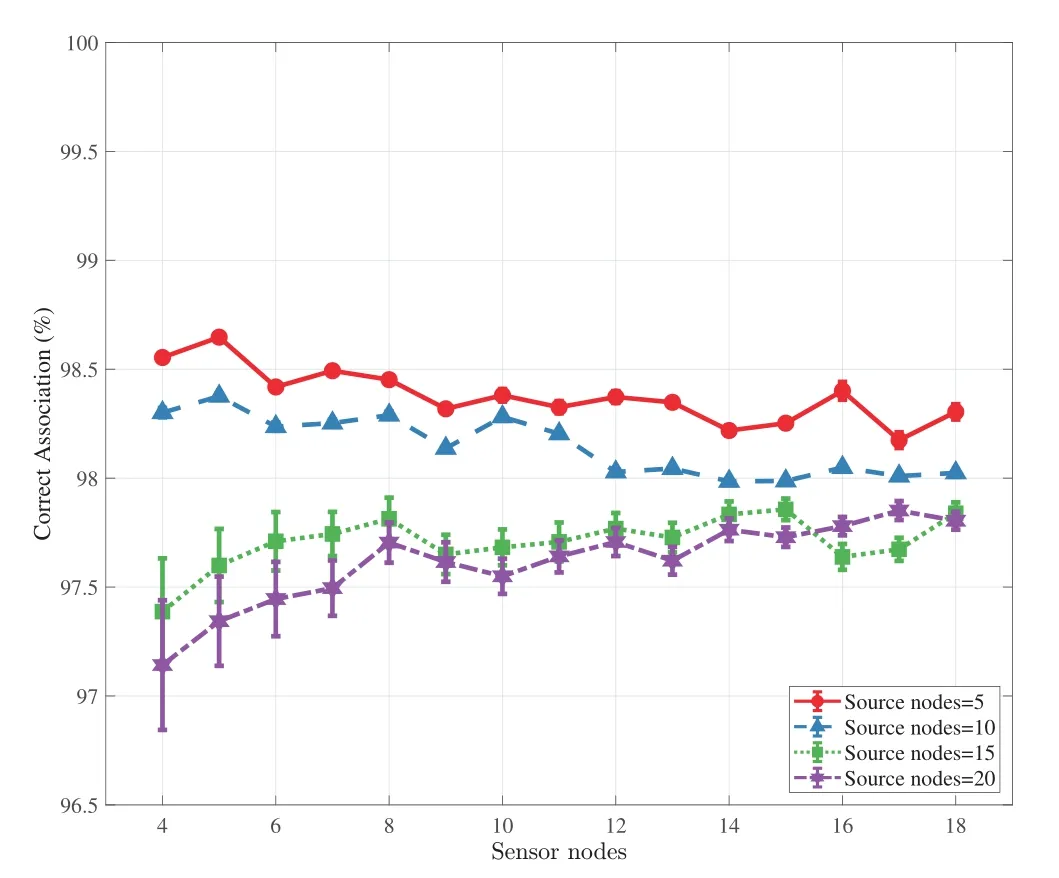
Figure 7. The average and deviation of sequence classification algorithm.
To test the robustness of our proposed closed-form localization solution, several sensor nodes (fromM=4 toM= 20) and one source node are randomly distributed in an 100m×100m×100m space per run.Each simulation result was computed after 5000 Monte-Caro runs.Here, to prove the high anti-noise ability of our solution,γi ∼U[2.2,2.8],P0=−10dBm,d0= 1m,σpi= 2dBm,σθi= 10deg andσφi= 10deg.In this part, the normalized root mean square error (RMSE) is considered as the performance metric which is calculated as

whereqiandare respectively the true and estimated location of the source node in thei-th run of simulation.Considering the spatial distribution of all nodes,we take relative error as another performance metric which is calculated as

Figure 8 and 9 illustrate the localization performance of various estimators.It shows that all methods benefit from additional information introduced by increasing sensor nodes.Although formally simple,the proposed method exhibits superior performance for all sensor nodes.Here, it is important to point out that the noise powers in Figure 8 and 9 are set to a relatively high value, which restricts the localization accuracy and leads to earlier convergence.However, in contrast to other methods,our method behaves exceptionally well even for such a setting.This is because other methods are vulnerable to noise resulting from assuming that the noise power is mild, which might not stand in practice.
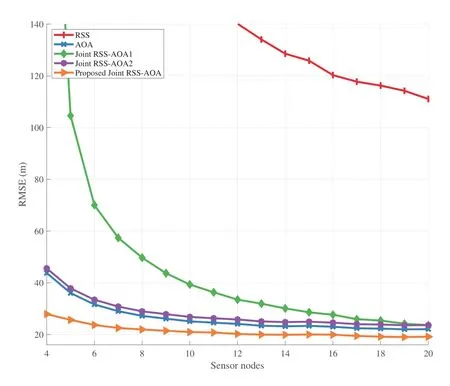
Figure 8. RMSE vs.Sensor nodes(γi ∼ U[2.2,2.8],σpi=2dBm,σθi=10deg,σφi=10deg).
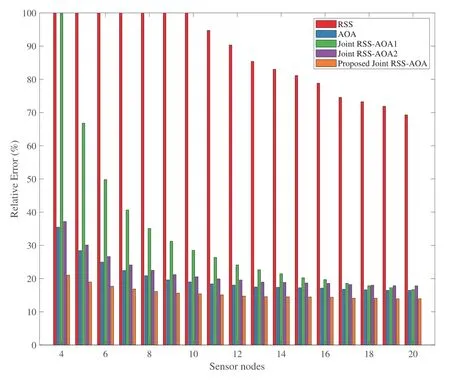
Figure 9.Relative Error vs.Sensor nodes(γi ∼U[2.2,2.8],σpi=2dBm,σθi=10deg,σφi=10deg).
5.2 The Improvement of Closed-Form Localization Solution
In Figure 10,we investigate the quality of different types of measurements on the performance of the considered methods.Specifically,Figure 10a,10b and 10c illustrate the RMSE versusσpi(dBm),σθi(deg) andσφi(deg) comparison, respectively, forM= 20.From these figures, we can observe that the performance of all methods declines as the quality of a certain measurement decreases (In Figure 10b and 10c,the RSS estimator is out of coordinate range due to a high noise powerσpi), as expected.However, not all measurements have the same effect on the performance of the considered methods.For example, the quality of RSS measurement has little impact on the proposed method,while the quality of AOA measurements have greater impact on its performance.This phenomenon is not completely surprising,because the proposed method relies more on the quality of the angle measurements rather than distance measurement in its derivation.Nevertheless, in such a large noise power range, the performance degradation is moderate, and the proposed method outperforms significantly the existing ones in general.
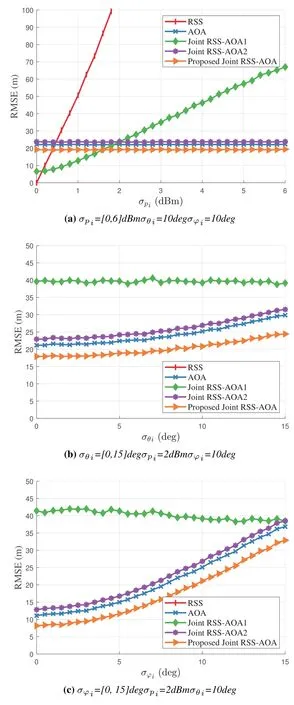
Figure 10. RMSE vs.noise(M =20,γi ∼U[2.2,2.8]).
5.3 The Performance of Multiple Sources Localization Scheme
The proposed multiple sources localization scheme is shown in Figure 5.In the measurements-source association part,we setγi ∼U[2.2,2.8],P0=−10dBm,d0= 1m,σpi= 2dBm,σθi= 5deg andσφi= 5deg.In the closed-form localization part,we randomly deploy sensor nodesM=18,source nodes fromN=5 toN=20 with the increment of 5 nodes each time in a cubic space(100m×100m×100m).
In Figure 11, for a certain sourceℓ, we investigate the number of sources on the performance of the proposed scheme.More precisely, Figure 11a, 11b, 11c and 11d illustrate the localization accuracy after com-pleting the flow chart when source nodes are 5,10,15 and 20, respectively, forM= 18.From each figure,one can observe that the localization performance improves from additional information introduced by increasing sensor nodes.From the four figures,although the performance moderately degrades when the number of source nodes rises,the proposed scheme shows the unity and stability.Table 4 shows the response speed vs.source nodes with different association algorithms.We use the 11th Gen Intel(R)Core(TM)i5-1135G7@2.40GHz to test the speed of two different association algorithms.Both algorithms have a running time less than 200ms.The response speed could reflect the algorithm complexity,a fast response speed could be regarded as a light computation.Localization performance of two association algorithms defined in Section II for all 20 sources are calculated and summarized in Table 5 and 6,respectively.
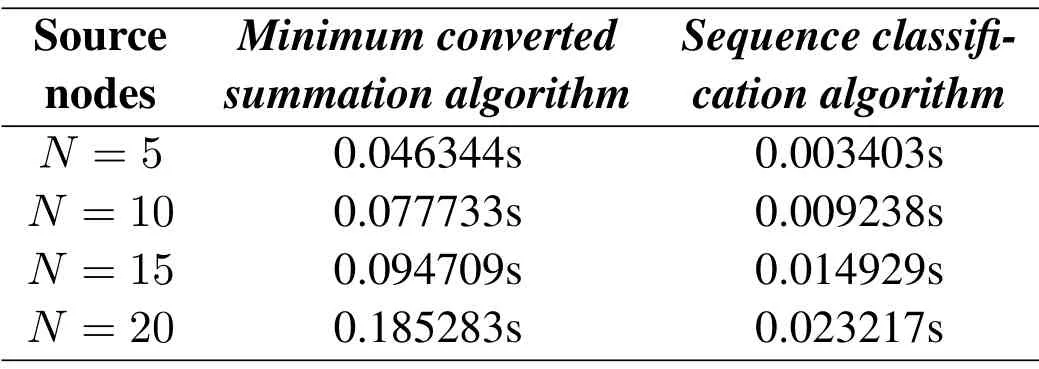
Table 4. The response speed with different association algorithms(M =18).
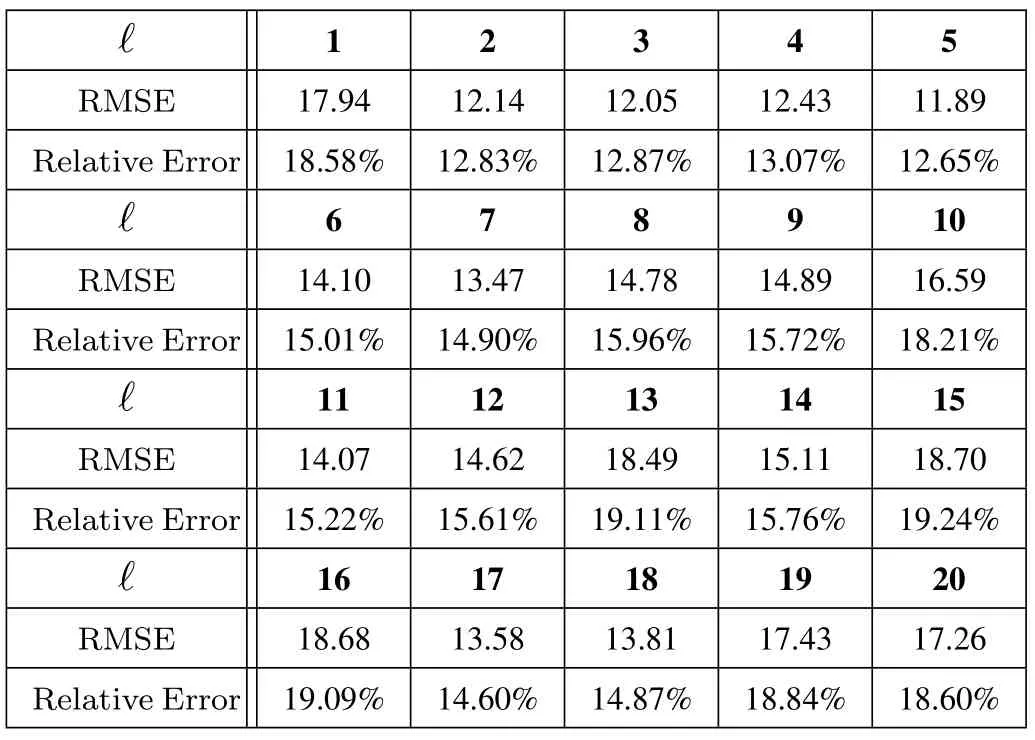
Table 5. Localization performance of minimum converted summation algorithm.
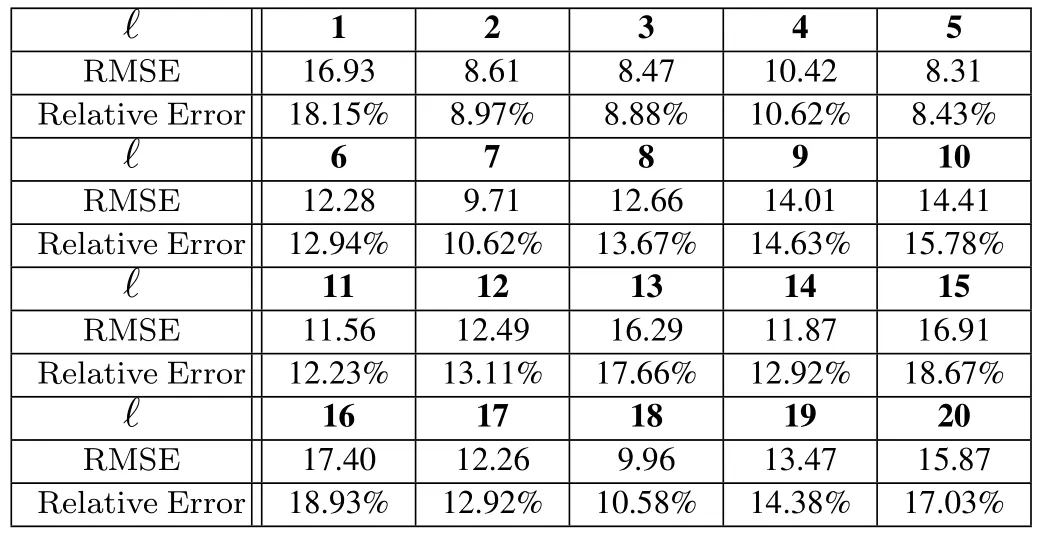
Table 6. Localization performance of sequence classification algorithm.
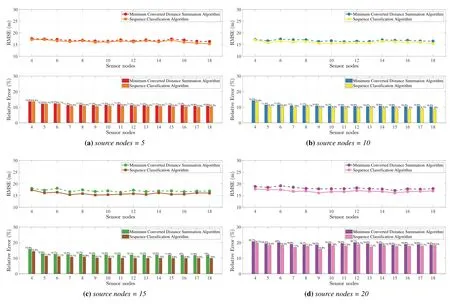
Figure 11. Localization performance vs.source nodes with different association algorithms(M = 18, γi ∼U[2.2,2.8],σpi=2dBm,σθi=5deg,σφi=5deg).
VI.CONCLUSION
This work studies the challenging problem of simultaneously locating multiple sources passively based on joint RSS-AOA measurements.Specifically, the proposed system model could be used to automatically locate malicious interference sources and unauthorized working sources in spectrum sharing system, such as illegal broadcast and pseudo base station.Compared to single source localization, concurrently locating multiple sources is more complicated since we show that the associations between the sources and measurements are unknown in practice.To tackle this difficulty,we first developed two computationally light algorithms from the optimization method and the machine learning method,respectively.Subsequently,we proposed a closed-formed solution with raising the ability of anti-noise by exploiting RSS-AOA’s property of advantage complementary.Through numerical results,our proposed multiple sources localization scheme exhibits a steady performance with highly correct association rate of measurements-source association.The proposed scheme has the advantages of the low computational load and high anti-noise ability,which could be especially suitable for the scenario where the sources are in close proximity and the measurement noise is strong.
ACKNOWLEDGMENT
This work was supported by the National Natural Science Foundation of China (No.U20B2038,No.61901520, No.61871398 and No.61931011), the Natural Science Foundation for Distinguished Young Scholars of Jiangsu Province (No.BK20190030), and the National Key R&D Program of China under Grant 2018YFB1801103.
- China Communications的其它文章
- An Overview of Wireless Communication Technology Using Deep Learning
- Relay-Assisted Secure Short-Packet Transmission in Cognitive IoT with Spectrum Sensing
- Frequency-Hopping Frequency Reconnaissance and Prediction for Non-cooperative Communication Network
- Specific Emitter Identification for IoT Devices Based on Deep Residual Shrinkage Networks
- Primary User Adversarial Attacks on Deep Learning-Based Spectrum Sensing and the Defense Method
- Intelligent Spectrum Management Based on Radio Map for Cloud-Based Satellite and Terrestrial Spectrum Shared Networks

