Frequency-Hopping Frequency Reconnaissance and Prediction for Non-cooperative Communication Network
Gao Li,Wei Wang,*,Guoru Ding,Qihui Wu,Zitong Liu
1 Key Laboratory of Dynamic Cognitive System of Electromagnetic Spectrum Space,Ministry of Industry and Information Technology,Nanjing University of Aeronautics and Astronautics,Nanjing 211106,China
2 College of Communications Engineering,Army Engineering University,Nanjing 210007,China
Abstract: The continuous change of communication frequency brings difficulties to the reconnaissance and prediction of non-cooperative communication networks.Since the frequency-hopping (FH) sequence is usually generated by a certain model with certain regularity, the FH frequency is thus predictable.In this paper,we investigate the FH frequency reconnaissance and prediction of a non-cooperative communication network by effective FH signal detection,timefrequency (TF) analysis, wavelet detection and frequency estimation.With the intercepted massive FH signal data, long short-term memory (LSTM) neural network model is constructed for FH frequency prediction.Simulation results show that our parameter estimation methods could estimate frequency accurately in the presence of certain noise.Moreover,the LSTMbased scheme can effectively predict FH frequency and frequency interval.
Keywords:non-cooperative communication network;frequency-hopping;frequency prediction;LSTM
I.INTRODUCTION
1.1 Background and Motivation
To improve the survivability of communication equipment in the complex electromagnetic environment,communication anti-jamming capability has become the focus and challenge of information warefare[1,2].Due to its advantages of good confidentiality, low probability of interception and flexible networking capabilities, FH communication has become the most widely used communication mode in the field of antijamming communication [3].FH communication refers to the communication mode wherein the carrier frequency of communication system hops in a pseudorandom way generated by a pseudo-random FH pattern [4].As long as the opponent is not clear about the FH pattern, jamming and striking could not be implemented.Thus the system’s capabilities of antisearch, anti-interception, and anti-jamming could be improved, which is of great significance for ensuring the smooth communication in the harsh electromagnetic environment.
To obtain efficient information of the noncooperative communication networks, certain measures of communication reconnaissance are generally taken.Effective reconnaissance is the fundamental premise of effective jamming and information restoration.As the key techniques of FH reconnaissance,FH signal detection and parameter estimation are of great significance[5].With the intercepted FH signals,how to utilize the information and then perform jamming is a research hotspot in the field of communication countermeasures.The core of the FH communication system is the FH sequence that controls the carrier hopping with pseudo-random characteristics,which is always generated by a certain mode with certain regularity.If the frequencies of FH signal could be accurately estimated and massive intercepted historical frequency data is obtained,the possible used frequency of the target system at the next period could be obtained.TF analysis and wavelet detection are utilized for frequency reconnaissance and estimation, and thus the required historical frequency data is obtained.Subsequently,the future frequency of the target system is predicted by a effective machine learning prediction scheme.Finally, we show the superiority of our proposed scheme.Overall,the main contributions of this paper are summarized as follows:
• For a non-cooperative communication network,we develop a FH reconnaissance and frequency prediction framework based on TF analysis and LSTM to perform FH frequency prediction with unreliable frequency information.Compared with direct FH sequence prediction approaches, such as Radial Basis Function (RBF) neural network and Support Vector Machines(SVM)etc,our proposed prediction framework could more be the case in practice since we start from FH signal rather than direct FH sequence to analyze and predict.
• With unreliable estimated frequency based on short time Fourier transform (STFT) analysis,we propose and analyze FH frequency prediction schemes.A complex network model with stacked LSTM architecture is constructed to perform FH frequency prediction.
• Based on the frequency prediction point by point, we develop a frequency interval prediction scheme,where a frequency interval that much probably falling in is predicted.The simulations show that the proposed LSTM prediction scheme outperforms the benchmark schemes.
The remainder of this paper is organized as follows.In Section II, the communication reconnaissance and frequency prediction framework of a non-cooperative network is introduced.Then, TF analysis based FH frequency estimation and LSTM-based FH frequency prediction schemes are proposed in Section III.Section IV presents the simulations and discussions.Finally,Section V draws the conclusions.
1.2 Related Work
Parameter estimation, including time hopping, hopping speed and FH sets,is the key point for reconnaissance and processing of FH signal[5].The frequency of FH signal hops regularly with time and has the characteristics of non-stationarity and TF sparsity.Existing parameter estimation methods are mainly based on TF analysis, TF sparsity, and DOA estimation of FH signals, etc [6, 7].Among them, TF analysis is currently the main method for parameter estimation of FH signal for its intuitive and practical analytical results.
In recent years,cognitive network is put forward as a new network technology,which introduces a lot of AI technology to make the network intelligent,and represents the future development direction of the network[8].Spectrum prediction in the cognitive network,as a complementary technique of spectrum sensing[9,10],is a promising technique of inferring the occupied state of radio spectrum from known spectrum data by exploiting its correlation[11][12].Massive related work of spectrum prediction has been done to acquire unknown spectrum occupancy information and improve channel communication quality.Based on the spatial domain Kalman filtering theory, a multi-user distributed spatial domain spectrum prediction algorithm is implemented in [13].A kind of TF based twodimensional prediction algorithm under the condition of incomplete historical spectrum data is designed,and the algorithm is verified by the measured spectrum data [14].With the development of deep learning, a kind of LSTM-based spectrum prediction scheme is proposed in [15].From an image inference perspective, long-term spectrum prediction scheme based on tensor completion is proposed in [16].As a further study, a kind of robust long-term spectrum prediction scheme with missing values and sparse anomalies based on tensor completion is proposed in[17].
However,study on spectrum prediction in FH communication field in non-cooperative communication scenario is still relatively rare.To effectively perform FH sequence prediction, the traditional linear prediction scheme cannot be used, but a suitable nonlinear predictor should be constructed.Bayesian network predictive model has been used to perform FH sequence prediction in[18].It has been proved that FH sequence also has chaotic characteristics and could be predicted according to the short-term predictability of the chaotic time series.Based on the chaos theory,the phase space reconstruction of the chaotic system is performed and a prediction scheme is proposed in[19].With the development of chaos theory,a nonlinear prediction scheme based on chaotic neural network is proposed in [20].Besides, RBF neural network is utilized for nonlinear prediction of FH sequence and separation of multiple FH sequence signals[21].SVM is also a good scheme utilized for nonlinear prediction of FH sequence [22].In practice, these schemes have different effects in different situations and most of the FH sequences are regarded as chaotic sequences to implement prediction.In addition, FH sequence is directly utilized to perform prediction in these work.Notably,the FH sequence cannot be directly obtained in reality.It is necessary to implement FH frequency prediction under the premise of signal detection and frequency estimation,which has more important practical significance.With the development of deep learning, LSTM neural network, as an improved version of RNN, has been proved to have strong ability to solve time series problems [23].Reasonably, in this paper, LSTM is utilized for FH frequency prediction under certain signal detection and frequency estimation error.On the basis of the acquisition, tracking and precise prediction of historical frequency data,we could accurately target and lock the communication frequency to be used at the next period and implement tracking jamming for subsequent communication signals to the target communication system.
II.SYSTEM MODEL AND PROBLEM FORMULATION
2.1 Frequency Reconnaissance Model
There are mainly two stages in our investigation, i.e.FH reconnaissance stage and frequency prediction stage.Our reconnaissance system is shown in Figure 1.N={S1,S2,S3,S4,S5,S6}whereSirepresentsStation ithat belongs to a FH network.Our UAV take some detective measures for data collection and analysis.Notably, in the scenario, UAV is relatively hidden for the non-cooperative communication network.
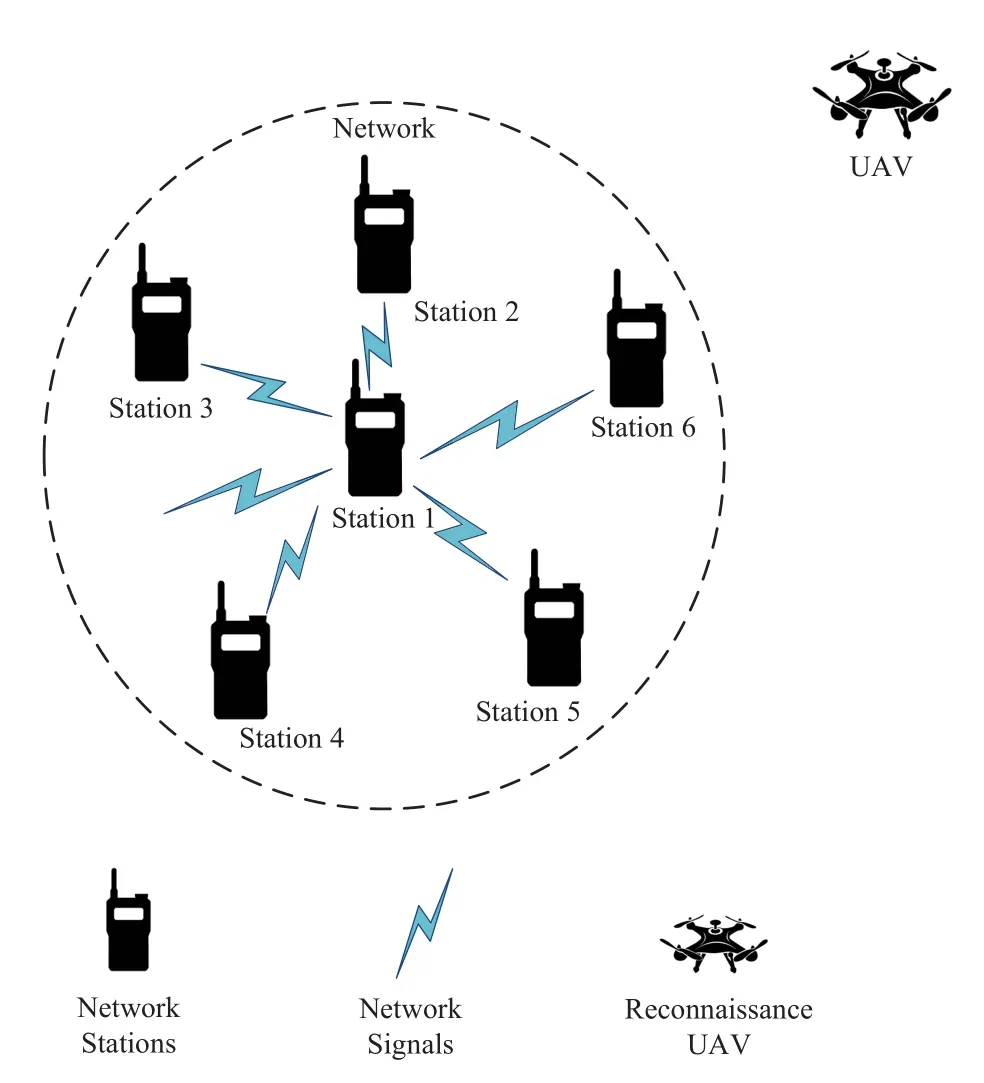
Figure 1. Frequency reconnaissance model.
The frequency set,FH pattern and FH synchronization rule of the network are definite.With FH pattern,the transmitting and receiving between all stations in the internal network is synchronized to ensure that the information can be transmitted normally.There is also a certain degree of noise interference that may have effect to communication stations and our UAV reconnaissance.With this model,we focus on studying the FH signal reconnaissance and frequency prediction.
Our detected data belongs to mixed signal, including FH signal and noise signal.In FH reconnaissance stage,we could obtain relatively pure FH signal through processing.The frequency of FH signal hops regularly with time, with non-stationarity and timefrequency sparsity.We could implement TF analysis on the FH signal and perform parameter estimation including time hopping, frequency sets and frequency speed, of which our main purpose is parameter estimation and to obtain enough frequency data to support effective frequency prediction.
The model of signals observed could be expressed asr(t) =s(t)+n(t),r(t)represents received mixed signals,s(t) represents FH signal, which is given by[24,25]

wheren(t) represents white gaussian noise, i.e.n(t)∼N(µ,σ2),and we could obtain relatively pure FH signal by noise reduction processing.Rectangular functionrectis given by

where 0≤t ≤T,Tis the overall observation time.Note thatPmeans signal power.Kis the number of frequency hopping.This hopping time,i.e.the duration of one hop.fkis frequency of thek-th hop.t1is the starting moment of the first hop.The frequency prediction model to be introduced in the next subsection will be utilized to process the signal.
2.2 Frequency Prediction Model
Frequency prediction will be performed after frequency reconnaissance.Frequency prediction model is shown in Figure 2, in which UAV collects mixed frequency data.We perform the FH frequency sets estimation based on the mixed data, i.e, how to obtainfk.Estimated frequency, time hopping and frequency speed are obtained by TF analysis tools, of which time hopping and frequency speed could be regarded as auxiliary parameters after realizing precise prediction for FH tracking and jamming.We process the received FH signal as follow
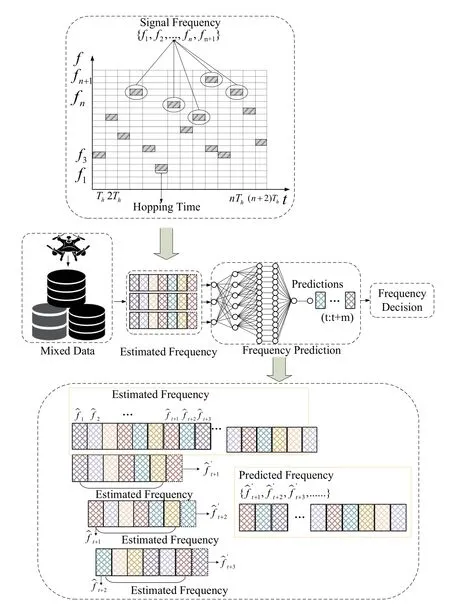
Figure 2. Frequency prediction model.

where TF represents time-frequency transformation of the signals(t).Thus frequency estimation is given by

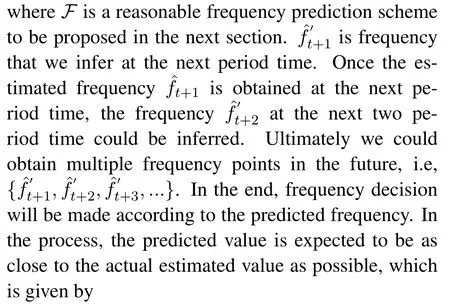
Given the historical frequency data of theTtime slots, the frequency data of the current time slot and the previous time slots are used as the input of the model.Through data training and data mining, the data correlation is exploited,and then the output is the predicted value of the next time slot,which is given by

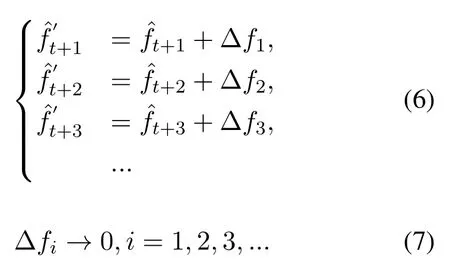
III.PROPOSED LSTM-BASED FH FREQUENCY PREDICTION SCHEME
In this section, to obtain history frequency data and perform frequency prediction,we analyzed the FH signal of the non-cooperative network by means of timefrequency(TF) analysis method.On the basis of the accurate estimation for frequency data, we propose a kind of LSTM-based FH frequency prediction scheme.
3.1 TF Analysis Based FH Frequency Estimation
The TF analysis is one of the common methods to analyze signal.The energy density or intensity of the signal could be accurately described at a certain time point and frequency.The TF diagram of the signal with intuitive analytical result can be obtained by a variety of TF analysis methods,but the performance and characteristics of the TF diagram obtained are different.Some of them are simple in processing but with poor TF resolution, and some have the advantage of energy concentration but with cross-terms, and there is also difference in algorithm complexity.
As far as FH signal concerned,it is necessary to understand in which time period the certain frequency shows, i.e., local TF characteristics.Fourier transform is often used to observe the frequency spectrum of a signal.But there is an assumption that the signal must be stationary, that is, the statistical characteristics of the signal do not change with time.The Fourier transform characterizes the signal globally and cannot reflect the local characteristics.In this case,non-stationary signals such as FH signal could be analyzed with STFT.Each non-stationary signal could be regarded as the superposition of a series of stable signals in a very short period of time.TF window is performed on the signal,so that the signal in the window meets the stability assumption.Then the Fourier transform is performed on the signal in the window,which slides along the time axis within the signal duration to obtain the characteristic in the TF domain.STFT is expressend as follow[26]

whereFdenotes fourier transorm.x(τ) is original signal,w(t−τ)represents window function with centerτ.Window applied to the signal means a section of the signal is directly intercepted for FFT.x(τ).w(t−τ)denotes intercepted signal.
As shown in Figure 3, we perform FFT for signals within each window, where window length and sliding steps need to be adjusted adaptively according to the different situation.Each window returns a vector through FFT, which corresponds to the size of each frequency amplitude.The higher the spectral amplitude, the darker the responding box region.The frequency domain of signals stacked by time forms the spectrogram, i.e., time and frequency representation.However,the disadvantage is that the width of the window function has a direct effect on STFT resolution,moreover,the time and frequency resolution cannot be optimal at the same time.Subsequently,Wigner-Ville distribution (WVD) and smoothed pseudo Wigner-Ville distribution (SPWVD) are put forward to avoid the problem,which has been widely used in TF analysis.WVD is the fourier transform ofi.e, the instantaneous correlation function of the signal,which could be expressed as[26]
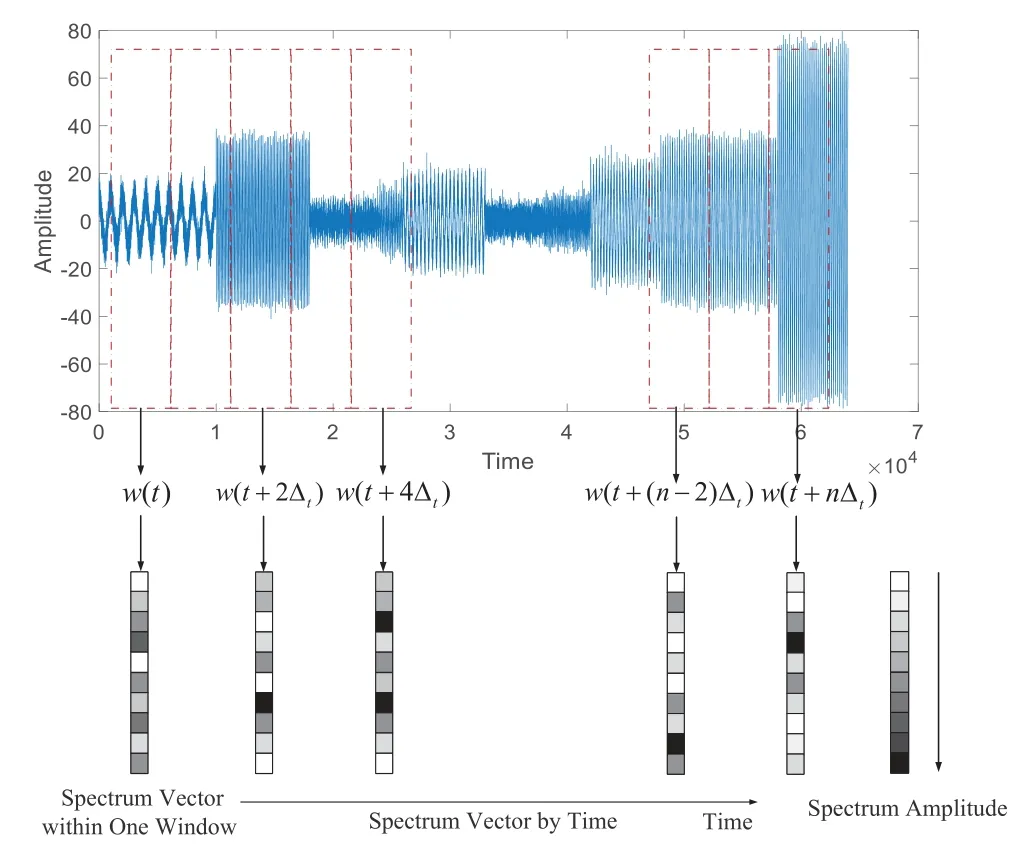
Figure 3. Feature extraction and spectrum analysis of signals.

SPWVD could be expressed as[27]

As for WVD and SPWVD, WVD can optimize TF resolution at the same time which cannot be achieved by STFT.However,WVD has a fatal weakness of producing cross terms, i.e., TF components that do not exist originally.To suppress the impact of cross terms,SPWVD is proposed, in which separate windows are added in both time domain and frequency domain.Although the TF diagram obtained by this method is clear and robust,and the cross-term interference is removed.The SPWVD transform is performed on all time-domain observation signals,which has very high complexity,and it’s difficult to detect TF peaks at low signal-to-noise ratio.When the number of sampling points is large, the complexity is higher, and it is not easy to implement in engineering.Therefore, considering that FH frequency prediction requires large amount of data and large number of sampling points,we will utilize STFT to perform TF analysis and FH frequency estimation in this paper.
3.2 LSTM Based Frequency Prediction Scheme
We consider prediction model as a multi-layer network as shown in Figure 4,and two of which is LSTM hidden layers.Adding depth is a kind of representative optimization of neural networks.Increasing the depth of the network requires fewer neurons and faster training process.LSTM could take advantage of the same benefits, i.e., the stacked LSTM architecture.Which could be defined as a LSTM model composed of multiple LSTM layers and is now a common technique for challenging sequence prediction problems.Stacked LSTM hidden layers make the model deeper,and training efficiency is improved and higher accuracy is obtained.The upper LSTM layer provides sequence output instead of a single value output to the lower LSTM layer.Specifically, there is one output per input time step, rather than only one output time step for all input time steps.
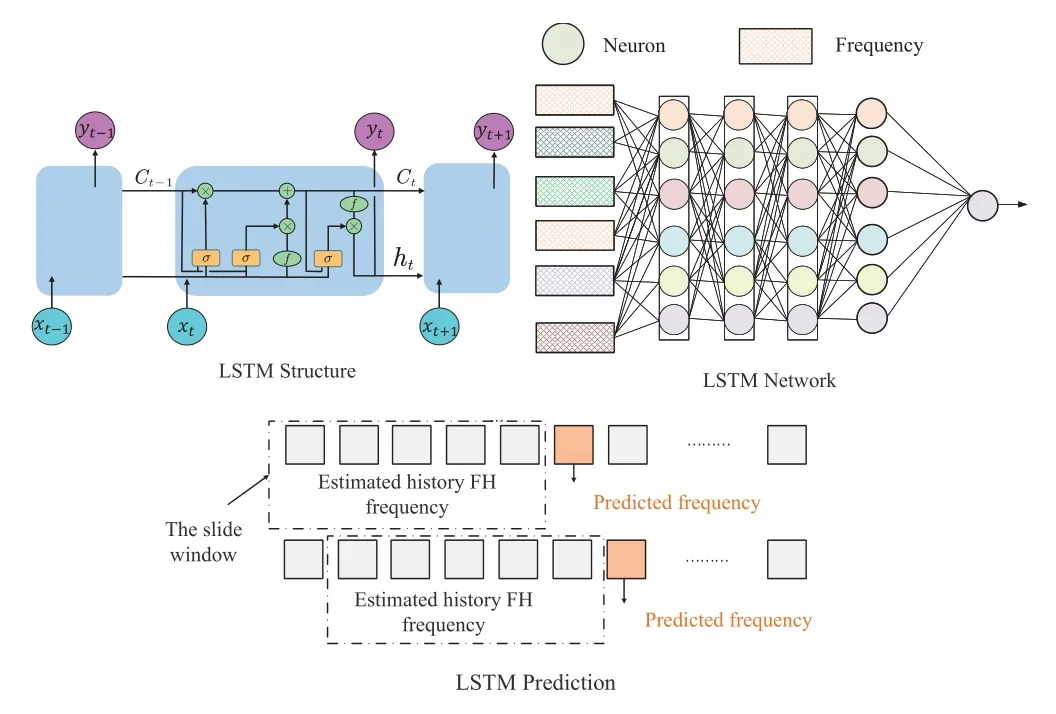
Figure 4. LSTM prediction scheme.
Firstly, we utilize our LSTM-based prediction scheme to implement prediction point by point, that is, we only predict a single frequency point at a time as the prediction frequency at the next time step.During the process,the training window is initialized only once with the first part of the training data.After the real frequency value of the next time step comes, the window slides only one step,and then prediction is implemented along the next window.That is,the real frequency is utilized to predict the next frequency again.
After implementing prediction point by point, we further convert prediction frequency point to frequency interval.When performing frequency prediction, we usually predict frequency point.As is known, it is quite challenging, if possible, to ensure that the predicted frequency point is exactly equal to the true frequency point with a high probability for sensing a non-cooperative FH communication system.Hence,frequency interval is proposed to evaluate that how close the predicted frequency is to the true frequency.That is, we no longer focus on a single frequency point, but a broader frequency range.How to predict frequency interval by means of frequency point is our ultimate motivation.As shown in Figure 5,are our prediction points, andare our prediction intervals.In the real jamming environment, frequency interval could be set according to bandwidth range that the jammer equipment can realize.Only if our predicted frequency is within the frequency interval near the true frequency, the frequency prediction is meaningful.
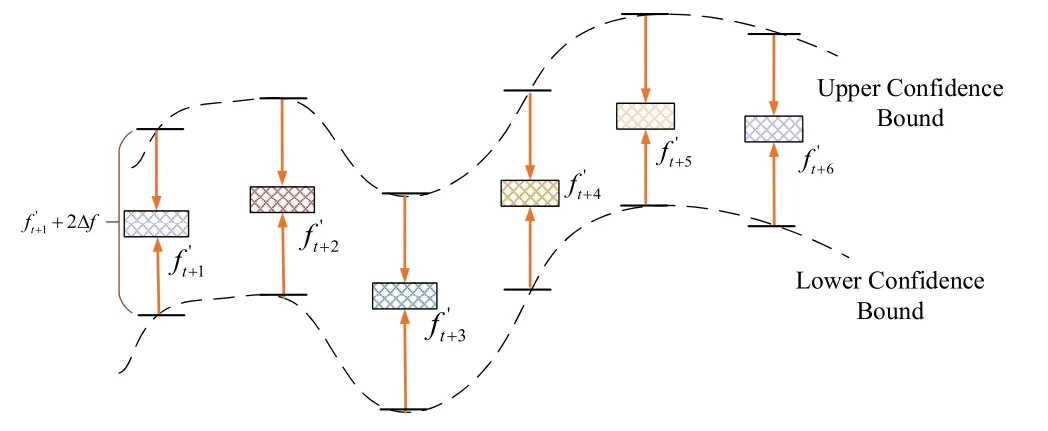
Figure 5. Frequency interval prediction.
IV.SIMULATION AND DISCUSSIONS
In this section, we mainly present the simulation conducted using FH signal based onm-sequence, to demonstrate the effectiveness and fitness of the proposed prediction scheme, the design requirements of FH sequence are presented at first, and then FH frequency based onm-sequence as our simulation data is introduced.Subsequently, frequency estimation, the data preprocessing, simulation settings, and performance metrics are described, and the prediction performance is evaluated and compared with different schemes in the end.
4.1 Frequency Hopping Sequence
The key to improve the performance of FH communication systems is to optimize the parameters of the FH system and one of the important items is to optimize FH sequence.When FH sequence is designed,the following requirements should generally be considered[3].1) All frequencies in the frequency set could be used in a FH sequence to achieve maximum processing gain; 2) Good cross-correlation performance for any two FH sequences; 3)Good auto-correlation performance; 4) The number of sequences in the set of FH sequences should be as large as possible; 5) To keep FH system a good anti-jamming performance,the frequency each frequency point is used in one cycle should be basically the same,i.e.,good uniformity;6) Good randomness and great linear complexity; 7)Short run length to prevent forwarding jamming; 8)Simple producing circuit.
Beginning in the 1970s,m-sequence as FH sequence has been used to control frequency synthesizer to realize FH communication.A.Lempel and H.Greenberger[28]proposed famous L-G model,which,however, exists a severe frequency retention problem.As an improvement, a non-continuous tap model based onm-sequence inGP(p) was proposed to produce the best FH sequence family in Figure 6.Connection polynomial for such ap-aryn-level linear shift register is given by[3]
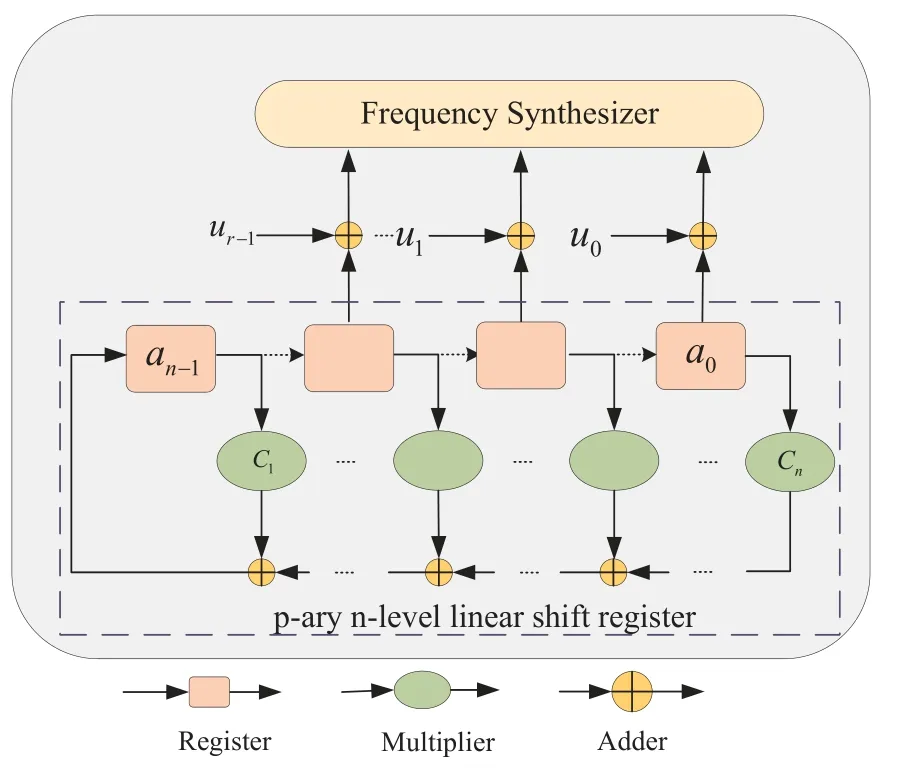
Figure 6. A non-continuous tap FH model[3].

m-sequence controls the production of FH sequence,which is given by[3]

When the connection polynomial is primitive polynomial of degreeninGP(p),the shift register becomes longest linear shift register.Nprimitive polynomial of degreenis capable of producingN m-sequences each at the length ofpn −1.It is proved that FH sequence produced based onm-sequence accords with designed requirements and meets good pseudo-random properties [3].In the next subsection, we will take FH frequency based onm-sequence as an example to implement simulation work,and effectively and timely predict the possible used frequency of the target system at the next period based on the intercepted history FH data.
4.2 Simulations and Performance Analysis
In our simulation, the dataset length of FH frequency based onm-sequence is 4095.The range of FH sequence set is 0∼127, i.e., totally 128 available frequency points.The FH bandwidth is around 2.54M,the sampling rate is 6M, the FH rate is 800hop/s,i.e.,hopping time is 1.25ms.In addition, the SNR after adding white Ganssian noise to the signal is 5dB.TF analysis results of three schemes are shown in Figure 7,from which we can see that the effect of TF analysis for different window lengths is different.As far as STFT concerned, when the window length is longer,the frequency band in the spectrogram becomes thinner, and the frequency resolution is high, but if the window length is too long,frequency overlapping will occur.WVD analysis produces cross terms, and TF resolution is relatively low.Also, due to the too long window length,SPWVD will produce frequency overlapping.Therefore,it is necessary to consider both the frequency resolution and the prevention of frequency overlapping, then take a compromise window length.In the simulation process, we find that although SPWVD has high TF resolution, it costs large amount of computation and has very slow operation speed because of our large data amount and sampling points.Therefore, STFT analysis is utilized to perform FH frequency estimation in the paper.
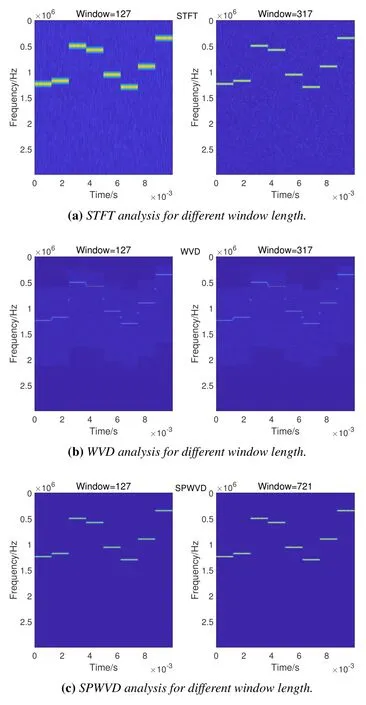
Figure 7. TF analysis results of three schemes.
The energy of FH signal will be gathered at certain frequencies in TF plane,which is the maximum value at that moment.As shown in Figure 8, firstly, STFTbased TF analysis is done.There is a jump between the adjacent frequency components, resulting in a certain step phenomenon similar to the square wave.The frequency value corresponding to the TF ridge between two adjacent jump moments is the instantaneous frequency within that period of time.Then the maximum value in each column of TF matrix is obtained,which is the location of the frequency to be estimated.The wavelet transform has the function of a “magnifying glass” and can amplify the details of the signal to a certain extent, which means it has a good detection ability for this kind of jump and can detect the time point of the jump locally.Then Wavelet analysis under threshold could help us get clear jump point, and the interval between the two jump points is the hopping time of the signal.We set a threshold for the result of wavelet transform of ridge line and get the last subfigure in Figure 8.Finally, the sliding window method is used to perform frequency estimation,in which window length is hopping time, and every frequency point to be estimated is corresponding to the frequency at maximum value in the middle of every window.The estimation result is shown in Figure 9,and the RMSE of real frequency and estimated frequency is calculated around 1.7∗10−3.
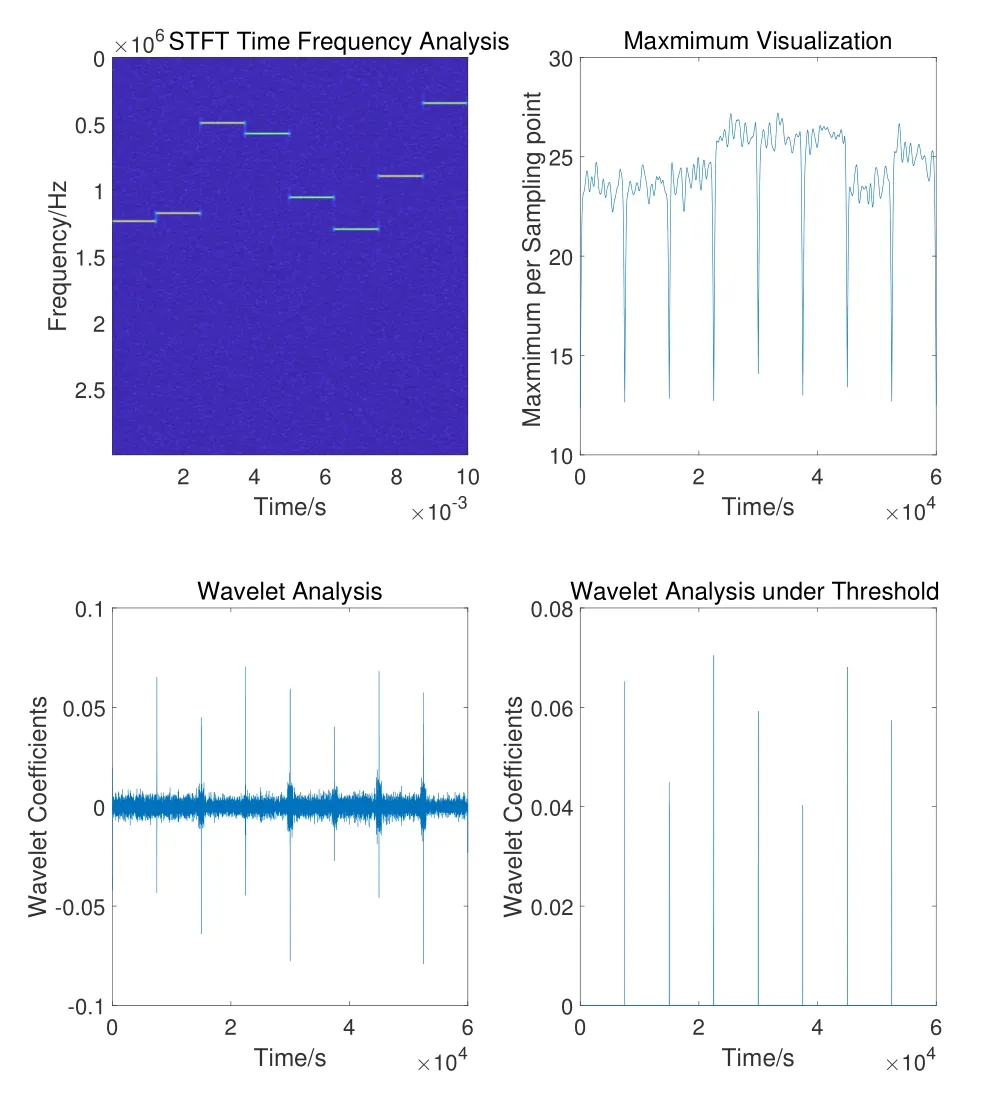
Figure 8. STFT and wavelet analysis based FH frequency estimation.
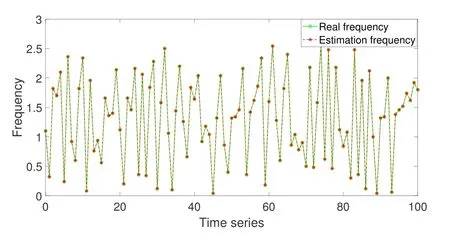
Figure 9. The frequency estimation result with STFT.
We need an important step of data preprocessing before feeding the frequency data to the neural network.We use 95%dataset for model training and the remaining is used for model testing.The design of neural network is a challenging task, because the performance of the network is affected by many hyper-parameters,which mainly depends on the rich experience of engineers.When designing the optimized structure of neural network, the hyper-parameters considered include the number of hidden layers and neurons in the hidden layer, initialization function, activation function,learning rate etc.The optimal hyper-parameter combination is selected through data training.The main hyper-parameters are given in Table 1.The overall process is shown in Figure 10.The prediction result of proposed LSTM prediction scheme is shown in Figure 11.
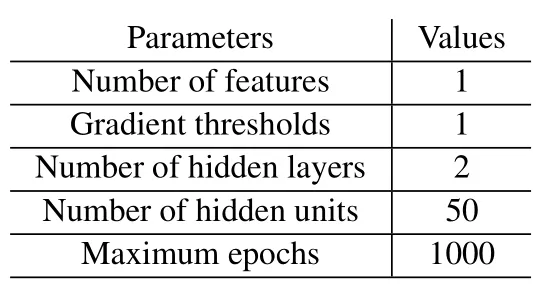
Table 1. The hyper-parameters of the LSTM network.
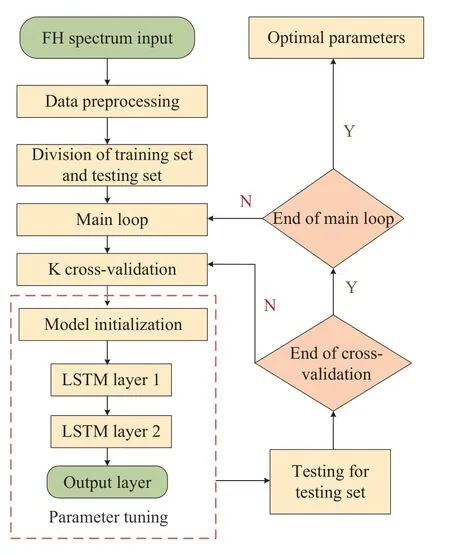
Figure 10. Flow chart of LSTM prediction.
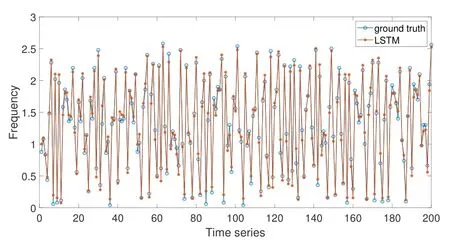
Figure 11. The prediction result of FH frequency with LSTM.
To show the performance superiority of the proposed scheme, several benchmark schemes are presented.Among them, RBF and SVM are two good schemes utilized for nonlinear prediction of FH sequence.The RBF neural network is a three-layer neural network, which includes an input layer, a hidden layer,and an output layer.The hidden layer maps the vector from the low-dimensional space to the highdimensional space, so that the linear inseparability to the low-dimensional space could become linearly separable to the high-dimensional space,which is the main idea of the kernel function.In this way,the transformation from the input layer space to the hidden layer space is non-linear,and the transformation from the hidden layer space to the output layer space is linear.The weight of the network can be directly solved by the linear equations, which greatly accelerates the learning speed and avoids local minimum problems.SVM is a supervised learning model and usually used for pattern recognition, classification, and regression analysis.There are a lot of kernel functions that can be used, which can be very flexible to solve various nonlinear classification and regression problems.Regression prediction is utilized for time series prediction.The purpose of regression is to obtain a modelf(x) that can fit the training set samplesyas much as possible.The usual method is to construct a loss function between the sample label and predicted value of the model,so that the loss function is minimized to determine the modelf(x).Loss function in defined as follows

Besides,the autoregressive integrated moving average(ARIMA)model[29]and Gaussian process regression(GPR) [30] are also as benchmark schemes for they are two commonly used sequence prediction methods.To show the results more clearly,the prediction results are shown in Figure 12(a)for the two existing schemes SVM and RBF,and Figure 12(b)for ARIMA and GP seperately.
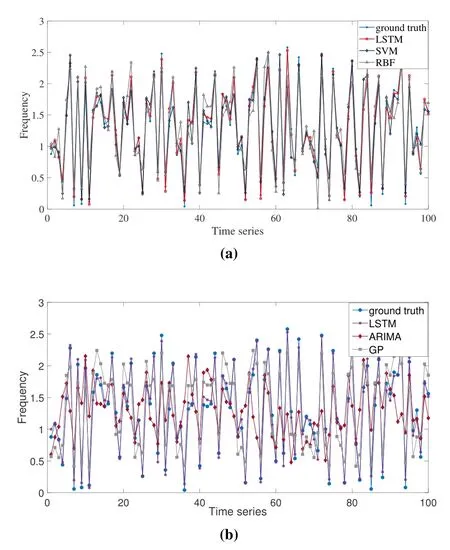
Figure 12. The prediction results of FH frequency with different schemes.
We evaluate the prediction performance of different schemes by prediction accuracy under certain error range(error interval).Only if prediction frequency in certain time step is within error range of real frequency,we regard that the prediction value is true.Error range in a certain frequency point is defined as follow

where ∆fis error interval, i.e., frequency difference from real frequency value in a certain frequency point.Fis the FH bandwidth.e.g.when error interval is 0.2M,Fis 2.54M,we could calculate the error range is around 15.7%, which means we view prediction value within 0.2Mof real value is roughly equal to real value.Once we define error range,we could calculate prediction accuracy within error range.

whereyiandrepresent real frequency and prediction frequency in a certain time step, respectively.count(|yi −| <∆f) represents the number of accurate prediction within error range.count(yi)represents total number of frequency points.
For further illustration, we take the LSTM prediction results of within error interval 0.17M, i.e., error range 13.4% as an example.As shown in Figure 13,two black lines represents the margin of the error range,which means that we regard that the frequency points shown in the between two black lines are predicted right within error range.Based on the proposed evaluation metric,Figure 14 presents the performance comparison of different schemes,in which(a)presents the accuracy of LSTM prediction result.X-axis represents “error range (+/-) error interval” mentioned before,and Y-axis represents accuracy under the metrics of several kinds of“error range(+/-)error interval”.In other words,the values of X-axis represent fault tolerance.9.4%(+/-)0.12M means the predicted frequencyfalls(∈[f −0.12M,f+0.12M])and the bandwidth 0.24M accounts for 9.4%of the total bandwidth 2.54M.We can see that the accuracy of LSTM could reach to more than 90% within error range at 11.8%.SVM,RBF and GP could reach to that accuracy only if the error range reach 25.2%, 29.9% and 31.5% respectively.ARIMA has the worse performance.Obviously,we could conclude that our proposed scheme,LSTM-based prediction model, is superior to others.LSTM scheme could achieve high prediction accuracy even for a relatively small error interval.SVM is mainly for regression prediction and is sensitive to kernel function and parameters.RBF is a kind of forward neural network.Each input of it is independent and the output of the network only depends on the current input.But LSTM is not only related to the input at the current moment,but also related to its output in the past period of time, which is a more capable prediction model.Compared with LSTM, GPR is also capable of dealing with nonlinear problem even for high dimension, but LSTM has greater modeling capabilities in sequence prediction.LSTM can learn the long-term dependency and thus can model and predict better.ARIMA scheme tends to converge to the mean value of the past data, and cannot capture large nonlinear variations underlying the frequency hopping.
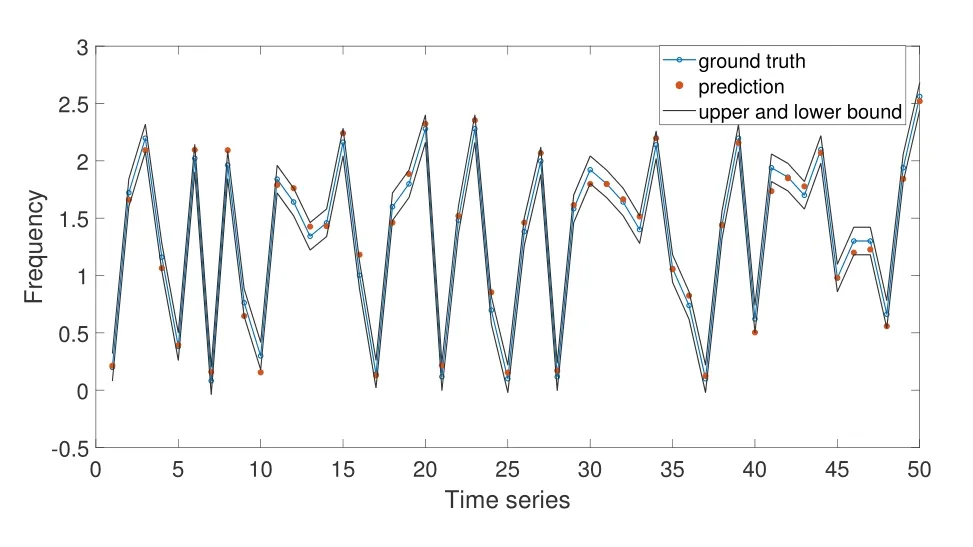
Figure 13. LSTM prediction effect within error range.
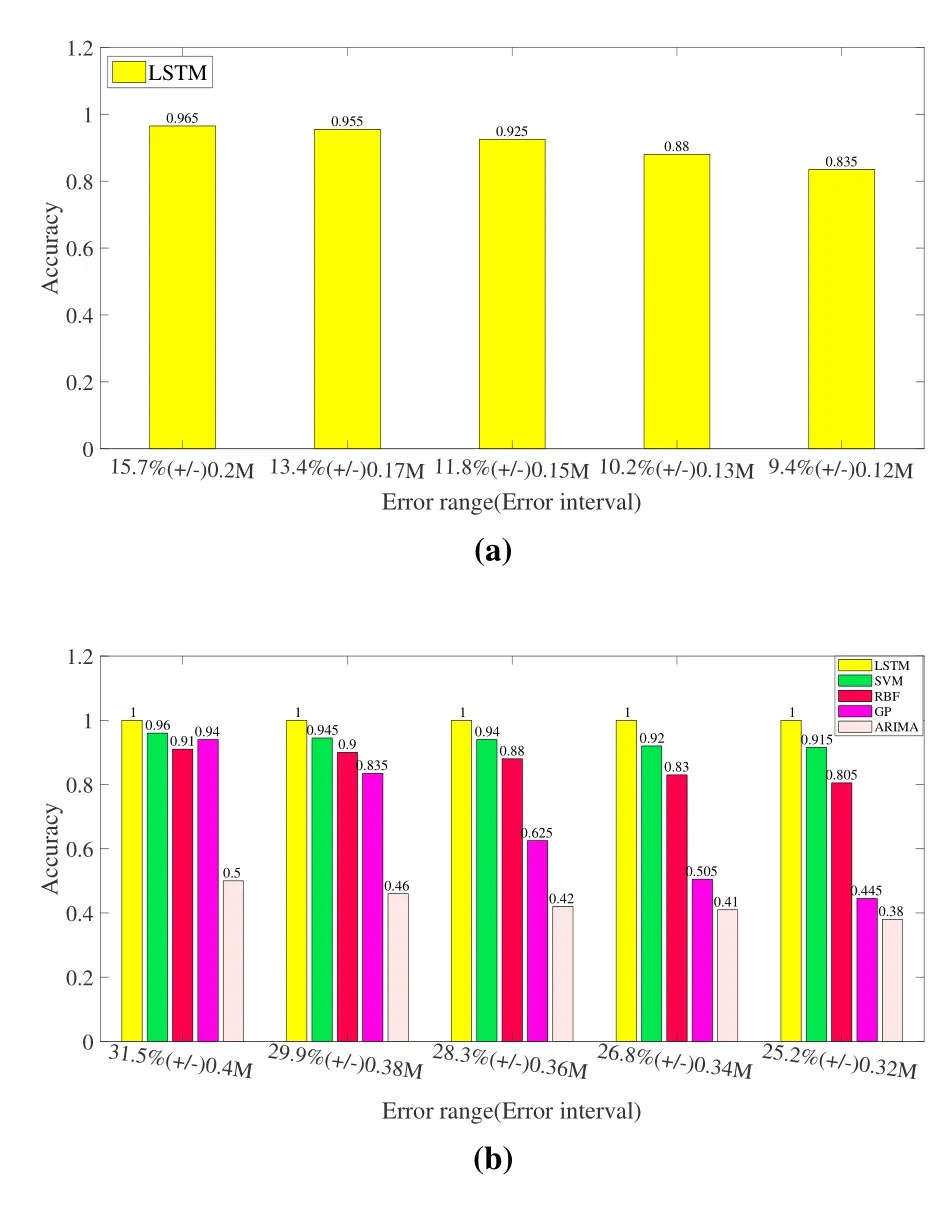
Figure 14. Performance comparison of different schemes.
The accuracy of LSTM prediction within error range 15.7% is 0.965, which means that, in practical application of FH jamming, we should have implemented jamming on around 2.54M bandwidth.But now we probably only need to implemented jamming on 0.4M bandwidth under our effective interval prediction.We largely narrow the jamming range, improve jamming effectiveness and save the cost of jamming equipment.It is a common approach to use m-sequence and shift register to generate the FH sequence.The sequence is pseudo random and meets various requirements of generating FH sequence.That’s why we choose it as an example to conduct simulations.For other FH sequence, we can also achieve similar performance.Figure 15 shows the same superiority of LSTM for chaotic FH sequence based logistic map than the two existing schemes RBF and SVM
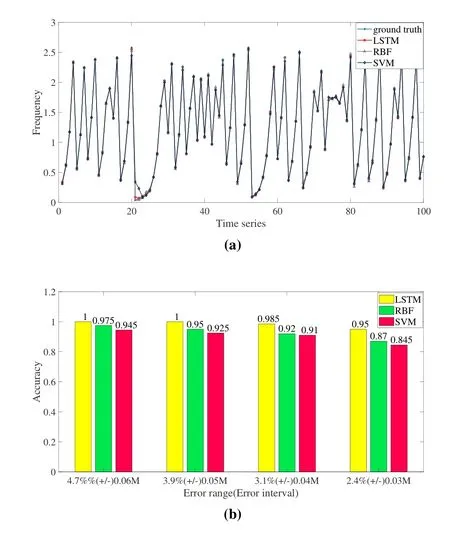
Figure 15. The prediction results of logistic map based FH frequency.
V.CONCLUSION AND FUTURE WORK
In this paper, on the basis of effective TF reconnaissance and frequency estimation, we proposed a LSTM-based prediction scheme to predict FH frequency.We utilized STFT based TF analysis method to perform TF estimation,analyzed the sequence property of FH based onm-sequence and employed the LSTM network to learn the long term dependency in frequency data.SVM, RBF, GP and ARIMA models are presented as comparison with our proposed prediction scheme.It has been shown that the proposed scheme can significantly improve the prediction accuracy as compared with the existing ones.
Although frequency interval prediction is achieved in a relatively high predictive accuracy, realizing the high accuracy of frequency prediction point by point needs further efforts.If the prediction accuracy of a single frequency point is high enough, frequency interval prediction is naturally realized in high accuracy,which is also very important to save more resources while conducting jamming.
We investigate reconnaissance and prediction of just only one communication network.There may exist more than one communication network in real case,and it is still a challenging issue to deal with the frequency prediction issue in such a scenario,especially when multiple FH signals appear simultaneously.In this case, some signal classification and recognition approaches may be applied first to separate signals from different networks, then the proposed FH prediction method can be used.Hence,we only focus on one communication network, but we will continue to investigate such issues in a more pragmatic scenario in our subsequent works.
- China Communications的其它文章
- An Overview of Wireless Communication Technology Using Deep Learning
- Relay-Assisted Secure Short-Packet Transmission in Cognitive IoT with Spectrum Sensing
- Passive Localization of Multiple Sources Using Joint RSS and AOA Measurements in Spectrum Sharing System
- Specific Emitter Identification for IoT Devices Based on Deep Residual Shrinkage Networks
- Primary User Adversarial Attacks on Deep Learning-Based Spectrum Sensing and the Defense Method
- Intelligent Spectrum Management Based on Radio Map for Cloud-Based Satellite and Terrestrial Spectrum Shared Networks

