
High-precision measurements of the inter-annual evolution for Urumqi Glacier No.1 in eastern Tien Shan,China
2021-02-12 03:12ChunHaiXuZhongQinLiJianXinMuPuYuWangFeiTengWang
ChunHai Xu,ZhongQin Li,JianXin Mu,PuYu Wang,FeiTeng Wang
1.State Key Laboratory of Cryospheric Science/Tien Shan Glaciological Station,Northwest Institute of Eco-Environment and Resources,Chinese Academy of Sciences,Lanzhou,Gansu 730000,China
2.National Cryosphere Desert Data Center,Northwest Institute of Eco-Environment and Resources,Chinese Academy of Sciences,Lanzhou,Gansu 730000,China
ABSTRACT High-precision measuring of glacier evolution remains a challenge as the available global and regional remote sensing techniques cannot satisfactorily capture the local-scale processes of most small-and medium-sized mountain glaciers.In this study,we use a high-precision local remote sensing technique,long-range terrestrial laser scanning (TLS),to measure the evolution of Urumqi Glacier No.1 at an annual scale.We found that the dense point clouds derived from the TLS survey can be used to reconstruct glacier surface terrain,with certain details,such as depressions,debris-covered areas,and supra-glacial drainages can be distinguished.The glacier experienced pronounced thickness thinning and continuous retreat over the last four mass-balance years (2015-2019).The mean surface slope of Urumqi Glacier No.1 gradually steepened,which may increase the removal of glacier mass.The glacier was deeply incised by two very prominent primary supra-glacial rivers,and those rivers presented a widening trend.Extensive networks of supra-glacial channels had a significant impact on accelerated glacier mass loss.High-precision measuring is of vital importance to understanding the annual evolution of this type of glacier.
Keywords:glacier thickness change;front variation;supra-glacial drainage pathway;long-range terrestrial laser scanning(TLS);climate change
1 Introduction
Glaciers in arid and semiarid regions of western China are sensitive to climate change and have experienced ongoing mass loss and retreat over the last 20-50 years (Farinottiet al.,2015;Brunet al.,2017),which undoubtedly affects downstream human livelihoods and hydro-economies.Rapid and reliable measurement is fundamental to studying glacier evolution and evaluating its impacts on water sources (Rippinet al.,2015;Thomsonet al.,2016).However,available global satellite imagery cannot measure annual and intra-annual variations of mountain glaciers satisfactorily,such as the limited time-resolution and vertical accuracy of Advanced Spaceborne Thermal Emission and Reflection Radiometer (ASTER),penetration of snow and ice for Shuttle Radar Topography Mission(SRTM),sparse spatial sampling of ICESat laser altimetry,the influence of terrestrial water storage for the Gravity Recovery And Climate Experiment(GRACE) (Brunet al.,2017;Schumann and Bates,2018).
Data acquisition technology for local-scale processes of mountain glaciers is desperately needed due to glaciers in China are dominated by small-and mediu m-sized ones,glaciers of areas smaller than 1 km2and 0.5 km2account for about 83% and about 70% of the total number,respectively (Guoet al.,2015).Currently,the available high-precision techniques mainly include real-time kinematic (RTK) global navigation satellite system (GNSS),unmanned aerial vehicle(UAV) and laser scanning (Shangguanet al.,2010;Immerzeelet al.,2014;Fugazzaet al.,2018;Schumann and Bates,2018).RTK can only obtain single point information of glacier surface and is impractical for glacier-wide surveys as the technology is time-consuming and laborious,especially for inaccessible glacier areas (e.g.,crevasses,steep ice,debris cover,etc.) (Shangguanet al.,2010;Wanget al.,2017).The application of UAV to glacier surveying can overcome the challenges related to the RTK survey.However,the rarefied air and frequent blustery wind around mountain glaciers can quickly exhaust UAV's power,and rock outcrops can result in difficult field operations of the device.Consequently,only ablation areas or lower elevations of most mountain glaciers were surveyed using UAV (e.g.,Immerzeelet al.,2014;Rippinet al.,2015;Gindrauxet al.,2017;Benoitet al.,2019;Cheet al.,2020).In addition,the reliability of UAV surveys in glaciology applications is more dependent on the natural features of the surveyed surfaces and ground control points (GCPs)used for georeferencing (Immerzeelet al.,2014;Gindrauxet al.,2017).
Compared with RTK and UAV,three-dimensional(3-D) laser scanning calculates the high-accuracy 3-D coordinates of surveyed targets based upon the time difference between the emitted laser pulse and the one reflected by the target and obtains the point clouds of the target surface through continuous surveys.Presently,3-D laser scanning has been increasing applications to measure glacier evolutions(Joerget al.,2012;Gabbudet al.,2015).Airborne laser scanning (ALS)can rapidly survey open areas with easy and efficiency.However,large topography undulation and high-altitude rock outcrops around glaciers reduce the ability of geodetic surveys by aircraft due to most ALS devices having limited operating flight altitude,groundbased surveys would therefore be more practical(Piermatteiet al.,2015).
Terrestrial laser scanning (TLS) is more economical and flexible than ALS and has become a powerful tool for measuring glaciers in the European Alps(Gabbudet al.,2015;Fischeret al.,2016).Although TLS can only be used at some fixed points and influenced by ground surface depressions and obstructions,it can provide rich information on temporal variability(annual to seasonal to monthly)of the individual glacier.The application of TLS in China is mainly concentrated in historic building restoration,landslide deformation and land-surface subsidence in mining areas.
Urumqi Glacier No.1 in the eastern Tien Shan,Xinjiang Uygur Autonomous Region,has been the subject of glaciological measurements since 1959.Superior observation basis and conditions allow the installation of many observation instruments on the glacier,such as steam drill,radar thickness gauge and quartz crystal thermometer,etc.(Zhu,1982;Liang,1983;Renet al.,1985).The TLS survey of Urumqi Glacier No.1 was initiated in 2015 (Xuet al.,2019),and multi-temporal point clouds of the glacier surface have been collected.In previous studies,the TLS was only used to monitor geodetic glacier mass balance.No efforts have been devoted to analyzing glacier surface features and their detailed changes.This study aims to present high-precision measuring of annual glacier evolution based on the latest TLS survey,including glacier thickness change,front variation(length changes),surface slope and aspect,and supraglacial drainage pathways system.
2 Study site
Urumqi Glacier No.1 (43.08°N,86.82°E) is a northeast-facing small valley glacier on the north slope of Tianger Peak II (4,848 m a.s.l.) at about 130 km south of Urumqi.The glacier broke into two small glaciers,i.e.,East and West Branch,in 1993,due to the ongoing recession (Figure 1) (Liet al.,2011).Its total area was 1.554 km2in 2017 (Xuet al.,2019).As one of the reference glaciers in the World Glacier Monitoring Service (WGMS),Urumqi Glacier No.1 has accumulated measurements of 60 years for glaciological mass balance,over 30 years of glacier surface velocity and front variation data.Nine topographic maps of the glacier were published from 1959 to 2012(WGMS,2020).Additionally,a TLS was used to map the glacier surface at seasonal and annual scales(Wanget al.,2016;Xuet al.,2019).
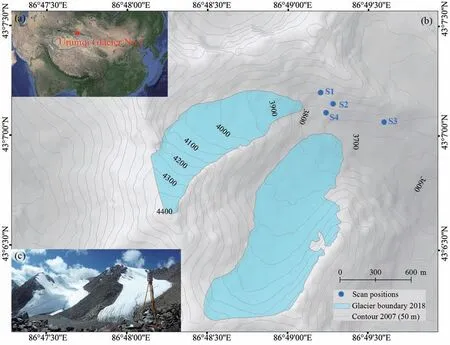
Figure 1 An overview of the study site.(a)The location of Urumqi Glacier No.1 in the eastern Tien Shan.(b)The topography of Urumqi Glacier No.1,and scan positions(S1,S2,S3 and S4)for the TLS survey,and the glacier boundary delineated from the TLS-derived point cloud.(c)View of the glacier and the TLS survey equipment on August 28,2018
Globally,Urumqi Glacier No.1 is situated in the hinterland of Eurasia in the middle latitude of the northern hemisphere,far away from the ocean.The strong westerly circulation forms a cold high-pressure zone over the Tien Shan,resulting in a cold and dry climate in winter.During summer,the subtropical high-pressure zone over the Tibetan Plateau heats the air.As a result,it forms an upward airflow,helping draw the Indian Ocean warm and humid air and produce abundant precipitation.For the aforementioned continental climate setting,the glacier can be categorized as a typical summer-accumulation-type (cold glacier)(Sorget al.,2012;Farinottiet al.,2015).
3 Data and methods
3.1 Terrestrial laser scanning device
A long-range Riegl VZ®-6000 TLS is used in this study.The TLS launched by Riegl Laser Measurement Systems GmbH (Austria) in 2012.The device is well suited for glacier surveys since its laser wavelength is around 1,064 nm (near-infrared).The dustand water-proof TLS device weighs 14.5 kg with an operating voltage ranging from 11 V to 32 V and a working air temperature ranging from-10 ℃to 50 ℃,these make the TLS is convenient for glaciological applications (RIEGL Laser Measurement Systems,2014).The instrument can offer the maximum measurement range of 6,000 km for natural targets when the laser pulse repetition rate is configured as 30 kHz.Note that the maximum range is conditioned on flat targets with size over the laser beam diameter,perpendicular angle of incidence and atmospheric visibility of 23 km (RIEGL Laser Measurement Systems,2014).The longest measurement range of Urumqi Glacier No.1 had reached up to 4.8 km,which was far more than the maximum length of the glacier (1.99 km in 2012) (Wanget al.,2016).Other primary performance parameters include scanning field can of 60°×360°,high-speed data acquisition up to 300,000 points/second;point cloud data accuracy as high as 10 mm,angle measurement resolution better than 0.0005° (1.8 arcsec),and laser divergence of 0.12 mrad (equivalent to 12 mm increase in laser beam width per 100 m range).
3.2 TLS survey description
Field operation is mainly composed of three parts:
1) Selection of scan positions and survey marker configuration.From our field experience,the selection of scan positions follows those principles:(a)scan positions should be set in a safe area with a broad vision and stable terrain;(b) scan positions must be located at different elevations around mountain glaciers and the number of scan positions should be as small as possible to reduce error related to point cloud processing;(c) scan positions should be increased when a glacier surface terrain is complex,and a platform can be built to increase the scanning field if necessary;(d) the distance between the scanner and the target should be within the scanning range,and the angle between the laser pulse and the target should be more than 10° to receive the echo;(e) the overlap of two adjacent scan positions should be more than 30%.Based on the above principles,four scan positions were used for the TLS survey of Urumqi Glacier No.1,as shown in Figure 1b.Each scan position was seated on stable bedrock.Stainless steel markers were grouted to the bedrock with mortar to form a standard GNSS-leveling point,as shown in Figure 2a.Note that each marker is covered with a box for long-term protection.

Figure 2 Survey marker(a)and 3-D coordinate survey(b)of each scan position.The 3-D coordinate survey was implemented using a Trimble R10 global navigation satellite system(GNSS)in 2018
2) Survey of 3-D coordinates.Coordinates of the four scan positions were previously surveyed using the real-time kinematic(RTK)global navigation satellite system (GNSS) of Unistrong E650 (Xuet al.,2019).Since 2018,the coordinates have been surveyed using a Trimble R10 GNSS system.The accuracy of static measurements is within±3 mm horizontally and±3.5 mm vertically(Figure 2b).
3) Point cloud data acquisition.After the 3-D coordinate survey,the TLS device was mounted on a sturdy tripod to collect cloud data at each scan position.The surveying parameters and atmospheric conditions directly determine data quality and acquisition time.They were configured to collect relatively high data quality at a reasonable acquisition time.Note that the laser pulse repetition rate was first set to 50 kHz and line resolution and frame angle resolution were set to 0.2° to conduct coarse scanning with vertical and horizontal angles range of 60°-120° from the zenith and 0°-360°,respectively.Then the glacial regions of coarse scanning images were identified to finish fine scanning with the laser pulse repetition rate of 30 kHz,line and frame angle resolution of 0.02°except for the scan campaign on September 2,2015(Table 1).Note that the selected field should always cover the entire glacier to guarantee the overlap of four scans was at least 30%(CH/Z 3017-2015,2015).Detailed point cloud surveying parameters used in this study are listed in Table 1.
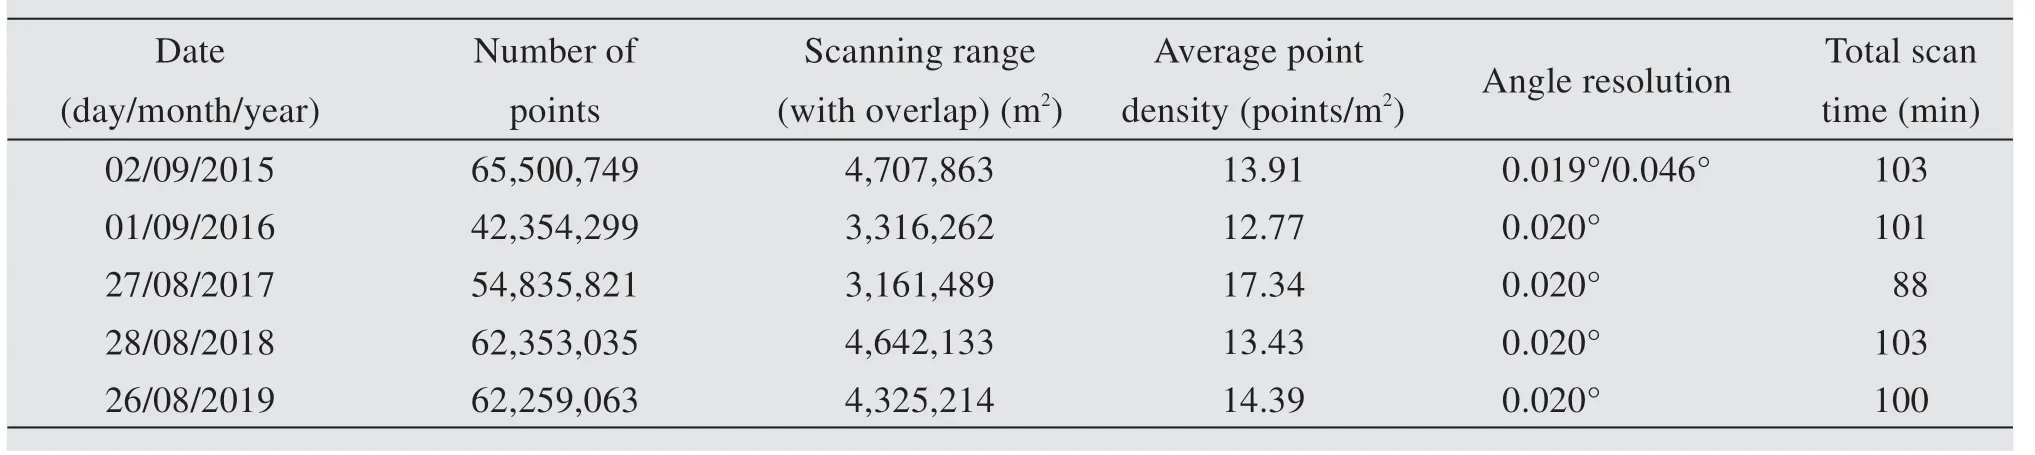
Table 1 Detailed point cloud surveying parameters of point cloud used in this study
3.3 Point cloud processing
Raw point cloud processing was performed using RiSCAN PRO®v 1.81 software.The processing includes direct georeferencing,data registration,compression,filtering and multi-temporal registration.The 3-D coordinates were used to transform the Scanner's Own Coordinate System (SOCS) into a Global Coordinate System (GLCS) for each scan position to implement point cloud direct georeferencing (Lichtiet al.,2005).Then multi-station adjustment (MSA)was used to realize the data registration of each scan position based on the iterative closest point algorithm(Besl and McKay,1992;Zhang,1994).Afterward,the point cloud of each scan position was mosaicked into one layer,and the octree algorithm and terrain filter were respectively used to compress mosaic point cloud with a uniform space of 0.5 m and to filter out the noise and non-ground data (Figure 3).Finally,the unfiltered outliers we removed manually to generate glacier surface point clouds with one layer (Schnabel and Klein,2006;Perroyet al.,2010).
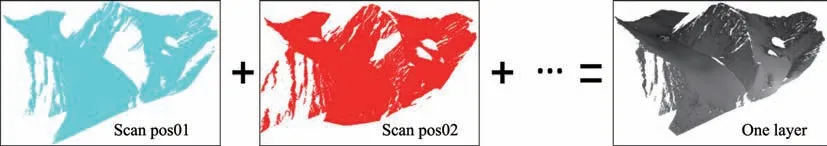
Figure 3 Mosaicking of the point cloud of each scan position into one layer.The colors of point clouds denote different scan positions
Multi-temporal registration of two consecutive scan campaigns is crucial to identify glacier surface features changes (López-Morenoet al.,2016;Fey and Wichmann,2017).We set the processed layer of 2015 as a reference and implemented the alignment of scan campaigns for other years by using iterative closest point algorithms(Revueltoet al.,2014).
3.4 Determination of glacier surface features and their changes
1) Glacier surface elevation.The natural neighbor method was used to interpolate the processed point cloud data that generates high-resolution digital elevation models (DEMs) (0.5 m) of the study site with ArcGIS10.2 software.Subtraction of two consecutive DEMs provides detailed changes in glacier surface elevation(Thibertet al.,2008;Zempet al.,2013).
2) Glacier boundary and front variations.The shade reliefs of each year at an azimuth angle for illumination (300°) were calculated based on multi-temporal TLS-derived DEMs to show the apparent differences between the glacier and non-glacierized areas after repeated tests.Then the glacier boundary was delineated directly following the methods proposed by Abermannet al.(2010).Overlay of multi-temporal boundaries generates detailed changes in front variations.In this study,the character point method recommended by Liet al.(2012) was applied to calculate glacier front variations.This method determines the shortest distance between two consecutive boundaries using ArcGIS10.2 software.
3) Supra-glacial drainage pathways.Supra-glacial channels were delineated by assuming all water from an upper-elevation pixel passes to the most downhill adjacent pixel (Rippinet al.,2015).In this study,we used the hydrological analysis tools (in ArcGIS 10.2 software) to extract supra-glacial drainage pathways automatically based upon TLS-derived DEMs,then the pathways were corrected by visual interpretation to retrieve accurate and reliable results.
3.5 Uncertainty analysis
Uncertainties of glacier surface features and their changes mapped by the Riegl VZ®-6000 TLS system arise from point clouds acquisition and data processing.During data acquisition,the stability of the scan positions influences the accuracy of multi-temporal registration.Hence,fixed scan positions and static measurements with Trimble R10 were used to minimize the influences.Additionally,atmospheric conditions,such as wind and moisture,can induce error.Specifically,wind can cause the vibration of the TLS and induce significant scanning errors over large scales (Revueltoet al.,2014).And moisture (precipitation and fog) can absorb laser pulse and reduce the possible scanning range.Therefore,dry and windless atmospheric conditions were selected in this study to perform the TLS survey (Figure 1c).Data processing errors include registration of each scan position,point clouds vacuation,and filtering.The error of data registration was minimized using the iterative closest point algorithm,and the MAS (σMSA) error was utilized to quantify registration quality.Furthermore,the applied octree algorithm for filtering can build the topological relationship of point clouds to retain terrain information(Perroyet al.,2010).
Uncertainties errors still existed although the aforementioned surveying and data processing precautions were taken into consideration.Here we used the standard deviation of the non-glacierized stable terrain (σΔhTLS) to evaluate the uncertainty of glacier thickness changes () based upon the geostatistical analysis(Rolstadet al.,2009):
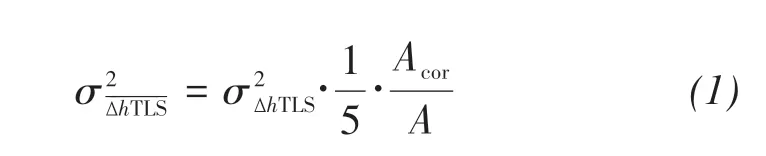
whereAcoris the correlation area andAis the mean glacier area between two periods.We assume thatA=Acorsince the high density (>1 point/m2) of the TLS point clouds (Joerget al.,2012).We found that the absolute value ofwere in the range of 0.120-0.229 m/a for the four mass-balance years.
Uncertainty of glacier front variations (UL) originates from the spatial resolution of TLS-derived DEMs and errors of multi-temporal registration according to Silverio and Jaquet(2005)and calculated as:

whereλis the original pixel resolution (0.5 m) of the point;εis the multi-temporal registration errors and the error of MAS (σMSA) was used to represent the error term (Xuet al.,2019).The final calculated error was±0.505 m,±0.505 m,±0.504 m and±0.502 m,for the mass-balance year 2015-2016,2016-2017,2017-2018 and 2018-2019,respectively.
Uncertainty of supra-glacial drainage pathways,surface slope depends on the precision of the TLS surveys,here was estimated as ±0.100 m based on the general description and data interfaces of Riegl VZ®-6000 TLS (RIEGL Laser Measurement Systems,2014).
4 Results
4.1 Glacier surface terrains and its changes
Figure 4 illustrates a 3-D reconstruction of the glacier surface and its surrounding terrains with the dense point clouds.Such a reconstruction is vital for mapping glacier evolution.Two minimal artifacts(two red frames) existed at the middle elevations of the west branch as the terrain is relatively gentle,where no echo of the laser pulse was received.Despite these artifacts,both glacier surface and surrounding terrains were satisfyingly reconstructed.The glacier surface and surrounding terrains are satisfyingly reconstructed,and the boundaries between the glacier and ice-free areas can be identified.Additionally,depression areas at the upper elevations (Figure 4b),supra-glacial drainages (Figure 4c),and a small debriscovered area(Figure 4d)were captured by the TLS.

Figure 4 3-D reconstruction of the glacier surface using the dense point clouds from the TLS.(a)Overview of the spatially distributed glacier and its surrounding surface terrains in 2019,(b)depression zones at the upper elevations of the glacier,(c)supra-glacial drainage,and(d)small debris-covered area at the terminus of the east branch
Differentiation of multi-temporal DEMs derived by the TLS uncovers detailed glacier surface elevation changes,as illustrated in Figure 5.Urumqi Glacier No.1 had experienced pronounced elevational lowering over the last four mass-balance years,with a mean drop of -0.827±0.229 m,-0.746±0.163 m,-0.670±0.120 m and -0.375±0.178 m for the massbalance year 2015-2016,2016-2017,2017-2018,and 2018-2019,respectively.During these four periods,the most significant drop,from -3.5 to -5 m,occurred in the lower elevations,and less pronounced thinning to slight thickening ranging from 0 to 2 m occurred in the upper reaches.The elevational change patterns were in line with the glaciological mass balance reported previously (WGSM,2020).Areas with elevation lowering during the mass-balance year 2015-2016,2016-2017,2017-2018,and 2018-2019 account for 78.50%,77.50%,78.00%,and 51.86% of the total glacier area,respectively.These numbers are referred to as elevation-drop area ratio hereafter.The glaciological mass balance of those corresponding years is -780 mm w.e.(water equivalent),-682 mm w.e.,-711 mm w.e.and -272 mm w.e..The absolute value of glacier mass loss closely correlates with the geodetic elevation lowering area ratio(R2=0.98).Larger elevation lowering area ratio results in more negative mass balance,indicating that the TLS-derived glacier surface elevation changes are reliable.

Figure 5 Spatial pattern of TLS-derived surface elevation change of Urumqi Glacier No.1 for the mass-balance year 2015-2016(a),2016-2017(b),2017-2018(c),and 2018-2019(d).Green boxes represent areas that have not been surveyed by the TLS
More thickening was measured in the upper eastern elevations of the east branch during 2016-2017 compared with the rest periods (Figure 5b),which may be related to an avalanche during the TLS survey campaign in 2016.The noticeable elevational lowering of the same elevations in the mass-balance year 2016 validates the hypothesis to some extent.In addition,supra-glacial drainage pathways had caused pronounced linear elevation changes with exceptional values.
4.2 Annual front variations
Accurate glacier boundaries derived from the multi-temporal DEMs allow detailed insight into the glacier front variations since the glacier area shrinkage is primarily attributed to the terminus retreat.The biggest advantage of this boundary delineation method is that all of the scan campaigns were completed at the end of the ablation (Table 1) when the glacier tongue was covered by bare ice.Thus the digitized glacier boundaries could reflect the actual extent.Urumqi Glacier No.1 had experienced continuous retreat from 2015 to 2019.The shrinking rate varied in different directions,and the absolute reduction in the middle parts was generally more significant than both sides of the glacier tongue.The mean annual length retreat ranges from 5.27 m to 7.08 m and 3.36 m to 6.38 m for the east branch and the west branch,respectively (Figure 6).TLS-derived annual front variations are in good correlation with the ones measured by tape readings at the site.But they are generally less than the measured,probably due to the discrepancy in measuring methods.Specifically,tape readings first measure the distance and direction from fixed positions in the glacier forefield (e.g.,landmarks,cairns,and boulders) to the ice front and then compare to the values from the previous year(s)to calculate glacier front variations.Thus tape readings can only use a few fixed positions due to inaccessible forefield.In contrast,the TLS survey is not limited to accessibility and allows variation evaluation at numerous locations along glacier fronts(Wanget al.,2016).

Figure 6 Spatially distributed glacier front variations for the west(a)and east(b)branches of Urumqi Glacier No.1.Shaded reliefs in the background are from the TLS-derived DEMs in 2019
4.3 Evolutions of glacier surface slope
Surface slope and aspect are the two important topographic factors that affect glacier ablation.The glacier surface was characterized by the large slope(≥20°) in the firn basin and glacier terminus of the west branch and upper east side of the east branch(Xuet al.,2019).The mean surface slope of Urumqi Glacier No.1 was 23.12°,23.26°,23.43°,23.52°,and 23.54°,in 2015,2016,2017,2018 and 2019,respectively,indicating glacier surface gradually steepened,which can be probably attributed to pronounced increased slope at the glacier terminus.In all periods,spatially distributed surface slope recorded very slight variations,and the vast majority of slope changes ranged from -3° to 3°.Both increase and decrease in slope occurred in nearly all the elevations with a pattern of stripe-like alternant distribution,which may be associated with glacier movements (Figure 7).Glacier movements can transfer glacier mass from the accumulation area into the ablation area.Aside from the glacier terminus,pronounced changes in surface also appeared at depression areas and supra-glacial channels(Figure 7).Continuous ablation steepened the terminus of the west branch,which increased the removal of glacier mass.
4.4 Supra-glacial drainage pathways
The supra-glacial drainage system is vital for mountain glaciers since it can influence glacier flow,sediment transport,and ice-flux (Rippinet al.,2015).For Urumqi Glacier No.1,a supra-glacial drainage system mainly developed at the lower elevations (ablation area).The west branch and the east branch of Urumqi Glacier No.1 were deeply incised by very prominent primary supra-glacial rivers,respectively,which were remarkably pronounced and visible in the shaded reliefs of the glacier calculated based on the TLS-derived DEMs (Figures 8 and 9).Several secondary micro-scale discrete and approximately parallel supra-glacial drainage channels developed at the ablation area of the east branch with intense meandering.Those intricate secondary supra-glacial drainage channels were just a few centimeters to tens of centimeters in width.All of the pathways meandered and varied every year (Figures 8f and 9f),which may be attributed to strong ablation.Glacier meltwater continually eroded and altered supra-glacial drainage pathways.
The interior terrains of those supra-glacial rivers cannot be surveyed completely by using the TLS as the pathways were intricate.Here we mainly retrieve the width of two primary supra-glacial rivers.For the east branch,the average width of the prominent primary supra-glacial river in 2015,2016,2017,2018 and 2019 was 2.737 m,2.888 m,2.973 m,3.057 m and 3.091 m,respectively,with a widening rate of 0.088 m/a from 2015 to 2019.The corresponding value of the west branch was 1.935 m,2.670 m,2.940 m,3.078 m and 3.275 m,with a widening rate of 0.335 m/a during the four years,which was therefore much larger than the east branch.This phenomenon was probably related to prominent primary supra-glacial drainage pathway diversion of the west branch and the river widened considerably since 2016 (Figure 8).The widening of those extensive supra-glacial rivers had accelerated the ablation of the glacier.We discuss the reasons for this pattern in section 5.2.
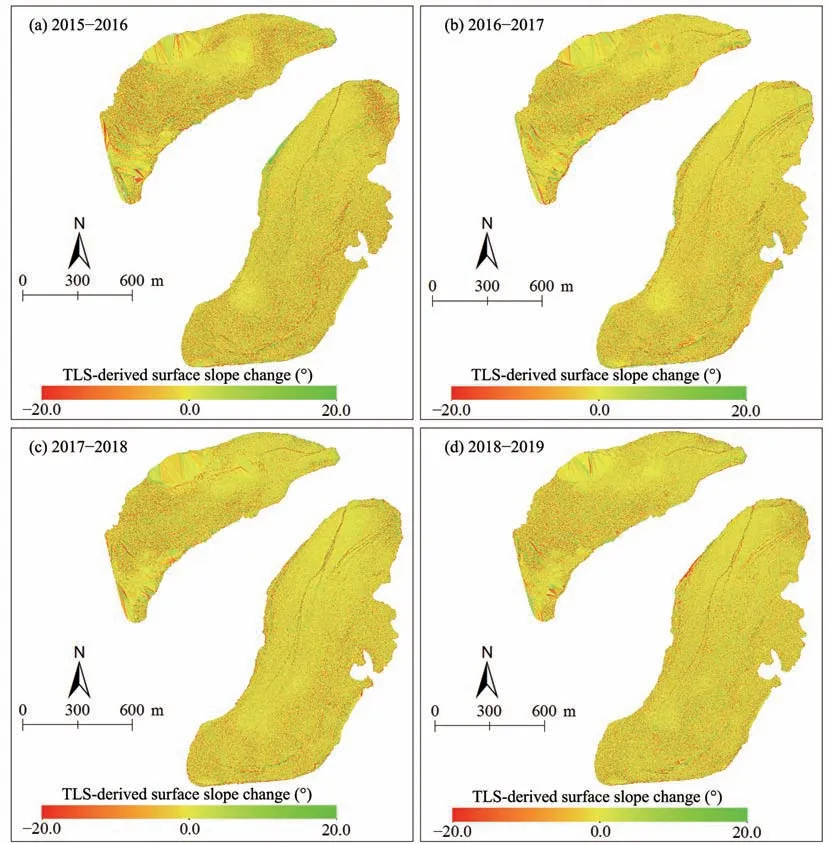
Figure 7 Spatially distributed surface slope changes of Urumqi Glacier No.1 for the mass-balance year 2015-2016(a),2016-2017(b),2017-2018(c)and 2018-2019(d)
5 Discussions
5.1 Accuracy of the TLS survey
The stability of scan positions and atmospheric conditions directly influence the accuracy of the TLS survey.Using fixed scan positions with standard GNSS-leveling points can improve the accuracy of glacier measurements.Windless atmospheric conditions were selected to reduce the vibration of the TLS device,and dry weather can generate broader scanning coverage.The scanning accuracy can reach up to 10 mm under those optimal operational specifications(CH/Z 3017-2015,2015).An experiment was carried out to check the accuracy of the TLS survey at the study site.The walking routes and footprints that were left on the glacier surface on the eve of scanning are easily identified from the dense point cloud(Figure 10),indicating high accuracy and -resolution of the TLS surveys.The accuracy of elevation differences between two consecutive scan campaigns is essential for observing glacier evolution.Utilizing the static measurements (Trimble R10 GNSS system)for 3-D coordinate surveys of each scan position can significantly improve the quality of registration.Statistical error MAS values (σMSA) reported by RiSCAN PRO®v 1.81 software were 0.07 m,0.07 m,0.06 m and 0.05 m for the mass-balance year 2015-2016,2016-2017,2017-2018 and 2018-2019,respectively.Therefore,the accuracy of elevation differences in this study met the requirement of glacier evolution monitoring.
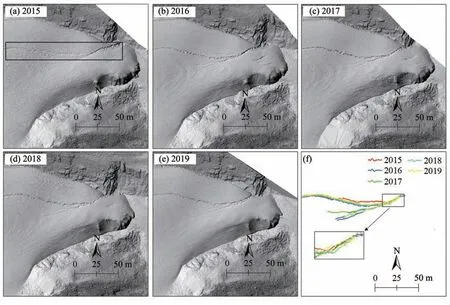
Figure 8 Spatial and temporal evolution of supra-glacial drainage pathways over the lower reaches of the west branch from the TLS surveys in 2015(a),2016(b),2017(c),2018(d),and 2019(e).Major supra-glacial drainage pathways were manually identified(f)
5.2 Glacier changing pattern
Our study shows that glacier terminus retreat and thinning occurred in Urumqi Glacier No.1 during the four investigated periods.The changing pattern is significantly different from European alpine glaciers,where the glacier change is dominated by thinning (or mass loss) (Dinget al.,2019;Sommeret al.,2020).The increase in air temperature during ablation season and englacial temperatures,and the decrease in glacier surface albedo jointly dictated the changing behavior of Urumqi Glacier No.1 (Liet al.,2011).The changes in glacier surface elevation (thickness) and front are controlled by glacier mass balance and dynamic processes,which present indirect,delayed,filtered and enhanced responses to climate change (Haeberliet al.,1995).Urumqi Glacier No.1 is in disequilibrium with the present climate,and glacier retreat resulted from previous climate warming.The glacier will continue to retreat in the not too distant future,even with climate change mitigation in place (Marzeionet al.,2018).
In addition,the supra-glacial drainage had widely developed during the ablation season over the lower reaches of Urumqi Glacier No.1,whose developments will likely become more intensive as the climate continues to warm.Extensive networks of supra-glacial channels significantly impact energy exchanges between the atmosphere and glacier,which will,in turn,increase the energy of shortwave-radiation to transport into the glacier,including the potential energy released by flowing water (Xuet al.,2018).However,the influence cannot be well quantified since the lack of in-situ-measured data.Furthermore,the extensive supra-glacial channel networks can also increase the effective ablation area.We selected four transverse profiles of surface elevation changes across the two very prominent primary supra-glacial channels to make a quantitative analysis on the impact of those streams on glacier ablation.Figure 11 indicates that glacier surface lowering at the supra-glacial drainage was noticeably higher than the surroundings (the lower-case letters preweuted here are marked in Figure 5),implying that supra-glacial channels significantly accelerated the mass loss by between -1.8 m w.e.and -0.9 m w.e.(The density of ice is 900 kg/m3.).

Figure 9 Spatial and temporal evolution of supra-glacial drainage pathways over the lower reaches of the west branch from the TLS surveys in 2015(a),2016(b),2017(c),2018(d),and 2019(e).Major supra-glacial drainage pathways were manually identified(f)
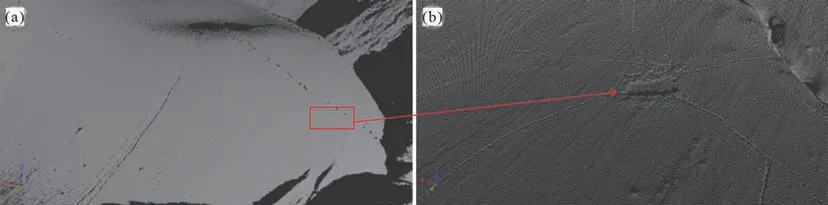
Figure 10 TLS-derived point cloud of the east branch:(a)enlargement of a local region,and(b)details of a footprint that is easily identifiable

Figure 11 Transverse profiles of surface elevation changes across the two very prominent primary supra-glacial rivers
6 Conclusions
Rapid and reliable measuring of glacier evolution is fundamental to understanding climate-glacier interactions.However,available global or regional remote sensing technologies cannot map local-scale processes of mountain glaciers satisfactorily since most glaciers in China are small-or medium-size.A high-precision remote sensing technique,TLS,has become a powerful tool for measuring glacier evolution in European Alps.This study has demonstrated the use of a long-range TLS to map the annual change of Urumqi Glacier No.1 from the last four mass-balance years spanning from 2015 to 2019.The main conclusions of this study are as follows:
1) Dense point clouds derived from the TLS survey allow meticulous 3-D reconstruction of the surface terrains of Urumqi Glacier No.1.Surface depressions,debris-covered areas and supra-glacial drainage channels can be clearly distinguished based on the 3-D reconstruction.Further,differentiation of multitemporal TLS-derived DEMs suggests that the glacier had experienced pronounced thinning over the last four mass-balance years.
2) Elevation lowering area ratios closely correlate with glaciological mass loss,indicating the reliability of the TLS-derived glacier surface elevation changes.During the study period,the glacier also showed continuous terminus retreat.The shrinking rate varied in different directions,with mean annual retreat values ranging from 5.27 m to 7.08 m and 3.36 m to 6.38 m for the east and branch respectively.These values are consistent but are generally less than the front variations derived from tape readings.This discrepancy is primarily due to the limited number of glacier front variations that tape readings can evaluate due to limited accessibility.The mean surface slope of Urumqi Glacier No.1 gradually steepened,which may increase the glacier ice ablation.
3) Urumqi Glacier No.1 was deeply incised by two very prominent primary supra-glacial rivers,and those rivers presented a widening trend.Extensive networks of supra-glacial channels have a significant impact on accelerated glacier mass loss.
4)It is found that Urumqi Glacier No.1 experiences terminus retreat and thinning simultaneously and it is in disequilibrium with the present climate.
The long-range TLS is demonstrated to be an effective high-resolution measuring tool for glacier change study.Continuous high-precision measurements of the annual glacier change are crucial to project glacier future evolution more accurately.
Acknowledgments:
This study was supported by the National Natural Science Foundation of China (42001067);Natural Science Foundation of Gansu Province (21JR7RA05 9);National Cryosphere Desert Data Center(20D03);National Natural Science Foundation of China (41771077);the Strategic Priority Research Program of Chinese Academy of Sciences(XDA20020102);Second Tibetan Plateau Scientific Expedition and Research (STEP) program (2019QZKK0201);and State Key Laboratory of Cryospheric Science(SKLCS-ZZ-2021).
 Sciences in Cold and Arid Regions2021年6期
- Sciences in Cold and Arid Regions的其它文章
- Cryogenic wedges on the NE Qinghai-Tibet and Ordos Plateaus:Their characteristics,origin and OSL dating
- Editor-in-Chief Yuanming Lai
- Satellite-measured water vapor isotopologues across the Tianshan Mountains,central Asia
- Climate response and radial growth of Pinus tabulaeformis at different altitudes in Qilian Mountains
- Long-term effects of gravel-sand mulch thickness on soil microbes and enzyme activities in semi-arid Loess Plateau,Northwest China
- Seasonal variation of airborne fungi of the Tiantishan Grottoes and Western Xia Museum,Wuwei,China