
Research on colormatching method control based on RGB image color recognition
2020-12-23 05:16:02ChanTANGJuanYE
机床与液压 2020年18期
Chan TANG,Juan YE
(1 School of Computer Science&Engineering,Guangzhou Institute of Technology,Guangzhou 510540,China)
(2 School of Computer Science&Engineering,South China University of Technology,Guangzhou 510006,China)
Abstract:RGB images are images that are detected,represented and displayed in electronic systems.The color matchingmethod is to perform color recognition on the existing RGB image,record the captured color and generate a variety of colormatching schemes to apply to the appearance control of auxiliary objects.Based on the characteristics of RGB and HBS colormodes,this paper uses color recognition methods to collect the colors of electronic pictures.The collected color data generates different color schemes according to the color characteristics,matching principles and data extraction models to provide references for electronic system control.According to the experimental comparison effect and application data,using this colormatchingmethod to control the related objects in the electronic system,the objectquality and work efficiency can be significantly improved.Thismethod has certain practical value in the fields of industrial appearance control,electronic interactive control,virtual reality and game User Interface(UI).
Key words:RGBmode,HBSmode,color recognition,colormatching control
1 Preface
With the development of network technology,the demand for electronic control content continues to surge,and control forms have become complex and diverse.Industrial appearance,media interaction,virtual reality and games,Ul and other forms are currently relatively rapidly developing colormatching control forms.Electronic control is mostly composed of program control and appearance control.The appearance control is the production content involved in all electronic control fields.Appearance control includes graphics and colors.
The color matching method can play an auxiliary function in the appearance interaction design of industrial control equipment in industrial appearance control;special icons and dynamic effects inmedia interaction can be used to improve the ease of interaction;in virtual reality,three-dimensional object creation and During dynamic setting,color control can be used to simulate virtual effects;in games and Ul creation,various scenes and interfaces can be used for auxiliary operation control.
Colormatching iswidely used in electronic control,mainly used to enhance the visual effectof the appearance,enhance the beauty of the control content,and thus ensure the quality of the control object.
Due to the large demand for electronic control content,the complex control process,and the large number of controllers and high technical level requirements,a variety of control auxiliarymethodswith dif-ferent functions are required in the control process to improve control efficiency.At present,in the color matching control,the controller needs tomaster a certain color matching principle for independent matching.The colormatchingmethod is relatively cumbersome and the efficiency is not high.Therefore,there is an urgentneed for some quick and effectivemethods that can improve the efficiency of colormatching control and reduce the difficulty of control.
One of the effective ways to improve the efficiency of colormatching is tofind a reference colormatching image and perform matching control based on this image.The color space is essentially the specification of the coordinate system and subspace.When performing color image processing,which color space is used is very important.Using different color spaces for segmentation processingwill result in different results.In addition to the RGB space,there are also color spaces such as Hue-Intensity-Saturation(HIS),HBS.Generally,the color images obtained are mostly in RGB space,and the conventional processing of color images is also carried out in RGB space.Therefore,the images related to electronic control are mainly RGB images.The reference image can record and save the colormatching data based on the colormode through color recognition technology[1].
This papermainly extracts data based on the color mode of the colormatching reference image,builds a colormatching datamodel from the extracted data on the basis of the colormatching principle,and processes the data according to different datamodels and reformsmultiple colormatching schemes.To combined into a preview image to assist the controller in color matchingwork.In the research process,the process of image data extraction,the establishmentof colormatching data model and preview method will be described,and the process data will be compared and analyzed through application experiments.A series of studies have shown that the control quality and control efficiency can be significantly improved by using this colormatchingmethod for related control in the electronic system.
2 Color m odel featu res
The color space is essentially the specification of the coordinate system and subspace.When performing color image processing,which color space is used is very important.Using different color spaces for segmentation processingwill result in different results.In addition to RGB space,there are HIS,HBS,etc.in color space.
Generally,the color images obtained are mostly in RGB space,and the conventional processing of color images is also carried out in RGB space.Given anm×ncolor image,each pixel(x,y)is a three-dimensional vector:red(R),green(G),and blue(B)three vectors,which denoted as:f(x,y).That is,the image f is a vector field composed ofm×nvectors.In color images,the hue mostly changes in flaking areas,that is,the hue in a small range is approximately unchanged,and the dynamic range of the hue is narrow,while the dynamic range of the brightness is very large.Therefore,in the strong side light source the brightness change of the image below is much stronger than the hue change.Therefore,this paper uses RGB spatial color information as the research object,and the statistical change between color vectors as a measure for image processing[1].The physical location of the pixel is shown in Fig.1.
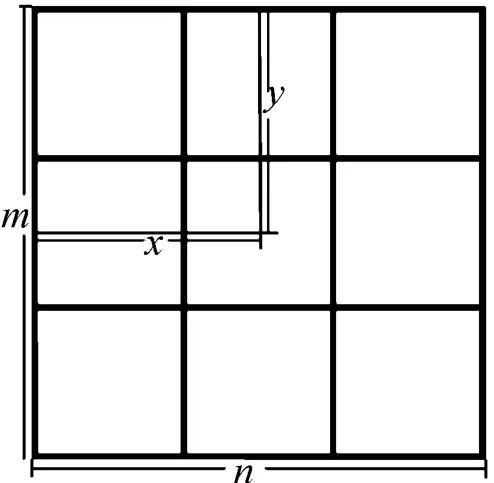
Fig.1 Schematic diagram of the physica I Iocation of p ixe Is
RGB is an additive colormodel,which is tomix different proportions of Red/Green/Blue to get a new color.Usually the RGB colormodel is expressed as:HSB(HSV)expresses colors through the three elements of hue/saturation/brightness.Although it is convenient to use RGB to represent colors,the RGB values of two similar colorsmay differ by tens of thousands of miles.Using HSV,is also called HSB,to express color is more in line with people’s habits[12].The data collected in RGB mode and HBS mode can be converted mutually through formulas.RGB is converted to HBS formula is shown in Fig.2,and the formula for converting HBS to RGB is shown in Fig.3.
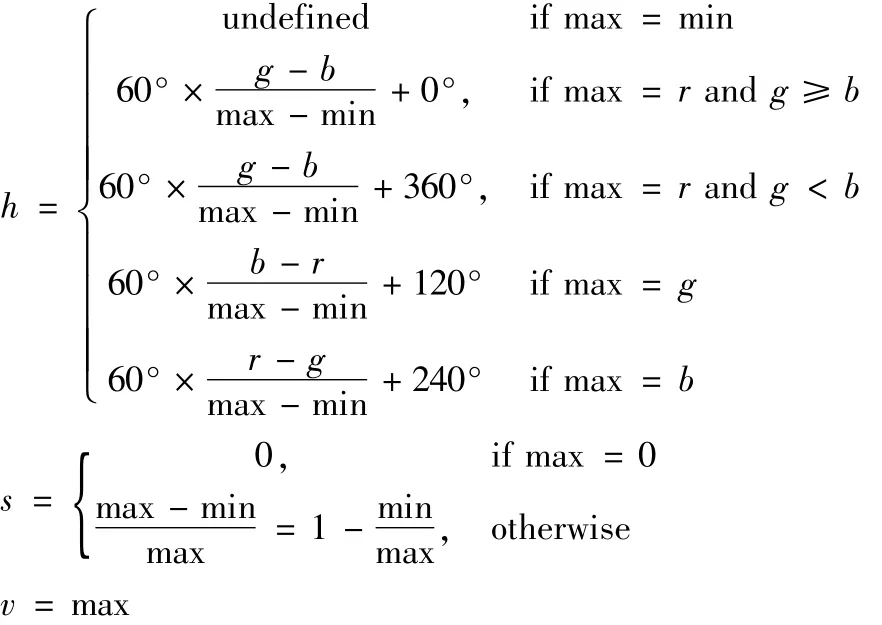
Fig.2 RGB converted to HBS mode formu Ia
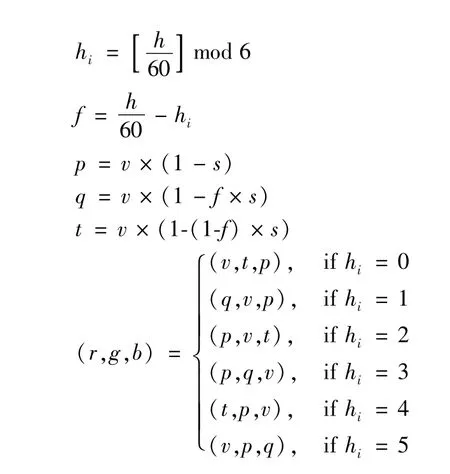
Fig.3 HBS converted to RGB mode formu Ia
3 Basic p rincip les of color m atching
Color includes three major elements,namely hue,lightness and purity.In modern control,the decoration and modernity of colors can be obtained through color transition.The types of color transition are divided into hue transition,brightness transition,purity transition,complementary transition and comprehensive transition.Hue transition is a gradual form of arranging colors from cold towarm or from warm to cold according to the sequence of the hue circle.The hue circle is shown in Fig.4.
Transition of lightness is a gradual form in which colors are arranged and combined according to the level of lightness.The change of lightness is shown in Fig.5.Purity transition is a form in which colors are arranged according to the arithmetic progression,from fresh to gray or from gray tofresh.The purity transition is shown in Fig.6.

Fig.4 Hue ring
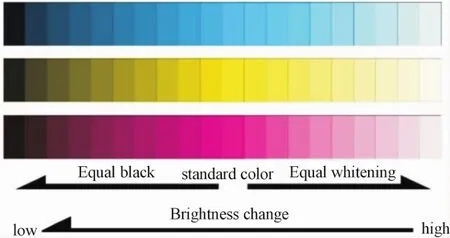
Fig.5 Brightness gradientm ap
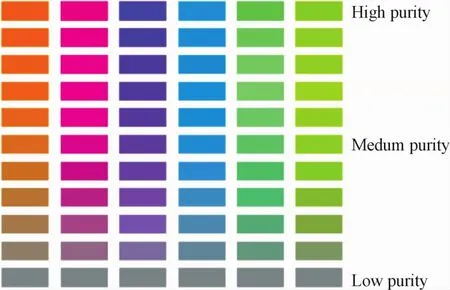
Fig.6 Purity gradientm ap
Complementary shift is a way of shifting two colors that are 180 degrees from each other in the color circle,as shown in Fig.7.Comprehensive transition is the process of comprehensively arranging and shifting colors according to hue,brightness,and purity.Since the three elements of color are added to it,the color of the picture can be rich and full.
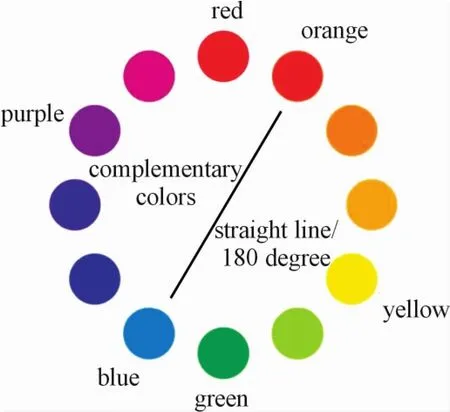
Fig.7 Com p Iementary co Ior transition diagram
In order to attract the attention of the audience in the plane control,the colormatching is often emphasized,and the colormatching effect is fully utilized to enhance the visual aesthetic experience.When performing color matching,you can follow the corresponding color matching principle to make the color matching effect more ideal.Commonly used color matching methods include hue color matching,approximate color matching,gradual color matching,contrast color matching,and single-point color matching[7].
4 Color recognition extraction and color m atching app lication p rocess analysis
The auxiliary control color matching method first scans the sampled image to extract three sets of RGB data,converts the RGB data into HBS data,collects all the pixels in the image and collects 6 sets of data related to the RBG and HBSmodes to organize the data according to the physical location of the pixels.Filter out themain color tone data at a certain data interval and arrange and save them.Then the data stored and arranged is extracted after data processing according to the colormatching datamodel.The data object is identified by the closed area number,and the extracted data is filled into the colormatching object image according to a certain rule.This filling process can form different colormatching effect previews from the data extracted based on different color matching data models,so that it can assist the color matching control work in the control process of the controller.The specific auxiliary control color matching process flowchart is shown in Fig.8.

Fig.8 Contro Ico Iormatching p rocess fIow chart
5 Color control sam p ling im age analysis
The auxiliary control color matching method based on RGB image color recognition first needs tofind an RGB image as the color data collection object.This method research uses Fig.9 as an example of RGB image data collection.Cut out squares with a size of 24×24 pixels from Fig.8 as the focal point for the study of the data acquisition process,as shown in Fig.10.Collect the RGB data of each pixelF(x,y).Wherex,yare the physical location of the pixel to record data.According to the rule that a pixel has only one group of RGB data,the RGB data can be collected in the order ofF(x,y)position.As shown in Fig.8,f(22.3,21.5)=(200,163,129)is to record pixels with horizontal axisx=22.3 and vertical axisy=21.5.The red R data is200,the green G data is163,and the blue B data is 129.The RGB data of each pixel of the image is collected and recorded in thisway.

Fig.9 Instance image
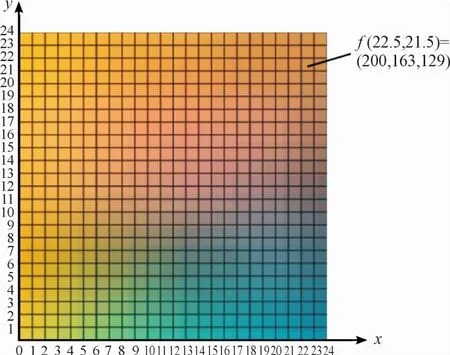
Fig.10 Data acquisition pixe Ib Iock
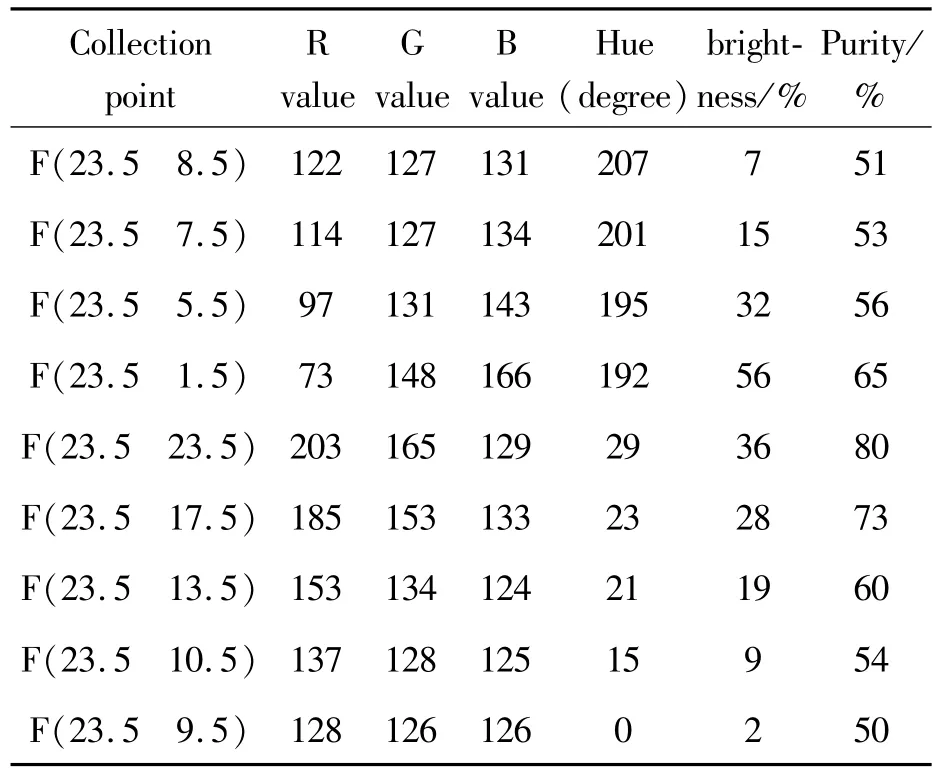
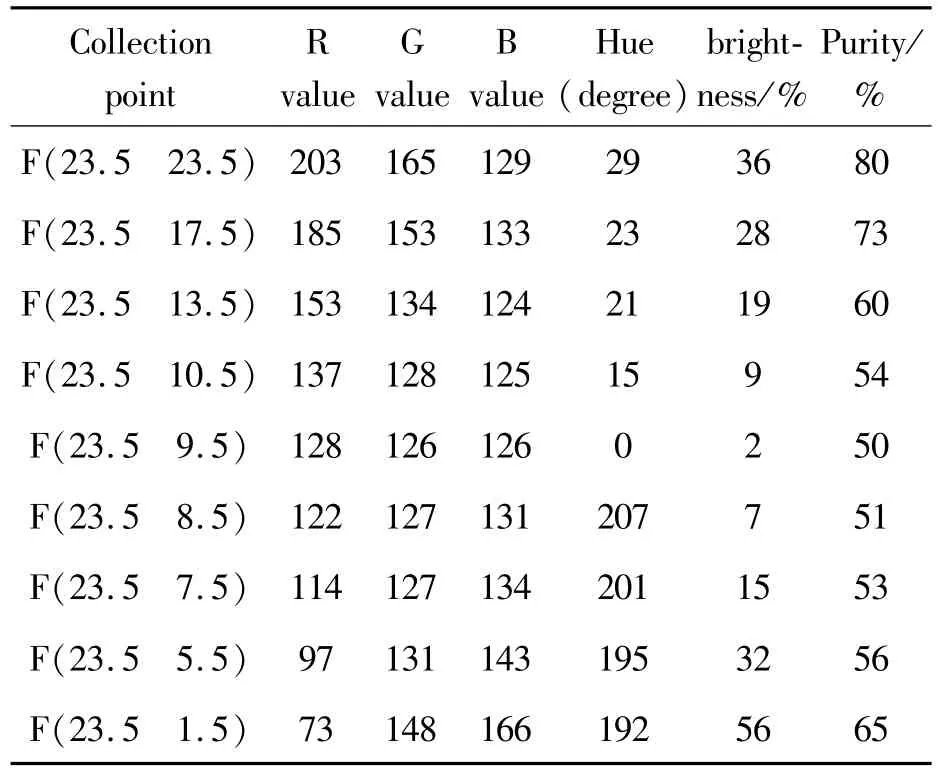
The specific data collectionmethod of sampled images is the data screening method.Data collection is scanned and collected from top to bottom from left to right on the pixel block.First,the physical position of the pixel is recorded,the RGB data of the corresponding pixel is extracted,and the RGB data is converted into the corresponding three data of hue,saturation and brightness.The six data of RGB,hue,saturation and brightness become the first batch of data to be extracted and saved for each pixel.The first batch of sampled data is relatively large,and the main color data of the image needs to be extracted after screening,eliminating the repeated color data.The specific data sampling and screening process is shown in Fig.11.The example pixel block data collection and screening is based on the first batch of data,and the main color data of the pixel points are extracted with the data difference of about10 pixels as the screening interval.The sample data screening results are shown in Table 1.

Fig.11 Schematic diagram of pixe I repeated co Ior rem ova I
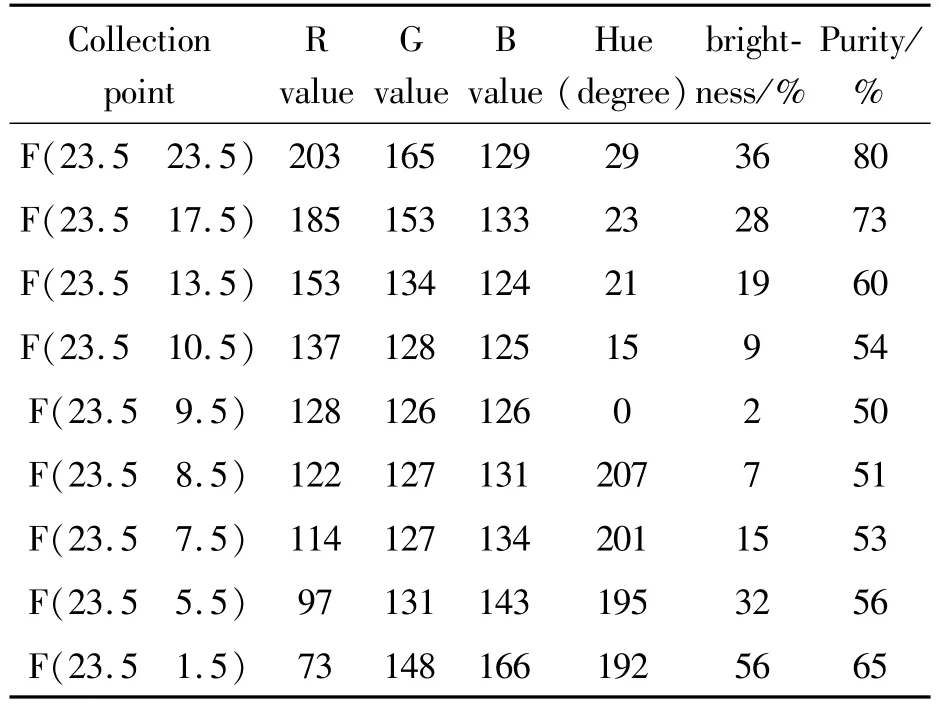
Tab Ie 1 Sam p Ie data sc reening resu It tab Ie
6 M u lti-m ode color matching p rocess analyses
Multi-mode color matching is based on the color matching principle to process the data extracted from the sample image and fill the color line draft.The basic colormatchingmethod creates the data processingmodel according tofive commonly used methods:hue colormatching,approximate colormatching,progressive colormatching,contrast colormatching,and single-point colormatching.
Color line draft images need to be closed area identification and sequence division.Before line draft recognition,the line draft needs to be scanned and the lines processed in black and white.The specific experimental colormatching line draft is shown in Fig.12.
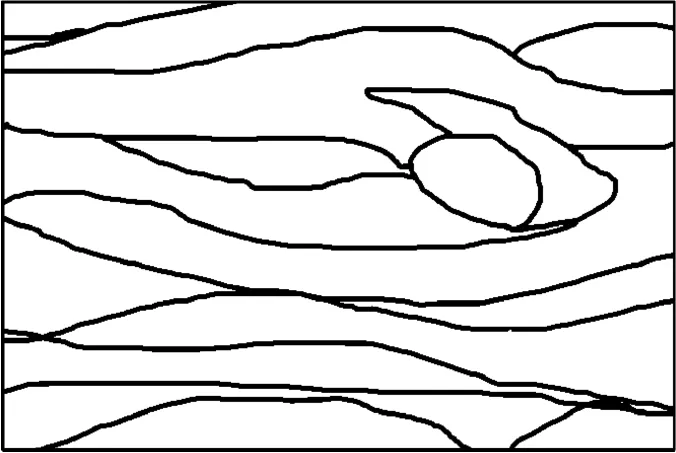
Fig.12 Co Io r exam p Ie Iine d raft
The color matching data needs to be scanned from top to bottom from left to right in the closed area before filling in the line draft.The scanning sequence should bemarked with a serial number in the filled area of the closed black and white line draft tofacilitate the filling sequence scanning.The specific experiment color line draft scan serial number mark is shown in Fig.13.
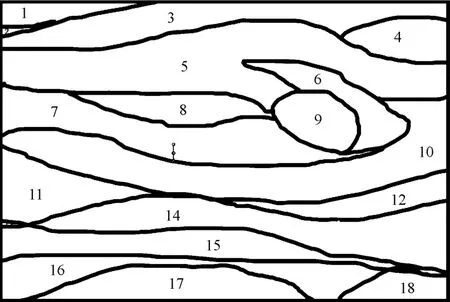
Fig.13 Co Ior Iine d raft scan seria Inum berm ark map
6.1 Hue colormatching mode colormatching method
Hue color matching mainly refers to matching certain properties,such as colorswith the same cold and warm tone,and the same brightness,and the hue is as complete as possible,and at least three hues are required.For example,red,blue and yellow with the same brightness can be matched together to achieve the ideal visual effect[7].
The sample data needs to be selected and processed before the colormatching and filling of the line draft.The final extracted data needs to complete the three sets of hue,lightness and purity before the closed area of the line draft can be filled.The main process of this colormatching mode is tofirst obtain the sample reference image data.If the colormatching result target is close to the warm color tone,then the original warm color tone sample data will be extracted when the hue data is extracted;the lightness data is randomly extracted between 0-100.The extraction is divided into intervals and divided into groups.The first layer is divided into1 group of interval50,the second layer is divided into 2 groups of interval 10,and the third layer is divided into n groups of interval 1.The random data extraction logic diagram is shown in Fig.14;the purity data extraction is based on sample data Extract the original data corresponding to the hue and lightness data that have been extracted according to the colormatchingmode.If the colormatching result target is close to the cool color tone,then the hue selection willmainly extract the original data of the cool color tone sample,and the extraction of lightness and purity data is the same as the extraction ofwarm color tone data.When the hue,lightness,and purity data are extracted,they will be filled in the ordermarked in the closed area.The specific colormatching mode logic diagram is shown in Fig.15.

Fig.14 Hue co Ior m atching m ode Iightness data random extraction Iogic diagram
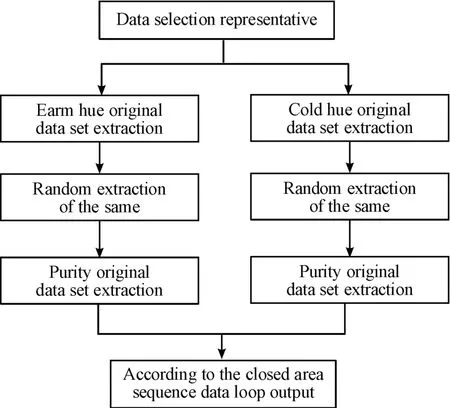
Fig.15 Tone co Iormatching mode Iogic diagram
6.2 Approximate colormatching mode colormatching method
Approximate colormatchingmainly refers to the selection of adjacent or close hues for matching.Since this colormatchingmethod contains the same color among the three primary colors,the matching will be more harmonious.Since the different hues are very close,the stability is also better.You can also use a single hue to match the same color,such as purple with green,green with orange,and orangewith green.
The sample data needs to be selected and processed before the colormatching and filling of the line draft.The final extracted data needs to complete the three sets of hue,lightness and purity before the closed area of the line draft can be filled.The main process of this colormatchingmode is tofirst obtain sample reference image data,and then randomly select a single set of data from the reference data,and obtain data with similar hue from a single selected data set through the hue circle theory.The specific hue is randomly selected in pairs.The figure is shown in Fig.16.The extraction of brightness and purity data is based on the extraction of random pairs of similar hue data to retain the corresponding original data.When the hue,lightness,and purity data are extracted,they will be filled in the ordermarked in the closed area.The specific color matching mode logic diagram is shown in Fig.17.

Fig.16 App roxim ate co Ior matching mode Iightness data random extraction Iogic diagram

Fig.17 App roxim ate co Ior scheme Iogic diagram
6.3 Progressive colormatching mode colormatching method
Progressive colormatching is arranged in order from the highest to the bottom according to the degree of the threemajor elements of hue,lightness and purity.The main feature of progressive colormatching is that the color tone is stable and eye-catching;especially the progressive colormatchingmethod of hue and lightness is very attractive.The rainbow in nature is a progressive color scheme.
The sample data needs to be selected and processed before the colormatching and filling of the line draft.The final extracted data needs to complete the three sets of hue,lightness and purity before the closed area of the line draft can be filled.The main process of this colormatchingmode is tofirst obtain sample reference image data,and then divide it into two groups:hue gradient colormatching and lightness progressive color matching.Hue progressive color matching first extracts the hue progressive data group from high to low,and lightness progressive colormatching extracts data from high to low in 10 intervals.The specific advance logic is shown in Fig.18.Other data will be extracted after progressive random data,and the corresponding sample data will retain the corresponding original data.When the hue,lightness,and purity data are extracted,they will be filled in the order marked in the closed area.The specific colormatching mode logic diagram is shown in Fig.19.
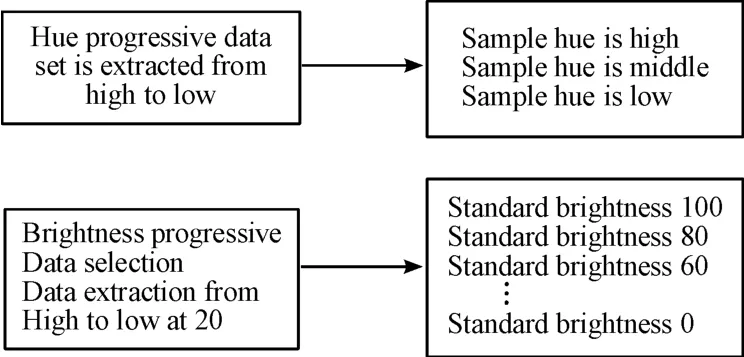
Fig.18 Progressive co Ior matching mode Hue and brightness data are random Iy extracted from Iogic diagram s
6.4 Contrast colormatching mode colormatching method
Contrast color matching uses the contrast of hue,brightness and purity to match,with a distinct sense of strength and weakness.Among them,colors with higher brightness will give people a bright and clear visual experience.It can even be said that as long as there is a contrast in brightness,the color matching effectwill not be too bad.

Fig.19 Logic diagram of progressive co Iormatching mode
The sample data needs to be selected and processed before the colormatching and filling of the line draft.The final extracted data needs to complete the three sets of hue,lightness and purity before the closed area of the line draft can be filled.The main process of this colormatchingmode is tofirst obtain the sample reference image data,and then divide it into three groups of color contrast colormatching,lightness contrast color matching and purity contrast color matching.The color contrast data extraction is based on the main color data of the sample,and the corresponding contrast hue data is found based on the hue data principle and extracted together with the original data set;the purity and contrast color data extraction is based on themain color data of the sample tofind out based on the purity data principle The corresponding contrast purity data is extracted together with the original data set;the lightness contrast color data extraction is based on themain color data of the sample according to the lightness data principle tofind the corresponding contrast lightness data and extract it together with the original data set,the specific contrast color data The group extraction logic is shown in Fig.20.After the contrast data group is extracted,the other two colormatching data directly extract the original data based on the sample data.When the hue,lightness,and purity data are extracted,they will be filled in the order marked in the closed area.The specific color matching mode logic diagram is shown in Fig.21.
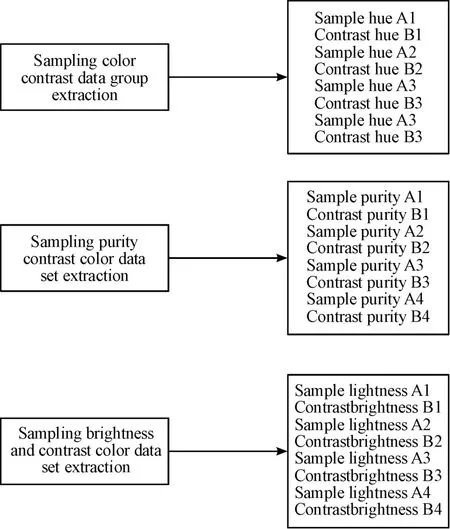
Fig.20 Con trast co Io r m atching m ode con trast data group extraction Iogic diagram
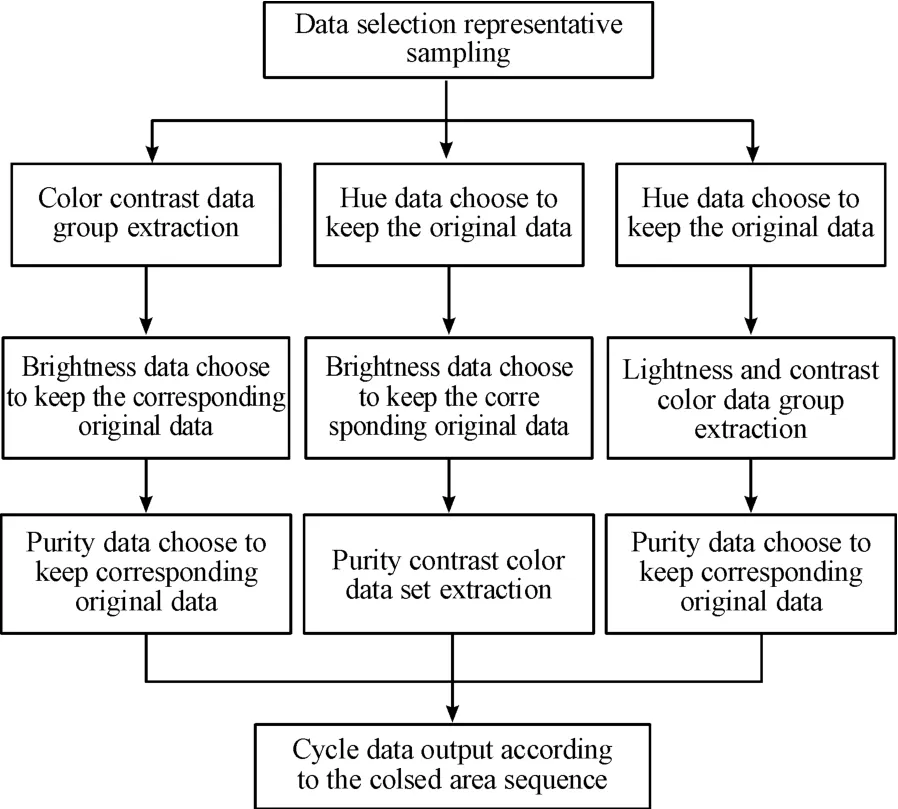
Fig.21 Con trast co Ior m atching Iogic d iag ram
6.5 Single-point colormatching method
The single-point colormatching allows the two colors toform a huge contrast in area.For example,use red to embellish large areas of green[7].Single-point colormatching is also a method and process of contrasting color recognition.
The sample data needs to be selected and processed before the colormatching and filling of the line draft.The final extracted data needs to complete the three sets of hue,lightness and purity before the closed area of the line draft can be filled.The main process of this colormatchingmode is tofirst obtain sample reference image data and randomly select a set of data.This set of data is a data set consisting of extracting single-tone hue data from the sample data and finding the corresponding contrast hue data according to the law of hue data.The specific random selection of data group and data contrast combination logic is shown in Fig.22.When the hue,lightness and purity data are extracted,the closed area will be identified according to the order of the closed area labeling,and filled according to the law.The specific colormatchingmode logic diagram is shown in Fig.23.
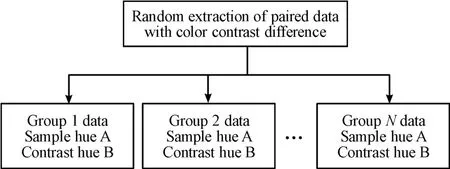
Fig.22 Logica Idiagram of sing Ie-pointm ode contrast data group extraction
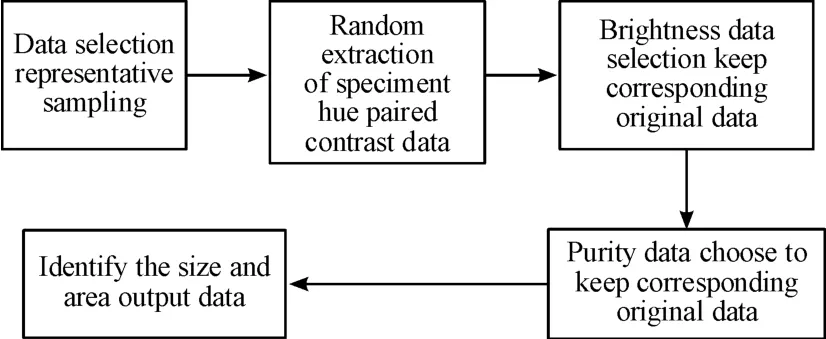
Fig.23 Sing Ie-point co Iorm atching Iogic diagram
7 Analysis of color m atching app lication experim ent resu lts
7.1 Application data analysis of color matching and application result display.
Hue color matching mainly refers to matching certain properties,such as colorswith the same cold and warm tone,and the same brightness,and the hue is as complete as possible,and at least three hues are required.According to the main hue data extracted from the experimental sample image,the hue color matching first classifies the hue number into the cold and warm hue.According to the law of local experimental data,the data of the warm color matching method is specifically the warm hue data group is 29/0/15/23/21,the brightness data interval(0-100)and the purity data group are 80/73/60/54/50;The data of the cold color matching method is specifically the cold hue data group 207/201/195/192,the lightness data interval(0-100)and purity(51/53/56/65),the specific data is shown in Table 2.

Tab Ie 2 Hue co Ior matching mode app Iication data ana Iysis tab Ie
The hue color matching data should be filled with cold and warm hue data groupings,the lightness is unified with 50 as the experimental effect data,and the purity data group is retained according to the original data corresponding to the hue data group.After specific application of the experimental data,the warm colormatching and filling effect diagram is shown in Fig.24,and the cold colormatching and filling effect diagram is shown in Fig.25.
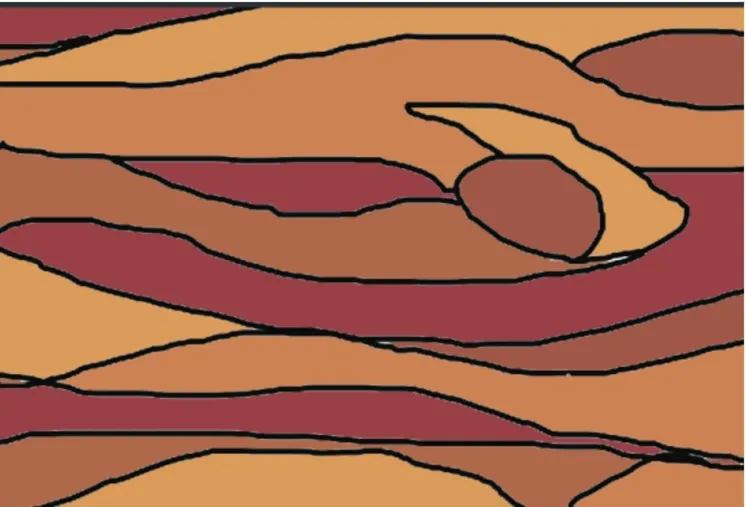
Fig.24 Co Io r m atching effec t d iag ram of w arm tone w ith Iightness of 50

Fig.25 Co Ior m atching effect diagram of coo I tone w ith a Iightness of 50
7.2 Approximate colormatching application data analysis and application result display.
Approximate color matching mainly refers to choosing adjacent or close hues formatching.According to the main hue data extracted from the experimental sample images,the approximate colormatching firstly extracts and groups the approximate hue data for the number of tones.According to the law of the local experimental data,after removing the redundant similar hue data sets,the experimental data will get a total of 3 sets of approximate color matching data.The first group of similar hue data group is23/21,the lightness data is28/19,and the purity data group is73/60;the second group of hue data group is207/201,the lightness data group is 7/15,and the purity data group is 51/53;The third group of hue data group is195/192,the lightness data group is32/56,and the purity data group is 56/65.The specific data is shown in Table 3.

Tab Ie 3 App roxim ate co Io rm atching m ode app Iication data ana Iysis tab Ie
Approximate color matching data should be filled with similar hue data groups.In terms of sample data,the hue data group is selected as the anchor point,and the lightness and purity data retain the original data corresponding to the sample data according to the hue data group selection.After specific application of the experimental data,the first group of similar hue data sets is 23/21,the lightness data is 28/19,and the purity data set is73/60.The colormatching effect is shown in Fig.26;the second group of hue data sets is 207/201,the lightness The data set is 7/15,and the purity data set is51/53.The colormatching effect is shown in Fig.27.The third group of hue data group is 195/192,the lightness data group is 32/56,and the purity data group is 56/65.The color matching effect is shown in Fig.28.
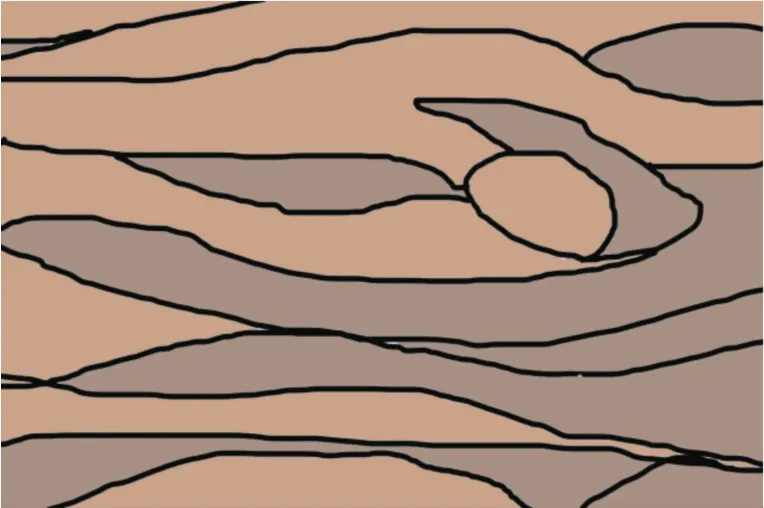
Fig.26 Hue 23/21 data set co Iormatching effect diagram
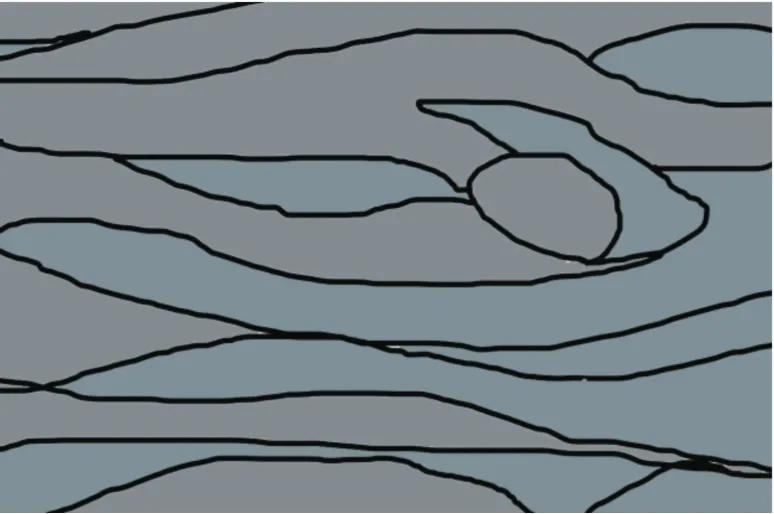
Fig.27 Hue 207/201 data set co Iorm atching effect d iag ram
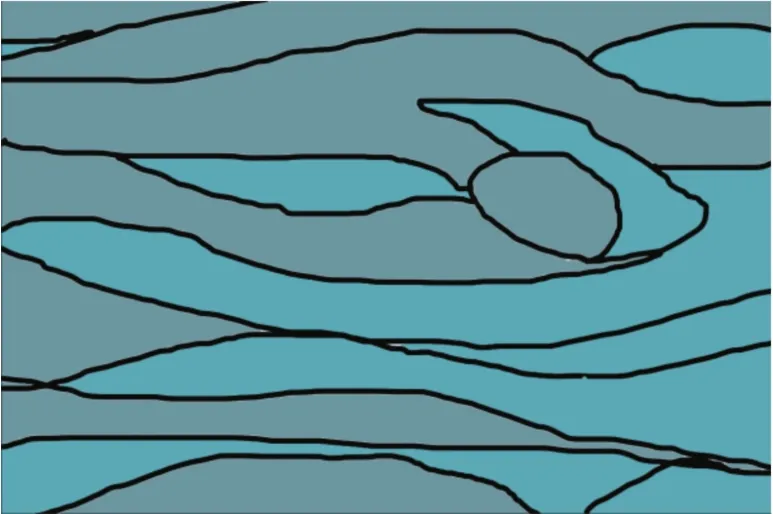
Fig.28 Hue 195/192 data set co Iorm atching effect diagram
7.3 Data analysis and application results display of progressive colormatching applications
Progressive colormatching is arranged in order from the highest to the bottom according to the degree of the threemajor elements of hue,lightness and purity.According to themain hue data extracted from the experimental sample image,the progressive colormatching only needs to extract the hue and lightness progressively.First,the hue data is extracted,and themain hue data group is extracted.The hue gradient data is extracted according to the level of the hue data.The data is filled with line drafts.The lightness gradient colormatching data uses each extracted hue data as the tracing point.The lightness data is arranged in order of high and low,and the purity sample is filled with the original data.The experimental data extracts the hue data group of gradient color matching as 0/29/192,and the specific data is shown in Table 4.
Tab Ie 4 Progressive co Iorm atching mode app Iication data ana Iysis tab Ie
According to the law of local experimental data,after removing the redundant hue and hue data sets,the experimental data obtains a total of 4 sets of color matching data.After the specific application of the experimental data,the first set is the hue gradual color matching according to the order of high and low.The hue data set is0/29/192,the lightness data is unified to 50,and the purity data group is unified to 50.The colormatching effect is shown in Fig.29;the second group of lightness gradient color matching data group has hue data of 0,the lightness gradient interval 20 interval is 0-100,and the purity data group is unified as The 50 color matching effect is shown in Fig.30;the hue data of the third group of lightness gradient colormatching data group is29,the lightness gradient interval 20 is 0-100,and the purity data group is unified to 50 color matching effect as shown in Fig.31.The hue data of the fourth group of lightness gradient colormatching data group is 192,the lightness gradient interval 20 is 0-100,and the purity data group is unified as 50.The color matching effect is shown in Fig.32.
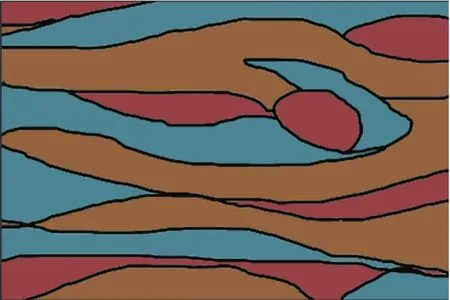
Fig.29 Hue gradient co Iorm atching effect diagram
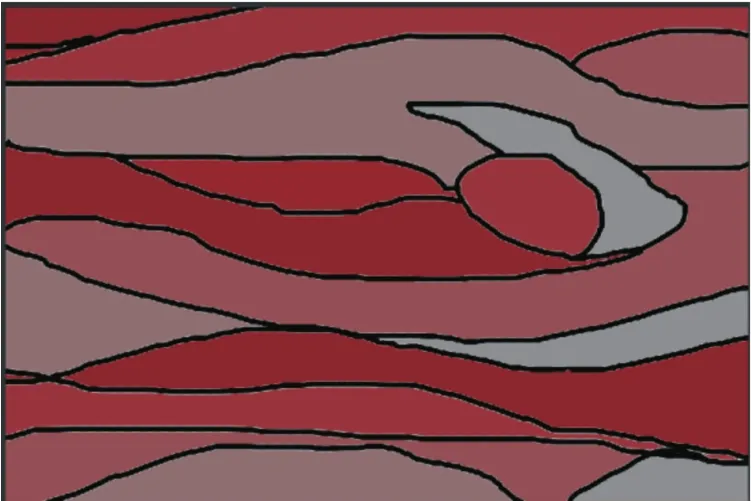
Fig.30 Hue is 0 Iightness gradient co Ior matching effect d iagram
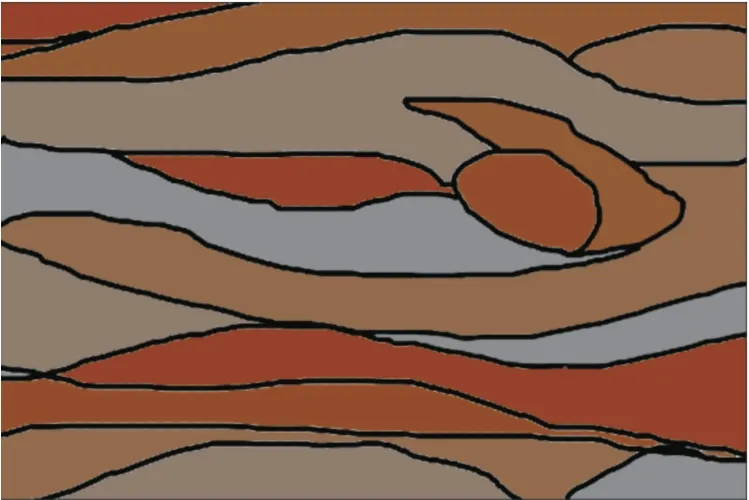
Fig.31 Hue is 29 brightness gradient co Ior effect diagram
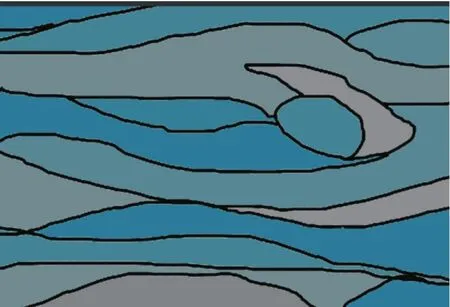
Fig.32 Hue is 192 Iigh tness grad ien t co Io r effec t d iagram
7.4 Comparative colormatching application data analysis and application result display
Contrast colormatching extracts contrast colormatching and the color ismore multi-level.According to the main hue data extracted from the experimental sample image,the contrast color matching needs to calculate and extract the contrast data of hue,brightness and purity.First,calculate the contrast based on the hue data set 29/15/0/195 according to the contrast law of hue 120 degrees After data 149/135/120/315,the brightness and purity data retain the corresponding original data of the sample;based on the brightness data set 36/9/2/32,calculate the contrast according to the brightness data 50 as the midpoint law,and get the contrast data set 64/91 in time 98/68,and the purity data to retain the original sample data;based on the purity data set 80/54/50/56,calculate the contrast according to the purity data 50 as themidpoint rule,and get the contrast data set 20/46/50/44 in time,Keep the original sample data corresponding to the purity data.The specific data of the contrast colormatching is shown in Table 5.
Tab Ie 5 Contrast co Iorm atching m ode app Iication data ana Iysis tab Ie
According to the law of local experimental data,after removing the redundant hue data set,the experimental data will get a total of 4 sets of colormatching data.After the specific application of the experimental data,the specific data of the first setof color ratio colormatching data set is:hue data 149/135/120/315,The brightness data group 36/9/2/32,the purity data group 80/54/50/56,the color matching effect is shown in Fig.33;the specific data of the second group of lightness comparison colormatching data group is:hue data group 29/15/0/195,brightness data group 64/91/98/68,purity data group 80/54/50/56,the colormatching effect is shown in Fig.34;the specific data of the third group of purity comparison color matching data group is:hue data group 29/15/0/195,brightness data group 36/9/2/32,purity data group 20/46/50/44,The color matching effect is shown in Fig.35.
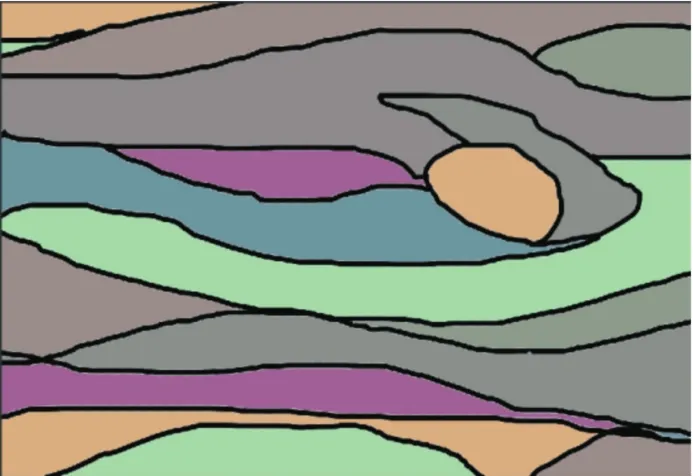
Fig.33 Co Ior contrast effect diagram
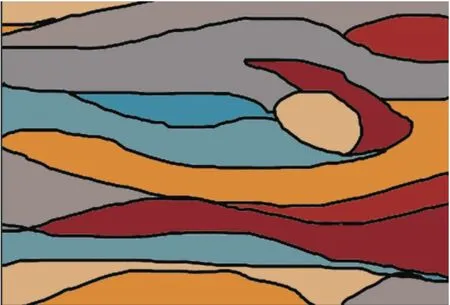
Fig.34 Brightness con trast co Io r m atching effec t chart
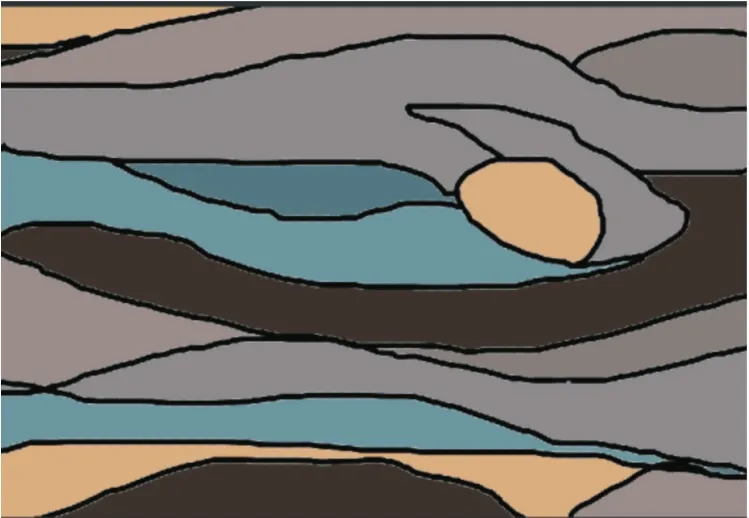
Fig.35 Purity contrast co Iorm atching effect diagram
7.5 Data analysisof single key colormatching application and display of application results
According to the main hue data extracted from the experimental sample image,the contrast color matching needs to calculate and extract the color contrast data.First,calculate the contrast data group 149/based on the hue data group 29/15/0/195 according to the hue 120-degree contrast law 135/120/315,the lightness and purity data retain the corresponding original sample data;select a group from each pair of original hue data and color contrast data for contrast colormatching.When colormatching,the area of the closed area of the application object needs to be extracted tofill the colormatching.
Single-point color matching extracts large-area colors and small-area colors for colormatching.According to the law of the local experimental data,after removing the redundant hue data sets,the experimental data obtains a total of 4 sets of colormatching data.There are two ways tofill each set of color matching data according to the closed area of the line draft.After specific application of experimental data,the first group of hue data group 29/149,lightness data 36,purity data 80,colormatching effect is shown in Fig.36;the second group of hue data group 15/135,lightness data 9,purity data group 54,The colormatching effect is shown in Fig.37;the third group of hue data group 0/120,lightness data 2,purity data 50,color matching effect is shown in Fig.38,the fourth group of hue data group 195/315,lightness data 32,purity data 56.The color matching effect is shown in Fig.39.
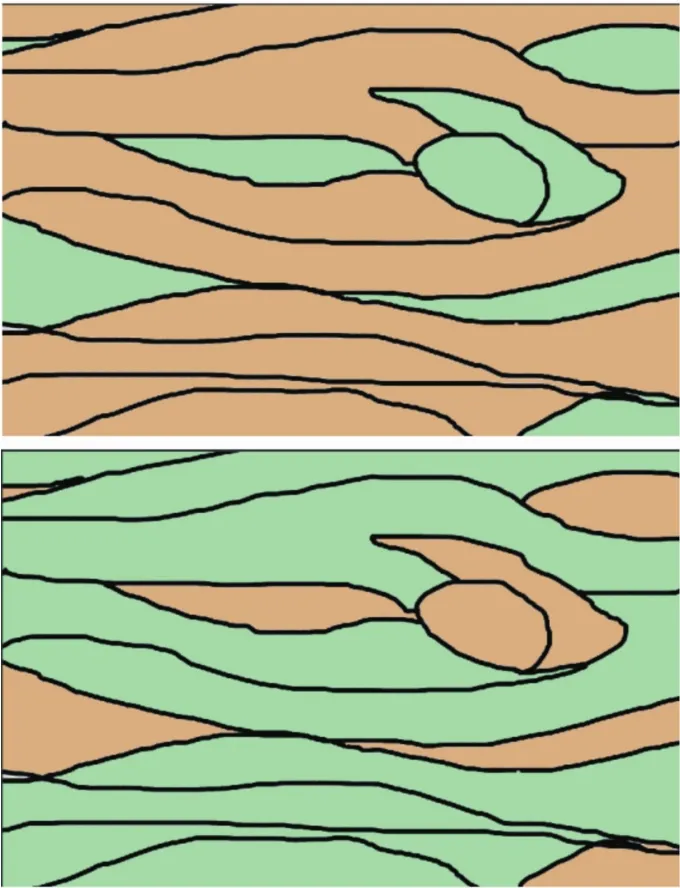
Fig.36 29/149 Hue sing Ie key co Iorm atching effect d iag ram
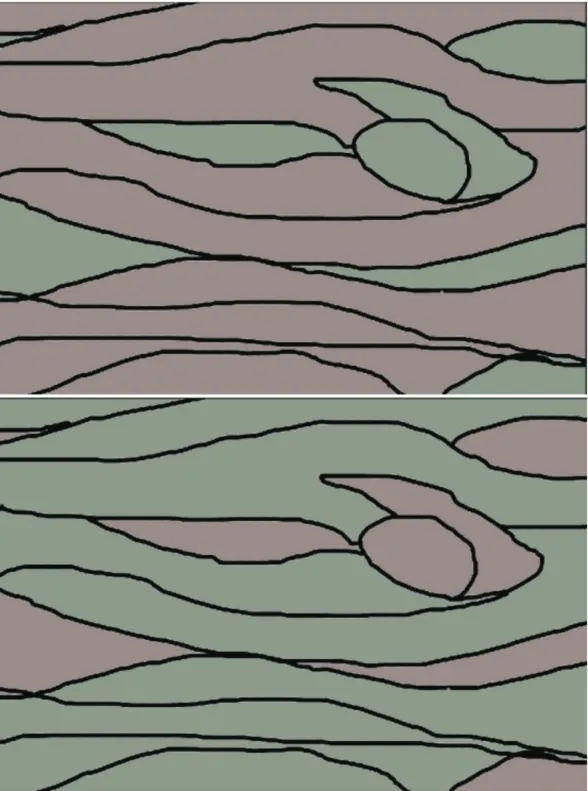
Fig.37 15/135 Hue sing Ie-point co I-o r m atching renderings
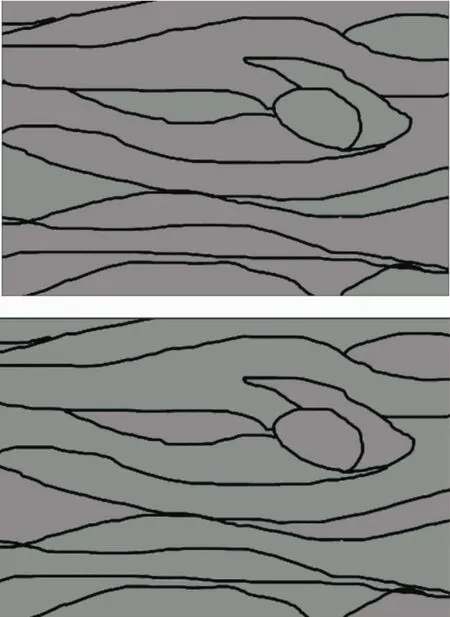
Fig.38 0/120 Hue sing Ie key co Ior m atching effect d iag ram

Fig.39 195/315 Hue Sing Ie Point Co Ior Matching Effect Picture
8 Conclusion
This papermainly extracts data based on the color mode of the colormatching reference image,builds a colormatching datamodel from the extracted data on the basis of the colormatching principle,and processes the data according to different datamodels and reformsmultiple color matching schemes.To combined into a preview image to assist the controller in color matchingwork.In the research process,the process of image data extraction,the establishmentof colormatching data model and color matching preview method will be described,and the process data will be compared and analyzed through application experiments.A series of studies have shown that the control quality and control efficiency can be significantly improved by using this colormatchingmethod for related control in the electronic system.
With the development of network technology,electronic control content and control forms have become complex and diverse.Colormatching iswidely used in electronic control,mainly used to enhance the visual effect of the control appearance,enhance the beauty of the control content,and thus ensure the control quality.According to the experimental comparison effect and apply data analysis,using this colormatchingmethod to carry out related control in the electronic system,the control quality and control efficiency can be significantly improved.
This method can play an auxiliary function in the appearance interaction design of industrial control equipment in industrial appearance control;special icons and dynamic effects in media interaction can be used to improve the ease of interaction;in virtual reality,three-dimensional object creation and During dynamic setting,color control can be used to simulate virtual effects;in games and Ul creation,various scenes and interfaces can be used for auxiliary operation control.In summary,the colormatchingmethod control research has certain practical value in the above fields.

- 机床与液压的其它文章
- Study on Face detection method based on lightweight convolutional neural network
- Application of genetic optim ization lvq neural network in equipment fault diagnosis system
- Research on sliding mode control of manipulator based on RBF neural network optim ized by bionic swarm intelligence
- Research on bearing fault diagnosis technology based on deep convolution neural network
- Research on the application of improved machine learning collaborative recommendation algorithm in intelligent control
- Design of liquid filling machine positioning system based on RBFneural network activedisturbance rejection controller