
Fault prediction research based on internal leakage fault in hydraulic motor
2020-12-23 05:15:58QiushiTIANPengZHAO
机床与液压 2020年18期
Qiu-shi TIAN,Peng ZHAO
(Civil Aviation Flight University of China,Guanghan 618307,China)
Abstract:To study the internal leakage of the hydraulicmotor and monitor the state of the hydraulicmotor.The fault data of the leakage in the hydraulicmotor is obtained by establishing a simulation leakage fault test platform.A fault predictionmodel based on T-S fuzzy neural network is established in MATLAB,and the experimental data is used for the training of themodel and verify the prediction results.After analyzing the prediction results,the influence of different number of samples in model prediction on the accuracy of fault prediction is discussed.Where the data fluctuates greatly during the analysis,the relative error is large.After the study,itwas found that by fitting the experimental data,using the samemodel for training and prediction,the difference between the accuracy of the prediction model and the pre-fit difference of different numbers of samples after fitting was discussed.The results show thatalthough the larger the number of data trained by themodel,the higher the accuracy of the prediction,but only a small amount of data is used formodeling after the data is fitted,the prediction can achieve higher precision.It provides a reference for fault analysis of small data samples.
Key words:Hydraulicmotor,Fuzzy neural network,Fault prediction,Data fitting
1 Introduction
Hydraulic actuator in the hydraulic system is a component that does work to the external environment.The hydraulic motor with rotary motion type converts the hydraulic pressure energy which provided by the hydraulic pump into the mechanical energy(torque and speed)of the output shaft,and realizes the rotary motion and drives the load.Mechanical loss and volume loss of the hydraulic system exists in the process of energy conversion of the actuator.The volume loss is caused by the internal leakage of the hydraulicmotor[1].The internal leakage is not easily detected,and it has a significant impact on the efficiency of the hydraulic system.Therefore,it’s important significance to engineering that how to effectively monitor the internal leakage of the hydraulic motor and effectively extract the characteristic signals of the oil system in advance to avoid malfunctions.
In the actualworks,historical data of hydraulic parameters,such asmotor pressure and flow,are used to predict the future state of the hydraulicmotor.
2 Fau lt p rediction based on fuzzy neural network
Fuzzy neural network(FNN)is a new technology developed by absorbing the advantages of fuzzy theory and neural network technology[2].It combines the strong knowledge expression ability of fuzzy logic reasoning and the strong self-learning ability of neural network,and gets the core ability of fuzzy neural network[3].It has the computational capability and lowlevel learning capability of the neural network,aswell as the inferential capability and high-level reasoning capability of the fuzzy system[4],and fuses the approximation ability of neural network to realize the function of fuzzy system.It gathers the advantages of neural network and fuzzy theory,and integrates learning,association,optimization,recognition and processing of fuzzy information in one[5].
2.1 T-S fuzzymodel
The T-Smodel is composed of non-linear mapping of neural networks and rational knowledge reasoning of fuzzy logic.There are two types of the T-Smodel:dynamicmodel and staticmodel.The staticmodel has a large amount of calculation,and the process ofmodeling and application ismore complicated.Therefore,in the research,the dynamic T-S fuzzy model is studied more deeply.
The rule form of the T-S fuzzy system is“if-then”.If the system is and the rule is,then the system rules can be inferred as follows[6]:
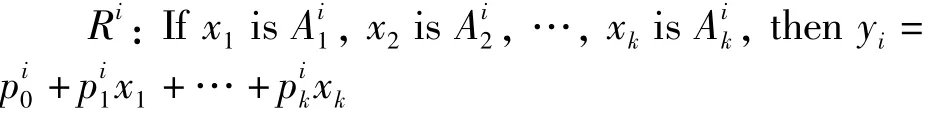
Where(i=1,2,…,k)is the parameter in the system;yiis the outputobtained by combining the system with the rules.It can be seen from the regular formula that a fuzzy part(that is the part‘if’)is input,buta certain part(the‘then’part)can be obtained.The input and output are linear combination relationships which is one-to-one correspondence.
Assuming the input amount isx=[x1,x2,…,xk],the degree ofmembership of each input variablexjcan be firstly calculated through the rules:
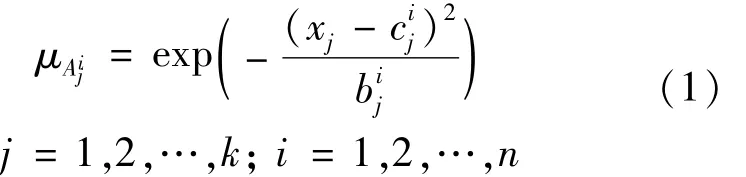
In the Equation.1,,is respectively the center and width of themembership function;kis the number of input parameters;nis the number of fuzzy subsets[7].
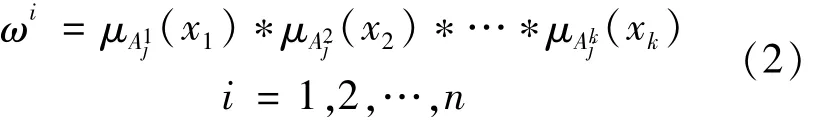
Then calculate the membership functions through fuzzification,andmultiply the fuzzy operators,and then use themultiplied operators as the fuzzy operators:
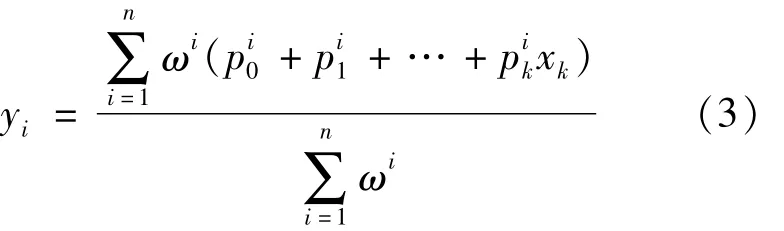
Finally,by fuzzifying the results and calculating the output value of themodel:
2.2 T-S fuzzy neural network operation process
The T-S fuzzy neural network consists of four layers,namely the input layer,the fuzzification layer,the fuzzy rule calculation layer and the output layer.The input vectors with the same dimensions are connected to the input layer,and the input value are blurred at the fuzzification layer through the membership function(Equation.1)to obtain the blurred membership value,and then through the fuzzymultiplication formula(Equation.2),the fuzzy trajectory calculation is performed to obtain the continuousmultiplication operator.Finally,the result of the fuzzy calculation is obtained by the formula(Equation.3)[8].Through T-S fuzzy neural network operation process,fuzzy neural network is realized.
2.3 Failure prediction
The composition of the hydraulic test platform mainly includes electricmotors,plunger pumps,hydraulic motors,magnetic powder brakes,pressure sensors,flow sensors,data acquisition systems,etc.The schematic diagrams and physical test platforms are shown in Fig.1 and Fig.2.
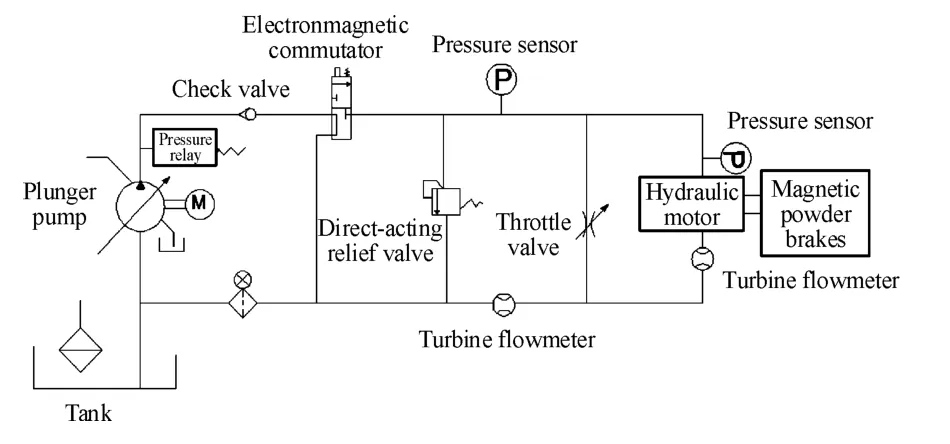
Fig.1 Schem atic diagram of test p Iatform for interna I Ieakage fau It in hyd rau Iic motor

Fig.2 Test p Iatform diagram for internaI Ieakage fau It in hydrau Iic m otor
This experimental platform uses a parallel throttle valve at themotor inlet and outlet to simulate leakage in the hydraulic motor.During the experiment,the leakage degree of the hydraulic motor was simulated by adjusting the opening of the throttle valve[9-10].Increase the throttle valve opening degree from 0 degree to 1 430 degree(by 10 degrees each time)with the self-made throttle valve opening dial.After increasing to 1 440 degrees,there is no significant change of the flow rate and press in the pipeline and the hydraulic motor already cannot drive the load to rotate,so the total of 144 groups data were collected in this experiment.This articlemainly chooses to analyze the inlet pressure of the hydraulicmotor.
This article uses different numbers of samples to establish fault prediction model and train the model,then discusses the relationship between prediction accuracy and the amount of data used for training.First of all,among the total 144 data(from 0 degree to 1 430 degree),with 1 310 degrees as the fixed point,the first50,60,70,… first130 data(14 data is used to compare)of 1310 degrees are used to build a fault predictionmodel and train it.Then,use the prediction model to predict the last14 data,and compare and verify the original experimental datawith the prediction result,and analyze and get the prediction error[11],each combination is named 50-14 combination,60-14 combination,70-14 combination,80-14 combination,90-14 combination,100-14 combination,110-14 combination,120-14 combination.
3 Analysis of p rediction resu lts
After using the experimental data to build a fault prediction model and train on the MATLAB,the predicted data can be obtained.Then compare the predicted data with the actual experimental data(14 data).After using the first 130 sets of data for model training,a comparison chart of experimental data and model training as shown in Fig.3 can be obtained.An analysis of Fig.3 shows that the pearson correlation coefficient between the training data and the actual data of themodel is 0.999 45,and the correlation between the model and the actual test data is extremely strong.
By using the trained model to predict the last 14 sets data,a comparison chart between the predicted data and the actual data as shown in Fig.4 and a relative error chart between the predicted data and the actual data as shown in the picture.Analysis the Fig.4 and the Fig.5 shows that as the number of predictions increases,the prediction error gradually increases,and where the data fluctuates,the relative error will also increase relatively,and themaximum value of the relative error is 0.376%,The average relative error MRE(Mean Relative Error)is 0.295%.
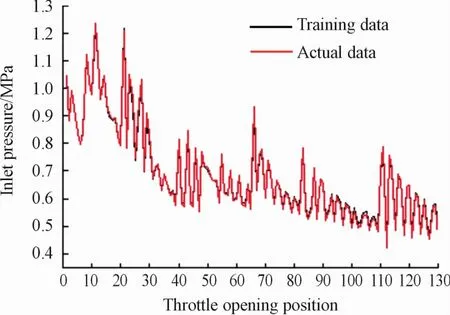
Fig.3 Mode Itraining diagram
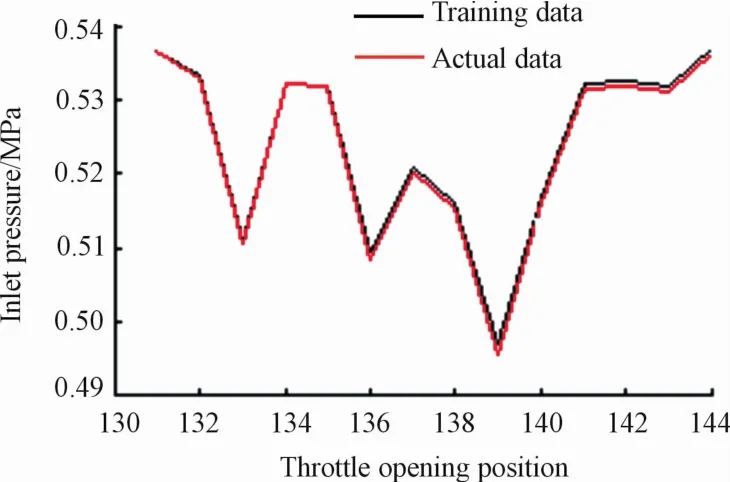
Fig.4 Forecast resu It diagram

Fig.5 Predicted re Iative error diagram
In the sameway,respectively predicts and analyzes the import stress data of 50-14 combination,60-14 combination,70-14 combination,80-14 combination,90-14 combination,100-14 combination,110-14 combination,120-14 combination.Table 1 is a summary table of the impact with different numbers of samples on the prediction accuracy of the prediction model.

Tab Ie 1 Predicted average re Iative error of each com bination data
By comparing Table 1,it can be found that the more data used for model training,the smaller the MRE of the prediction data,the more accurate and accurate the prediction.And when using 130 data for model training,the model accuracy improvement rate has not increased significantly.It can be seen that120 data used formodel training hasmade themodel relatively perfect,and increasing the amount of data used formodel training will not improve the prediction accuracy.
4 Analysis of p rediction resu lts after data fitting
In the process of data analysis,it was found that data fluctuationswill have an impactonmodel training and prediction errors.The experimental data were fitted to the data using the least squares method in MATLAB[12].The fitted data is divided into 4 groups by the same grouping method,and performed modeling training with 4 groups separately,and the established model is used to predict the fitted data.
The fitting curve is shown in Fig.6,and the correlation coefficient of fitting degree is shown in Table 2.
Fig.6 The fitting curve diagram
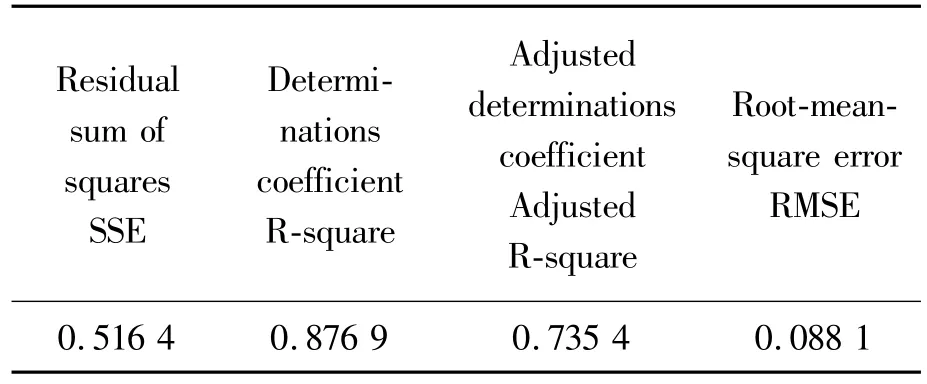
Tab Ie 2 The corre Iation coefficient of the fitting curve
First,the 130-14 combination with the smallest relative error before fitting is selected to obtain the effect of the fitted data on model training and prediction.If the prediction accuracy can be improved,then the other combined data is used to prediction after fitting,discusses the change of prediction error before and after fitting.
After using the fitted data for model training,a comparison chart of the fitted experimental data and model training data shown in Fig.7 below can be obtained.An analysis of Fig.7 shows that the Pearson correlation coefficient between the training data and the actual data of themodel is0.999 85,and the correlation between themodel and the actual experimental data iswell.
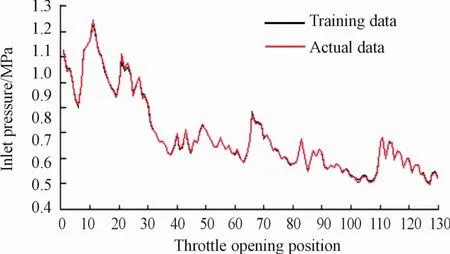
Fig.7 Fitting m odeI training diagram
By using the new model for prediction,a comparison chart between the predicted data and the actual data shown in Fig.8 and a relative error chart between the predicted data and the actual data shown in Fig.9 can be obtained.Compared with before,the MRE of the predicted data decreases,and the prediction accuracy improves.The maximum relative error is 0.335%,and the average relative error is 0.258%.
In the sameway,respectively predicts and analyzes the import stress data after fitting of 50-14 combination,60-14 combination,70-14 combination,80-14 combination,90-14 combination,100-14 combination,110-14 combination,120-14 combination.Table 3 is a summary table of the influence of different numbers of combined samples on the prediction accuracy of the prediction model after fitting.
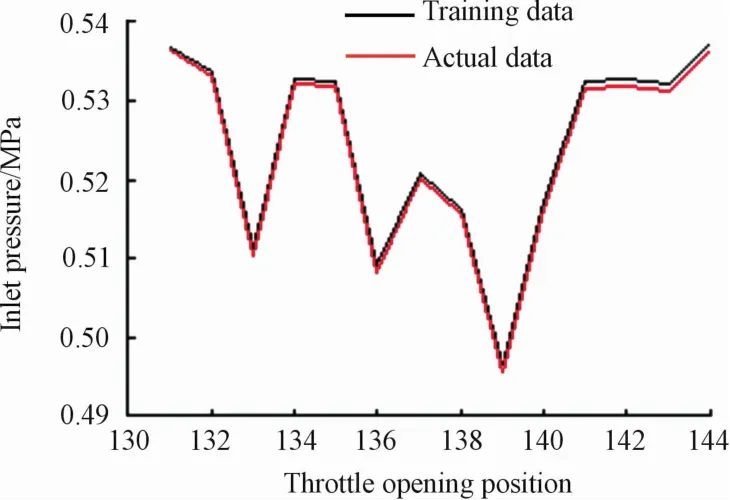
Fig.8 Fitting the p redicted resu Its diagram

Fig.9 Fitting the re Iative p rediction error diagram
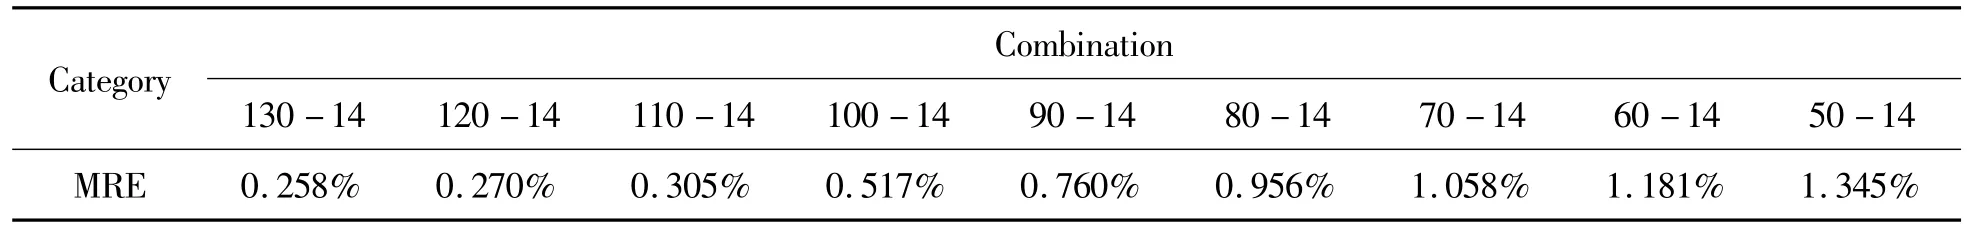
Tab Ie 3 Predicted average re Iative error of each group of data after fitting
For the fitted data,the accuracy of themodel is improved by at least 15%compared to before fitting.When using 120 data for model training,the model accuracy improvement rate has not increased significantly.It can be seen that 110 data used for model training hasmade themodel relatively perfect,and increases the amount of data used for model training which will not improve the prediction accuracy.Compared with before fitting,themodel can be relatively perfectwith 110 training data less than before(120 data before fitting),and the prediction accuracy reaches a relatively higher level.
5 Conclusions
Based on the research the internal leakage faults of hydraulicmotors,this paper establishes a fault prediction model with T-S fuzzy neural network,and uses the parameter ofmotor inlet pressure obtained in experiments formodel training and results verification.It is found from the results thatalthough the larger the amount of data formodel training,the higher the accuracy of themodel prediction,but for small sample data,fitting the data and choosing a suitable amount of modeling data,can make themodel reach a relatively perfect state.
Finally,after fitting the data and predicting,it’s found that the accuracy of themodelwas relatively improved before the fitting,and only 110 datawere used formodel training to make the model relatively perfect.For small sample data,a smaller number ofmodels can be used to achieve better prediction accuracy.

- 机床与液压的其它文章
- Study on Face detection method based on lightweight convolutional neural network
- Application of genetic optim ization lvq neural network in equipment fault diagnosis system
- Research on sliding mode control of manipulator based on RBF neural network optim ized by bionic swarm intelligence
- Research on bearing fault diagnosis technology based on deep convolution neural network
- Research on the application of improved machine learning collaborative recommendation algorithm in intelligent control
- Design of liquid filling machine positioning system based on RBFneural network activedisturbance rejection controller