Application of Machine Learning Methods in Arrival Time Picking of P Waves from Reservoir Earthquakes1
HU Jiupeng ,YU Ziye ,KUANG Wenhuan ,WANG Weitao ,RUAN Xiang and DAI Shigui
1) Key Laboratory of Earthquake Source Physics,Institute of Geophysics,China Earthquake Administration,Beijing 100081,China
2) The School of Earth Sciences and Engineering,Nanjing University,Nanjing 210023,China
3) State Key Laboratory of Geodesy and Earths Dynamics,Institute of Geodesy and Geophysics,Chinese Academy of Sciences,Wuhan 430077,China
4) Department of Geophysics,Stanford University,CA 94305,USA
5) Sichuan Earthquake Agency,Chengdu 610041,China
Reservoir earthquake characteristics such as small magnitude and large quantity may result in low monitoring efficiency when using traditional methods.However,methods based on deep learning can discriminate the seismic phases of small earthquakes in a reservoir and ensure rapid processing of arrival time picking.The present study establishes a deep learning network model combining a convolutional neural network(CNN) and recurrent neural network (RNN).The neural network training uses the waveforms of 60 000 small earthquakes within a magnitude range of 0.8-1.2 recorded by 73 stations near the Dagangshan Reservoir in Sichuan Province as well as the data of the manually picked P-wave arrival time.The neural network automatically picks the P-wave arrival time,providing a strong constraint for small earthquake positioning.The model is shown to achieve an accuracy rate of 90.7% in picking P waves of microseisms in the reservoir area,with a recall rate reaching 92.6%and an error rate lower than 2%.The results indicate that the relevant network structure has high accuracy for picking the P-wave arrival times of small earthquakes,thus providing new technical measures for subsequent microseismic monitoring in the reservoir area.
Key words:Deep Learning;Phase Pick;Reservoir Microseismic
INTRODUCTION
Seismic activities adjacent to a reservoir can provide important data for investigating reservoir projects and conducting safety assessment in the area.Load changes caused by reservoir impoundment increase the loading shear stress,and the increase in pore pressure induced by fluid infiltration also leads to reduced effective normal stress.These are the two main mechanisms that trigger reservoir earthquakes (Simpson D.W.et al.,1988).Recent studies indicate that fluids injected under high-pressure conditions can trigger remote earthquakes through aquifers (Grigoli F.et al.,2017).The monitoring station network of large-scale reservoirs can comprehensively record the seismic events occurring near the reservoir.Therefore,monitoring the seismic activity near reservoirs is an important part of safety monitoring in the reservoir area and is highly significant in the studies of fluid migration and activity patterns of earthquake swarms.
Earthquakes in a reservoir area are generally characterized by low magnitudes and large quantities.Efficient and accurate phase discrimination and arrival time picking are critical components in seismic activity investigation near a reservoir (Chen Hanlin et al.,2009).Unfortunately,the energy of microseisms in a reservoir area is relatively weak,and the signal-to-noise ratio in the waveform records is low,creating challenges in picking the arrival time of the seismic phases.Moreover,the increase of the density of seismic observations significantly increases the number of stations in the monitoring network near the reservoir.Therefore,how to efficiently and accurately identify the phases of numerous small earthquakes becomes another important issue that needs to be addressed in the development of reservoir seismic monitoring.
Traditional seismic phase discrimination relies mainly on manual techniques.However,the increase of available seismic data quantity and the demand for expediting the seismic phase picking speed have led to gradual replacement of manual methods by automated methods (Chen Jinhua et al.,2015).One of the most commonly used automated techniques is the Short Time Average over Long Time Average (STA/LTA) method based on the energy difference between seismic signals and noise (Allen R.V.,1978).On the basis of this method,Bai Chaoying et al (2000) propose an approach using the polarization information of a three-component waveform.Recently,Lomax A.et al.(2012) establish a more simplified seismic phase picking model to improve the accuracy and stability of seismic phase discrimination.The applicability and picking performance of these methods are affected by conditions with low signal-to-noise ratios and complex waveforms.To improve the monitoring performance on weak signals genarature by small earthquakes,a recent microseismic identification method based on the similarity of seismic waveforms is widely used.In this method,weak seismic signals with low signal-to-noise ratios can be extracted by template matching,which greatly improves the inclusiveness of the seismic catalog in the study area (Li Lu et al.,2017;Peng Zhigang et al.,2009).This method requires the calculation of the waveform correlation coefficient,thus necessitating considerable work.Although it has been improved for sparse station spacing (Yoon C.E.et al.,2015),the calculation efficiency of this method is still far from expectation.Moreover,the matching results are strongly dependent on the quality and completeness of the template event.Thus,to monitor relatively weak microseismic events in a reservoir area,additional techniques must be applied to complement and coordinate the process.
Machine learning methods based on neural networks have shown great success in recent seismology research fields.Among them,phase discrimination and arrival time picking of seismic events have the most extensive application with effective results(Bergen K.J.et al.,2019a,2019b).The seismic phase of an earthquake exhibits clear characteristics such as P and S waves,which are conducive for processes using supervised learning approaches.In such methods,the most commonly used network structures are convolutional neural networks (CNN) and recurrent neural networks (RNN).Early work focuses mainly on distinguishing the noise and seismic events from continuous waveform signals.For example,Perol T.et al.(2018) use a CNN for automatic rapid identification of seismic events and their locations.Zhao Ming et al.(2019) apply a CNN to discriminate seismic events and noise in Wenchuan aftershocks.Afterward,researchers utilize neural networks to distinguish different seismic phases of seismic events,extract the travel times,and gradually improve the performance of machine learning models.In addition,Ross Z.E.et al.(2018) apply a CNN and three-component seismic data to identify P waves and S waves in seismic signals,effectively increasing the data quantity in earthquake catalogs.Dokht R.M.H.et al.(2019)enhance a three-component waveform by adding short-time Fourier transform information of the waveform as input,and Cai Zhenyu et al.(2019) use wavelet transformation information in the input,improving the accuracy of seismic phase recognition.Zhu Weiqiang et al.(2019) construct a U-shaped CNN network for picking the arrival time in different seismic phases.Their model increase the depth of the network model while controlling the number of trainable parameters,thereby improving the picking speed and accuracy.Woollam J.et al.(2019) verify the applicability of a U-shaped network on relatively small-scale seismic data sets.Yu Ziye et al.(2018) take advantage of the Inception network to extract the arrival times of seismic waves.Jiang Yiran et al.(2019)utilize CNN and RNN to construct a step-by-step structure for seismic event discrimination and arrival time picking with high accuracy.
Neural-network-based machine learning methods excel at extracting features directly from data and seldom rely on artificially set criteria,ensuring to obtain all useful characteristics entirely.Furthermore,neural network methods are able to achieve fast computation in the phase identification and prediction stage,thus performing efficient processing.In particular,this type of method has shown satisfactory performance in seismic phase identification.Due to the influence of research objectives and training data,previous studies often focus on relatively large earthquakes with a magnitude greater than or equal to 1.As a result,limited studies have been conducted on microseisms which are characterized by small magnitudes.In spite of the small magnitudes,microseismic events are valuable due to their low signal-to-noise ratio and large quantity.Therefore,special research is needed to achieve stable and reliable phase extraction from small-magnitude events.
The present study employs a combination of basic CNN and RNN structures to construct a P-wave arrival time picking model for microseisms in a reservoir area.This model integrates the high computational efficiency of CNN and the advantages of RNN in processing the time series data for the purpose of ensuring rapid training speed and high prediction accuracy in the model.The training data include the P-wave arrival time markings of 60 000 small earthquakes within a magnitude range of 0.8-1.2 recorded by 73 stations in the Dagangshan Reservoir Monitoring Network,which are deployed in the Sichuan Province and its surrounding areas from 2014 to 2018.The data are combined with vertical waveform records and noise data recorded during the same period.The network is trained,and a model with a relatively high precision in P-wave arrival time picking is obtained.The evaluation results of the model in the test data set show 90.7% identification accuracy of the P-wave signals,indicating prompt and efficient prediction of the P-wave arrival times of small earthquakes.
1 DATA
The Dagangshan hydropower station,situated at the main stream of the Dadu he River in Sichuan Province,is constructed in a large-scale hydropower project.It is a typical highdam and large-capacity reservoir straddling mountains and gorges.The Dagangshan reservoir is surrounded by numerous faults with fairly strong seismic activities (Liu Jie et al.,2013;Du Fang et al.,2013).In order to strengthen the monitoring of seismic activities occurring near the reservoir,a reservoir station network consisting of eight short-period stations in the frequency band of 2-40 Hz frequency band was constructed and began operating in May 2013 (Ruan Xiang et al.,2017).These stations,together with those in the surrounding reservoir networks and the China National Seismic Network(Zheng Xiufen et al.,2010),constitute a fairly complete monitoring network encompassing 73 stations (Fig.1).This long-term,continuous seismic monitoring network covers the main active faults in the region and conducts key monitoring of microseisms in the area adjacent to the reservoir,yielding large amounts of microseismic activity data in the region.The analysis results of seismic activities in the reservoir area show that the earthquakes in the region are mainly small and medium with magnitude ≤5.0 that cluster along small-scale seismic belts.Besides,the seismic risk in the reservoir area is comparably high (Du Yao et al.,2016;Ruan Xiang et al.,2017).
Long-term,continuous monitoring and conventional positioning and processing have enabled the accumulation of abundant waveforms and travel time data of seismic events in the study area.From 2014 to 2018,the Dagangshan Reservoir Monitoring Network has recorded 70 729 seismic events,from which 376 283 picks of Pg wave arrival data have been manually selected.The distribution of earthquake magnitude and the number of manual picks of arrival times are shown in Fig.2.
As shown in Fig.2 and in the statistical results,most earthquakes recorded by the network (Events) are relatively small in magnitude.Most of these events have magnitudes below 2.0,with those of magnitude 0.5-1.2 in the greatest abundance.The corresponding phases are also dominated by direct Pg and Sg phases at comparably small epicentral distances.The distribution of the number of manually picked seismic phases (Picks) is similar to that of the events in the 0.8-1.2 interval.For small earthquakes within the magnitude scope of 0-0.8,the low seismic energy may have prevented some stations from clearly recording the first arriving signals of the earthquakes;therefore,the proportion of the number of corresponding manual picks is relatively small.Within the scope of magnitude greater than 1.2,as the magnitude increases,each earthquake is recorded by more stations,resulting in an increased proportion of the corresponding manual picks and a decrease in the difficulty of phase picking.These events and arrival time data provide essential training data set for training the neural network.
Because the P-wave signals of small earthquakes are adequately clear and exhibit the best positioning constraint,the P-wave phase and the vertical component waveform recorded by a station are thus selected herein for study purposes.The outcome of network training depends to a certain extent on the selection of training data.Ultimately,60 000 pieces of seismic waveform data containing the P-wave arrival manual picks in a magnitude range of 0.8-1.2 are randomly selected as the research objects to ensure representative training data independent of the differences in seismic data and picking ratios.This also guarantees that ample data could be obtained to ensure an adequate identification of small earthquakes using the AI model.

Figure 1 Distribution of stations and earthquakes near the Dagangshan Reservoir.The black triangles are the monitoring stations of the reservoir network;the gray triangles mark the permanent stations of the China National Seismic Network;and the stars represent the epicenters of the Sichuan Kangding M6.2 (1970) and Wenchuan M8.0 (2008) earthquakes.The gray points in the right-hand image indicate the epicenters of the recorded earthquakes in the catalog of the reservoir network.
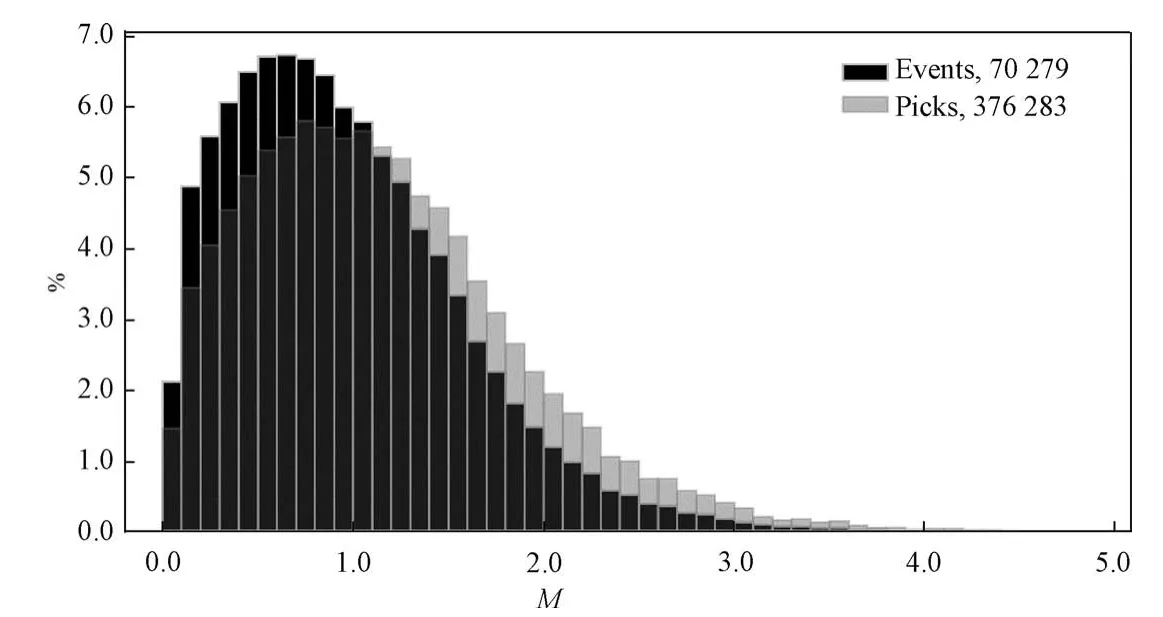
Figure 2 Statistical histogram of seismic events and phase picking data
1.1 Neural Network Construction and Training
CNN and RNN are two of the most basic network structures used in deep learning technology.CNN can be used in image and signal processing,and downsampling can be performed through the pooling layer.In the convolutional layer,the convolution kernel can be used to extract features of the input signal to obtain a complete waveform eigenvector,which is essential for filtering the input data.The convolution kernels in different sizes can perform feature extraction of input data on different scales.For seismic data,a onedimensional convolution structure is often used.Locates between different convolutional layers,the pooling layer primarily performs compression of the number of parameters and data downsampling,reducing the over-fitting phenomenon to a certain extent.In practice,maximum pooling is often selected.One widely used CNN structure is known as a U-shaped network (UNet) since its deep neural network structure is constructed by convolution and transposed convolution to form an approximately symmetrical U-shaped structure.After downsampling,UNet adds transposed convolution including upsampling to achieve the point-to-point output and improve the arrival time picking accuracy,which can effectively extract low-and high-frequency features from the input data (Ronneberger O.et al.,2015;Zhu Weiqiang et al.,2019).RNN is neural network models of recursive traversal the input data and output structured predictions.They apply the same weight to each data point of the input data and save the dependency between the data points.Moreover,RNN can obtain time series information in the input data and are conducive for time series analysis of the causality of different signals in seismic data recorded on the basis of time sequence,thereby improving the arrival time accuracy (Zhou Yijian et al.,2019).
The application of a single UNet for accurate travel time picking often requires a fairly deep network structure,leading to the expansion of optimization parameters,slow convergence of the model,and difficulty in training.The training process of an RNN network is slower than that of a CNN network,although the accuracy of the long-term time dependence processing of an RNN is higher than that of a CNN.To improve the training efficiency and accuracy,this study selects a shallow convolution and deconvolution structure with an incorporated bidirectional RNN network to form a new U-shaped network structure,as shown in Fig.3.
The employed network is composed of a three-layer UNet network and bidirectional RNN units.The resulting cascaded network combines the advantages of the two networks for maintaining comparably good prediction accuracy while reducing the complexity of network training.As shown in Fig.3,the input of the UNet network structure is a vector containing 1 024 points;the network contains three convolutional layers and a pooling layer in the downsampling layer group.The input of each layer includes vectors with 1 024,512,and 256 sampling points,respectively.The size of the convolution kernel is 3,and the increments of extracted features are 32,64,and 128 respectively.In this way,the increase of feature numbers in the process of data downsampling ensures that the entire network retains all waveform information.Each layer uses leaky_ReLU as the activation function with the added regularization processing to guarantee that the network converges quickly.Following the downsampling layer is a two-layer forward RNN network and a two-layer reverse RNN network.The input data length of the RNN network is 128,greatly accelerating the training process.Then,an upsampling layer group appears with parameters corresponding to those of the UNet downsampling layer group,thereby restoring the data to a length of 1 024 sampling points.Finally,a softmax layer is added to obtain the final output of the network.
This study mainly distinguishes and picks the P-wave phase in the vertical component.Therefore,the training data containing P waves are regarded as positive samples,while the noise training data without P waves are regarded as negative samples.Waveform truncation is performed in a 20 s period,10 s prior to and 10 s after the manually picked arrival time of the P-wave on 60 000 pieces of vertical seismic waveform data with an original sampling rate of 100 Hz.The obtained data are subjected to de-averaging,de-linearization,selfnormalization.In order to emphasize the main frequency range of signals of small seismic events,a 2-20 Hz band-pass filter is applied to the data.Meanwhile,for the purpose of increasing the randomness of the data,1 024 continuous data points amounting to a 10.24 s waveform (to facilitate calculation) are randomly selected for each piece of 20 s seismic data.Accurate P-wave arrival time information is retained in each piece of seismic data as positive sample data.For improving the noise identification ability,the waveform of the P wave from 9.76 s to 20 s after the manually picked arrival time is selected as noise data for each piece of the corresponding positive sample data.Similar data processing is performed,and the arrival time information is marked as null to be used as negative sample data.Ultimately,a total of 120 000 positive and negative sample data are obtained.
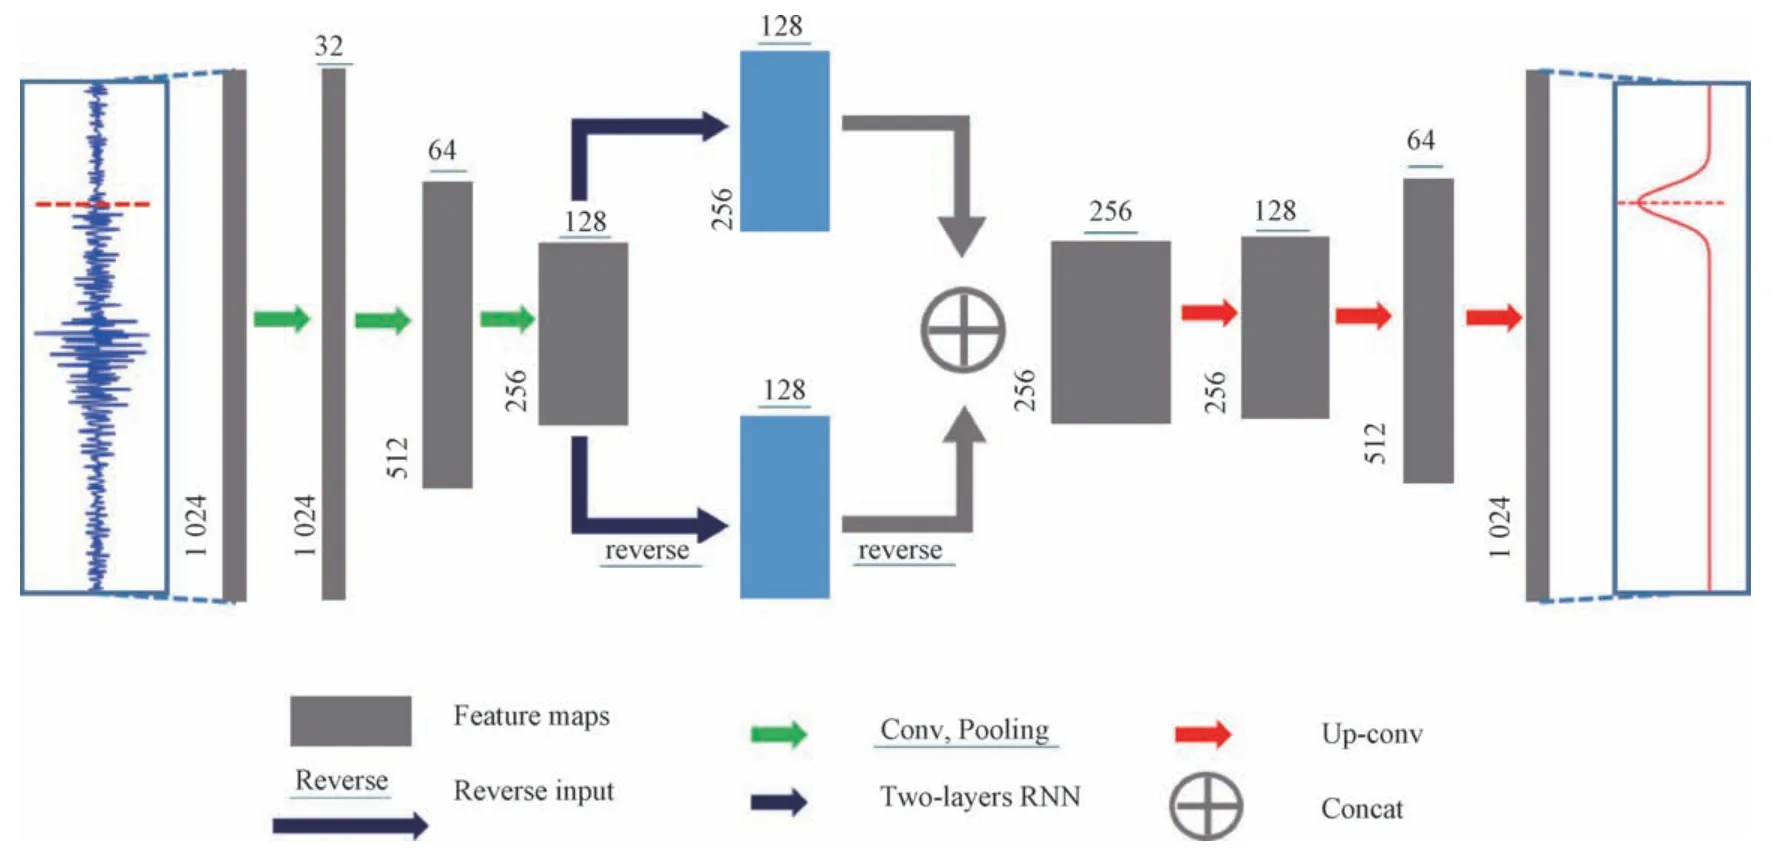
Figure 3 Deep neural network constructed in this study The basic structure is UNet joined with two layers of bidirectional RNN to improve accuracy
To eliminate the influence of the order of data input to the model and the order of earthquake occurrence on the training results during training,as well as ensuring that the deep learning network acquires the features of seismic signal,the positive and negative sample data are randomly shuffled.The first 80% of the shuffled data is used as the training set data,and the last 20% is used as the test set data;that is,96 000 and 24 000 pieces of training and test set data are used,respectively.In addition,the input data are guaranteed to contain the same numbers of positive and negative sample data during each model training process to enhance the robustness of the network (Ross Z.E.et al.,2018b).
Considering that deviations may occur in the manually picked arrival time,the statistical characteristics of the deviation are assumed to follow the Gauss distribution.With the manually selected arrival time as the center,a Gaussian function of 1 024 sampling points is constructed as the labeled data of the network with a half-window length of 0.5 s.The selection of the Gaussian function reflects the error of manual picking to a certain extent,thereby improving the accuracy of the network (Zhu Weiqiang et al.,2019).In the process of constructing the loss function of the network,the mean squared error function is selected as the loss function.To maintain the stability of the network,the L2 norm of trainable parameters in the entire network is added to the loss function for constraint,with its coefficients set as 1×10⁻⁶,as shown in Equa.(1):

whereyis the correct answer of the labeled data,y′ is the predicted value given by the neural network,nis the number of data,andwis the trainable parameter of the network.
1.2 Neural Network Training Results
The aforementioned network is implemented and trained based on the TensorFlow framework,with the fairly efficient Adam algorithm used as the optimization algorithm.The network learning rate is set to 0.001 for iteratively updating the network.In each update step,128 pieces of data records are processed in batches,including 64 pieces of seismic data and 64 pieces of noise data.In the acceleration mode of the Nvidia 2080Ti graphics card,each step of the loop takes about 2 s.The loss function and accuracy of the network on the training set and test set during the training process are tracked,as shown in Fig.4.Ascribed to the small data size in each iteration,the randomness difference between each step is relatively large.Therefore,a moving average of the data is calculated.After 500 iterations,the picking accuracy of the model reaches approximately 90%,and the loss function drops to a value below 0.5.After about 1 000 iterations,the accuracy exhibits slow improvement to more than 92%.To ensure the accuracy of the model and prevent overfitting,the final model used in this study is selected after 1 000 iterations.

Figure 4 Changes in loss function and model accuracy with the iteration steps in the training process Here,train_accuracy and valid_accuracy are the prediction accuracy of the model on the training and test data set,respectively,whereas train_loss and valid_loss are the loss function of the model on the training and test data set,respectively
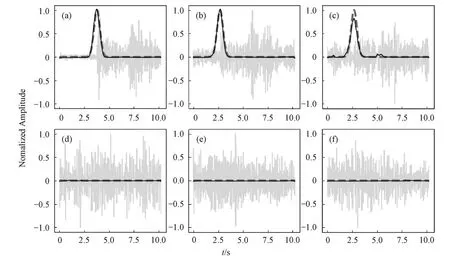
Figure 5 P-wave arrival time predicted by the deep learning network The light gray line depicts the seismic waveform data;the dark gray dashed line shows the label data;and the black line represents the prediction result of the deep learning network
The performance and generalization ability of the network can be evaluated through the prediction of the test set data obtained by the model.Fig.5 shows the network's prediction results of three pieces of seismic signals and three pieces of noise data.The light gray line shows the original waveform data;the dark gray dashed line is the Gaussian function of the manually marked P-wave arrival time;and the black line illustrates the prediction result of the deep learning network.The peak value of the Gaussian function indicates the arrival time position of the seismic phases;a peak value of zero indicates that the input data are negative sample data of pure noise.Fig.5 reveals that the final prediction of the model is relatively stable,making it easy to properly distinguish the seismic P-wave phase and noise data.
The output value of the neural network represents,to a certain extent,the evaluation of the accuracy of the model's prediction.Different thresholds can be set to determine whether the identified arrival time should be regarded as the P-wave phase.In Fig.5,the signal-tonoise ratio of the P waves of the three seismic events(a),(b),and (c) are shown to decrease sequentially.When the signal-to-noise ratio is high,the peak value of the prediction is also relatively high,which is almost identical to the results of manual picking.When the signal-to-noise ratio decreases,as shown in Fig.5(c),the peak value of the prediction trends down correspondingly.At the same time,small protrusions are noted before and after the maximum peak with relatively low magnitudes,as shown in Fig.5.Proper selection of the threshold of the predicted peak value and classification of predictions below the threshold as invalid ones can improve the rationality and accuracy of the final result.Figs.5(d),(e),and (f) show that the predicted peak values of the three noise signals are all close to zero,indicating that the model can effectively identify a noise signal.
The accuracy,recall,and error rate are important parameters for evaluating the performance of the network model on extracting the arrival times of seismic phases.Moreover,they are quantitative indicators used for determining whether the model is suitable for practical applications.If a seismic phase extraction exhibits a time difference within ±0.5 s between the predicted and the manually picked times,it is regarded as a correct prediction.The terms are defined as the follows:accuracy=number of correct prediction/actual total number,recall=1-non-detected number/actual total number,error=number of false detection/actual total number.The trained model is applied to predict the test set with 24 000 pieces of data,and statistical analysis is performed on the results.The prediction result statistics are shown in Table 1,with the output prediction peak thresholds set to 0.5,0.7,and 0.8.The results show that when the prediction peak threshold was set to 0.5,the overall prediction accuracy of the sample reaches 90.7%,the recall rate is 92.6%,and the error rate is 1.9%.As the threshold increases,the selection criteria for seismic phases of the model becomes more stringent;thus,the error rate of the selected arrival time information decreases.However,the elimination of the seismic phases with the low signal-to-noise ratios reduces the recall rate,leading to a corresponding decrease in the accuracy rate.

Table 1 Statistical analysis of prediction performance of the deep learning network under different thresholds.
The degree of deviation between the predicted arrival time of the model and the manual picking result is indicative of the accuracy of the seismic phase picking of the model.Fig.6 shows the distribution of the difference between the P-wave arrival time picked by the network and the manually picked time in the test with the predicted peak thresholds set at 0.5 and 0.7.Most of the picking deviations are concentrated within ± 0.1 s,indicating high accuracy of the picked values.Notably,a small portion of data show deviations greater than±0.5 s,possibly due to the data labeling errors.
2 DISCUSSION
In this study,a shallow UNet structure combined with a bidirectional RNN is employed to construct a cascaded deep learning network,which is then trained and used for arrival time picking of P waves from small earthquakes in the reservoir area.The established network shows a prediction accuracy rate of 90.7% for the test set data.It displays reasonable ability in distinguishing the seismic signal of the positive sample and the noise signal of the negative sample,and the time extraction error of small earthquakes is controlled within the range of ±0.5 s.The accuracy of this network is generally comparable to that of existing machine learning methods (Zhao Ming et al.,2019;Jiang Yiran et al.,2019).The magnitude of the microseisms that need to be handled in the reservoir area is relatively small with a relatively low signal-to-noise ratio,which requires more stringent conditions for accurate prediction.Although variations exist in specific criteria for calculation,the network model constructed in this study displays better performance.
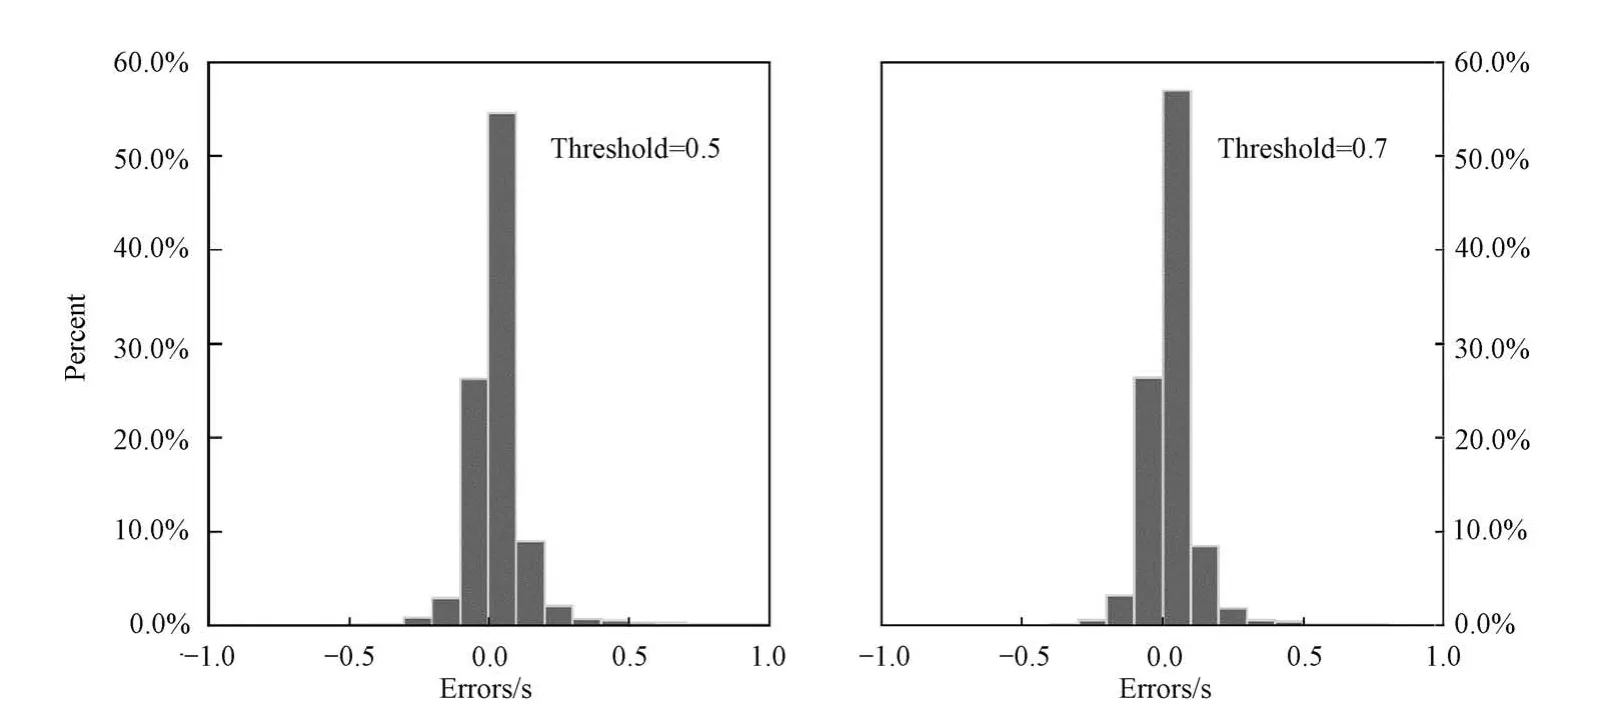
Figure 6 Statistical analysis of deviations between the arrival time picked by the deep learning network and manual picking
In the test data set,some seismic signals show both false positive and negative results,which can be attributed to two reasons according to the analysis of the corresponding data.(1) The seismic signal contains complex waveform information,combined with the noise signal interfered with the real first arrival signal.This results in multiple prediction peaks and thus may affect the final results.(2) The signal-to-noise ratio of the seismic signal is extremely low,and the first arrival of the P-wave is completely submerged in the noise,leading to ineffective extractions.In view of these events,because their signal features of the vertical component are not obvious,it is essential to analyze the three-component waveform data when performing manual picking to better distinguish the first arrival of the P-wave.Subsequently,a three-component waveform can be employed as the input of the model to improve its performance on the extraction of weak P-wave signals.It is especially helpful in such cases to use three-component data when the S-wave is extracted in the subsequent work.
For the waveform signal of the same earthquake,different cut windows may have a slight impact on the prediction results.In particular,when the first arrival of the P-wave is located in the first and last sections of the window,the prediction performance will decrease.The possible reason for such phenomenon is that a waveform truncates in this way often suppresses the noise in the quiet period before and after the seismic signal,and the overall lack of comparison of the waveform deteriorates the model prediction results.In addition,some manually picked waveform data also exhibit obvious deviations,whereas the network prediction result corresponds to the seismic phase more reliably.A training set with better accuracy can be achieved through implementation of quality control measures on the training data,as well as refined selection of data items with high prediction peaks and large deviations by the model.Hence,a network model with better performance can be established.
The model designed in this study can extract the picking features of input signal with any length.Thus,it can be applied to the phase detection of real-time data stream as well.The data of the 70 s continuous vertical component waveform from a station are selected for validation,as shown in Fig.7.The constructed model accurately identifies the P-wave signal at the P-wave arrival time of the event.Moreover,although no S-wave label is given in the training process of the network,no higher prediction value is detected at the S-wave phase position.This indicates that the trained network mainly contains the characteristic information of P waves and is able to identify P waves and S waves as different phases.For continuous waveforms,the complexity of the signal multiples,and multiple P-wave peaks may appear in the same time period of data.Some can be relatively weak P-wave signals,and others might be noise from the surrounding environment of the station.The predicted peak value corresponding to these interfering signals is not high and can be effectively removed by setting a threshold of 0.5 or higher.When the threshold needs to be lowered to identify more microseismic signals,seismic correlation can be conducted through a combination of multiple stations to eliminate some interfering non-seismic events (Ross Z.E.et al.,2019;Zhang Miao et al.,2019).The ability of real-time data processing provides a potential opportunity for the practical application of related research.
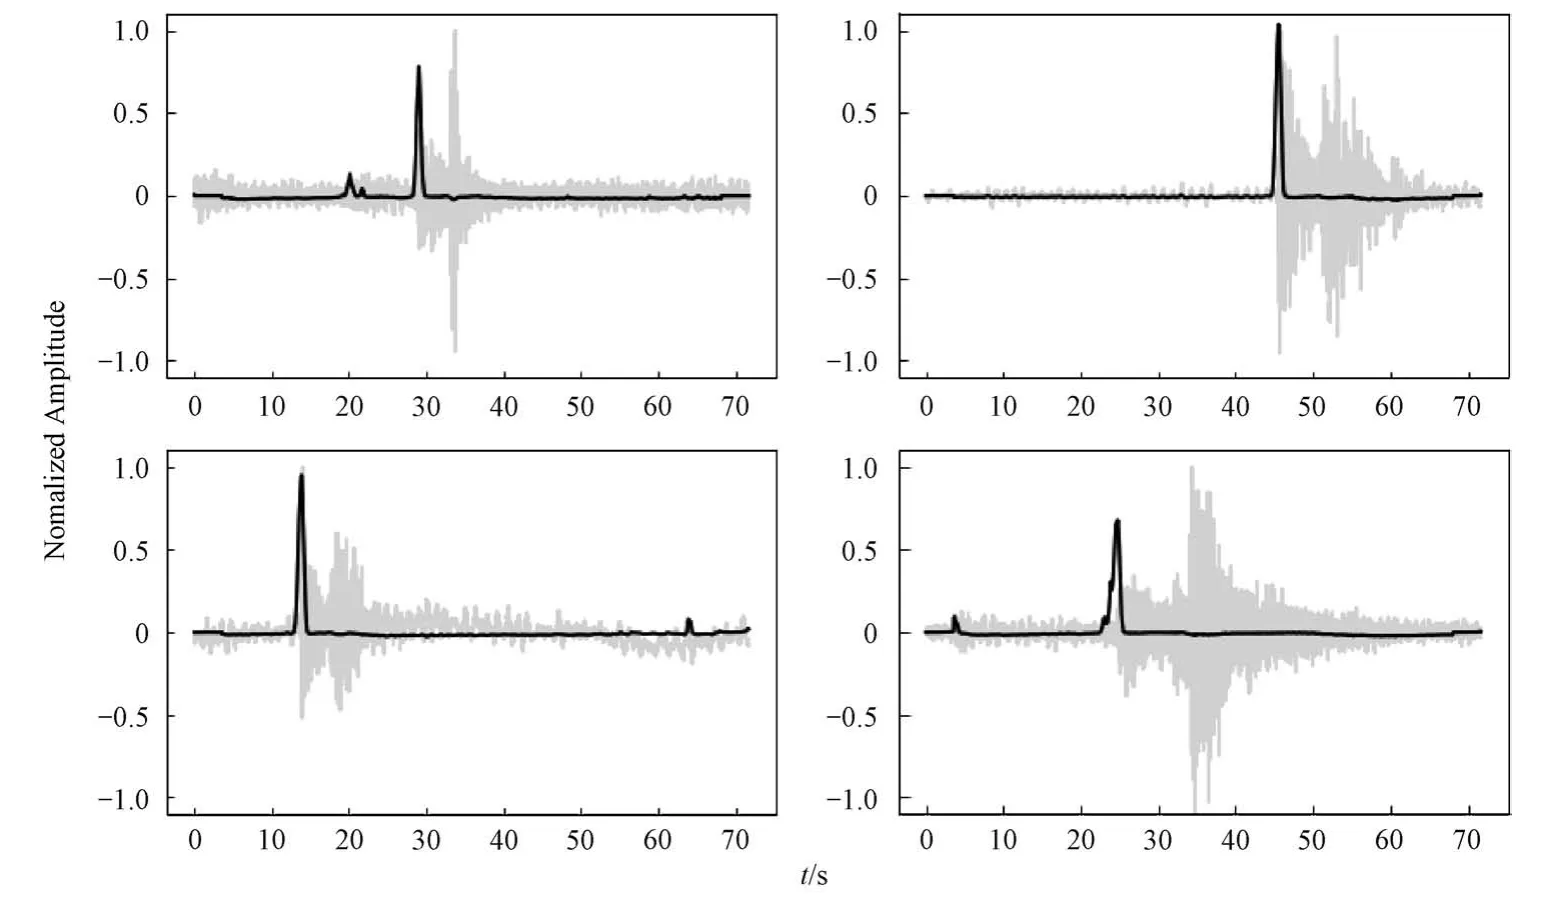
Figure 7 Validation of the constructed model on continuous data Light gray color indicates seismic waveform data,and the black line highlights the prediction result from the deep learning network
3 CONCLUSIONS
To address the problem of automatic detection of microseismic P-wave phases in a reservoir area,this study applies neural networks to establish a cascade network model combining a UNet network and RNN networks.The model is then used for automatic picking of the P-wave arrival time information of small earthquakes.The results show that the established model can effectively distinguish seismic P-wave signals and noise data.The overall accuracy of P-wave picking for small earthquakes with magnitude of 0.8-1.2 is 90.7%,and the phase picking deviation is within 0.5 s.The designed cascade network exhibits fast training speed and stable results and can be used for real-time data processing.In the seismic signals of small earthquakes,the P-wave signal generally has a clear phase,which imposes good constraints on the location of small earthquakes.Hence,this study provides a powerful tool for the research of small earthquakes in a reservoir area.In future work,the network can be applied to S-wave detection and analysis,and three-component data can be introduced to further improve the performance of the network.The deep learning method can be employed in automatic phase picking and labeling of microseisms in a reservoir area,and its performance is on par with manual picking.Such satisfied results indicate strong practical value of the proposed model.
 Earthquake Research Advances2020年3期
- Earthquake Research Advances的其它文章
- Characteristics of the AE Distribution and Triggering Mechanism of a Simulated Meter-Scale Fault after Stick-Slip Events1
- Experimental Study of the Main Influencing Factors in Mechanical Properties of Conglomerate1
- A Novel Approach for Estimating Debris Flow Velocities from Near-Field Broadband Seismic Observations1
- Analysis of Seismic Activity in the Middle Part of the North-South Seismic Belt—Joint Study on Deep Seismic Sounding Profile and Seismicity Parameters1
- Study on the Criterion of the Correlation between Deformation Precursors and Earthquakes1
- Simulation of Silty Clay Compressibility Parameters Based on Improved BP Neural Network Using Bayesian Regularization1
