Analysis of Seismic Activity in the Middle Part of the North-South Seismic Belt—Joint Study on Deep Seismic Sounding Profile and Seismicity Parameters1
WANG Xiao,HUANG Xinghui,YU Dan and FAN Chunyan
China Earthquake Networks Center,Beijing 10045,China
Using the rich deep seismic sounding data recorded in the middle part of the North-South Seismic Belt in China,the horizontal and vertical profiles are constructed to obtain the seismic velocity structure,analyze the seismic distribution and calculate the seismic energy and the thickness of the seismogenic layer at the same time.On this basis,the seismicity parameters are calculated using the earthquake catalogue of the study area for the past 40 years,and the relationship between the b-value distribution and the velocity structure is analyzed.The results show an uneven b-value distribution in the study area and a segmented feature along the Longmenshan fault zone.Most of the earthquakes occur in the transition zone anomalies from the positive to the negative.In addition,the thickness of the crust drops from~60 km to~48 km from the Southeastern to the Northeastern Qinghai-Tibetan Plateau,but the thickness of the seismogenic layer increases gradually.It is speculated that the crustal composition of the Northeastern margin contains more felsic materials and has relatively stronger seismic activities than the Southeastern Qinghai-Tibetan Plateau,possibly associated with the subduction and compression of the Indian Ocean Plate.
Key words:Middle part of the North-South Seismic Belt;Velocity structure;Seismic energy;Thickness of the seismogenic layer;Seismicity parameters
INTRODUCTION
The North-South Seismic Belt is the region with the strongest seismic activities in the Chinese mainland.In the study of earthquake prediction in China,according to the spatial distribution characteristics of strong earthquakes,the area between 95°-110°E and 21°-45°N with dense strong earthquakes is called the North-South Seismic Belt.The seismic activities here are characterized by high frequency,high intensity,short periodicity,and shallow focus.According to historical records,there have been 72 earthquakes withM≥7.0,including 9 earthquakes withM≥8.0;and since 1900,35 earthquakes withM≥7.0 have occurred in this area,accounting for 55% of the total strong earthquakes in the western China.Structurally,the North-South Seismic Belt is located on the Eastern Qinghai-Tibetan Plateau.It is the eastwest boundary of the geological province in the Chinese mainland,and is also a sharply changing zone of various geophysical features (Wang Zhensheng et al.,1976).
According to the migration law with time of major earthquake epicenters and the features of large-scale earthquakes withM≥7.0 in the North-South Seismic Belt,Yan Zhide (1986) suggests that the North-South Seismic Belt can be divided into three sections,namely the north,middle,and south sections.The detailed information is as follows:the area north of 36°N is the north segment,the area between 36°N and 29°N is the middle segment,and the area south of 29°N is the south segment.The study area is the middle section,which locates in the Eastern Qinghai-Tibetan Plateau,and is the transition zone between the Qinghai-Tibetan Plateau and the Yangtze Craton.The geological structure in this area is complicated by large-scale active faults,including the Xianshuihe-Xiaojiang sinistral strike-slip fault,the Jinshajiang-Honghe dextral strike-slip fault,and the Longmenshan Fault with sinistral strike-slip and compression features.As a result,the local crust is highly deformed or fractured,leading to abnormally strong seismic activities (Fig.1).

Figure 1 Seismic distribution map of the middle segment of the North-South Seismic Belt(black circles represent MS≥4.0 earthquakes)
In the past decade,the predecessors have conducted a series of investigations in the area and its vicinities.Wang Chunyong et al.(2007) utilize two deep seismic wide-angle reflection/refraction profiles of Zhubalong-Zizhong and Benzilan-Tangke to obtain the 2-D P-wave velocity structure beneath the region.The results indicate that the Western Sichuan Plateau and the Sichuan Basin are two different structural units with distinct crustal structures(Wang Chunyong et al.,2002,2003(a),(b),(c);Bai Zhiming et al.,2003,2004).Yanyuan-Xichang-Mahu Profile (Wang Fuyun et al.,2008) suggests that the strong seismic activities in Yanyuan-Mabian Seismic Belt are mainly controlled by the Anning River,Zemu River,and Daliangshan Faults.Xu Tao et al.(2015) use the Lijiang-Panzhihua-Qingzhen Profile to reconstruct the crustal velocity model in the Lijiang seismic region and analyze the deep structure and features of the Large Igneous Province (LIP).In addition to carrying out research using artificial seismic data (Fig.1),Wang Zhi et al.(2010) use teleseismic P-wave and S-wave travel time joint inversion to obtain the crustal and upper mantle velocity structure in the middle and southern part of the North-South Seismic Belt,showing that the velocity structure has a strong heterogeneity from the Southeastern Qinghai-Tibetan Plateau to Yangtze Platform.Based on the near-field seismic data collected in the eastern Tibetan Plateau and its adjacent areas,Ding Zhifeng et al.(1999) use an improved fast 3-D ray tracing method to inverse the velocity structure of the crust and upper mantle.Xu Xiaoming et al.(2015) adopt FMTT tomography to obtain the deep 3-D P-wave velocity structure in the southern part of the North-South Seismic Belt,showing that the deep structure has obvious unevenness.Furthermore,Yao Huajian et al.(2006,2008) propose a multi-scale surface wave tomography method.For the first time,the background noise imaging method is applied to the North-South Seismic Belt.The obtained S-wave velocity structure reveals several complex crustal layers.
Among the research methods currently applied in this area,the deep seismic sounding method using artificial source has its own advantages (Bai Zhiming et al.,2016).Compared with the natural seismic method,it has the characteristics of accurate source position and earthquake origin time,as well as smaller station spacing.Compared with the deep seismic reflection method,it has the advantages of large seismic reflection energy of far-path,the separation of the effective signal and the interference signal of the first wave in the far-path,and a wider detection depth range from hundreds of meters to several kilometers,etc.It can make full use of both refracted and the reflected wave information of the discontinuous surface in the crust to reconstruct the crustal geometric characteristics and the velocity structure,thus can improve both the horizontal and vertical resolution of the crustal structure.As shown in Fig.1,even though the study area contains numerous profiles and a huge amount of data,the data utilization rate is relatively low.Therefore,this paper intends to calculate seismicity parameters based on the rich artificial wide-angle reflection/refraction seismic profiles in the area and the reliable seismic catalog resources from China Earthquake Networks Center,in order to comprehensively analyze the features of the Longmenshan-Minshan orogenic belt on the basis of the crustal velocity structure,and to study its seismogenic mechanism.
1 RESEARCH METHODS
1.1 Obtain the Crustal Velocity Structure in Sichuan-Yunnan Region
Four deep seismic sounding profiles (the yellow profile and the blue profile in Fig.1)in the study area are selected,in which the vertical slice is composed of the Barkam-Luqu Profile and the Benzilan-Tangke Profile (blue),and the horizontal slice is composed of the Altay-Longmenshan Profile and the Suining-Maoxian-Aba Profile (yellow) (Zhang Zhongjie et al.,2013).
After the slice profile is determined,the crustal velocity structure is first digitized to form a crisscross deep seismic sounding slice throughout the study area.Using this as a window,different-depthM8.0 earthquakes within 50 km on both sides of the profile are relocated and projected beneath the profile using the method of hypo2000 (Klein F.W.,2002) and hypoDD(Waldhause F.et al.,2000).Then,the seismic distribution is analyzed and the seismic energy (Equa.1) is calculated to obtain the seismogenic layer thickness(SLT).Such process is aim to understand the rheological characteristics of the lithosphere and analyze the evolution characteristics of regional tectonic blocks and orogenic belts in the study area.Finally,in the context of the above analysis in the study area,the seismic catalog is used to calculate the seismicity parameters to analyze the structural characteristics of the Longmenshan-Minshan orogenic belt in conjunction with the velocity structure to further study the seismogenesis mechanism.

It is worth mentioning that in the seismic catalog,the seismic depth has almost become one of the most inaccurate parameters,and its accuracy is still a challenging problem so far.The horizontal accuracy of seismic positioning is generally divided into four levels:the epicenter error is less than 5 km for the first class accuracy,5-15 km for the second class accuracy,15-30 km for the third class accuracy,and those greater than 30 km for the fourth class accuracy.Because the relationship between the epicenter error and depth error is highly complicated(Zhang Zhongjie et al.,2011),it is impossible to obtain the depth error directly from the earthquake catalog.The dispersion of earthquakes in the crust depends not only on the rheology of the crustal medium,but also on the layout and density of seismic stations.Previous studies on crustal rheology (Sibson R.H.,1982;Das S.et al.,1983)have shown that most moderate earthquakes occur in the transition zone of the crustal medium from brittle to ductile,usually in the depth range of 15-20 km.Therefore,although we cannot obtain a detailed description of the depth error from the earthquake catalog,we can still obtain useful information about the seismic zone within the crust.
1.2 Calculation of Seismicity Parameters in the Study Area
1.2.1 Basic Principles
The study of seismicity is mainly based on the G-R relationship (Gutenberg R.et al.,1944):lgN=a-bM.Among them,Nrepresents the number of earthquakes greater than magnitudeMin a certain period of time;arepresents the seismic activity rate,brepresents the proportion of large and small earthquakes,and some researchers believe thatbvalue is related to the level of stress (Scholz C.H.,1968;Wyss M.,1973;Urbancic T.I.et al.,1992).In detail,regions with high stress levels have lowerbvalues,while regions with low stress levels have higherbvalues.Therefore,the spatial distribution ofbvalues can be used to analyze the relative stress level of different sections in active fault zones,and to evaluate its future seismic hazard (Wiemer S.et al.,1997;Yi Guixi et al.,2007).
1.2.2 Parameter Calculation
TheMS≥4.0 seismic data used in this study is from the official report catalogue of China Earthquake Networks Center (CENC),and theMS<4.0 earthquake is from the catalogue of the provincial network.The earthquakes from January 1970 to December 2018 totaling 48 years are selected.Fig.1 shows theMS≥4.0 earthquake distribution in the study area.It can be seen that earthquakes are mostly distributed along the fault.
After preparing the data,the specific parameter calculation process is conducted as follows:
First,the nearest neighbor space-time distance method (NND) (Gardner J.K.et al.,1974) is used to declutter the earthquake catalog,that is,the nearest space-time distance between each earthquake and the post-seismic events are calculated.When the nearest neighbor space-time distanceηij≤10-5,the earthquakeiand earthquakejbelong to the same earthquake sequence.Then,we determine the main shock by deleting the foreshocks and aftershocks of the earthquake in the catalog.Consequently,a good-quality main shock catalog is obtained and the seismicity accuracy is ensured.The key of the nearest adjacent space-time distance method is the calculation of the nearest adjacent space-time distanceηij,which is the product of the temporal distanceTijand the spatial distanceRij.

Among them,b=1,df=1.6,q=0.5.tijandrijstand for the time interval and linear distance between earthquakeiandj,respectively,in units of years and km.miis the magnitude of earthquakei.
Secondly,the complete magnitude of the seismic catalog after cluster removal is determined.Fig.2 also shows the magnitude-cumulative frequency relationship and magnitude-non-cumulative frequency relationship curves of magnitude ≥MC(minimumcomplete magnitude).Besides,the point with the largest curvature on the magnitudecumulative frequency relationship curve is the complete magnitude,that is,the highest point on the magnitude-non-cumulative frequency relationship curve.It can be seen that the earthquake record of theML≥2.6 during the study period is complete.
Finally,the research area is gridded with 0.1°×0.1°,and the seismic data in the statistical unit with each grid node as the center and radius r(here we selectr=30 km) are selected.This parameter is selected to permit that the number of seismic samples in each statistical unit is not less than 30,ensuring the monitoring capability of the networks and the reliability of the calculation results.For each statistical unit,the lower limitMCof the complete record is determined,and then the maximum likelihood method is used to calculate theb-value in the magnitude-cumulative frequency relationship:lgN=a-bM.
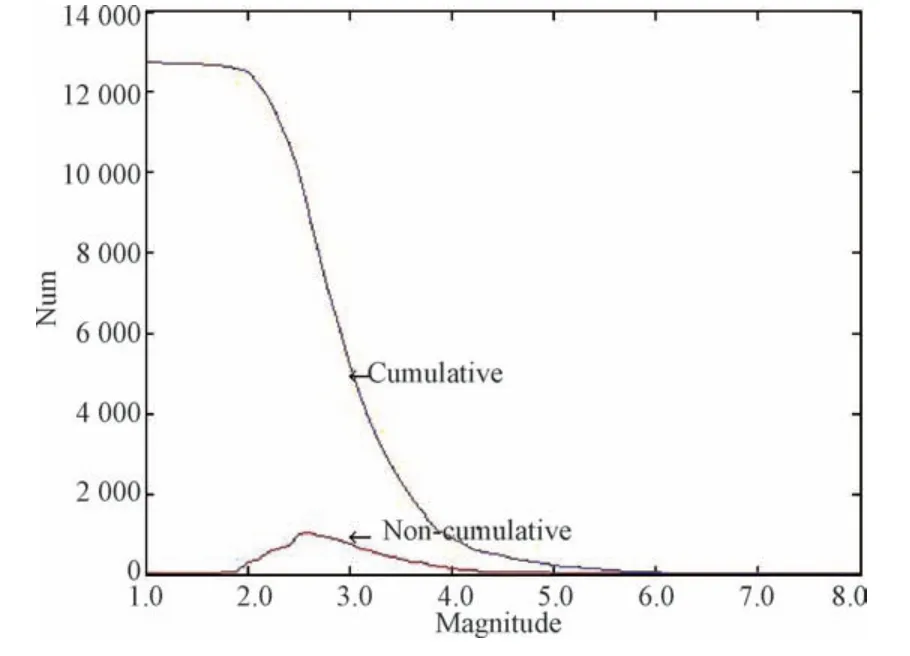
Figure 2 Completeness analysis diagram of the study area
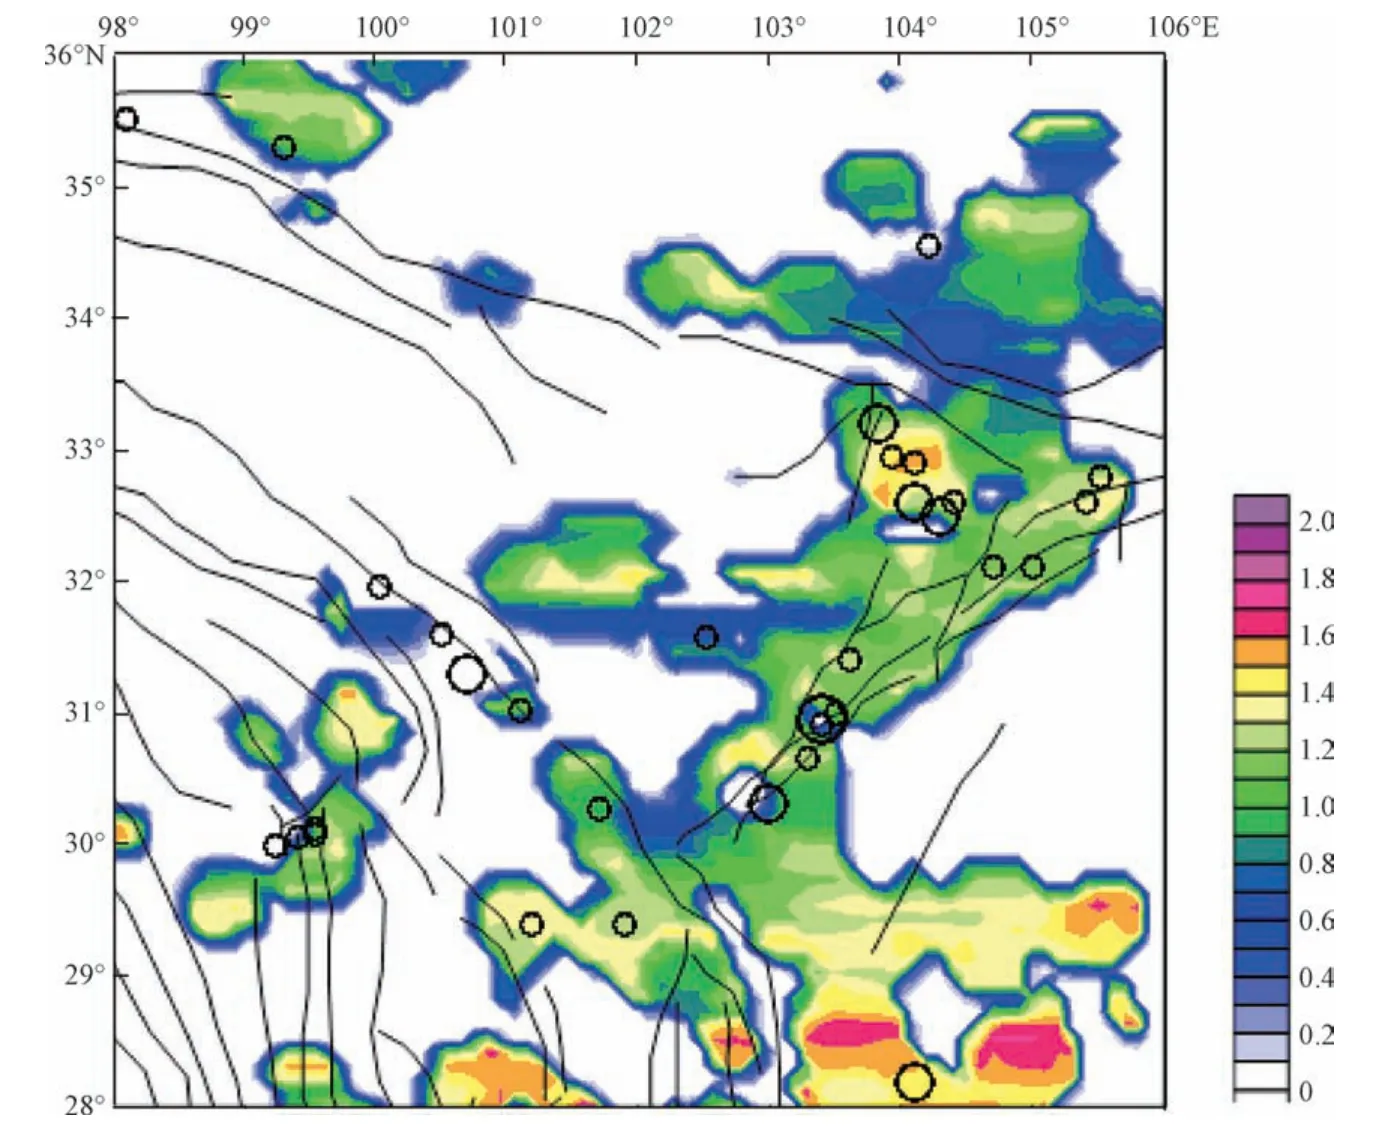
Figure 3 Distribution of b values in the middle part of the North-South Seismic Belt
2 RESULTS ANALYSIS
Using the above method,the contour map of theb-value spatial distribution shown in Fig.3 can be obtained (Yi Guixi et al.,2006,2011),and theb-value anda-value distributions are plotted below the corresponding sections to obtain the velocity structure(Fig.4,Fig.5).
It can be seen from Fig.3 that theb-value has obvious segmented characteristics along the Longmenshan-Minshan Structure Belt.Theb-value in Fig.3 is plotted in Fig.4 (e) and Fig.5 (e),respectively,and its segmented characteristics can also be seen,indicating that the stress accumulation has a significant spatial difference,thus reflecting the segmentation difference is in the risk of strong earthquakes.The results may provide an explanation for the non-uniformity of the spatial distribution of earthquake aftershocks.
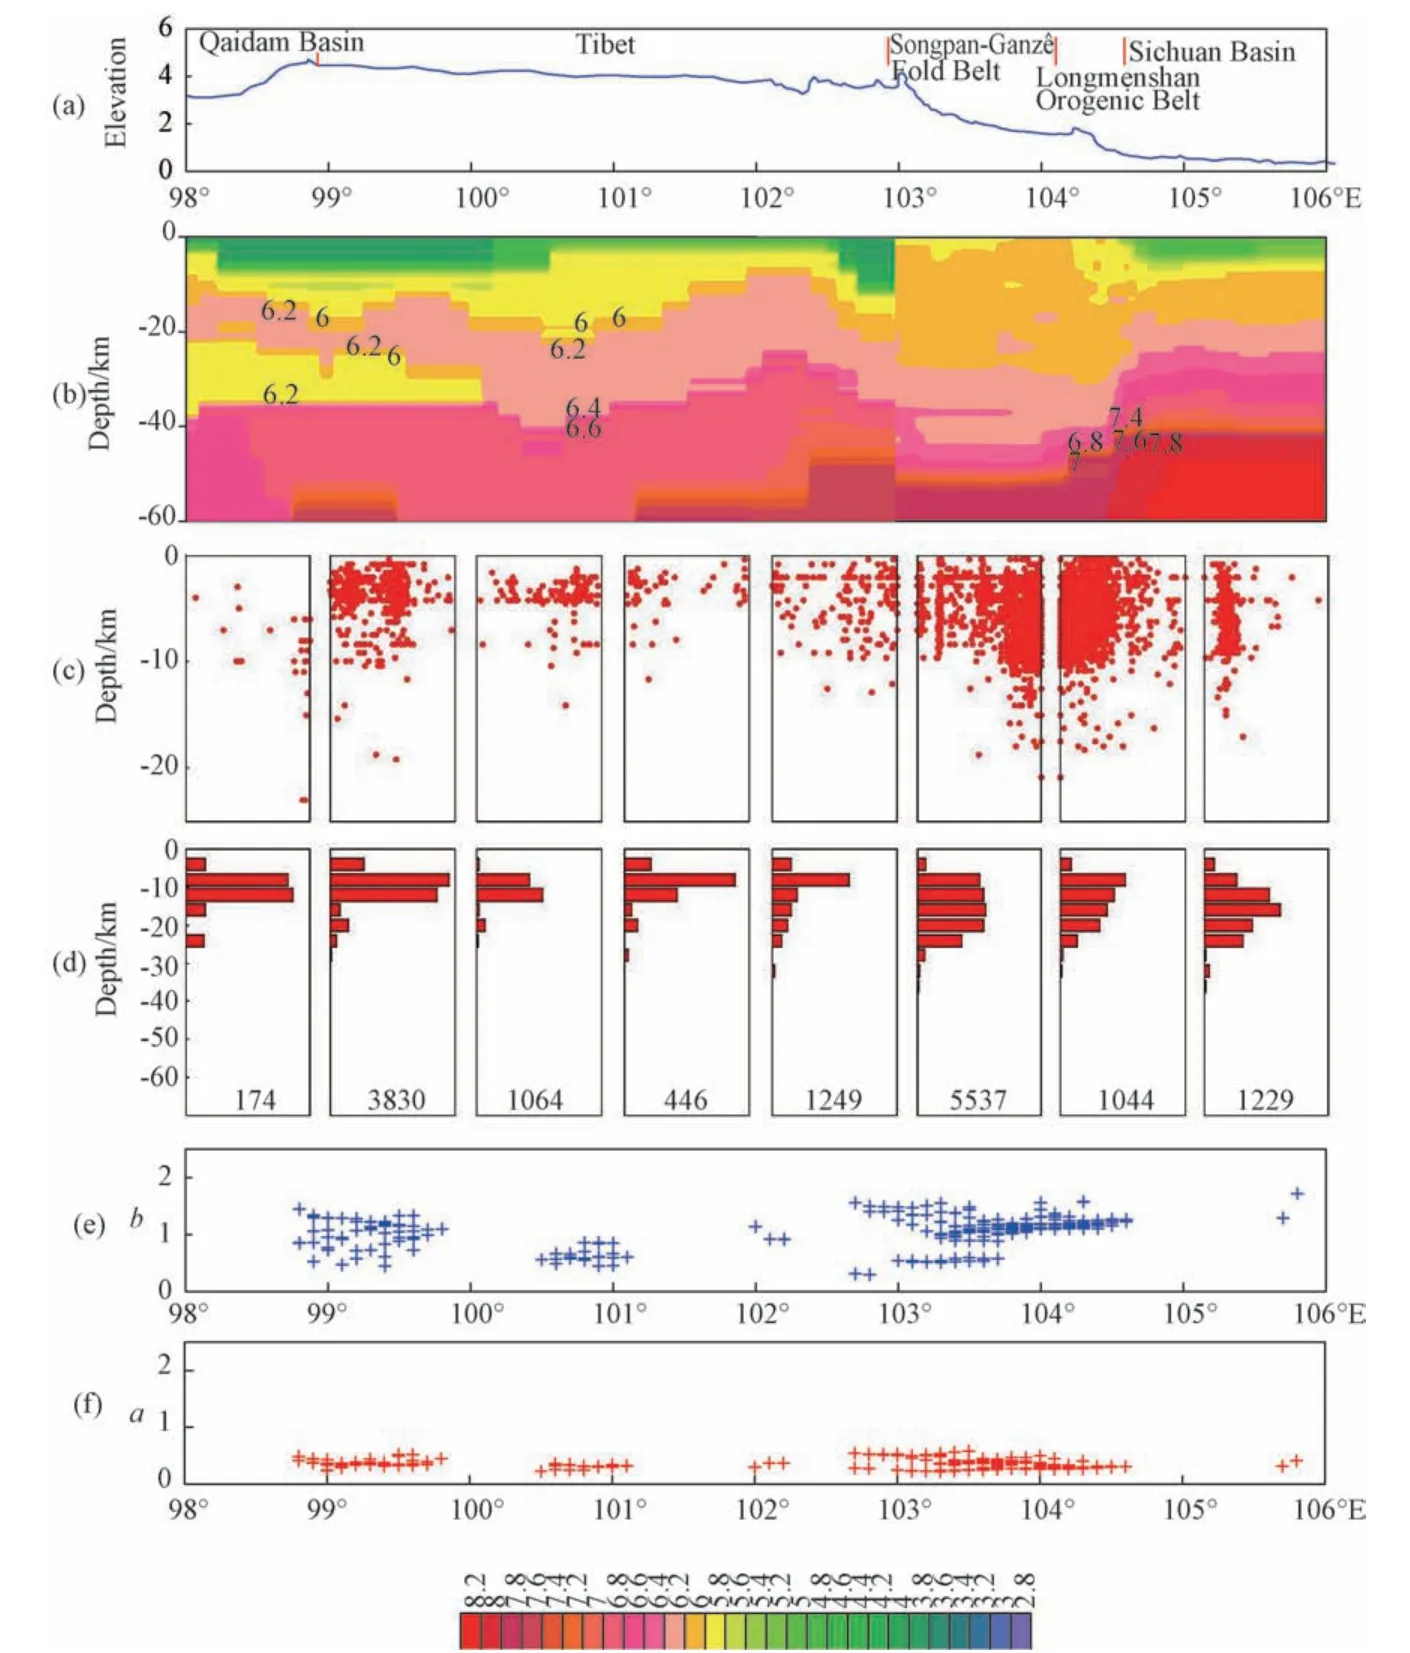
Figure 4 Velocity structure and seismic activity analysis below the horizontal slice in the study area
It can be seen from Fig.4 that:(1) the thickness difference of the moho surface below the Longmenshan fault zone is 15-20 km;(2) the earthquakes are mainly concentrated in the middle and upper crust,and the occurrence frequency of 10-30 km “earthquake prone layer” is high.Besides,the layers are mostly low-velocity layers.
It can be seen from Fig.5 that the crustal thickness from the Southeastern Qinghai-Tibetan Plateau to the Northeastern Qinghai-Tibetan Plateau has dropped from~60 km to~48 km,while the thickness of the seismogenic layer has gradually thickened,suggesting a changing crustal composition.We suggest that the crustal composition of the Northeastern margin contains more felsic materials and has relatively stronger seismic activities than those in Southeastern Qinghai-Tibetan Plateau.As can be seen from Fig.4(c),(e) and Fig.5(c),(e),there is a certain correspondence between the segmentation ofb-value and the frequency of earthquake occurrence.
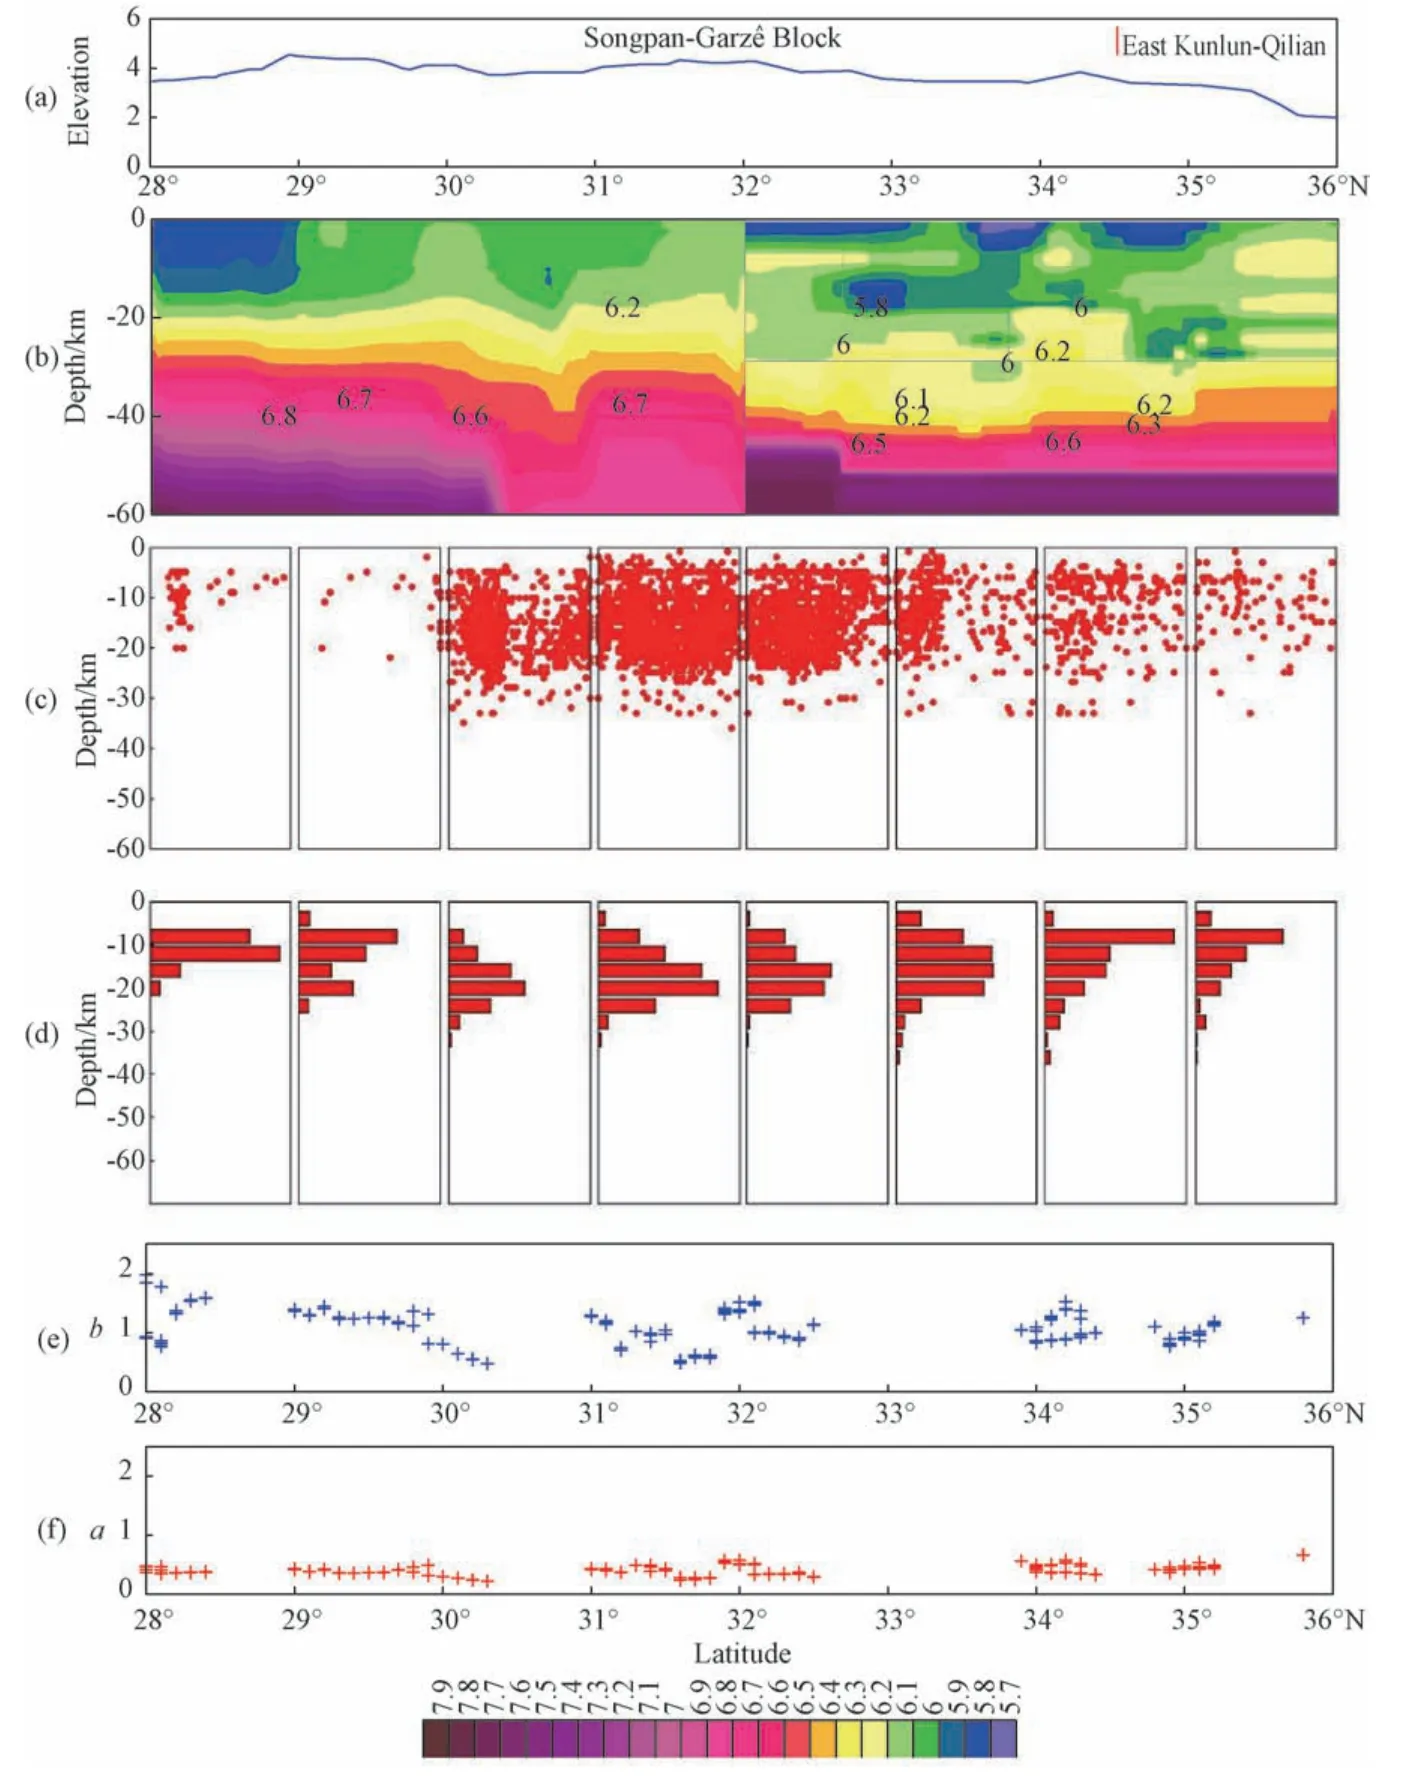
Figure 5 Velocity structure and seismic activity analysis below the vertical slice in the study area
3 CONCLUSION
By calculating the distribution ofb-value and crustal velocity structure of seismic activity parameters in the study area,theb-value anda-value are respectively plotted in Fig.4(e),4(f) and Fig.5(e),5(f).Combined with the velocity structure,seismic distribution and energy distribution in Fig.4(b),(c),(d) and Fig.5(b),(c),(d),the following conclusions can be obtained:(1) The crustal thickness variation in the study area is nearly 30 km,and the tectonic activity is intense.We believe that the main reason is the subduction and compression of the Indian Ocean Plate.(2) The average crustal velocity in the study area is relatively low,only 6.25 km/s,and there are large scale low-velocity anomalies in the lower crust in this area.The underplating mechanism of magma may produce abnormal low-velocity zones in the lower crust.(3) The depth of most earthquakes in the study area are between 5 and 25 km,which belongs to the upper and middle crust.The crustal material is brittle here and thus may form a seismogenic zone.(4) There are significant spatial differences in the velocity structure under the Longmenshan fault zone,and the correspondingb-value distribution exhibits obvious segmentation characteristics(Figs.3,4,and 5),as can be seen from Fig.4(e) and 5 (c).It is found that there is a certain correspondence between the segmentation ofb-value and the frequency of earthquake occurrence.(5) Most of the moderate earthquakes in Sichuan-Yunnan region occur in lowstrength regions in the crust,mostly consistent with the transition zone of positive and negative anomalies.The existence of low-velocity anomalies facilitates the concentration of stress in the brittle crust above it.(6) The thickness of the crust from the southeastern margin to the northeastern margin of the Qinghai-Tibetan Plateau decreases from~60 km to~48 km,but the thickness of the seismogenic layer gradually thickens.indicating that the crustal composition of the Northeastern Qinghai-Tibetan Plateau contains more felsic materials and the seismic activities here are relatively stronger.
 Earthquake Research Advances2020年3期
- Earthquake Research Advances的其它文章
- Research Progress of Geophysical Exploration in Karatungk Mine in Northern Xinjiang,China1
- Quick Phase Identification for Dense Seismic Array with Aidfrom Long Term Phase Records of Co-located Sparse Permanent Stations1
- Application of Machine Learning Methods in Arrival Time Picking of P Waves from Reservoir Earthquakes1
- Application on Anomaly Detection of Geoelectric Field Based on Deep Learning1
- Simulation of Silty Clay Compressibility Parameters Based on Improved BP Neural Network Using Bayesian Regularization1
- Study on the Criterion of the Correlation between Deformation Precursors and Earthquakes1
