A Novel Approach for Estimating Debris Flow Velocities from Near-Field Broadband Seismic Observations1
YU Dan ,LI Zhengyuan* ,HUANG Xinghui ,FAN Junyi and XU Qiang
1)China Earthquake Networks Center,Beijing 100045,China
2) State Key Laboratory of Geohazard Prevention and Geo-environment Protection,Chengdu University of Technology,Chengdu 610059,China
On August 7th,2010,Sanyanyu and Luojiayu debris flows triggered by a heavy rain have lashed Zhouqu City around midnight,leading to catastrophic destruction which killed 1 765 people and resulted in enormous economic loss.The ZHQ Seismic Station is located approximately 170 m west of the outlet of the Sanyanyu Gully.The seismometer deployed at the seismic station started recording seismic signals of ever-enlarging amplitude around 10 minutes before the debris flow rushed out of the Sanyanyu Gully,showing ever approaching seismic source,i.e.the debris flow.In this study,we analyze this seismic event and propose an inversion algorithm to estimate the velocity of the debris flow by searching the best-fitting pairs of envelopes in the synthetic seismograms and the corresponding field seismic records in a least-square sense.Inversion results reveal that,before rushing out of the outlet,the average velocity of the debris flow gradually increased from 6.2 m/s to 7.1 m/s and finally reached 15 m/s at approximately 0.5 km above the outlet and kept this value since then.Obviously,the ever-increasing velocity of the debris flow is the key factor for the following disasters.Compared with other studies,our approach can provide the velocity distribution for the debris flow before its outbreak;Besides,it has the potential to provide technological support for a better understanding of the disaster process of a debris flow.
Key words:Sanyanyu debris flow;Broadband seismic signals;Inversion;Debris flow velocities
INTRODUCTION
Debris flows are a type of geological disaster that may cause destructive damage to local residents and infrastructures.It is usually induced by heavy rain and then may develop in steep valleys with loose sedimentary materials.Under the situation of a large altitude difference,the gravitational potential energy of sedimentary materials is able to convert into kinetic energy and accelerates;finally,the debris materials may flow out of the outlet at a very high speed,leading to tremendous casualties and economic loss.Particularly,the velocity of a debris flow is an essential parameter to control the disaster process;however,the direct velocity measurement is challenging due to the possible destruction of the deployed devices and the data loss under the impact of debris flows.Therefore,scientists attempt to estimate their velocities using advanced techniques,including empirical equations(Fei Xiangjun,2003;Yu Bin,2008,2009;Tang C.et al.,2011),neural network methods (Xu Liming et al.,2013) and remote observations (Arattano M.,1999;Arattano M.et al.,2005).
Seismic records from both global and regional networks are conventionally used to study earthquake source dynamics and Earth's internal structures.At the same time,seismic energy generated by geological hazards including volcanic eruptions,landslides,rock collapses,and debris flows can also be recorded by the networks and used to characterize the corresponding seismic events (e.g.,De Angelis S.et al.,2007;Schneider D.et al.,2010;Dammeier F.et al.,2011;Hibert C.et al.,2011;Ekström G.et al.,2013;Petley D.N.,2013;Levy C.et al.,2015;Moretti L.et al.,2015;Chao Weian et al.,2016;Yamada M.et al.,2016;Huang Xinghui et al.,2017).In addition,seismic records could also be used to monitor river discharge (Burtin A.et al.,2008,2009,2010,2016;Tsai V.C.et al.,2012;Schmandt B.et al.,2013) and study the formation process of a barrier lake formed by landslides as well as dam collapse(Feng Zhengyi,2012).Physical experiments and field observations reveal that seismic signals of debris flows have the following characteristics:generated by the friction between the flowing and surrounding materials,the collisions inside the flow (Huang C.J.et al.,2004,2007),and the impacts from obstacles along the path;their predominant frequency is relatively high,resulting in a fast decay of seismic energy (Huang C.J.et al.,2008;Burtin A.et al.,2009);the seismic amplitude is proportional to the debris flow discharge (Huang C.J.et al.,2008).Remote and continuous observations from seismic networks provide a possibility to quantitatively estimate the velocity of debris flows.
Two debris flows struck the Zhouqu City on August 7th,2010,killing 1 765 people(Yu Bin et al.,2010).In this paper,we invert seismic signals generated by the Sanyanyu debris flow and record them at a very small epicentral distance to estimate its velocity by searching the best-fitting pairs of the envelopes in synthetic seismograms and the corresponding field seismic records.Our novel approach indicates that broadband seismic records can be used for the estimation of the average velocity of a debris flow at different stages.
1 SEISMIC OBSERVATIONS
Heavy rain hit Zhouqu City in Gansu Province on August 7th,2010,inducing two devastating debris flows that occurred at the Sanyanyu and Luojiayu catchments and almost destroyed the Zhouqu City (Yu Bin et al.,2010;Hu K.H.et al.,2012).Field investigations reveal that the Sanyanyu catchment accounts for most of the deposits (Tang C.et al.,2011).Some check dams have been constructed along the Sanyanyu Gully to mitigate debris flow hazards;their original locations (Cui P.et al.,2013) are shown in Fig.1.Unfortunately,all of them were destroyed during this catastrophic event.The ZHQ seismic station is located between the Sanyanyu Gully and the Zhouqu City,170 m away from the outlet of the gully,as shown in Fig.1.The head of the Sanyanyu debris flow reached the nearby station 2.1 minutes before rushing into the Zhouqu City (Liu Chuanzheng et al.,2011) and destroyed its power system.Before that,the seismometer had recorded at least 10 minutes of effective seismic signals as shown in Fig.2,which also contains the information of the debris flow's development.

Figure 1 Locations of the ZHQ Seismic Station (red solid star) and the Sanyanyu Gully (red solid line).Black short lines denote the location of the man-made check dams
Previous studies suggest that the seismic signals recorded at the ZHQ seismic Station are mainly generated by the Sanyanyu debris flow for the following four reasons,(1)approximately 64% of the deposits originated from the Sanyanyu drainage area (Tang C.et al.,2011);(2) the ZHQ seismic Station is much closer to the Sanyanyu Gully than the Luojiayu Gully;(3) characteristics of stages and sub-stages recognized from the spectrum of seismic signals can be well explained when they are back-projected to the Sanyanyu Gully using a velocity of 10 m/s(Huang Xinghui et al.,2017);(4) the Doppler effect shown by seismic signals indicates that the main movement direction of the source is from north to south,which is consistent with the shape of the Sanyanyu Gully (Huang Xinghui et al.,2020).Fourier analysis shows that the peak frequency of seismic signals is around 5 Hz,and seismic energy distributions in the frequency domain satisfy a double-exponential model(Huang Xinghui et al.,2020).Doppler Effect is also illustrated by analyzing the peak frequency of seismic records and amplitudes from different components.The spectrum of seismic signals can be divided into three parts with distinct frequency characteristics (Huang Xinghui et al.,2020).They are believed to be generated when the debris flow moved into the initiation area,colluvial deposit area,and transport area,respectively (Huang Xinghui et al.,2017).
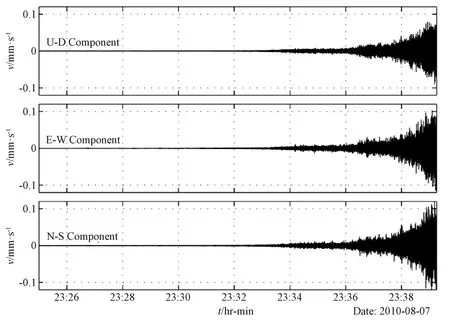
Figure 2 Seismic waveforms at the ZHQ seismic station for the Sanyanyu debris flow
2 METHODS
2.1 Overall Idea
The seismic source model of earth surface dynamic processes,which includes landslides,avalanches,and debris flows,can be better represented by a Single Force (SF)model (e.g.,Kanamori H.et al.,1982,1984;Hasegawa H.S.et al.,1987;Dahlen F.A.,1993;Fukao Y.,1995).In computational seismology,the source could be approximated as a fixed point source when its horizontal dimension is negligible compared with the epicentral distance (e.g.,Allstadt K.,2013;Yamada M.et al.,2013;Hibert C.et al.,2014;Li Zhengyuan et al.,2017,2019).However,the seismic source of a debris flow cannot be considered as fixed any more since it always moves several kilometers,although the point assumption is still valid.Therefore,we treat the debris flow source as a moving point source;hence the velocity could be inverted as a parameter by searching the best-fitting pairs of recorded and synthetic seismograms.
However,we cannot directly compare seismic signals since they mainly contain highfrequency energy generated by multiple processes including small-scale sources and heterogeneities in elastic media that cannot be simulated using a simple kinematic source model.Thus,a compromise is made here by comparing their envelopes in which we fit piecewise slopes.Definitely,the slopes contain low-frequency information.The amplitude of envelopes at the station is determined by both the discharge at the source and the epicentral distance that controls energy decay.Normally,the epicentral distance is so large that the effect of the debris flow movement on the epicentral distance is negligible.In this situation,the amplitude is proportional to the debris flow discharge at the source (Huang C.J.et al.,2008).However,when the length of the debris flow motion is comparable to the epicentral distance,the effect must be considered.Our study case is an extreme situation.In detail,the seismic station is located within the horizontal range of the debris flow and the epicentral distance is purely determined by the location of the moving mass.After collecting materials in the initiation area and colluvial deposit area,the total flowing mass of the debris flow reached a constant value when it moved in the following path.Its flowing speed also tended to be stable at around 10 m/s (Tang C.et al.,2011;Huang Xinghui et al.,2017).In this situation,the variation of the amplitude is mainly controlled by the epicentral distance.
We assume that the discharge of the Sanyanyu debris flow has reached a constant value when it flowed after the colluvium deposit area,generating seismic signals with stable amplitude at the source,and the amplitude variations at the ZHQ seismic station were purely caused by the changes of the epicentral distance.Then,we calculate synthetic seismograms using a seismic source with constant discharge and a series of velocity distributions.Finally,the best set of velocity distribution can be obtained by searching the best-fitting pairs of envelopes of synthetic and recorded seismic signals.Since the source discharge is assumed to be constant,we normalize the envelopes to simplify computation in the inversion.When the source discharge differs greatly from its constant value,the inversion results could be distorted.Therefore,we only select the last~1 km for the inversion as shown in Fig.1.In addition,due to the influence of the Doppler Effect on the amplitudes of the horizontal components (Huang Xinghui et al.,2020),we only use the vertical component of the seismic records to constrain the inversion.We first calculate synthetic seismograms using an initial velocity and then adjust the velocities at different stages to search the best-fitting envelopes.
2.2 Synthetic Seismograms for the Sanyanyu Debris Flow
A debris flow is an earth surface dynamic process whose source is better represented by an SF model.A fixed-point assumption for the source is satisfied for seismic stations with an epicentral distance that is much larger than the spatial scale and motion range of the event.Under the assumption,synthetic seismograms for given locations of a seismic source and a seismic station can be expressed as follows (e.g.,Li Zhengyuan et al.,2017):

Where Δtis the time sampling interval,smis themth seismic record,fiis theith component force,Gimis the Green's Function offitosmand is calculated using the matrix propagation method (Wang Rongjiang,1999).The velocity model is derived from the Crust1.0.Even though the materials in the debris flow is spatially smaller than the scale of the epicentral distance,making the point source model to be seemingly rational,the motion range of the debris flow is always comparable to the distance.Thus,the motion range becomes a nonnegligible factor and we treat the seismic source as a moving point source in the calculation.The peak velocity of the Sanyanyu debris flow is estimated to be 9.7 m/s using empirical equations (Tang C.et al.,2011) and an average velocity of 10 m/s is adequate to rebuild its evolution process (Huang Xinghui et al.,2017);therefore,we choose the 10 m/s movement velocity of the debris flow as an initial velocity for calculation in the model where the source moving along the gully.For each computation step,we first determine the source location using the moving velocity and then calculate synthetic seismograms at the step and superpose them to the final results.The synthetic seismograms in Fig.3 show that the outlines of the synthetic seismograms and field observations are very similar,especially for the U-D component.The similarity for the EW and NS components is slightly weaker in detail,probably due to the Doppler Effect.
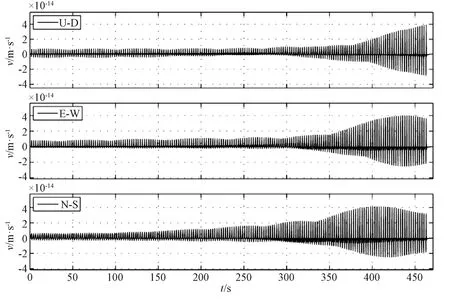
Figure 3 Synthetic seismograms for the Sanyanyu debris flow calculated using a moving point source model with a velocity of 10 m/s
2.3 Inversion Methods and Processes
Several debris flows have occurred in the Sanyanyu Basin in the past several decades.To mitigate the debris flow hazards in the surrounding area,a number of check dams were built along the main channel before the outbreak of the debris flow.Their locations are shown in Fig.4(a).In addition,several large-scale rock collapses were induced by heavy rains and the materials accumulated in the gully,forming natural barrier dams.Unfortunately,all of these dams collapsed during the disaster,and the wasting materials provided sources for the debris flow in turn.The man-made and natural dams,as well as their collapsed fragments,played important roles in movement characteristics of the debris flow.We suggest that the dams are key places for velocity change and thus the velocity between each two successive dams is relatively constant.Therefore,we divide the last 1.16 km of the Sanyanyu Gully into 5 sections based on the location of the dams,as shown in Fig.4(a),and then calculate the average velocity of the debris flow in each section.
The inversion is conducted backward from the end of the Sanyanyu Gully section by section.We first fix the endpoint of the synthetic and recorded seismograms and minimize the objective function for the current section by stretching or squeezing the envelope of synthetic seismograms in the time domain.Once the best-fitting one is obtained,the average velocity in this section is determined as the ratio of the section distance and the time.The objective function is defined as follows:
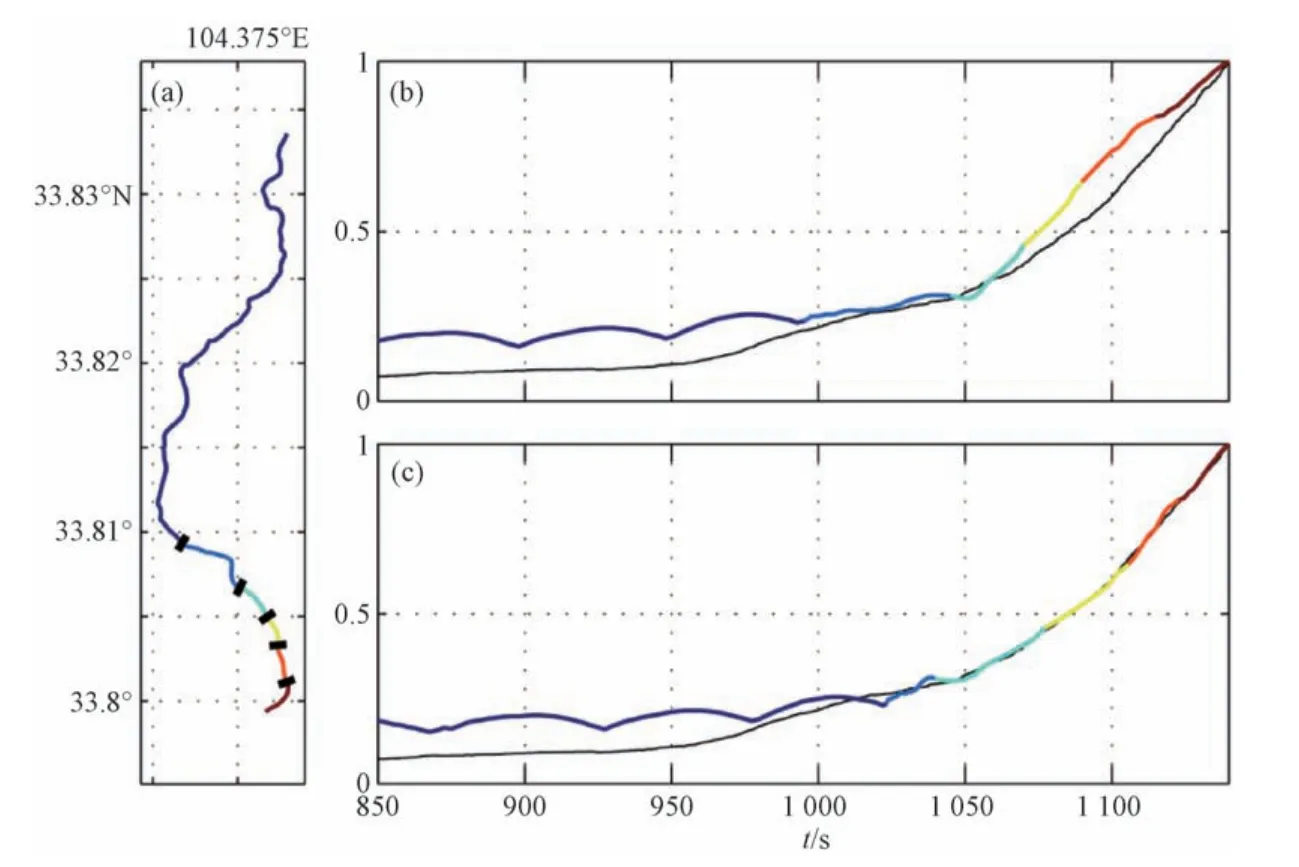
Figure 4 (a) Sections of the Sanyanyu Gully used for calculation.Sections 1 to 5 are denoted by a light blue line,a cyan line,a yellow line,a red line,a dark red line,respectively.Black shorts lines represent check dams;(b) and (c) are envelopes of recorded (black line) and synthetic (color lines) seismograms before and after the inversion,respectively.

Where,EsandEoare the envelopes for synthetic seismograms and field seismic waveforms,respectively.Envelopes for the field observations and synthetic seismograms that are calculated using a velocity of 10 m/s are shown in Fig.4(b).Furthermore,Fig.4(c)exhibits the best-fitting envelope after the inversion.The best-fitting velocity distribution is shown in Fig.5(a).
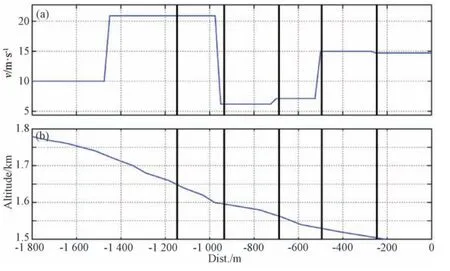
Figure 5 (a) The inverted mean velocity of the Sanyanyu debris flow in different stages;(b) The altitude of the Sanyanyu Gully.Black vertical solid lines represent the location of the check dams
3 DISCUSSION AND RESULTS
The last 1.16 km of the Sanyanyu Gully is divided into 5 sections based on the location of the dams,as shown in Fig.4.The length of these sections are 210 m,250 m,200 m,250 m,and 250 m,respectively.The average velocity of the debris flow in these five sections are estimated to be 20.9 m/s,6.2 m/s,7.1 m/s,15.0 m/s,and 14.7 m/s respectively using the previously described approach.Since our approach is based on the assumption that the discharge at the source is constant.However,it is actually everincreasing and reaches a constant at the end sections,leading to increasing errors as the calculation moving forward.The inversion results show a relatively large velocity in the first section,reaching 20.9 m/s.A large velocity represents a fast increase in the amplitude of seismic records or the increase of the flowing mass.Therefore,we consider that except the first one,other inversion results are reliable and the details are discussed below.The inversion results are consistent with those estimated using empirical equations in magnitude(Tang C.et al.,2011),yet the spatial resolution is higher.It shows that divided by the last but one checking dam,the debris has a low-velocity area containing the second and third section,and a high-velocity area consisting of the following sections.The average movement velocity is 6.2 m/s in the second section and increases a little to 7.1 m/s in the third section.One main reason for the low velocity in these two sections is that the slope of the gully is extremely small in the second section.As shown in Fig.5(b),the gully slope in the third section is large and thus the velocity increases,resulting in a slightly larger average velocity in this section and significantly larger average velocity of~15 m/s in the following sections.Besides,it should be noticed that the velocity is calculated as the average value during each given section.Therefore,it does not mean that the velocity of the debris flow increases to 15 m/s immediately after the third section.The debris flow maintains high average velocity in the following two sections until it rushes out of the gully.It should also be noted that since the inversion is based on the assumption of a constant moving mass,the velocity of the first and second sections could be slightly overestimated.These two sections are located above the joint of the Dayu Gully and the Xiaoyu Gully.Therefore,the moving mass in these two sections could be slightly less than the assumed value in the following sections due to the additional moving mass from the Xiaoyu Gully.This inversion approach is specially designed according to characteristics of the debris flow.It uses the normalized envelopes of seismic records to calculate the objective function.We use the shape of the seismic records in the inversion to represent their low-frequency characteristics.Such method is also consistent with the basic principles in seismic inversion.Errors could be introduced when conducting the normalization step.Therefore,we only calculate the last stages of the debris flow to minimize the errors.However,if the mass of the flowing materials could be acquired through other manners,this problem could be solved and the inversion results could be more reliable.Compared with other approaches,our method has the advantage that it uses continuous seismic records to estimate the velocity of the debris flow,providing information during the whole process of the event.If an experimental area could be selected and seismic stations could be deliberately designed for the debris flow research,our method,combined with other approaches could help study the occurrence process and mechanism of debris flows.
4 CONCLUSIONS
We analyze seismic records generated by the Sanyanyu debris flow with a duration of about 15 minutes.The movement velocity of the debris flow during the last 1.16 km are estimated for the first time by piecewise searching the best-fitting pairs of the envelopes of synthetic seismograms and seismic records.The inversion results are consistent with that estimated using empirical equations.The results exhibit a low-velocity area and a highvelocity area divided by the last but one check dam.Before rushing out of the outlet,the average movement velocity of the Sanyanyu debris flow gradually rises from 6.2 m/s to 7.1 m/s and finally reaches 15 m/s after passing the last but one checking dam.This result is also supported by the terrain data.Our approach provides a novel way to estimate movement velocity of a debris flow before its occurrence and it is expected to provide important technical support for a better understanding of the disaster process of a debris flow in the future.
ACKNOWLEDGEMENT
We would like to thank Wei Xing from the China Earthquake Networks Center for his helpful comments on seismic wave recognition.We also thank Professor Yuan Daoyang,Zeng Wenhao,Hao Zhen,and Niu Yanping from the Lanzhou Institute of Seismology for their kindly helps in field investigations.
 Earthquake Research Advances2020年3期
- Earthquake Research Advances的其它文章
- Research Progress of Geophysical Exploration in Karatungk Mine in Northern Xinjiang,China1
- Quick Phase Identification for Dense Seismic Array with Aidfrom Long Term Phase Records of Co-located Sparse Permanent Stations1
- Application of Machine Learning Methods in Arrival Time Picking of P Waves from Reservoir Earthquakes1
- Application on Anomaly Detection of Geoelectric Field Based on Deep Learning1
- Simulation of Silty Clay Compressibility Parameters Based on Improved BP Neural Network Using Bayesian Regularization1
- Study on the Criterion of the Correlation between Deformation Precursors and Earthquakes1
