Characteristics of the AE Distribution and Triggering Mechanism of a Simulated Meter-Scale Fault after Stick-Slip Events1
HOU Jinxin ,XIE Fan* ,REN Yaqiong and WANG Baoshan
1)Key Laboratory of Seismic Observation and Geophysical Imaging,Institute of Geophysics,China Earthquake Administration,Beijing 100081,China
2)School of Earth and Space Sciences,University of Science and Technology of China,Hefei 230026,China
With the more complete acoustic emission(AE) catalog improved by the multi-channel AE matched-filter technique (MFT),we study the spatiotemporal evolution of the AE activities after laboratory stick-slip events incorporate with the slip data recorded by displacement transducers on an~1.5 m granite fault.The results show that the number of the AE events identified by MFT is about 9 times larger than that of the traditional method.A logarithmic expansion of early AE events along the fault strike is observed as a function of time,whereas the fault does not slip in the same manner.Thus,we related the expansion of the early AE events along the fault to the stress transfer caused by the adjacent AE events.Moreover,there is a good correlation between the cumulative number of the later AE events and the amount of fault slip.It suggests that the stress change caused by the continuous slip of the simulated fault after the stick-slip events response for the later AE events near or on the simulated fault.
Key words:Stick-slip;Acoustic emission matched-filter technique;Spatiotemporal evolution;Fault slip
INTRODUCTION
The stick-slip experiments in laboratory has been an important means to study the mechanism of different types of earthquakes in the past decades.Compared with field observations which is hard to collect,acoustic emission (AEs) and displacements can be observed during the experiment.The AE signals during the stick-slip have similar properties to natural seismic waves (Lockner D.,1993;McLaskey G.C.et al,2014).The displacement measurement is more precise and easier to deploy at laboratory scale.
Amount of studies have been focused on the relationship between AE activities and fault slip behavior.For example,Mclaskey G.C.et al.(2014) analyze the AE activities and fault slips before the stick-slip in the laboratory,and suggest that the accelerating slip plays an important role the fault instability;Zhuo Yanqun et al.(2018) investigate the relationship between tremor-like signals and fault slips prior to the stick-slip events based on analysis the spatio-temporal evolution of AE activities and changes of AE dominant frequency.However,limited studies focus on the relationship between AE activities and slips after stick-slip events.
The aim of our work is to study the relationship between AE activities and fault slips by analyzing the spatiotemporal evolution of fault slips and AE activities on a simulated meterscale fault after stick-slip events.
In order to obtain more weak AE events,we develop the multi-channel AE matchedfilter technique (MFT) .With this technique and improved distribution of receivers along the fault,it is capable to analyze the fault slip behavior after stick-slip events in a more precise way.
1 EXPERIMENTAL SETUP
The experiment is conducted on a horizontally bilateral servo-hydraulic loading system at the Key Laboratory of Seismic Observation and Geophysical Imaging,Institute of Geophysics,China Earthquake Administration.The loading capacity in force and size is 2 000 kN and 1.3 m (Length) by 1.3 m (Width) with a height of 1.0 m,respectively.The sample used in this experiment is a natural granite from Fangshan County at Southeast Beijing,China.It is 1.1 m (East) × 1.1 m (North) × 0.2 m (Thickness) and diagonally cut by a~1.5 m simulated fault inside (Fig.1).
In order to capture AE signals,we glue 16 identical broadband piezoelectric transducers(PAC-ωsα,bandwidth:0.1 MHz-0.9 MHz) on both sides of the simulated fault on the upper surface of the sample.The cylindrical transducer has a radius of 19 mm and a height of 27.4 mm.The signal is recorded with a sampling rate of 3 MHz by passing through a 40 dB pre-amplifier
In addition,we deploy 8 displacement transducers across the simulated fault for observing the slip evolution (Fig.1).The displacement transducer is measured by a Linear Variable Differential Transformer.The range of the measurement is 5 mm,and the resolution is better than 0.5 μm.
The loading process is as follows:these two directions (East and North) are loaded to 200 kN simultaneously,then we keep the east direction with the constant pressure and load the north direction with a velocity of 10 μm/s and 1 μm/s,respectively.The variations of shear stress and displacement with time are shown in Fig.2,in which each sudden drop of shear stress corresponds to a stick-slip event (termed as SSE below).
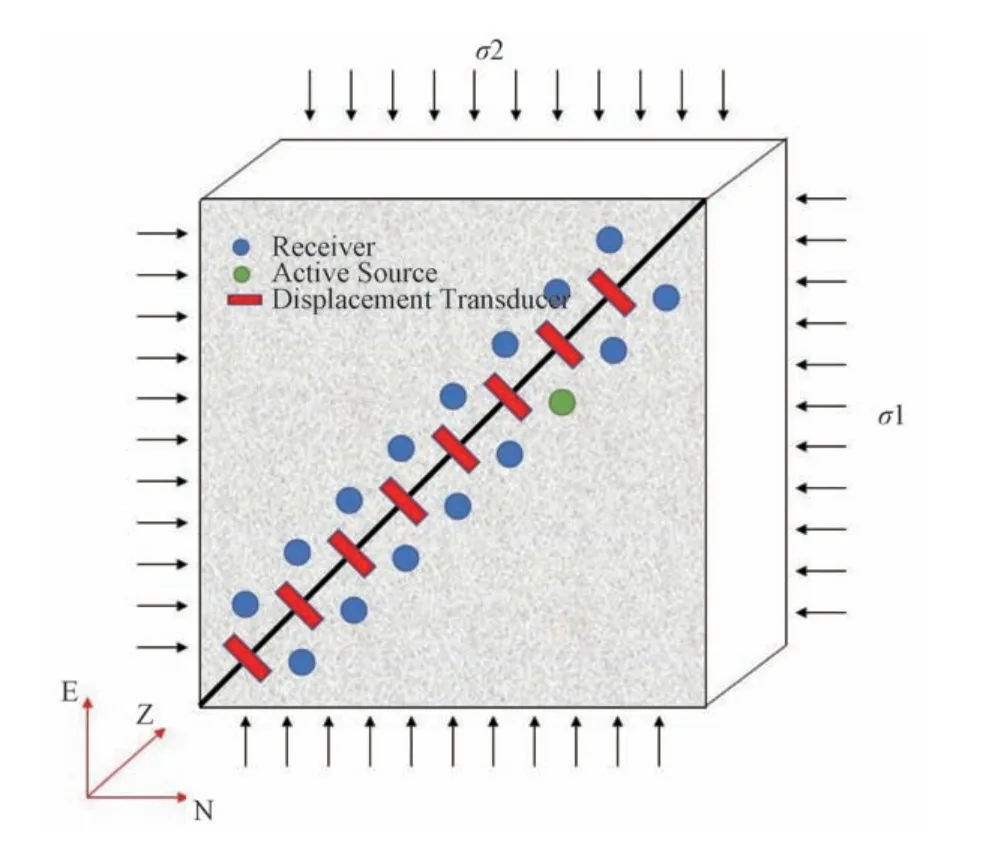
Figure 1 Experiment Setup Blue dots mark the piezoelectric transducers,red rectangles represent the displacement transducers,the green dot denotes the active source,and the solid black line denotes the simulated fault
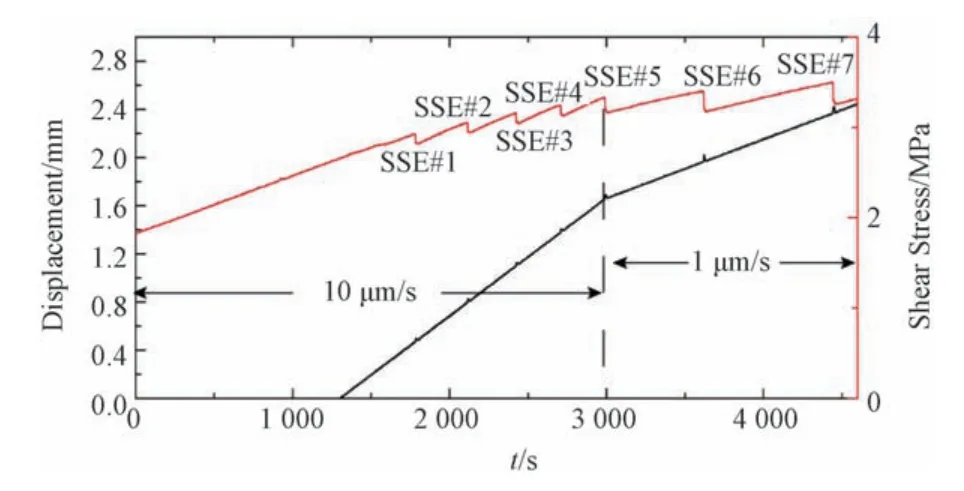
Figure 2 Variation of displacement and shear stress with time The black line and red line denote the variation of displacement and shear stress over time,respectively
2 DATA PROCESSING
2.1 Displacement Data
In order to remove the high-frequency noise,we downsample the raw displacement data (sampling rate,6 × 106Hz) by a decimation factor of 60 and then smooth it with 10 data points,leading to a resolution of 0.1 ms.Due to the different recording systems of AE and displacement,we roughly define the time when displacement begins to increase sharply as the start of stick-slip.Since the displacements recorded by different displacement transducers are similar (Fig.3),we only plot the displacement deriving from the transducer No.8,which locates at the SW segment of the simulated fault (Fig.4).Besides,the displacement is set zero at the beginning of the stick-slip event.
Fig.4 shows the variation of displacements with time around different stick-slip events.Among them,the variation of displacement after SSE#4 and SSE#5 can be simply defined by two stages,i.e.Phase I for fast sliding and Phase II for slow sliding (Fig.4(a),(b)).Compared with SSE#4,SSE#5 shows a larger slip.Since the loading rates before SSE#4 and SSE#5 are the same,and the loading rate after SSE#5 changes from 10 μm/s to 1 μm/s,we suggest that the larger fault slip after SSE#5 is related to the readjustment of the simulated fault caused by the change of the loading rate.The trend of displacement after SSE#6 and SSE#7 is similar,which can be roughly divided into four stages,i.e.,Phase I(fast sliding);Phase II (relatively slow sliding);Phase III (fast sliding);and Phase IV(slow sliding).The existence of Phase I and Phase III after SSE#6 and SSE#7 is due to the two large sub-events which are far away in time.

Figure 3 The displacements recorded by transducers after different stick-slip events
2.2 Construction of the Template Catalog
Based on the information of the recognition,location,and magnitude estimation of the AE events,we construct a template catalog,which is required for the MFT.
The modified energy ratio method (MER),(Liu Han et al.,2014) is used to recognize the AE signal automatically.Here we adopt a moving window with 500 data points and a one-data step to scan every transducer using the MER method.After scrutinizing the MER trace,we assume that an AE signal is recognized if the maximum value of MER exceeds the fixed threshold 8 in every 50 data points.The time corresponding to the maximum value of MER in each transducer is supposed to be the P-arrival time.Then,the AE signals recorded by different receivers are clustered into the AE events according to the relationship between the distance and travel time on different transducers.The detailed information regarding the specific parameter settings are described in Hou Jinxin et al.(2020).
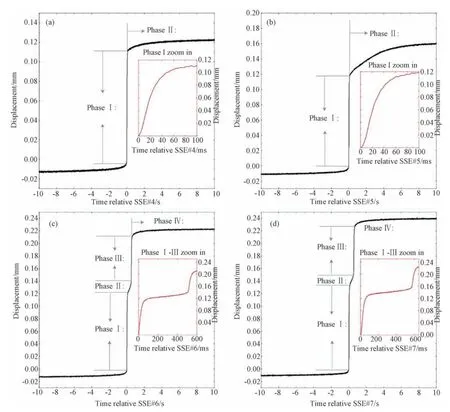
Figure 4 Variation of displacement over time recorded by displacement transducer No.8 around different stick-slip events The time of zero displacement is defined by the occurrence of a stick-slip event.The red figures in (a),(b),(c),and (d) are the enlarged figures of different stages after the stick-slip events,in which (a),(b) are the enlarged figures of Phase I,(c) and (d) are the enlarged figures of Phase I-III
Since no transducer is placed on the bottom of the sample,here we apply a 2-D location by inversion of the P-wave arrival times.The arrival time is picked manually and the P-wave velocity of 3 600 m/s is obtained by calculating the mean velocity from the active source to all transducers.Based on the absolute location method proposed by Mahajan A.et al.(2001),we locate 211 AE events around the 20s of each stick-slip event after removing the events recorded by less than four transducers.
As the slip amount of each stick-slip event is known,the magnitude of each stick-slip event is estimated by the formulaM0=μDA(Aki K.,1966) and the formulaMW=0.67 ×log(M0) -6.07(Kanamori,1977),whereμis the shear modulus (~23GPa for granite);D is the displacement (i.e.,0.11 mm,0.12 mm,0.12 mm,and 0.13 mm for SSE#4,SSE#5,SSE#6,SSE#7,respectively) and A is the simulated fault surface area (~0.3m2).After substituting the momentM0intoMW,the moment magnitude of SSEs is obtained.The values are -2.16,-2.13,-2.13,and -2.11,respectively.
In addition,due to the amplitude saturation of each SSE,we cannot estimate the magnitude of the AE event by the ratio of amplitude between the AE events and the SSEs.Here we estimate the relative magnitude of the AE events by the formulaM=log(Amax),whereMis the short of relative magnitude;Amaxis the maximum magnitude of a window with 500 sample points starting at P-arrival time.The locations of the AE events around the SSE#5,SSE#6,and SSE#7 are shown in Fig.5.
As shown in Fig.5,the AE events are not evenly distributed along the simulated fault.Only few AE events occur before the SSEs,most AE events and these four SSEs are located at the SW segment of the simulated fault,suggesting the non-uniformity of the simulated fault.
3.3 Improving AE Catalog Using MFT
We perform the MFT for searching the small AE events between 20 s before and 20 s after each stick-slip event using the template catalog.The basic procedures of MFT can be found in Hou Jinxin et al.(2020) and Fig.6.Here,we only describe some key parameters and precautions.
Due to fewer component (1-component) of laboratory transducers than the 3-component seismic stations,we choose a longer window (800 data points starting at P-arrival) which roughly contains the complete waveform of most AE events,instead of sperate windows around P-or S-arrival in field earthquakes.In addition,we suggest that an AE event is detected if the largest mean cc value within a window of 300 data points exceeds 12 times the median absolute deviation (MAD) of the mean cc trace.
Within the 20s before and after each stick-slip,we get 1 915 detections (termed as detected catalog below),among which 210 AE events are templates and 1 705 AE events are newly detected,a factor of about 9 increases.
Fig.7 shows a comparison of AE activities between the detected catalog and template catalog around SSE#7.Some small AE events are newly detected.Although the completeness of magnitude is slightly reduced from 1.5 to 1.3 (Fig.7(b)),some large AE events with a relative magnitude larger than 2 are detected right after the stick-slip event(Fig.7(a)).We suggest that the missing large AE events in the template catalog should be related to the coda wave intervention of the stick-slip events.
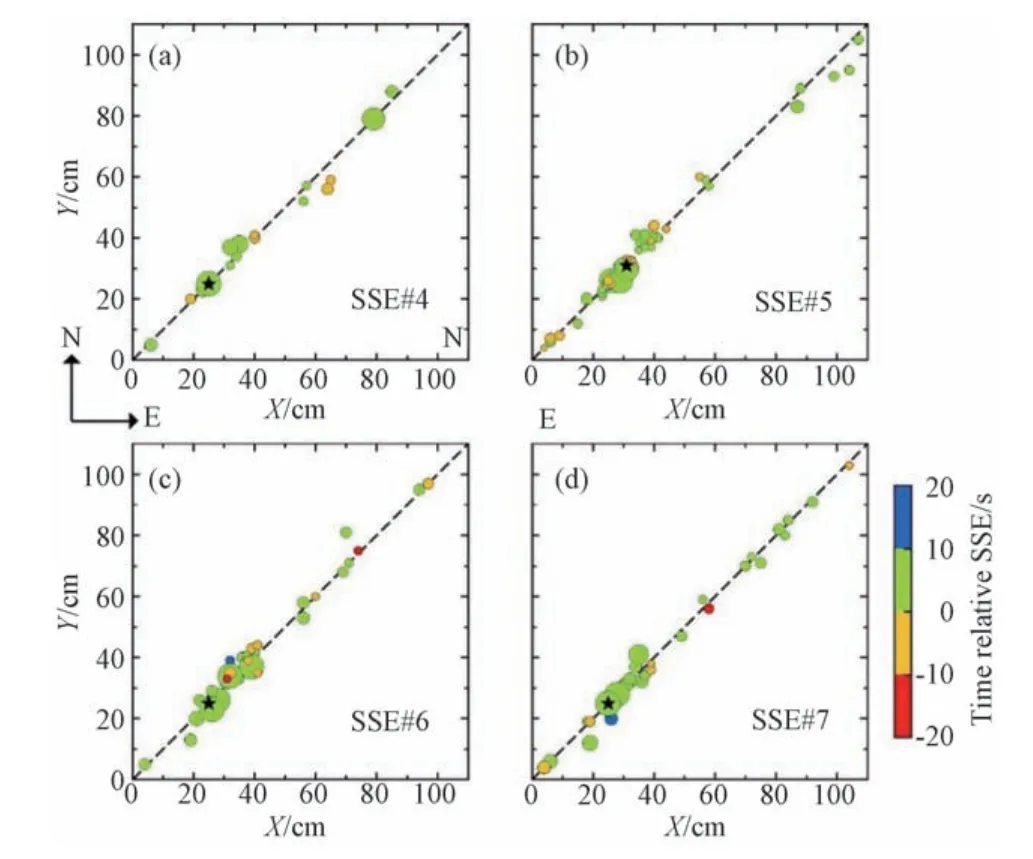
Figure 5 Locations of the AE events in template catalog around different stick-slip events The dashed line denotes the simulated fault,the star denotes the initial rupture point of the stick-slip event,dots with different colors represent the AE events with different relative magnitudes
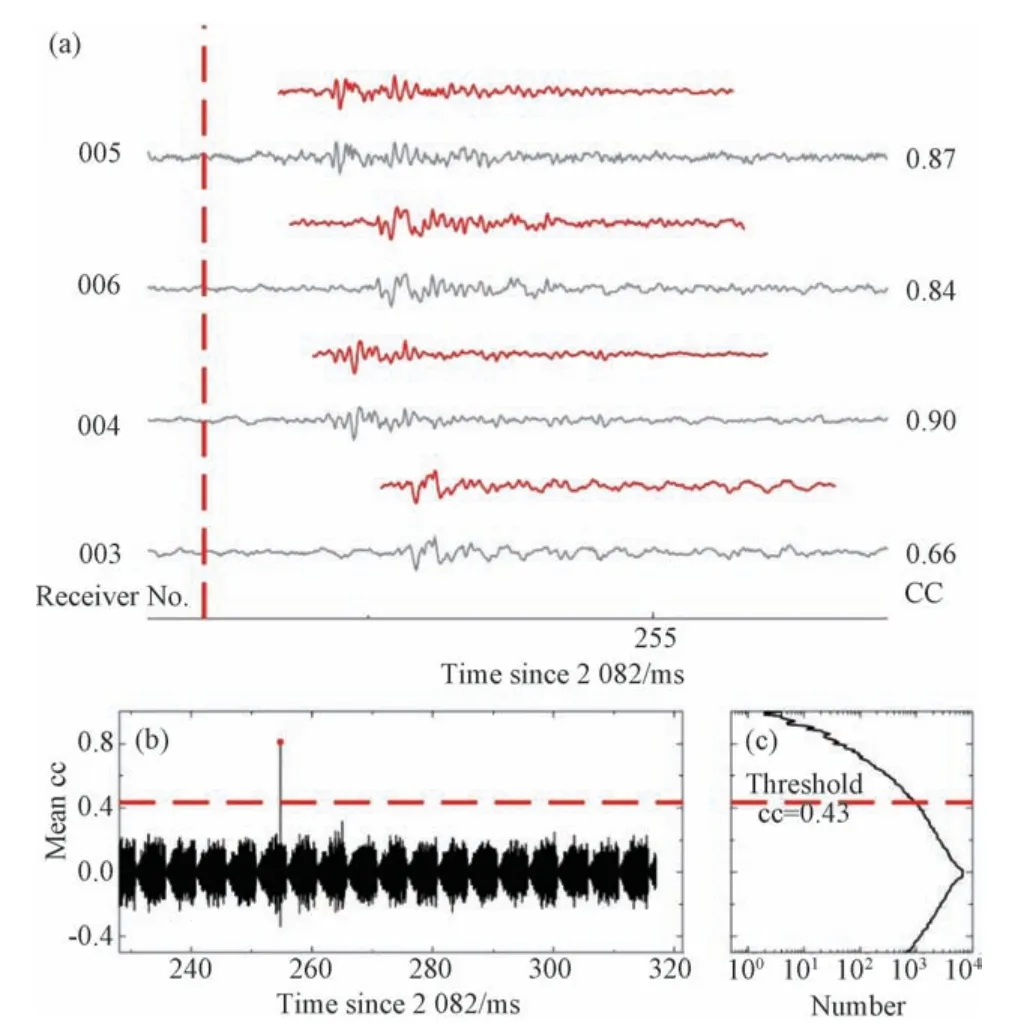
Figure 6 An example showing the matched filter technique
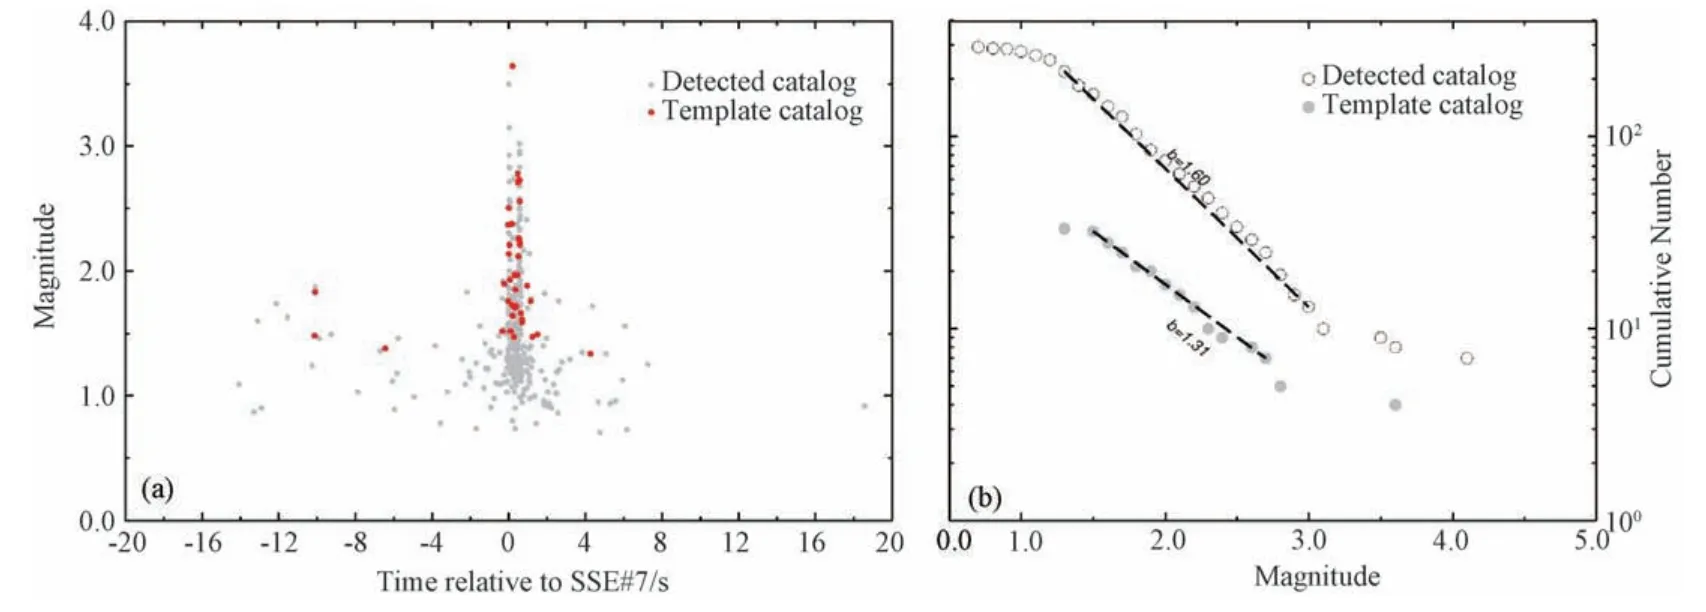
Figure 7 Comparison of AE activities between detected catalog and template catalog around SSE#7
4 RESULTS
4.1 The Relationship between the Cumulative Number of AE Events and the Slip Amount
Fig.8 shows the cumulative number of AE events and the slip amount with time after different stick-slip events.Although the cumulative number of AE events and the simulated fault slip show different variations after different stick-slip events,they correlate well in the slow-sliding stage after the same stick-slip event.In phase II after SSE#4,the slip amount and the cumulative number of AE events increase linearly with logarithmic time.By contrast,in phase II after SSE#5,the slip amount and the cumulative number of AE events increase nonlinearly with time.After SSE#6 and SSE#7,the variation of simulated fault slip and the cumulative number of AE events is similar,the slip amount and the cumulative number of the AE events correlate well in Phase and Phase,showing a large increase and a slow increase,respectively.
Overall,the cumulative number of AE events and the slip amount after the same stickslip event show good consistency with the time in the slow-sliding stage of the simulated fault slip,indicating that the AE events should be related to the continuous slip of the simulated fault near or on the fault.
4.2 Spatio temporal Evolution of the AE Events after Stick-Slip Events
Fig.9 shows the spatiotemporal evolution of AE events and simulated fault slip along the fault after SSE#4,SSE#5,SSE#6,and SSE#7.As all the AE events are near or on the fault,we project all the AE events on the fault.Additionally,we adopt the logarithmic time to highlight the spatiotemporal evolution of early AE events.As shown in Fig.9,the early AE events first appear near the initial rupture point of the stick-slip events (at the SW segment of the simulated fault).Then,the AE events show the characteristics of expansion along the fault with logarithmic time(as shown by the green dotted line in Fig.9).Although the expansion of AE events along the fault after SSE#4 is not obvious,it also shows that the early AE events initially appear at the SW segment of the simulated fault.

Figure 8 The cumulative number of AE events and slip amount with time after different stick-slip events The red line represents the cumulative number of AE events,and the black line represents the simulated fault slip
The simulated fault shows the characteristics of almost simultaneous slip,which is different from the characteristics of AE events expansion along the simulated fault.Moreover,it seems that the area with larger slip has fewer AE events.For example,the area with a large amount of slip ranging from 60-80 cm,100-120 cm is along the simulated fault after SSE#4,SSE#5 and SSE#6,and the area ranging from 60 to 80 cm is along the simulated fault after SSE#7.
5 DISCUSSION
Based on the information provided by the displacement transducers along the simulated fault,we first analyze the variation of fault slip with time after the stick-slip events.After the same stick-slip event,the variation of slip recorded by different displacement transducers is similar.By observing the slip amount and its duration in the fast-sliding stage of the simulated fault,the slip velocity right after the stick-slip event in this experiment is about 1.2 mm/s and show the characteristics of almost simultaneous slip,indicating that the stickslip in our experiment should be a slow stick-slip event (Mclaskey G.C.et al.,2017).In addition,the slip shows different variations with time after different stick-slip events.The variation of slip after SSE#4 and SSE#5 is similar,which can be divided into a fast-sliding stage and a slow-sliding stage.After SSE#6 and SSE#7,the simulated faults have experienced two obvious fast-sliding stages,which should be associated with the existence of two sub-events with a long time interval.

Figure 9 Spatio-temporal evolution of AE events and slip along the simulated fault after different stick-slip events The red star denotes the initial rupture point of the stick-slip event,red dots represent the AE events whose size scales are proportional to the relative magnitude of the AE events,and the green dashed line marks the approximate slope of early AE events along the simulated fault
In order to improve the completeness of the AE catalog,we use the multi-channel AE matched-filter technique for searching the small AE events.Although the window (starting at P-wave) in our investigation is different from that (separate windows starting at P-arrival or S-arrival) used in field earthquakes,the results show that the detection ability is same as that of most natural earthquake studies using the same threshold (the number of detection events is about 9 times of the template events) (Meng Xiaofeng et al.,2013),implying that it is feasible to use long window as a template.
Combing the improved AE catalog and slip data,we analyze the relationship between AE events and simulated fault slip.The results show that there is a good correlation between the cumulative number of AE events and slip amount in the slow-sliding stage after the same stick-slip event,suggesting that the AE should be related to the fault slip.In fact,some similar phenomena have been observed in field earthquakes (Perfettini H.et al.,2005;Hsu Y.et al.,2006).Taking advantage of numerical simulation,Perfettini H.et al.(2007)suggest that afterslip is the main mechanism of aftershocks near the fault.However,the conditions in our experiment do not meet the requirements (brittle creep,etc.) in Perfettini H.et al.(2007) numerical simulation.Moreover,it should be noted that the cumulative number of the AE events and the slip amount does not show a good correlation in the fastsliding stage of the simulated fault.The possible reason is the existence of missing small AE events due to the fast sliding,or a different triggering system in the fast sliding stage.
According to the spatio-temporal distribution of AE events,the early AE events after all the stick-slip events show the characteristics of expansion along the fault with logarithmic time.However,the simulated fault shows the characteristics of almost simultaneous slip,which is different from the characteristics of the AE events.Thus,the expansion of early AE along the fault may be related to the stress transfer caused by adjacent AE events.In addition,it seems that the area with larger slip has fewer AE events,which is similar to the phenomenon that aftershocks in field earthquakes mostly occur in areas with a smaller slip(Mendoza C.et al.,1988).
Due to the limited scale of the sample,physical environment,loading conditions and other factors in this experiment,the simulated fault shows the characteristics of almost simultaneous slip,which is not similar to the feature that the slip or seismic radiation energy during earthquakes generally expands along the fault from the epicenter(Zhang Yong et al.,2009;Huang Taizi et al.,2019).However,the feature of slip gradually increasing with the logarithmic time in our experiment is similar with the characteristics of post-deformation in field earthquakes (Savage J.C.et al.,2008),and the seismicity related to post-earthquake deformation usually shows the characteristics of migration with logarithmic time along the fault(Kato N.,2007;Perfettini H.et al.,2018).
6 CONCLUSIONS
In this paper,with a more complete acoustic emission (AE) catalog improved by the multi-channel AE matched-filter technique (MFT),we investigate the spatiotemporal evolution of the AE activities after stick-slip events using the slip data recorded by displacement transducers.The results show that the number of AE events identified by the MFT increase by a factor of 9.After the stick-slip events,the early AE events show the characteristics of expansion along the fault with logarithmic time.In addition,the cumulative number of AE events in the slow-sliding stage is consistent with the slip amount in time,and the AE events are mostly distributed in the area where the slip amount is small.Compared with the previous simulation results and some field earthquake studies,we suggest that the stress change caused by the continuous slip of the simulated fault after the stick-slip event plays an important role in the generation of AE events near or on the fault.
ACKNOWLEDGEMENT
We thank Profosser Peng Zhigang for sharing the code of matched filter technique.This manuscript benefits from constructive review comments by two anonymous referees.The figures in our work are plotted with the software package of generic mapping tools (e.g.,Wessel P.et al.,2013).
 Earthquake Research Advances2020年3期
- Earthquake Research Advances的其它文章
- Research Progress of Geophysical Exploration in Karatungk Mine in Northern Xinjiang,China1
- Quick Phase Identification for Dense Seismic Array with Aidfrom Long Term Phase Records of Co-located Sparse Permanent Stations1
- Application of Machine Learning Methods in Arrival Time Picking of P Waves from Reservoir Earthquakes1
- Application on Anomaly Detection of Geoelectric Field Based on Deep Learning1
- Simulation of Silty Clay Compressibility Parameters Based on Improved BP Neural Network Using Bayesian Regularization1
- Study on the Criterion of the Correlation between Deformation Precursors and Earthquakes1
