Microseism Variations in Response to Antarctic Seasonal Changes in Sea Ice Extent1
XU Xiaoqing ,LIN Jianmin and FANG Sunke
1) Marine Acoustics and Remote Sensing Laboratory,Zhejiang Ocean University,Zhoushan 316021,China
2) Key Laboratory of Ocean Observation-Imaging Testbed of Zhejiang Province,Ocean College,Zhejiang University,Zhoushan 316021,China
3) State Key Laboratory of Marine Geology,School of Ocean and Earth Science,Tongji University,Shanghai 200092,China
The temporal and spatial distributions of Antarctic sea ice play important roles in both the generation mechanisms and the signal characteristics of microseisms.This link paves the way for seismological investigations of Antarctic sea ice.Here we present an overview of the current state of seismological research about microseisms on Antarctic sea ice.We first briefly review satellite remote-sensing observations of Antarctic sea ice over the past 50 years.We then systematically expound upon the generation mechanisms and source distribution of microseisms in relation to seismic noise investigations of sea ice,and the characteristics of Antarctic microseisms and relationship with sea ice variations are further analyzed.We also analyze the continuous data recorded at seismic station BEAR in West Antarctica from 2011 to 2018 and compare the microseism observations with the corresponding satellite remotesensing observations of Antarctic sea ice.Our results show that:(1) the microseisms from the coastal regions of West Antarctica exhibit clear seasonal variations,SFM with maximum intensities every April-May and minimum intensities around every October-November; while DFM intensities peak every February -March,and reach the minimum around every October.Comparatively,the strong seasonal periodicity of Antarctic sea ice in better agreement with the observed DFM; and (2) microseism decay is not synchronous with sea ice expansion since the microseism intensity is also linked to the source location,source intensity (e.g.,ocean storms,ocean wave field),and other factors.Finally,we discuss the effect of Southern Annular Mode on Antarctic sea ice and microseisms,as well as the current limitations and potential of employing seismological investigations to elucidate Antarctic sea ice variations and climate change.
Key words:Antarctic sea ice; Microseism; Climate change; Southern annular Mode
INTRODUCTION
The existence of sea ice is one of the important characteristics that distinguishes the polar oceans from other oceans.Polar sea ice is an important component of global climate change due to its control on sea-air exchange,which subsequently impacts atmospheric and oceanic circulation (Yuan Xiaojun,2000; Cook A.J.et al.,2005; Overland J.E.et al.,2010; Kinnard C.et al.,2011; Letterly A.et al.,2016; Wilson D.J.et al.,2018).The roles of polar sea ice in global climate are as follows:
(1) Sea ice has a higher albedo than seawater,and can reflect more solar engergy,thereby reducing the heat transfer to the ocean.It can also reduce energy dissipation in winter by insulating the frigid atmosphere from relatively warm seawater (Grenfell T.C.et al.,1977).
(2) The growth and decay of sea ice also affects atmosphere-ocean interactions and thermohaline circulation,both of which play important roles in the heat and gas exchanges of the global oceans (Magnusdottir G.et al.,2004;Li Xichen et al.,2014;Haumann F.A.et al.,2016).
Numerous satellite-based studies of polar sea ice changes have been undertaken by the National Oceanic and Atmospheric Administration (U.S.) launched their first polar-orbiting satellite in 1970.However,weather phenomena,such as cloud cover and the polar night,severely affected the polar sea ice observations at visible and near-infrared wavelengths.Active microwave remote sensing has successfully addressed these problems since 1979,with all-weather observations implemented in most areas.The IMBIE Team (2018) find that the Antarctic ice-sheet mass lost 2 720 ± 1 390 billion tonnes from 1992 to 2017,which is equivalent to a 7.6 ± 3.9 mm increase in global mean sea level (Fig.1).Rignot E.et al.(2019) calculate the mass balance of 176 Antarctic basins using ice drainage,ice thickness,and ice velocity data between 1979 and 2017,and find a six-fold increase in the total mass loss of Antarctic glaciers since the 1980s,resulting in 3.6 ± 0.5 mm of global sea-level rise per decade.
Satellite observations have also indicated regional differences in Antarctic sea ice changes,with more obvious mass loss in West Antarctica (the geographical distribution as shown in Fig.2) compared to East Antarctica (Turner J.et al.,2009; Joughin I.et al.,2011).This is particularly noted by the enhanced iceberg calving from the Antarctic continent due to intensified westerly winds and wave processes.Ice melt in the Antarctic Peninsula (AP) has become more pronounced since 2002 (Jacobs S.,2006; Barrand N.E.et al.,2013;Miles B.W.J et al.,2016;Etourneau J.et al.,2019),and the rate of ice shelf loss has recently increased in the nearby Amundsen and Bellinghausen seas (Parkinson C.L.et al.,2012; Fan Tingting et al.,2014; Kohout A.L.et al.,2014; Weber M.E.et al.,2014; Massom R.A.et al.,2018).
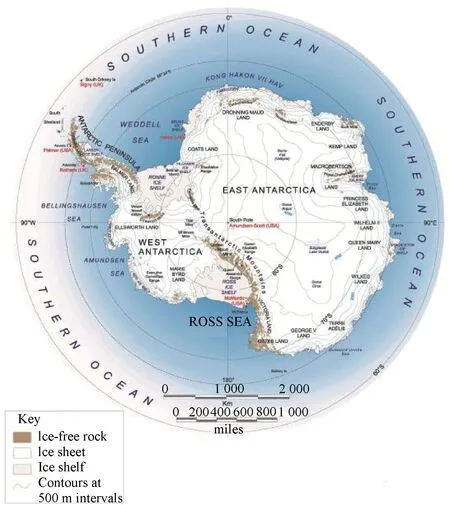
Figure 2 Map of Antarctica,with its prominent features (taken from the Landsat Image Mosaic of Antarctica,United States Geological Survey (2020).(https://lima.usgs.gov/)
Polar satellite data are discontinuous due to the effects of satellite sensors at different periods (including the decommission of satellites and sensor replacement) and the impact of clouds on satellite images.The poor resolution of satellite data also makes it difficult to obtain sea ice parameters at small or medium scales (Parkes D.et al.,2018).Furthermore,field observational data in polar regions are very scarce due to the logistical constraints in these extreme environments.
Recent research on ocean processes and elements,such as swells and typhoons,that employ seismic methods and seismic data are at the forefront of scientific research.Continuous interactions between ocean swells and Earth's solid surface generate continuous seismic noise or “microseisms” (with 1-30 s periods),the most energetic component of ambient seismic noise (Longuet-Higgins M.S.,1950; Peterson J.R.,1993; Bromirski P.D.,2001; Rhie J.et al.,2004,2006; Bromirski P.D.et al.,2005; Roux P.et al.,2005;Stehly L.et al.,2006; Yang Yingjie et al.,2008).These signals of microseisms contain information about the ocean surface wavefield,making it possible to study and monitor the oceans using seismic methods.For example,seismologists have located and tracked typhoons and typhoon-induced swells using seismic noise (Kedar S.et al.,2007; Zhang Jian et al.,2010; Lin Jianmin et al.,2017,2018a,2018b; Neale J.et al.,2017).Recent studies have also investigated polar sea ice changes based on seismic noise(Anthony R.E.et al.,2015,2017; Ishihara Y.et al.,2015; Kanao M.,2018).On the basis of conventional ocean observations,seismological methods provide interdisciplinary observational technical support,and are helpful in advancing polar (and global) climate change research(Grevemeyer I.et al.,2000; Cannata A.et al.,2017).This paper analyzes the characteristics of Antarctic microseisms and explores their relationship with Antarctic sea ice changes.
1 MICROSEISM GENERATION MECHANISM
Seismic observations are traditionally acquired to identify seismic events,such as the intensity and location of an earthquake,or explore deep earth structure.However,the seismic stations'record of ground motion is continuous.In the absence of earthquakes,its data consist of signals generated by natural environments (e.g.,swells,tides or winds)and/or anthropogenic activities (e.g.,production or traffic),which is therefore referred to as‘ambient seismic noise'or‘seismic noise'.
Advances in seismological research and the continued increase in global seismic stations have allowed researchers to discover that microseism,which are in the ambient seismic noise wavefield,is directly related to the sea surface wavefield.Therefore,microseismic signals can be used as a monitoring tool to characterize ocean waves (Deacon G.E.R.,1947; Bromirski P.D.et al.,1999; Tanimoto T.et al.,2006; Ardhuin F.et al.,2011;Ferretti G.et al.,2016).Microseisms can be divided into single-frequency microseisms(SFMs:~0.05-0.12 Hz) and double-frequency microseisms (DFMs:~0.12-0.4 Hz)based on their frequency range and excitation mechanism.SFMs are mainly caused by pressure fluctuations that are induced by ocean waves on the seafloor or shore; therefore,their frequency band corresponds to that of ocean swells.Furthermore,the source regions of SFMs are generally in shallow coastal waters because the amplitude of pressure fluctuations induced by ocean waves attenuate exponentially with increasing water depth (Hasselmann K.,1963; Webb S.C.,1998).DFMs are induced by vertical pressure fluctuations that are generated by standing waves on the seafloor,and are the result of nonlinear interference of ocean waves with similar periods and almost opposite propagation directions; therefore,their frequency is approximately twice that of the original wave (Longuet-Higgins M.S.,1950; Bradley C.R.et al.,1997; Bromirski P.D.,2009).Bromirski P.D.et al.(2005)proposed a further subdivision of DFMs into short-period DFMs(SPDFMs:~0.2-0.4 Hz)and long-period DFMs (LPDFM:~0.12-0.2 Hz) based on its generation mechanism.SPDFMs are excited by the vertical pressure that is transmitted to the seafloor,and are generated locally by ocean gravity waves.Their propagation distances are relatively short due to the correspondingly higher frequencies.LPDFMs are generated by swell that form when wind wave spread propagates large distances from windy regions,with relatively low frequencies.The source regions of LPDFMs are near the coast because the initial swell waves must have enough energy to propagate to the coast,and then form standing waves that are coherent with subsequent swell waves to excite SPDFMs.The interactions of swells can be generated by either two storms in open waters or quick-moving storms at different times (Kedar S.et al.,2007; Ardhuin F.et al.,2011; Zheng Lulu et al.,2017; Lin Jianmin et al.,2018b).
We can locate the source regions of the microseismic signals that are recorded at seismic stations.The direction and slowness of the microseism source region can often be determined by the polarization method when station coverage is relatively sparse the horizontal component of the signals recorded by a single station is rotated and the source regions are located according to the direction of the maximum amplitude (Tanimoto T.et al.,2006; Xia Yingjie et al.,2011).The cross-correlation-function method performs a cross-correlation of signals recorded at two seismic stations in the time domain.Therefore the cross-correlation function between the stations can be superimposed in a long period to extract the empirical Green's function (Stehly L.et al.,2006).Numerous studies have shown that the noise cross-correlation function between two stations is asymmetric due to the non-uniform distributions of the noise sources in space.Then the spatial distribution characteristics of the noise sources can be obtained by inverting the cross-correlation function (Stehly L.et al.,2006; Wang Weitao et al.,2011a,b; Lepore S.et al.,2016).The microseism source regions can be located more accurately using seismic array observations and array processing techniques (Koper K.D.et al.,2015).For example,Lin Jianmin et al.(2018a) analyze continuous seismic data from the NECESS Array in Northeast China using the frequency domain beamforming method,locate the microseism source regions that are induced by Typhoon Lupit as it formed over the Western Pacific in 2009,and successfully tracke the path of Lupit.These studies highlight the applicability of seismological methods to infer microseism characteristics.
2 SPATIAL AND TEMPORAL CHARACTERISTICS OF ANTARCTIC MICROSEISMS
Using data recorded by multiple seismic stations deployed in and around the Antarctica region in the International Geophysical Year (1957-1958),several joint observations are conducted by different countries.In the early years,seismological studies mainly focus on seismic and volcanic activities(Beaudoin B.C.et al.,1992;Rowe C.A.et al.,2000;West M.E.et al.,2010).Besides,the polar regions are also considered to be ideal areas for studying the excitation of seismic noise due to atmosphere-cryosphere-hydrosphere interactions because there is almost no artificial noise.Later,with the development of satellite remote sensing technology,research regarding sea ice melt in polar regions has also become a popular topic.
The Southern Ocean,which surrounds the Antarctic continent with a long coastline,includes several islands.The coastal area of Antarctic is considered one of the most severe cyclone regions due to the intense wave and increased storms activities associated with the prevailing westerly winds.(Jeffries M.O.et al.,1997; Simmonds I.et al.,2003).The huge waves generated by storms propagate along the Antarctic coastline,coupling with the continental shelf and coast to induce microseisms (Aster R.C.et al.,2008; Kanao M.et al.,2012,2013).Stutzmann E.et al.(2009) use the continuous seismic data from the broadband GEOSCOPE seismic stations and significant wave height data obtained via numerical wave modeling.They find that the recorded microseisms are located in either the Southern Ocean or other areas with a relatively weaker wavefield that is significantly stronger than those recorded at seismic station DRV (located on the Antarctic coast),especially during the austral autumn and winter (Fig.3).Anthony R.E.et al.(2015)analyze ambient seismic noise in Antarctica,and indicate that annual maximum microseism intensity does not correspond to the peak period of storm activity over the Southern Ocean(approximately May-October).Besides,the microseisms weaken significantly with continued Antarctic sea ice expansion during the austral winter.Anthony R.E.et al.(2017)investigate the microseism data in the 0.05-0.2 Hz band from seismic station PMSA(located on the west coast of the AP) from 1993 to 2015,and perform a Fourier series to fit the primary (~0.05-0.08 Hz) and secondary (0.1-0.2 Hz) microseism energy curves.There is a clear bimodal seasonal pattern in the AP microseisms,where the energy increase from January to May,decrease from May to September,then increase slightly from September to mid-October,and finally decrease until the following January.Microseism energy attenuation is relatively severe as sea ice expansion continues during the austral winter (May-September).
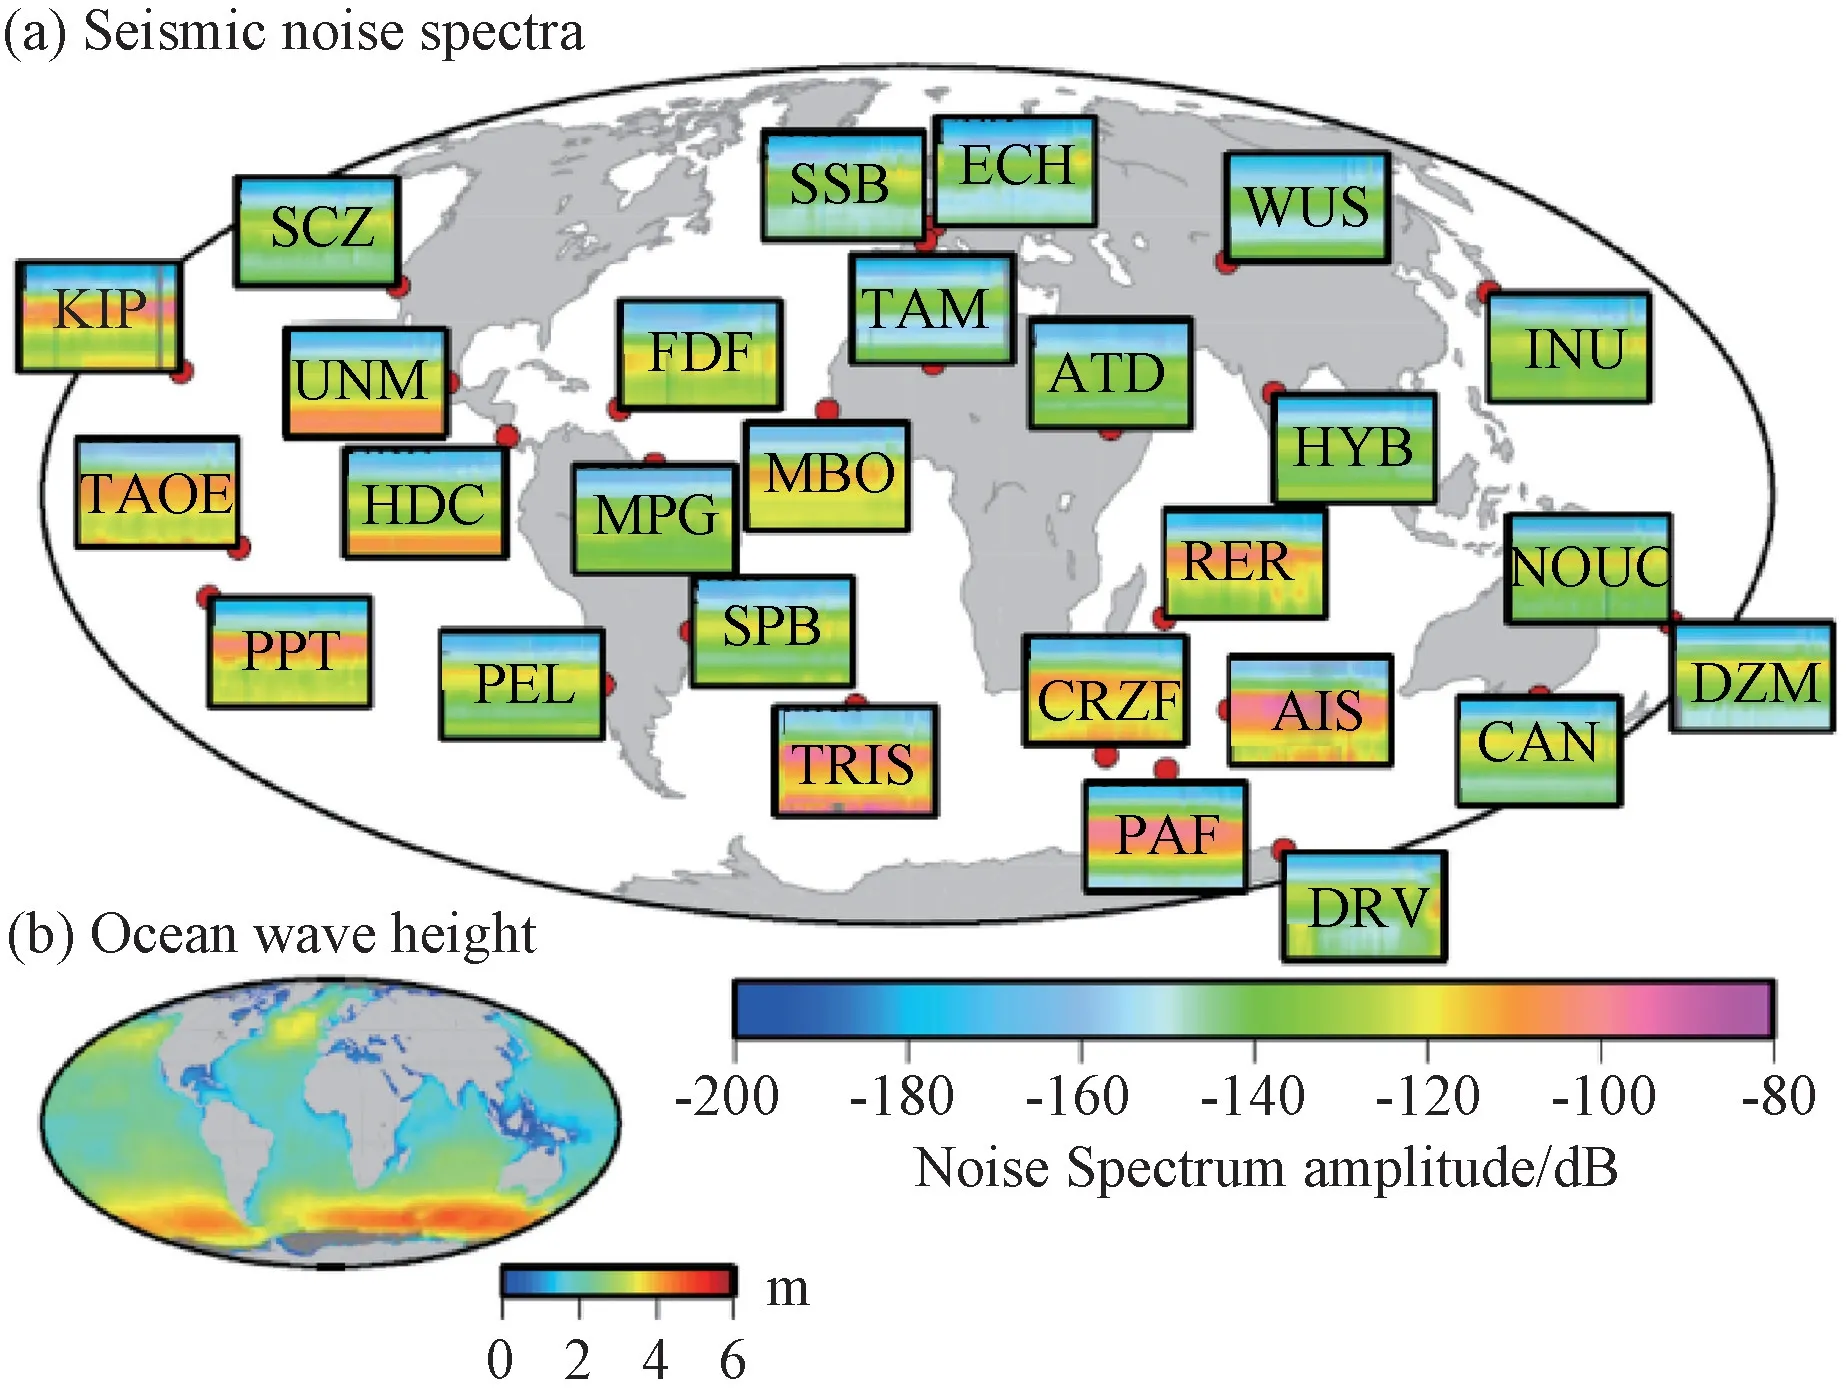
Figure 3 (a) Spectrograms of 27 seismic stations around the world in 2006,the horizontal axis corresponds to days from 1 to 365,and the vertical axis is the frequency between 0.02-10 Hz; (b) Global significant wave height in 2006 (from Stutzmann E.et al.,2009)
Only limited studies of source regions are conducted compared with those of the seasonal variations in Antarctic microseisms.Stutzmann E.et al.(2009) and Diez A.et al.(2016) investigate the source regions of Antarctic microseisms using the polarization and beamforming methods,respectively.As a result,both of them indicate that the microseisms are generated by a local ocean source.Pratt M.J.et al.(2017) analyze microseismic signals recorded by a moderate aperture (~60 km) seismic array (WIS array) that is deployed along Whillans Ice Stream (WIS),West Antarctica,from 2010 to 2011.They utilize the simulated significant wave height from the WAVEWATCH III model and the microseism energy radiation model proposed by Ardhuin F.et al.(2011),and determine the frequencyslowness (F-S) spectrum via the frequency-wavenumber (F-K) approach to study the distribution of Antarctic SFM and DFM source regions separately.The distribution areas of the highest coastal swell waves represent the SFM source regions.The results show that the SFM source regions are distributed mainly in the ocean area near the sea ice,whereas the DFM source regions are relatively distal to the Antarctic coastline (Fig.4).
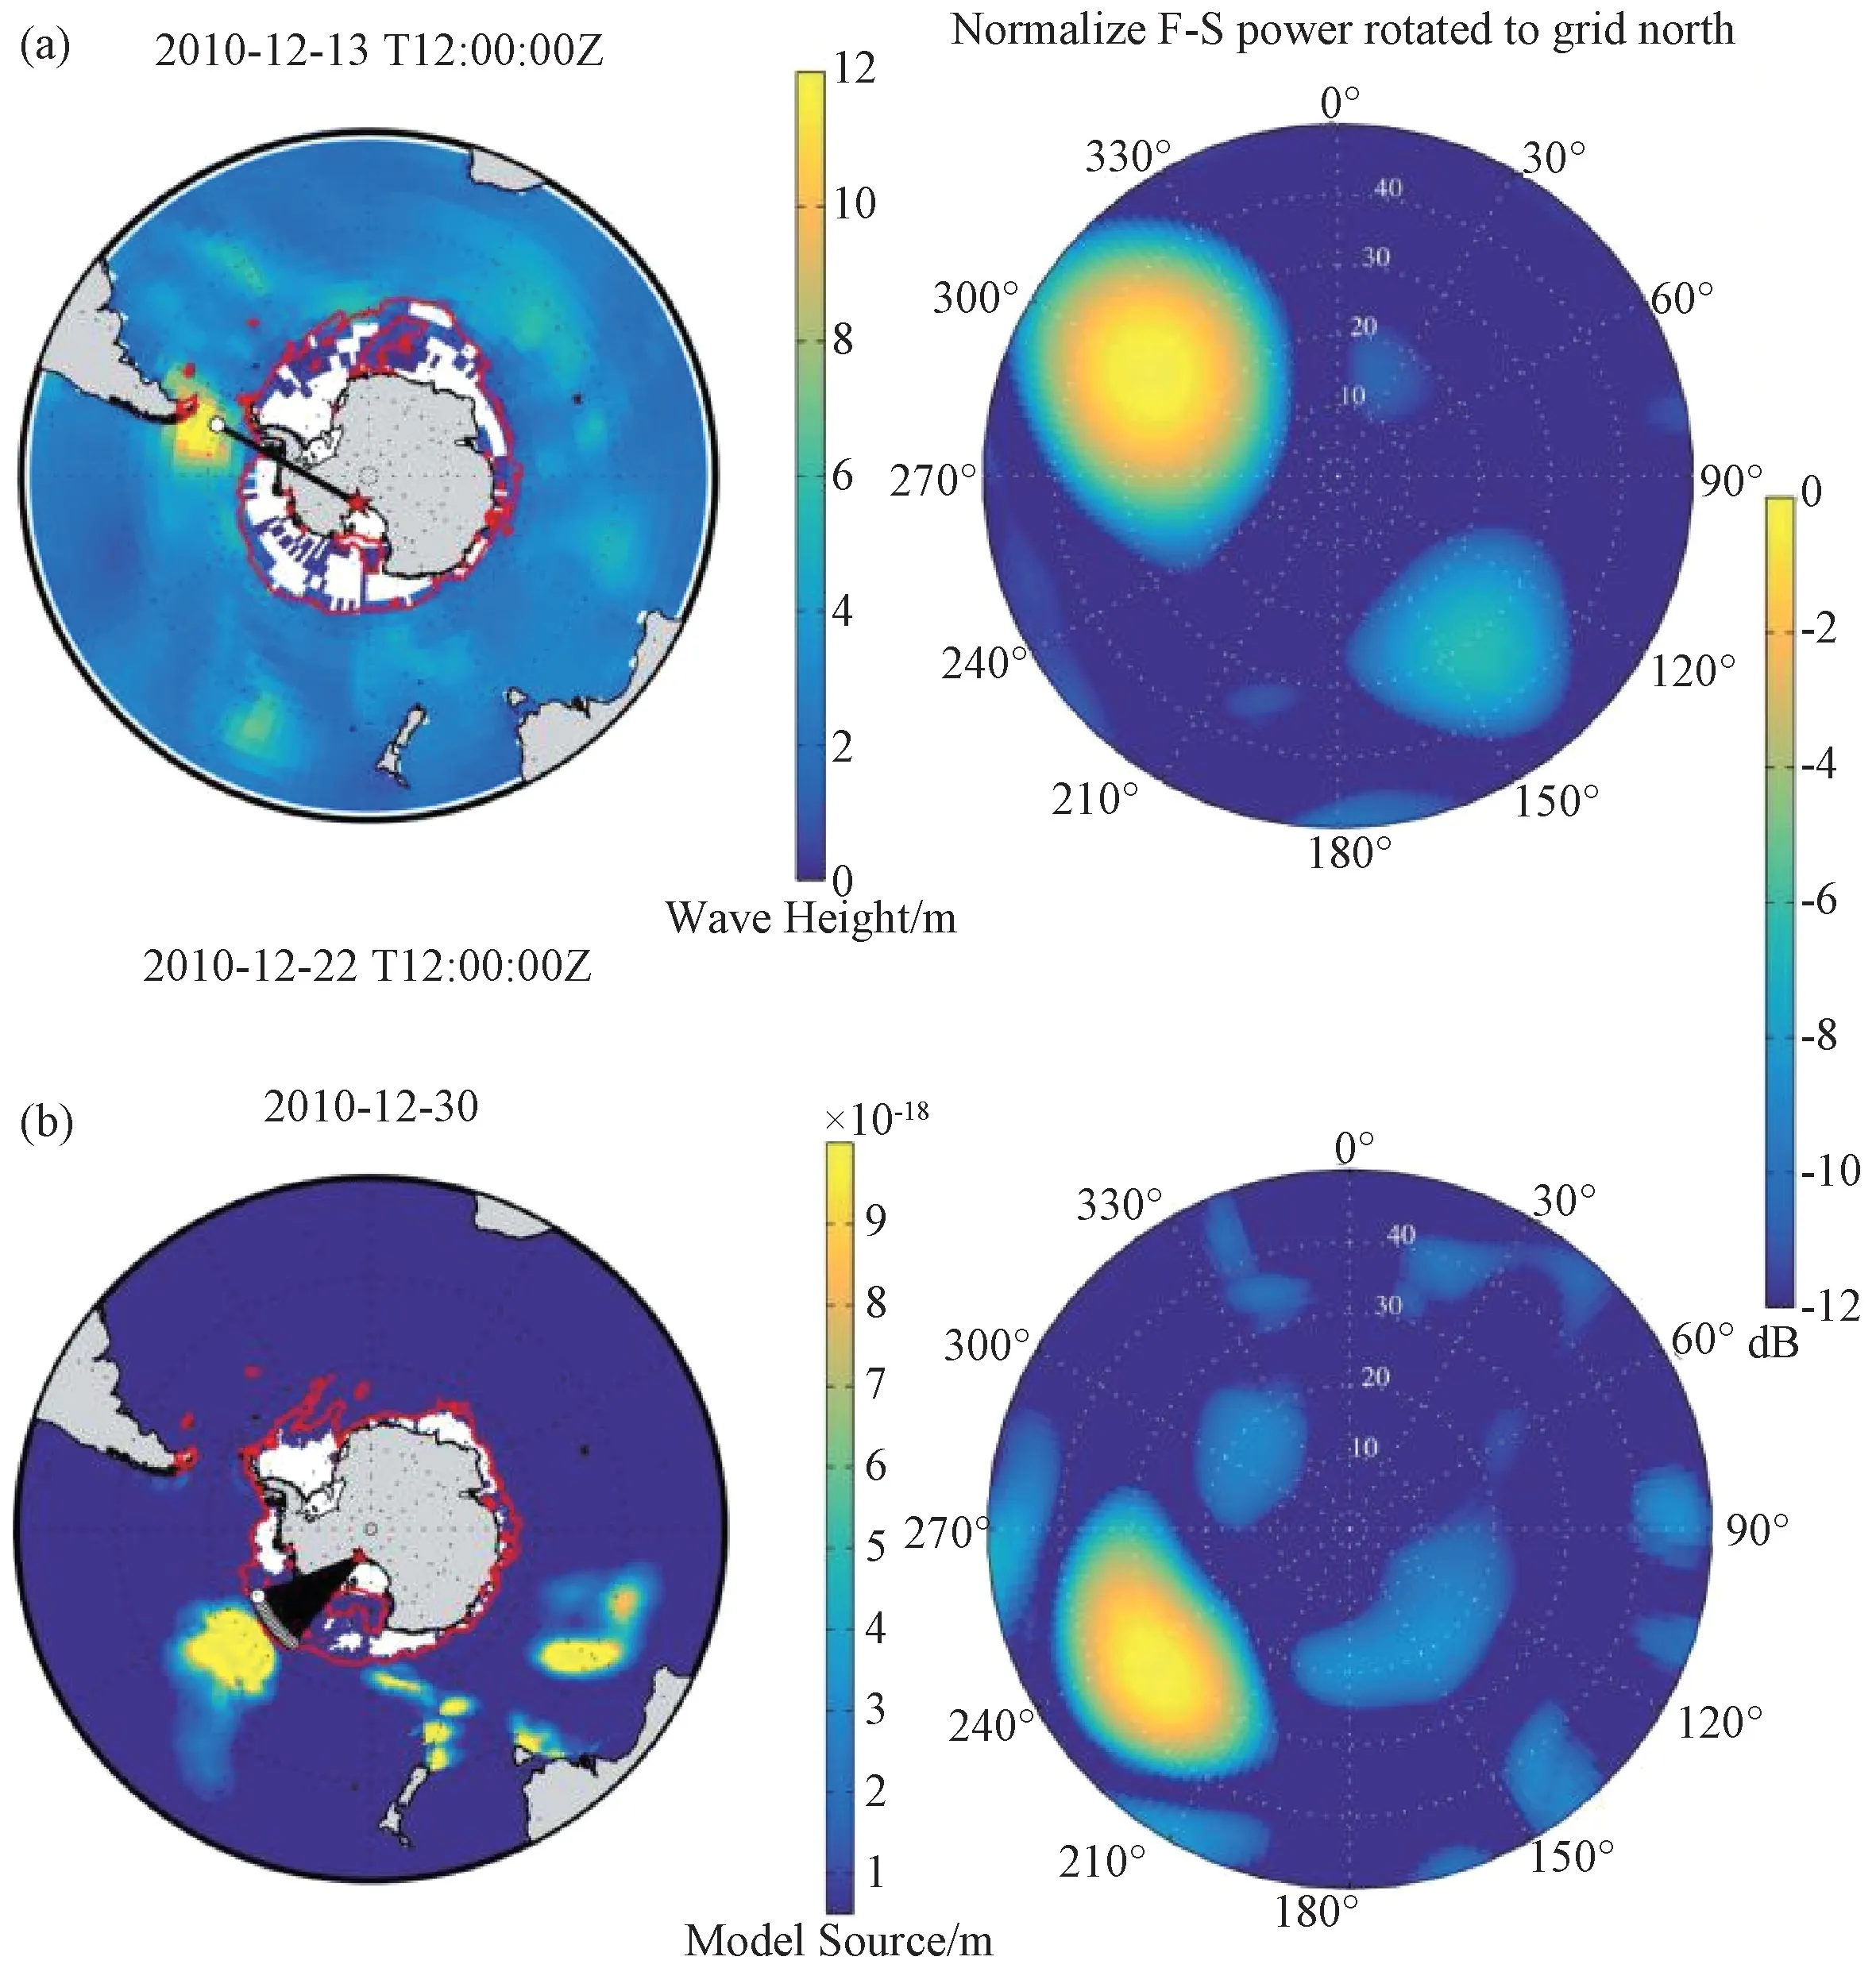
Figure 4 (a) Comparison of the WAVEWATCH Ⅲsignificant wave height across the Southern Ocean (left) and SFM F-S spectrum based on the F-K method (right)on December 13th,2010.The red star indicates the position of the WIS Array;(b) Comparison of the DFM source regions from the microseism energy radiation model of Ardhuin F.et al.(2011) (left) and the DFM F-S spectrum based on the F-K method (right) on December 30th,2010 (modified from Pratt M.J.et al.,2017)
3 RELATIONSHIP BETWEEN ANTARCTIC MICROSEISMS AND SEA ICE
Microseism energy is generally stronger during the austral winter compared with other austral seasons due to stronger winter storms (Stehly L.et al.,2006; Gerstoft P.et al.,2007; Aster R.C.et al.,2010).However,the microseism energy is weaker than that generated during the austral summer in Antarctic (Hatherton T.,1960;Stutzmann E.et al.,2009; Tanaka Y.et al.,2019).This unique characteristic of Antarctic microseisms is related to the specific geographic environment in Antarctica,especially with regard to the effect of sea ice.Recent seismological research has focused on comparisons of sea ice satellite remote-sensing data and seismic observational data.The satellite sea ice extent can be inverted using the sea ice concentration (SIC),which is the percentage of the sea ice area in a given ocean area.The sea ice boundary is determined when this value reaches 15%.Grob M.et al.(2011) calculate the power spectral density (PSD) of the verticalcomponent signals using the microseism data recorded at ten seismic stations along the coastline of Antarctica between 2000-2009.They further compare the PSDs with the monthly averaged SIC images and suggest that the microseism energy rapidly decays with increasing sea ice accumulation along the Antarctic coast during the austral winter.Notably,Kanao M.et al.(2013) observe a “disappearance” of short-period (0.1-0.25 Hz)microseisms in the record of July from seismic station SYO in Antarctica,indicating that the Antarctic sea ice was expanding seaward during that time period,which prevented station SYO from receiving short-period microseisms.Anthony R.E.et al.(2017) employ the spatiotemporal cross-correlation method to separately estimate the correlation between the monthly averaged SIC around the AP and the microseism energy in both the SFM and DFM bands that are recorded by station PMSA.Such method is beneficial for understanding the sea ice factors that influence each microseism frequency band.Their results show that the SFMs are more sensitive to coastal (<200 km) sea ice variations.For example,the correlation coefficient between SFM energy and SIC reaches -0.9 about 150 km southwest of station PMSA in August.This is consistent with the results in Pratt M.J.et al.(2017),where a more detailed frequency band division is conducted on the DFMs recorded by the WIS Array.They find that the Antarctic sea ice changes in better agreement with the observed SPDFM intensities.
Furthermore,the distributions of the microseism source regions vary as the sea ice boundary moving towards the sea side.Pratt M.J.et al.(2017) suggest that the SFM(represented by the highest swell wave position along the coast) and SPDFM source regions move with the coastal sea ice changes,and are distributed mainly in the ocean near the sea ice boundary.Interestingly,the microseisms recorded at the peripheral Antarctic seismic stations are also correlated with sea ice changes (Lee W.S.et al.,2011).Anthony R.E.et al.(2017) analyze the microseisms recorded from 1996 to 2015 at seismic station EFI,which is located in the Falkland Islands (about 1200 km north of the maximum sea ice extent,facing the AP from across the Drake Passage),and indicate that the SFM energy is significantly inhibited by the early expansion of sea ice cover (May-June).Such results may imply that station EFI may have received SFMs excited near the Antarctic coast.Even though several other factors such as sea ice changes around the Falkland Islands and the station site may also play their parts,this finding may partly reflect the influence of sea ice on microseisms.The anomalous seasonal patterns of Antarctic microseism can be explained by the relationship between microseism excitation and sea ice expansion.Sea ice expansion and retreat usually occur seasonally along the Antarctic coastline due to its unique geographic location (maximum and minimum sea ice extents are generally in September and February,respectively) (Worby A.P.et al.,1998; Jay Z.H.et al.,2002).The austral winter is marked by sea ice accumulation along the coastline as well as its expansion to the edge of the continental shelf.Consequently,the continental shelf is covered by sea ice,which greatly reduces ocean wave interactions with the coast and continental shelf (Fig.5).The resultant microseisms are mainly SFMs,but the source regions are largely confined to the sea ice boundary.By contrast,the austral summer is marked by the retreat of the sea ice edge to the continental coast.SFMs can be effectively excited during this period,and the excitation of DFMs is amplified after sea ice retreat since the generation of DFMs due to the reflection of standing waves on or along the coastal sea ice that are coherent with subsequent waves in shallow continental shelf waters.(Cathles L.M.et al.,2009; Kanao M.et al.,2012; Kanao M.,2018).
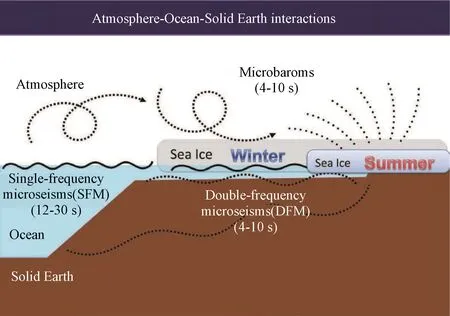
Figure 5 Schematic illustration of atmosphere-ocean-solid earth interactions along the Antarctic coast during the austral summer and winter (from Kanao M.,2018)
However,the microseism energy characteristics and source region distribution in Antarctic are not completely dominated by sea ice changes.For example,the consistent growth of microseism energy recorded by station PMSA on the AP continues until May,and then gradually weakens until September,whereas the sea ice near the AP begins to expand in February and reaches its maximum extent in September,followed by sea ice retreat.Wave activities around the AP dominate the changes in microseism energy from February to May,whereas the changes in microseism energy are dominated by the effects of sea ice from May to September (Anthony R.E.et al.,2017).Furthermore,the microseism energy recorded by the inland Antarctic stations is generally lower than that of the coastal stations.In addition,the microseism energy observed on the AP is extremely higher compared with that on the inland and other coastal stations because the AP is exposed to the strong westerly winds over the Drake Passage and Bellinghausen Sea all year round (the storm activity in these two regions is stronger than that in the other areas of the Southern Ocean).Therefore,the geographical location of the observation sites and the state of Southern Ocean waves should also be considered when studying the relationship between Antarctic sea ice and microseisms.
Through a joint analysis of sea ice satellite remote sensing data and observational data,we investigate the time-frequency characteristic of microseisms in West Antarctica and its relationship with sea ice variations from 2011 to 2018.The data are obtained from the European Centre for Medium-Range Weather Forecasts Copernicus Climate Data Store daily SIC data,with a grid resolution of 12.5 km × 12.5 km.The continuous vertical-component seismic waveform data are recorded at BEAR seismic station (74.5476°S,111.8511°W),and downloaded from the Incorporated Research Institute for Seismology.BEAR Station is located on the coast of West Antarctica,near the Amundsen Sea.The coastal sea ice has experienced significant seasonal changes,and can extend thousands of kilometers seaward during the austral winter.The waveform data at BEAR Station is largely continuous,with a loss rate that does not exceed 5% in a given year.
We characterize the temporal variations in Antarctic sea ice by initially calculating the spatial distribution of the monthly averaged SIC,which stands for the average SIC for each grid point within each month.For example,Fig.6(a) shows the monthly averaged SIC spatial distribution of Antarctic sea ice in February and September 2018.The red and black arrows indicate the sea ice boundaries in February and September,respectively (the corresponding SIC is equal to 15%).We then calculate the spatial integral of the monthly averaged SIC to determine the corresponding sea ice extent as follows:

where SICiis the SIC of the grid whose monthly averaged SIC is ≥15%,Ris the spatial resolution of the SIC data (12.5 km),andnindicates the traversal sums of the sea ice extent for all of the grids in the target ocean area.The monthly sea ice extent from 2011 to 2018 is shown in Fig.6(b).There are significant seasonal variations in the Antarctic sea ice extent,as shown in Fig.6.In detail,the smallest sea ice extent occurs in February,and is followed by gradual sea ice expansion until its maximum in September.
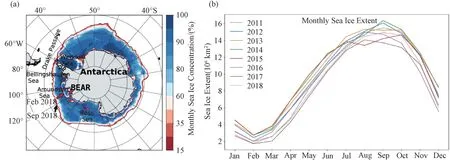
Figure 6 (a) Monthly averaged SIC spatial distribution of Antarctic sea ice in February and September 2018.The red and black arrows point to the sea ice boundary in February and September (SIC=15%),respectively.The red star indicates the location of BEAR Seismic Station.(b) Monthly averaged Antarctic sea ice extent from 2011 to 2018
The BEAR microseism data are processed as follows.We first preprocess the original seismic data,including demeaning and detrending,removing the instrument response,resampling to 1 Hz,and bandpass filtering within 0.05-0.45 Hz.The Short-Time Fourier Transform (STFT) is then used to obtain the temporal frequency spectrogram of the microseismic signals (Fig.7).The sliding window length for STFT processing is set as 0.5 hr to reduce the influence of instantaneous large-amplitude interference signals possibly induced by earthquakes.Fig.7 also shows the monthly averaged SIC spatial distribution diagrams of the ocean area around BEAR Station at different periods to analyze the relationship between the microseismic signals and sea ice characteristics.The normalized monthly median intensities in decimal format of SFM and DFM are given in Fig.8.A significant seasonal variation in the microseismic signals is observed from 2011 to 2018,which appears to correlate with the sea ice changes around the station.SFM generally has maximum intensities every April-May and minimum intensities around every October-November,while DFM intensities reach the maximum every February-March and the minimum around every October.Between February-September,when the sea ice extent around the station gradually expands,the entire coastline of the Antarctic continent may be surrounded by sea ice.Comparatively,the strong seasonal periodicity of Antarctic sea ice is in better agreement with the observed DFM.The reasons for the observed weakening of the microseism energy are:(1) waves from distant ocean areas cannot interact with the coast and continental shelf due to the sea ice cover;(2) waves from distant ocean areas propagate to the sea ice boundary and either excite SFMs or interact with subsequent waves to excite DFMs after being reflected.As a result,the source regions are relatively far from the station,and the energy is greatly attenuated when it reaches the station;(3) wave activities around the Antarctic Continent has either been reduced or weakened after austral autumn and winter(Hemer M.A.et al.,2010).Therefore,the station may still receive weak microseism energy associated with sea ice growth even after September.Although there are also some differences in the annual microseism changes,their long-term dependence on sea ice changes remains relatively stable.
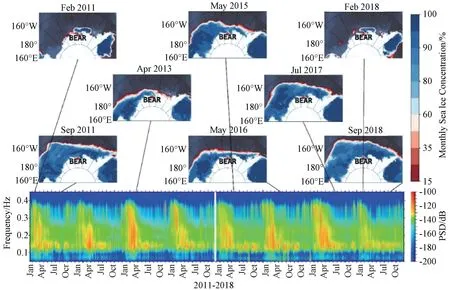
Figure 7 Temporal frequency spectrogram of microseisms recorded at BEAR seismic station from 2011 to 2018 (white band indicates missing data from December 19th to December 31st,2014),and monthly SIC distributions around the station at different periods.The red star indicates the location of station BEAR in West Antarctica
4 EFFECT OF SOUTHERN ANNULAR MODE ON ANTARCTIC SEA ICE AND MICROSEISMS
The Southern Annular Mode (SAM) has drawn considerable research interest in global climate-change studies.SAM is the leading mode of atmospheric circulation in the Southern Hemisphere and is also considered as a polar mode of atmospheric mass displacement.Its position and intensity may change with the atmospheric pressure changes between the middle and high latitudes in the Southern Hemisphere.Additionally,SAM can affect the surface temperature and pressure of the Southern Ocean and the subsequent Southern Ocean storms(Thompson D.W.J.et al.,2000; Arblaster J.M.et al.,2006; Buizert C.et al.,2018).Therefore,SAM is often used to measure changes in intensity and location of the westerly winds in the Southern Hemisphere,where the air pressure is low over high-latitude areas and high over middle-latitude areas during a positive phase SAM (Fig.9) (Gong Daoyi et al.,1999; Marshall G.J.,2003).The high air-pressure anomalies over the high-latitude areas of Antarctica and low air-pressure anomalies over the middle-latitude areas may have forced the SAM further towards its positive phase during the late Twentieth Century(Fyfe J.C.et al.,2006; Abram N.J.et al.,2014).This trend leads to significant strengthening of the Southern Ocean westerly winds in the middle-latitude areas and the shift of storm activities to high-latitude areas(Orr A.et al.,2008;Pezza A.B.et al.,2008;Mayewski P.A.et al.,2009;Reboita M.S.et al.,2009),causing more intense wave activities along the Antarctic coast (Hemer M.A.et al.,2010; Bintanja R.et al.,2013; Clem K.R.et al.,2013).The positive-phase SAM is higher in the austral autumn and winter seasons in the Southern Hemisphere,resulting in significantly enhanced storm activities across the Drake Passage (Anthony R.E.et al.,2017).Microseismic signals contain important information about ocean swells and storm activities,indicating that changes in ocean conditions along the Antarctic continent may directly affect the microseisms recorded by Antarctic seismic stations.Therefore,we need to pay more attention to the impact of SAM on westerly winds over the Southern Ocean,the intensity of the wavefield,and the storm activities around Antarctica when studying Antarctic microseisms.
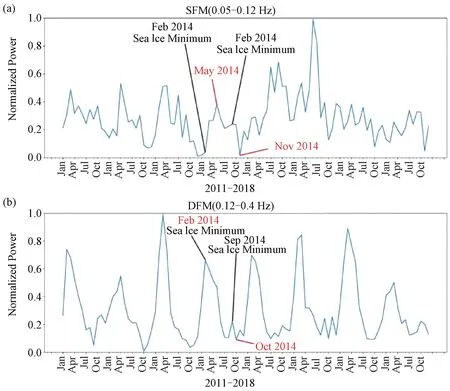
Figure 8 (a) The normalized deciyear median monthly intensity of SFM;(b) The normalized deciyear median monthly intensity of DFM
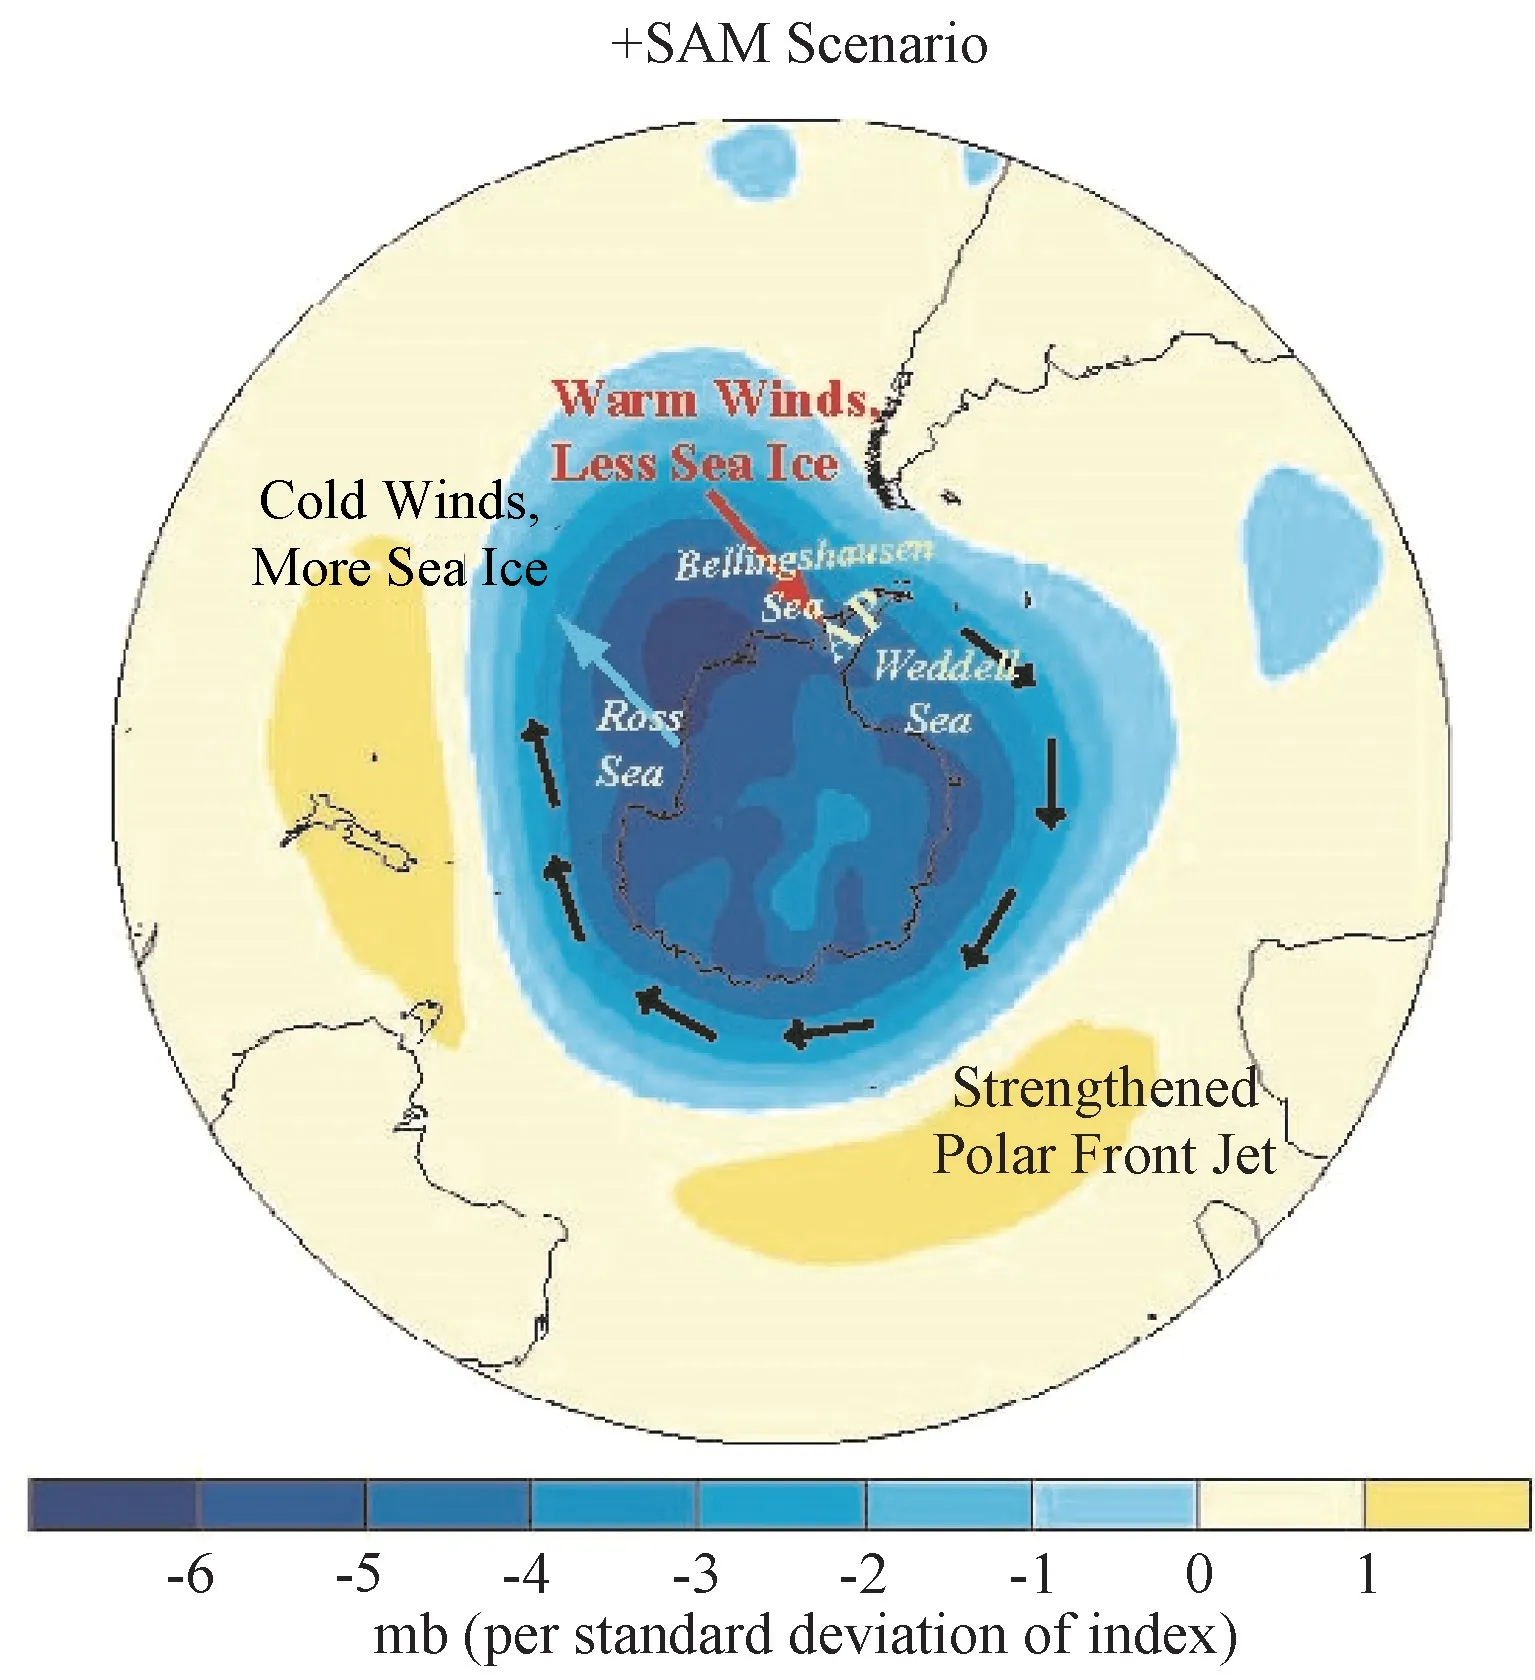
Figure 9 Schematic depiction of the high-latitude sea-level pressure response to positive-phase SAM and the atmospheric response to the associated sea ice changes.The black arrows schematically indicate wind anomalies(modified from Stammerjohn S.E.et al.,2008)
SAM also has an impact on the Antarctic sea ice,and indirectly affects both the signal characteristics and excitation of Antarctic microseisms through sea ice cover.As mentioned above,SAM affects the intensity of the wavefields and storm activities in the Southern Ocean with the changes in sea surface wind speed which induces vertical transport changes in the Antarctic coastal water layer.Poleward winds reduce the dynamic sea surface level in the coastal regions,which flattens the normally convex isotherms in coastal waters,and moves the boundary between the upper cold fresh water and lower warm salty water to a higher level.In consequence,the warm water is closer to the bottom of the Antarctic sea ice,accelerating the melting process (Fig.10) (Spence P.et al.,2014; Rintoul S.R.,2018).Furthermore,the positive-phase SAM response in Fig.9 demonstrates that the warm air brought by the southeastward westerly winds (the red arrow) near the AP reduces the sea ice in the Weddell Sea,while the cold air brought by the northeastward westerly winds(the light-blue arrow) near the Ross Sea increases the sea ice in this area (Lefebvre W.et al.,2004; Gupta A.S.et al.,2006; Stammerjohn S.E.et al.,2008).The circulation pattern of the positive-phase SAM leads to the formation of an anomalous low-pressure area to the west of the Bellingshausen Sea (Fig.9) and the transport of warm air from the lowattitude areas to the AP,which causes an abnormal increase in local temperature that may affect the expansion of sea ice (Liu Jiping et al.,2004; Marshall G.J.et al.,2006;Silvestri G.et al.,2009; Mulvaney R.et al.,2012; Meehl G.A.et al.,2016).The temperature of the entire Antarctic Continent will be lower during a positive-phase SAM,except in certain regions,such as the AP (Thompson D.W.J.et al.,2000;Marshall G.J.et al.,2006).Global warming has recently forced the atmosphere toward a positive-phase SAM in the austral summer,which may cause seasonal cooling of the sea surface temperature near the Antarctic continent.This phenomenon may continue into the next austral autumn,causing an abnormal increase in Antarctic sea ice extent (Doddridge E.W.et al.,2017).
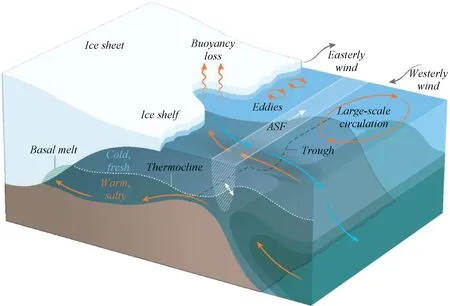
Figure 10 Mechanisms for transporting ocean heat flux to the Antarctic continental margin (from Rintoul S.R.,2018).
5 SUMMARY AND OUTLOOK
Antarctic sea ice change,which may lead to significant impacts on ocean-atmosphere interactions,has attracted increasing attention since global warming has become one of the world's largest environmental problems in the 21stcentury.Recent development in polar seismology has blazed the trail for seismologists to conduct microseism investigations for the purpose of studying Antarctic sea ice changes.This paper reviews the research state on the excitation mechanism and source distribution of microseisms,the temporal and spatial characteristics of Antarctic microseismic signals,and the effect of sea ice on microseisms.A joint analysis of sea ice satellite remote-sensing data and continuous waveform data from a seismic station in West Antarctica is first presented,followed by an investigation of the temporal and spatial changes in Antarctic sea ice properties and their influence on microseisms.Furthermore,we also discusses and analyzes the impact of climate change on Antarctic microseisms.Climate change can affect polar microseisms due to changes in the Southern Ocean wavefield and storm intensity,and changes in sea ice properties and coverage along the Antarctic coast.
Ice melting in Antarctica has become one of the key scientific issues for studying global climate change because the melting of the polar ice sheets is a significant contributor to global sea-level rise.In situ observations of the Antarctic sea ice are the most direct and accurate approaches.However,the geographical and climatic situations in Antarctica often make in situ observations difficult,costly,and risky.Large-scale sea ice data have been acquired mainly through satellite observations.However,polar seismology is an emerging research direction that is expected to provide new opportunities for polar sea ice observations and research.Current research on the relationship between polar microseisms and sea ice is limited in that it cannot finish correlation analyses and determine the statistical significance of this relationship.Meanwhile,the analysis results often lack of adequate resolution in both time and space domains.Increased seismic station coverage (particularly seismic arrays)and rapid development in the processing of microseismic signals will allow researchers to better relate the microseism characteristics to specific sea ice conditions and changes,as well as relevant satellite-based polar sea ice observations.Long-term continuous seismic observations may provide an opportunity to continuously monitor and detect sea ice conditions and changes via microseisms.Meanwhile,it can bolster and refine the temporal resolution of sea ice satellite remote-sensing observations.For example,the real-time sea ice boundary and instantaneous change can be monitored (such as ice shelf fracture,etc.) via microseisms.Consequently,microseisms can potentially serve as a new indicator of polar sea ice change and climate change.
 Earthquake Research Advances2020年2期
- Earthquake Research Advances的其它文章
- Influence of Bedding and Mineral Composition on Mechanical Properties and Its Implication for Hydraulic Fracturing of Shale Oil Reservoirs1
- Progress and Prospect of Geophysical Research on Underground Gas Storage:A Case Study of Hutubi Gas Storage,Xinjiang,China1
- Analysis of Anomalous Characteristics of Regional Crustal Deformation before the September 16th,2019 Zhangye MS5.0 Earthquake,Gansu,China1
- Study of the Seismogenic Structure of the October 12th,2019 MS 5.2 Beiliu Earthquake,Guangxi,China1
- Analysis of Power Supply Interference of Geomagnetic Second Data Observation-Take Changli Seismic Station as An Example1
- New Understanding of Variation Characteristics of Well Water Level in Majiagou Mine,Tangshan City,Hebei,China1
