Analysis of Power Supply Interference of Geomagnetic Second Data Observation-Take Changli Seismic Station as An Example1
TONG Xin ,ZHOU Jianqing ,LIU Zhe ,ZHANG Guoling and GUO Jianfang
1) Qinhuangdao Central Station,Hebei Earthquake Agency,Qinhuangdao 066100,China
2) Hebei Earthquake Agency,Shijiazhuang 050021,China
This paper analyzes two types of power supply interference encountered in the observation of geomagnetic second data:the HVDC interference and the discharge interference of electrified railway.By taking the FGM fluxgate magnetometer of Changli Seismic Station as the research object,we analyze interference characteristics and conduct intensive observational experiment of electrified railway interference.Finally,several conclusions are obtained:①HVDC interference is closely related to the changes in the current system of the interference source,such as current size,distance or orientation of the interference source.Although the characteristics of each change are not the same,the main changes are variable.②The discharge phenomenon caused by the contact of the pantograph system or other reasons during the operation of the electrified railway is a factor that may cause random small interference in the geomagnetic second data at Changli Seismic Station.This study explains similar phenomena discovered in previous years and meanwhile correct previous misjudgments including unstable working systems,unstable power supply,and occasional sudden jumps that are considered to be discrete.
Key words:Geomagnetism; Electrified railway; Interference
INTRODUCTION
In the construction of the geomagnetic network in China,the interference from complicated transportation facilities is becoming increasingly serious.Meanwhile,the interference forms are diverse,resulting in data pollution and poor data quality.Some interference sources are easy to identify,while some are difficult to distinguish.Over the years,the National Geomagnetic Networks Center of China has constructed 37 online national geomagnetic stations,97 digital geomagnetic observation stations,and 2 magnetic fluxgate magnetometer arrays in Tianzhu,Gansu Province and Xichang,Sichuan Province for ground monitoring.A total of about 180 sets of recording instruments are involved,including 100 sets of second sampling instruments and about 80 sets of minute sampling instruments.
The geomagnetic observation data are generally obtained from four magnetic field sources:the basic magnetic field originating from the earth's core,the abnormal magnetic field generated by the crustal magnetic anomaly,the changing magnetic field generated by the ionosphere current systems and the magnetosphere derived from solar radiation and particle radiation,and the underground magnetic field induced by the changing magnetic field (Yang Dongmei,2001).These four types of magnetic field changes have global synchronization (such as magnetic storms) or local synchronization of multiple stations(such as seismic anomalies).In addition,some seismic stations can be interfered by the local environment and thus undergo different degrees of interference.For example,the short-distance electric locomotive may generate arc discharge interference while achieving its designed tasks,some artificial devices may generate electromagnetic interference,and there are also interferences due to HVDC,vehicles,infrastructure projects,lightning,etc.(Cao Zhicheng,2005).These interferences reduce the inherent quality of geomagnetic data and restrict the development of geomagnetic observation activities.Therefore,it is extremely important to identify the different interference sources and their characteristics in order to use the geomagnetic data correctly.
During the observation of geomagnetic second data,power supply interference events may occur from time to time.The increasingly dense construction of HVDC transmission grids has different effects on geomagnetic second data in each case.The DC power supply interference to earth resistivity observation is significant but common among similar stations,thus is no need to troubleshoot the source of interference.However,there are some unexplained interferences that cannot be directly investigated.They have neither been corroborated by corresponding earthquake cases,nor supported by changes in data from multiple test items on the same station,and can only be determined through experimental investigations.For this purpose,we use the Changli Seismic Station as a platform to conduct special research on various power supply interference and unexplained events.
1 STATION OVERVIEW
The Changli Seismic Station is located on the north side of the Zhangjiakou-Beijing-Penglai active tectonic belt,about 5 km west of the Ninghe-Changli Fault,about 20 km east of the Luanxian Liaoing Fault,and about 65 km east of the Tangshan fault.The Quaternary overburden of the station is 70 m thick,the weathered bedrock layer is 8 m thick,and the Yanshanian granite underlies (Zhou Jianqing et al.,2018).
The geomagnetic observation in Changli Seismic Station is started in 1968,comparatively early to carry out comprehensive electrical and magnetic observations in China.In the past 50 years,with the continuous update of technology,its observation method has changed from analog observation to digital observation,and currently to networked remote control.Its monitoring capabilities have been continuously improved along with the technology development of information and network.At present,the relative observation instruments for geomagnetic monitoring are:GM4 fluxgate magnetometer,FHD-2 proton vector magnetometer,FGM01 fluxgate magnetometer; the absolute observation instruments are:Mag-01H fluxgate geomagnetic theodolite,G856 proton precession magnetometer.Among them,GM4 fluxgate magnetometer and FGM01 fluxgate magnetometer are second sampling instruments.Based on these instruments,the amount of data collection has been greatly improved.
2 MAIN POWER SUPPLY INTERFERENCE TO GEOMAGNETIC SECOND DATA OBSERVATION
In the national geomagnetic network observation,there are mainly two kinds of power supply interference to the geomagneticZ-component second data observation:
2.1 DC Transmission Interference
①The influence of the earth resistivity DC power supply observation on the geomagnetism is common in electromagnetic observation stations in the national seismic network.The time-varying electromagnetic field follows the principle of Maxwell's equations.In its differential form,∇×H=jf+∂D/∂tdescribes that both the conduction current and the changing electric field can generate a magnetic field,H,jf,∂D/∂tdenote the strength of the magnetic field,the density of the conduction current,and the displacement current density (Xu Wenyao,2009).When the resistivity observation is supplied by positive and negitive power,the supply circuit will generate positive and negitive induced magnetic fields correspondingly.As a result,the vertical componentZthen has the strongest superposition of the magnetic field intensity,and a positive and negative order variable occurs.However,theH-component is close to the north-south direction,and the interference is weak.The magnitude of the variation of the geomagnetic component varies with the magnitude of the geoelectric power supply current,the circuit direction,and the distance.These phenomena have been observed at Changli,Mengcheng and Xuzhuangzi Station.As shown in Fig.1,at 5-15 minutes past each hour,theZ-component of each station varies in step,which is influenced by the earth resistivity DC power supply observed at the same station.However,the different power supply current of the earth resistivity observation at each station,in combination with the difference of distance and direction of geoelectricity and geomagnetism,have led to different interference characteristics.Such changes at each station have obvious time regularity and fully synchronized changing characteristics,which are easy to identify and will not be explained in detail.②HVDC transmission constructions are becoming more and more intensive today.Consequently,most stations in Chins national geomagnetic monitoring network are affected.For example,the Changli geomagnetic observations are mainly affected by the HVDC transmission of the Changling Line from Yimin,Hulun Buir to Liaoning (referred to as Hu-Liao Line),Zhalute-Qingzhou Line (referred to as Zha-Qing Line),Xilinhot-Taizhou Line (referred to as Xi-Tai Line),Qingdao Line from Lingwu,Ningxia to Qingdao,Shandong (referred to as Ning-Dong Line),as shown in Fig.2.The first three lines are roughly in NS direction,but the Ning-Dong Line is in EW direction.The Hu-Liao Line is located 270 km to the NE direction of the station,the Zha-Qing Line is 180 km west to the station,the Xi-Tai Line is 180 km west to the station,and the Ning-Dong Line is the farthest,320 km south to the station.
Due to the rarely interference occurred in Ning-Dong line in recent years,this paper only concentrates the analysis of other three lines for exhibiting several similarities and differences.
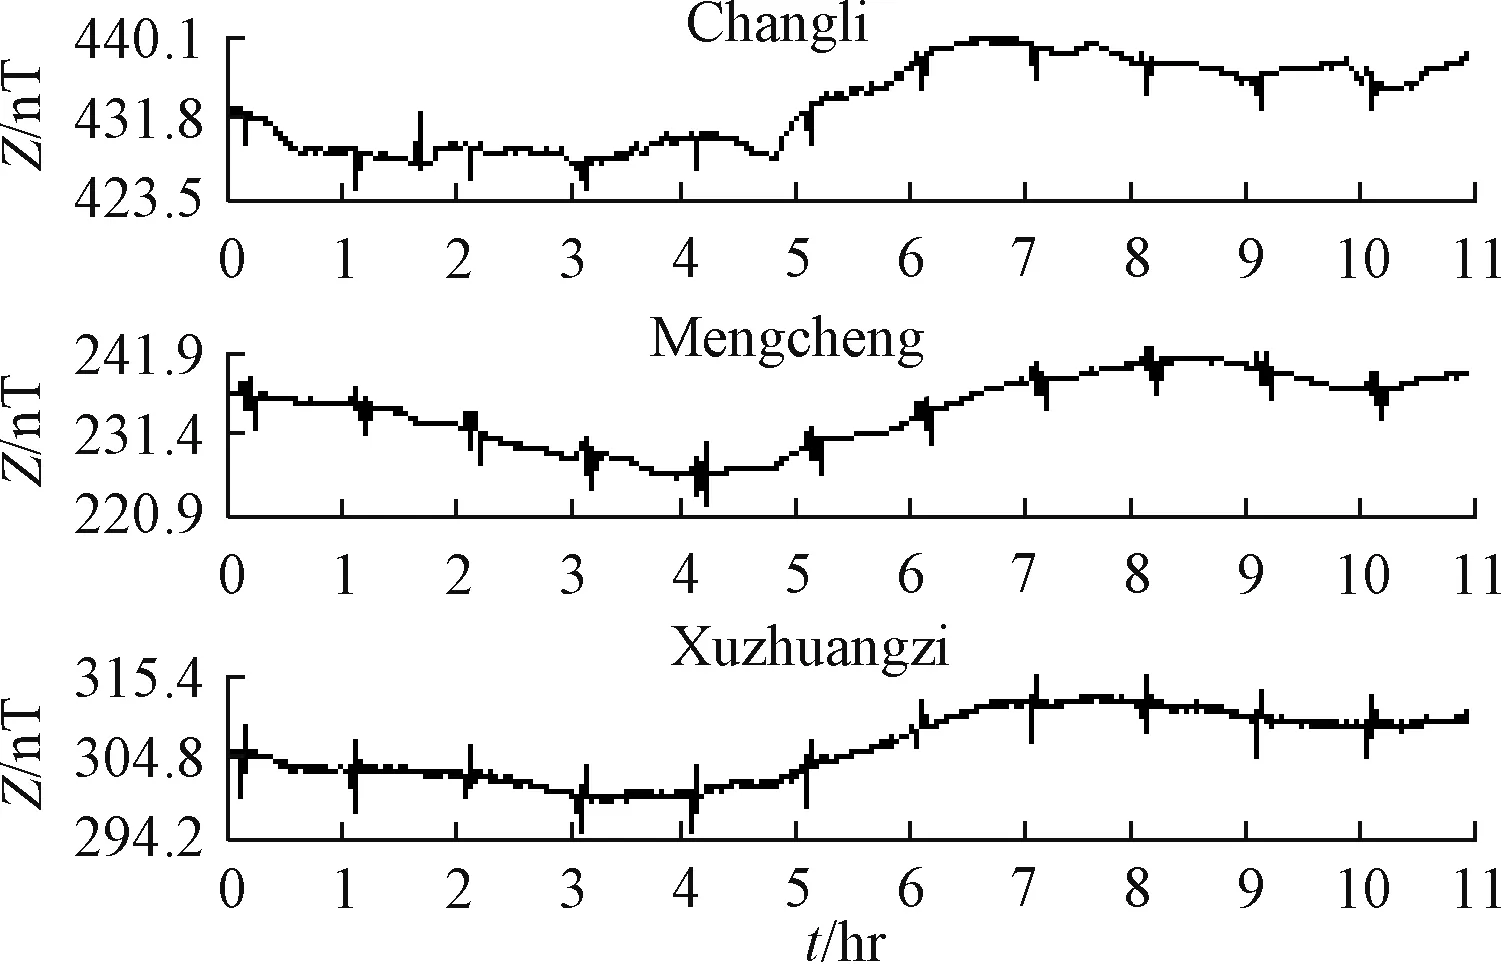
Figure 1 Relative change of geomagnetic Z-component at 0 ∶00-11 ∶00 am(universal time) on March 1,2019
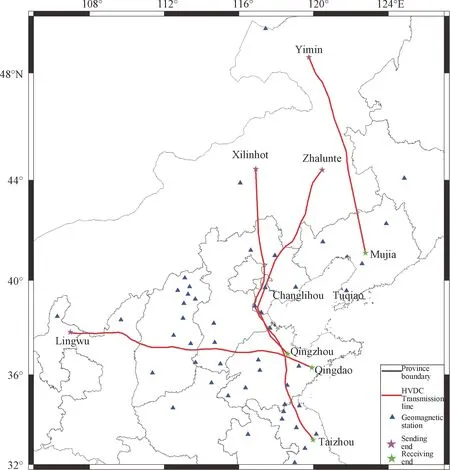
Figure 2 The HVDC transmission lines interfering Changli Seismic Station
As shown in Table 1,the DC voltage of Huliao Line is ± 500 kV,the transmission capacity is 3 000 MW,and the total length is 987 km.Among the 8 kinds of interference analyzed in this paper,all theZcomponents are affected.In most cases,the amplitude is between 3.1 and 3.4 nT,and the average amplitude is 3.1 nT.The pattern rises or falls in steps or slowly,and the duration is about 1 to 11 hours.
The DC voltage of Zha-Qing Line is ± 800 kV,the transmission capacity is 10 000 MW,and the total length is 1 234 km.Among the 5 kinds of interference analyzed in this paper,the average amplitude is 3.74 nT,and the main changing pattern falls or rises in steps.TheZ-component has three large amplitudes of 4.4 nT,4.4 nT,and 5.6 nT.Meanwhile,a slight upward change of the H-component occurs.In the other two kinds of interference,Z-component only has small amplitudes,which are 1.1 nT and 3.2 nT.It also shows that theH-component is not affected.
The DC voltage of Xi-Tai Line is ± 800 kV,the transmission capacity is 1 000 MW,and the total length is 1 628 km.Among the 4 kind of interference analyzed in this paper,the average amplitude is 3.5 nT,and the main changing pattern falls and rises in steps.TheZ-component has two large amplitudes of 3.8 nT and 4.8 nT,along with a slight upward change of the H component.In the other two kinds of interference,Z-component only has small amplitudes,which are 1.8 nT and 3.6 nT.H-component are also not affected.It can be seen from the above that,regardless of the earth resistivity power supply or HVDC transmission,theZ-component interference amplitude is more significant than theHcomponent,and it mainly changes in steps.In some time periods,the changing pattern shows slow rise and fall or ladder trend,which may be related to the change of the current.When the amplitude of theZ-component is less than 3.8 nT (approximate number,as there are only limited cases),theH-component does not change.Conversely,theH-component also shows weak interference synchronously,reflecting that the difference in the superposition of the magnetic field strength is caused by different distance and different current magnitude.In addition,the altitude difference between the high-voltage transmission line and the geomagnetic station is also one of the factors that determine the interference characteristics.When the magnetic station and the high-voltage transmission line are at the same altitude,the magnetic field generated by the DC line only affects the geomagneticZ-component.When there is a difference in altitude between the two,the impact of the DC line acts on bothZandHcomponents simultaneously (Tang Bo et al.,2011).
This paper also compares the stations on both sides of the same high-voltage transmission line.The variation characteristics of the geomagnetic component are different due to the station distance and azimuth.For example,in Changli and Hongshan station,which are on the east and west sides of the Zha-Qing Line (345 km west of the line),order variables in opposite directions of theZcomponents are recorded simultaneously 17 ∶52-18 ∶34 (Universal Time) on April 30th,2017.The order variables ofZcomponents in Changli and Hongshan Stations are 6.31 nT and -0.95 nT,respectively,and the duration is synchronized.Meanwhile,theH-component shows no interference at Hongshan Station,but shows a 1.9 nT rise at Changli Station.
2.2 Transient Random Interference of Electrified Railway
The cause of this interference remains unknown in the data processing of Changli Station in previous years.The main changing characteristics are illustrated in Fig.3.TheZ-component of the FGM Fluxgate Magnetometer recorded a piece of interference information on January 5th,2017 that a total of 5 spikes have appeared during 8 ∶30 to 8 ∶45,including rise and fall.According to the statistics,similar phenomena occur about tens to hundreds of times a year.Meanwhile,there is no regularity of the occurrence time,periodicity,and variation amplitude,leading to difficulties in troubleshooting the source of interference in daily work.
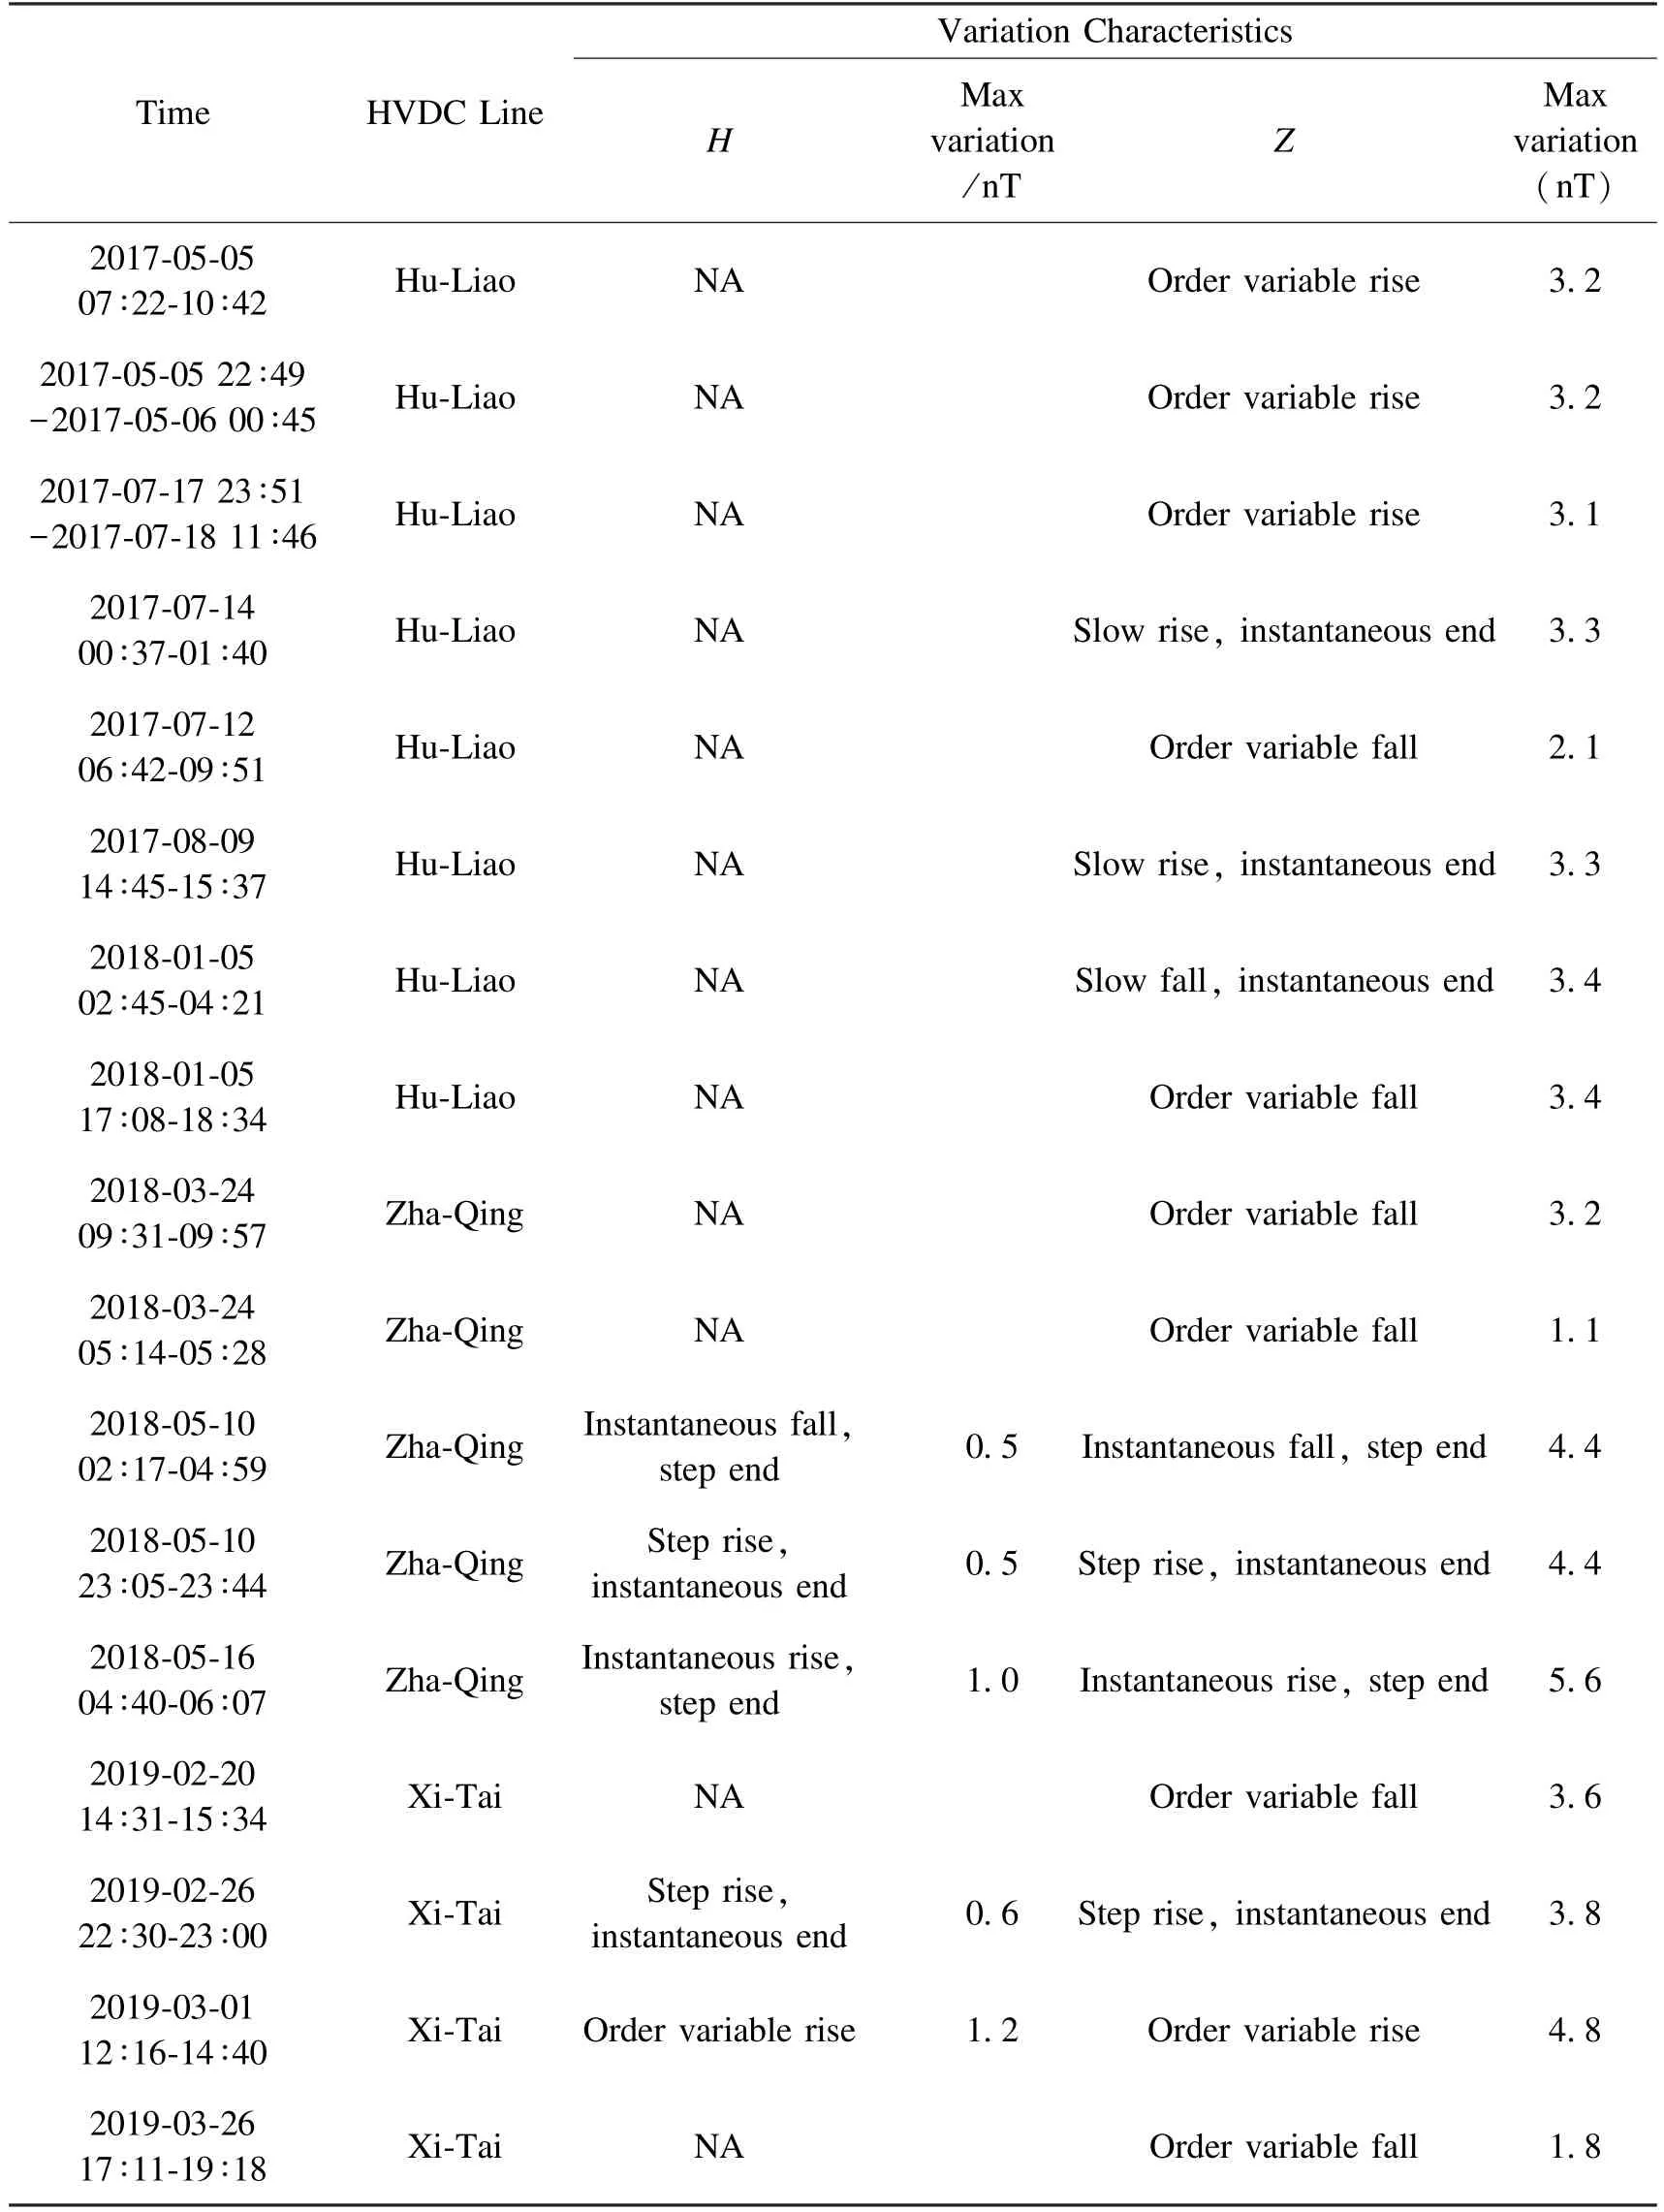
Table 1 HVDC transmission line interference variation characteristics of Changli Seismic Station
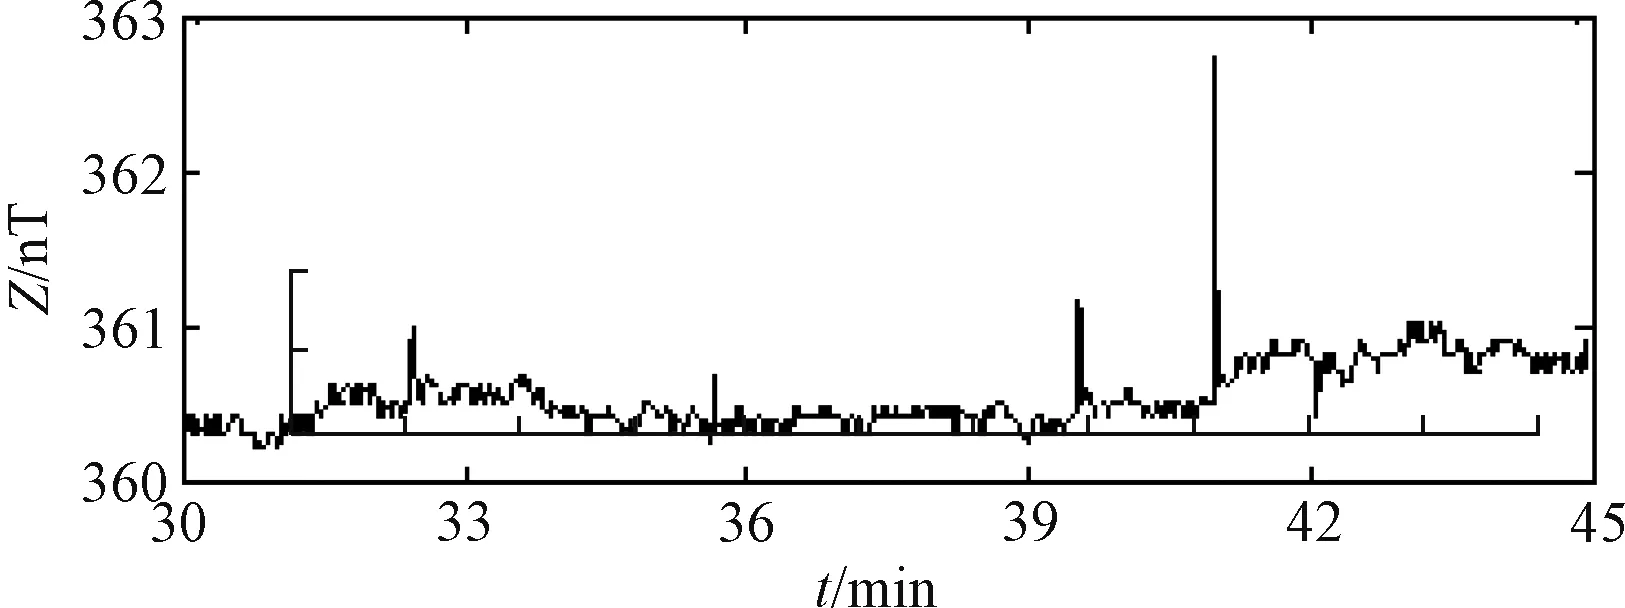
Figure 3 Electrified railway discharge interference signal recorded by FGM fluxgate magnetometer
3 EXPERIMENTAL INVESTIGATION OF TRANSIENT INTERFERENCE OF ELECTRIFIED RAILWAYS
3.1 Environmental Investigation
In order to troubleshoot the aforementioned unexplained interference,the on-duty personnel have conducted the following investigations:①Using the power outage method in certain area to eliminate the electric leakage interference from neighboring food factory or other individual enterprises;②Changing the power supply source for earth resistivity observation at the same station and the method of power supply mode,to eliminate the DC power supply interference; ③Comparing the results from multiple geomagnetic instruments to eliminate the cause of instrument error; ④Taking advantage of the power outage maintenance time of the electric substation to eliminate the leakage interference of substation; ⑤Recording and analyzing the passing time of the railway train by video,to eliminate the ferromagnetic interference of the train and bullet train; ⑥Comparing the interference records to meteorological records,to eliminate lightening interference.
3.2 Experimental Intensive Observation
The region 1.18 km south to the seismic station is the route that Changli electrified railway must path through and the railway has been constructed for decades.Historical simulation observations and the currently operating minute value sampling magnetometers have not found obvious interference caused by passing trains.Therefore,the environmental interference has been gradually overlooked in the comparative analysis of multiple instruments at the same station in more than 10 years.In these years,people always categorized the influencing factors as unstable or occasionally bad numbers in the observation system,and finally deleted them.However,we notice that the high-precision second sampling rate geomagnetic instrument has recorded a very short-term interference change,showing a feature of instantaneous positive jump.The corresponding influencing factors may be related to the circuit.
In railway transportation,one question that should always be considered is whether the electrical contact of the pantograph and catenary system is working normally during highspeed operation.The electrical contact of the pantograph system refers to a physical and chemical phenomenon in which the sliding plate and the contact line are in contact with each other and achieve circuit transmission through the contact interface.For stationary trains,the pantograph system is in settled electrical contact,and its main phenomena and problems include contact resistance,contact heating,and contact welding.When the train is running,the pantograph system has the characteristic of sliding electrical contact.In addition to the settled electrical contact problems,there are also problems of the abrasion,friction,and lubrication between the sliding plate and the contact line (Holm R.,1958).However,the pantograph system may produce electric sparks or arcing under certain circumstances.For example,when the pantograph and catenary slideare contacting each other,the actual conductive area of the sliding plate and the contact line is relatively small,resulting in high contact resistance and a large train flow rate.The current then flows through conductive spots and generates heat rapidly to form sparks.In some cases,the conductive spot may even fracture,and sparks are also formed at the contact points.In addition,when the sliding plate and the contact line are separated completely or partially due to other reasons,the current flows through and contact the heat energy generated by the resistance at the moment before separation.The conductive spot is heated up quickly and reaches the boiling point of the material,causing explosive gasification.At this time,an electric spark can occur within 10-3s.A large number of sparks converge into a 10-20 V electric arc and produce electromagnetic interference to the surrounding environment (Wu Jiqin et al.,2008).However,whether or not the Changli Railway will produce electric sparks and affect the geomagnetic observation of the station are still need to be verified by further experiments.
3.2.1 Design of Experiment
In order to verify whether the electric spark phenomenon has an impact on the geomagnetic observations of Changli Seismic Station,the author conducted the following experiments in 2015:
(1) Set up a video recorder near the railway at 1.2 km south to the seismic station to record the passing trains within 1 day.At the same time,based on the time occurrence characteristics of theZ-component second value recorded in Changli Seismic Station before,5 measuring points are set on the north and south sides of the railway (Fig.4) to observe the interference in real time during different periods that mass interferences occur.(2) Examine whether the railway interference exists through comparative analysis of video recording and measuring point data.
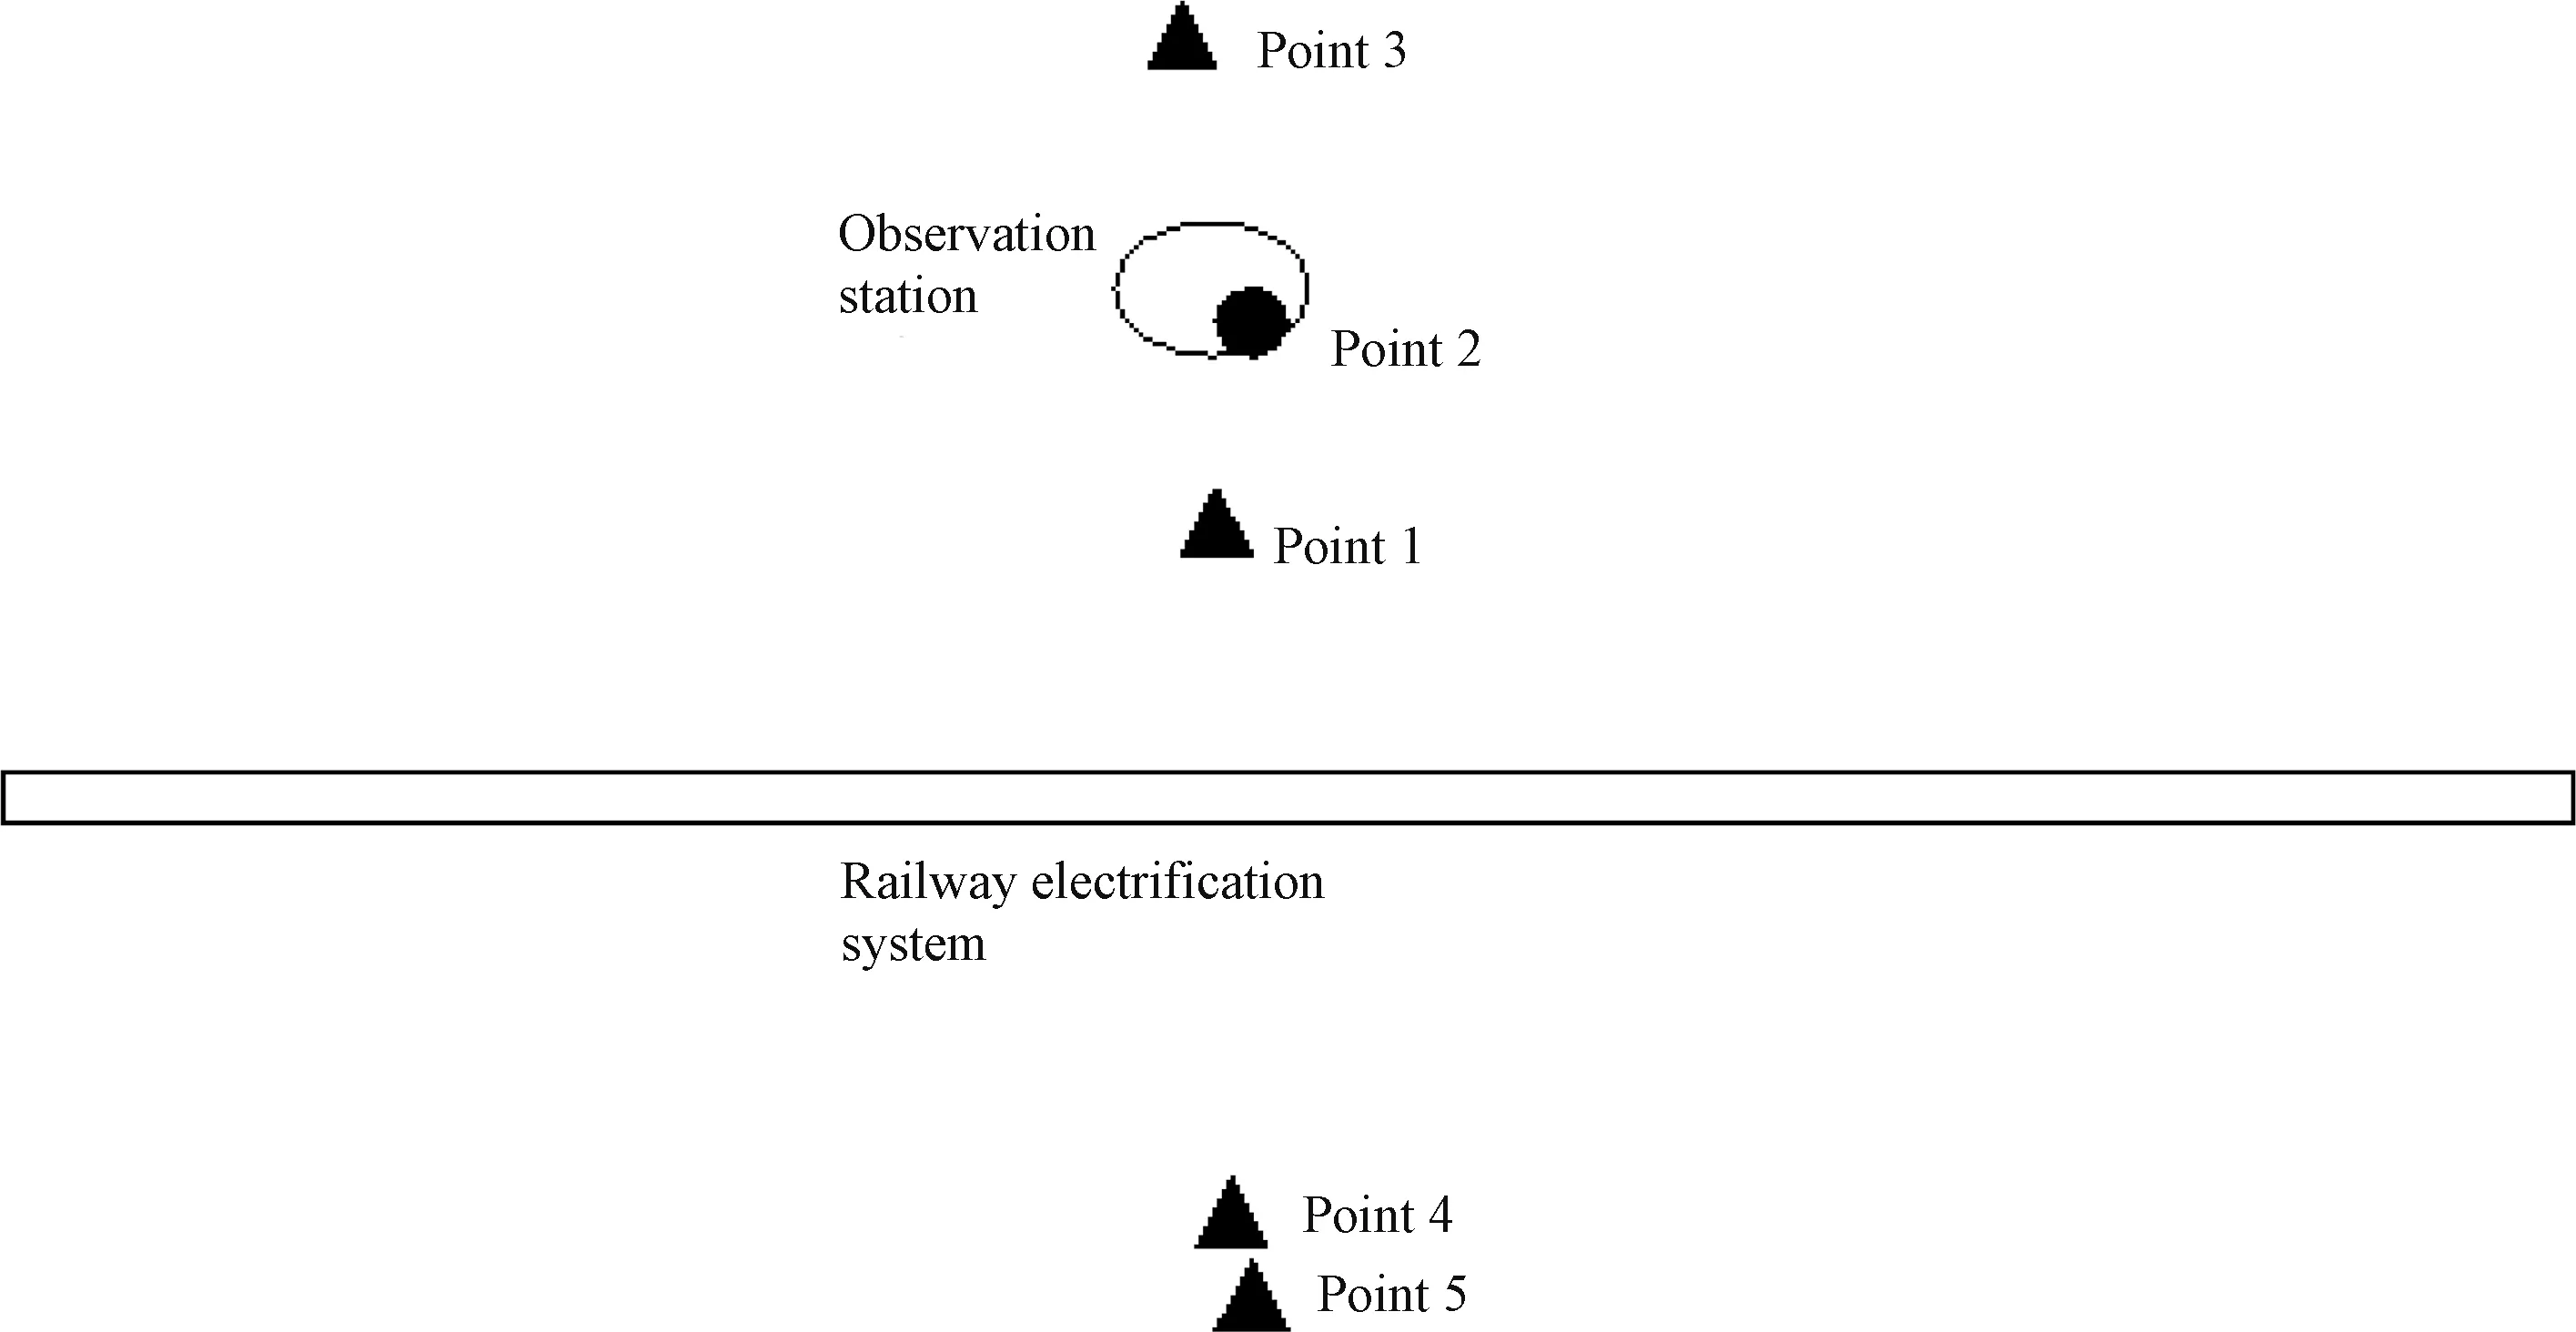
Figure 4 Schematic diagram of seismic stations,measuring points and railway locations
The vertical distances between each measuring point and the railway are:0.86 km,1.18 km,1.45 km,0.73 km,1.18 km,respectively.Measuring point 2 and measuring point 5 are equidistant from the railway in order to compare and analyze the data changes on the north and south sides of the railway.Measuring point 2 is the closest to the seismic station,about 10 m to the east.The observation instrument adopts spare FGM fluxgate magnetometer.
3.2.2 Observation Results and Analysis
On August 5th,2017 and October 17th,2017,the research team conducted a two-day tracking observations on the designed measuring points.The comparison curves between the original second data of each measurement point and the data of the operating instruments in the seismic station during the same period are shown in Figs.5-9.A summary of the interference characteristics are shown in Table 2.The calculation method of the variation amplitude is to use the sudden jump extremum to minus the normal value in the last second before the interference.
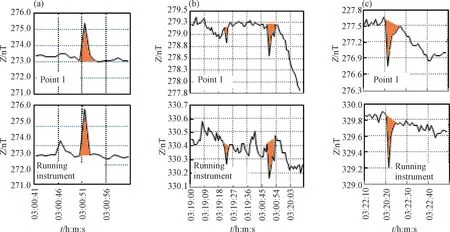
Figure 5 Comparisonofinterference between measuring point1and seismic station operating instruments during timeperiod03on October17th,2017
In Table 2,the interference variation data from the measuring points 1 to 5 and the operating instruments of the seismic stations are compared and the following characteristics are identified:(1) The duration of the interference on the north and south sides of the railway is generally 2 to 3 s;(2) A total of 14 interferences are recorded at measuring point 1-3 in the north of the railway,and all are in the same direction as is recorded by the operating instruments at the seismic station.A total of 11 interferences are recorded at measuring point 4 and 5 in the south of the railway,including 10 in opposite direction as is recorded by the operating instruments at the seismic station,and 1 in the same direction.(3) As the distance between the railway and the measuring points 4,1,2 (or 5) and 3 gradually increases,the average value of the variation ratio gradually decreases,which are 2.75,1.87,1.14 (or 1.72),0.89,respectively.(4) According to the perspective of the amplitude ratio,the southern measuring point 4 and 5 have a certain degree of dispersion,and the northern measuring points are relatively stable.
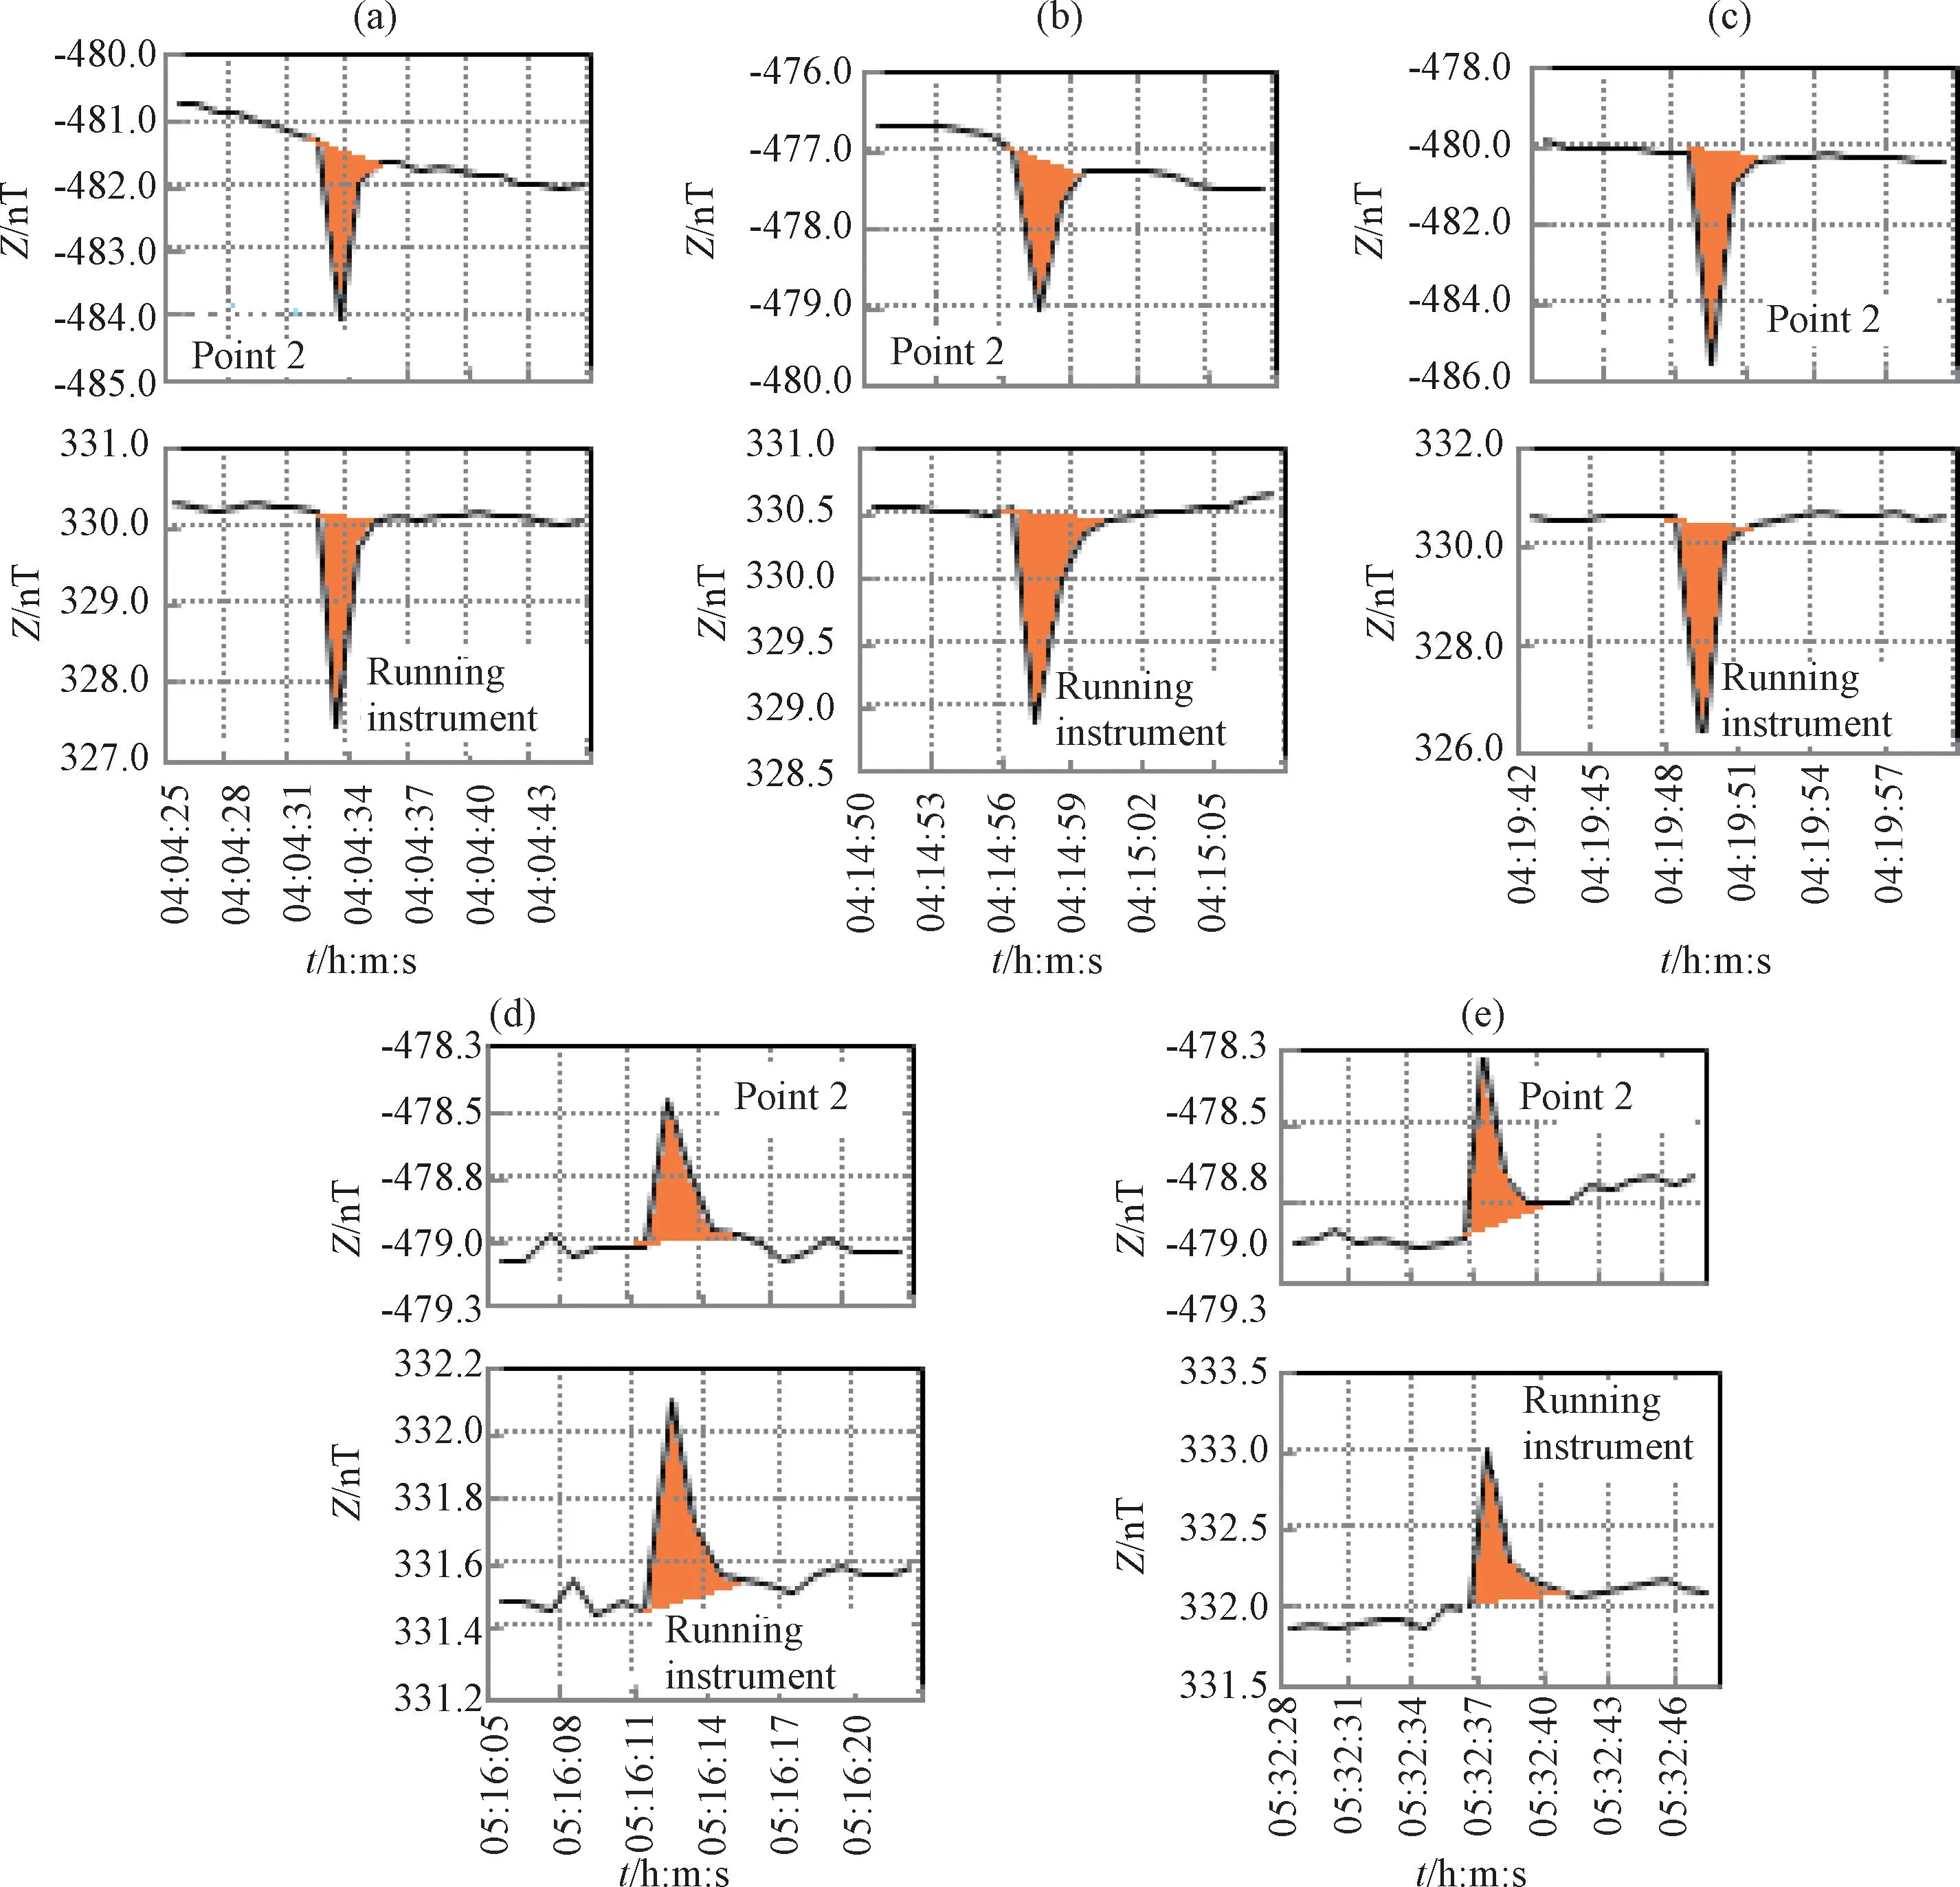
Figure 6 Comparison of interference between measuring point 2 and seismic station operating instruments during time period 04 to 05 on October 17th,2017
In summary,during the 2-day monitoring period,5 measuring points have been deployed,and there were various trains traveling back and forth.The interferences recorded by the experimental intensive observation are synchronized with the operating instruments at the seismic station,and the interference data on the north and south sides of the railway changes reversely,confirming that the measuring point distribution along the railway is correct.The magnetic field generated on the railway line has opposite tangent directions on the north and south side,resulting in a reverse order variable in the observation data.Judging from this,the source of interference is the discharge phenomenon caused by the operation of the pantograph system.In addition,as the distance between the measuring point and the railway increases,the ratio of the interference amplitude between each measuring point and operating instruments at the seismic station is decreasing.This also indicates that the source of the interference should be on the railway line near the seismic station.
4 INTERFERENCE MECHANISM ANALYSIS
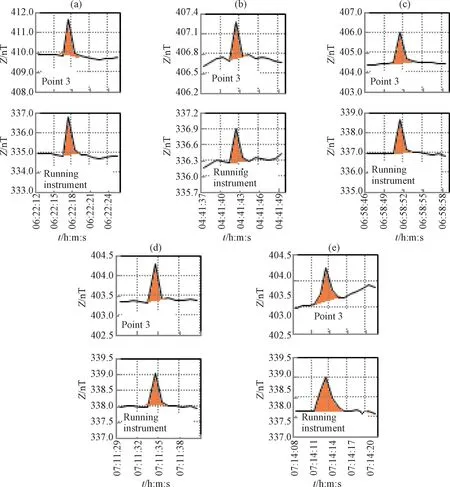
Figure 7 Comparison of interference between measuring point 3 and seismic station operating instruments during time period 06 to 07 on October 17th,2017
In the observation of geomagnetic second data,a large portion of the contaminated data are related to rail transit.The main factor for most of them is ground leakage or electromagnetic interference.The change of the underground electrical structure and the vector superposition of the spatial magnetic field can also cause the change of the relative geomagnetism observation data within a range of tens to hundreds of kilometers.
The magnetic field exists not only around magnetic objects,but also around energized conductors and moving charges.The force acts on a current loopL1near another current loopL2follows Ampere's law:

In the Equa.1,I1,I2are the current intensity of the current loopsL1andL2respectively,dL1,dL2are the current elements ofL1andL2respectively,ris the position vector from dL2to dL1,andμis the permeability of the medium.Also,we regard the geomagnetic observation line asL1and the interference line asL2.According to Biot-Savart Law,the magnetic field strength vector B ofL2acting onL1can be expressed by Equa.2:

It can be seen thatBis related to the magnitude,direction and position of the magnetic field current generated by lineL2,and irrelevant to the magnetic permeabilityμ(Xu Wenyao,2009).
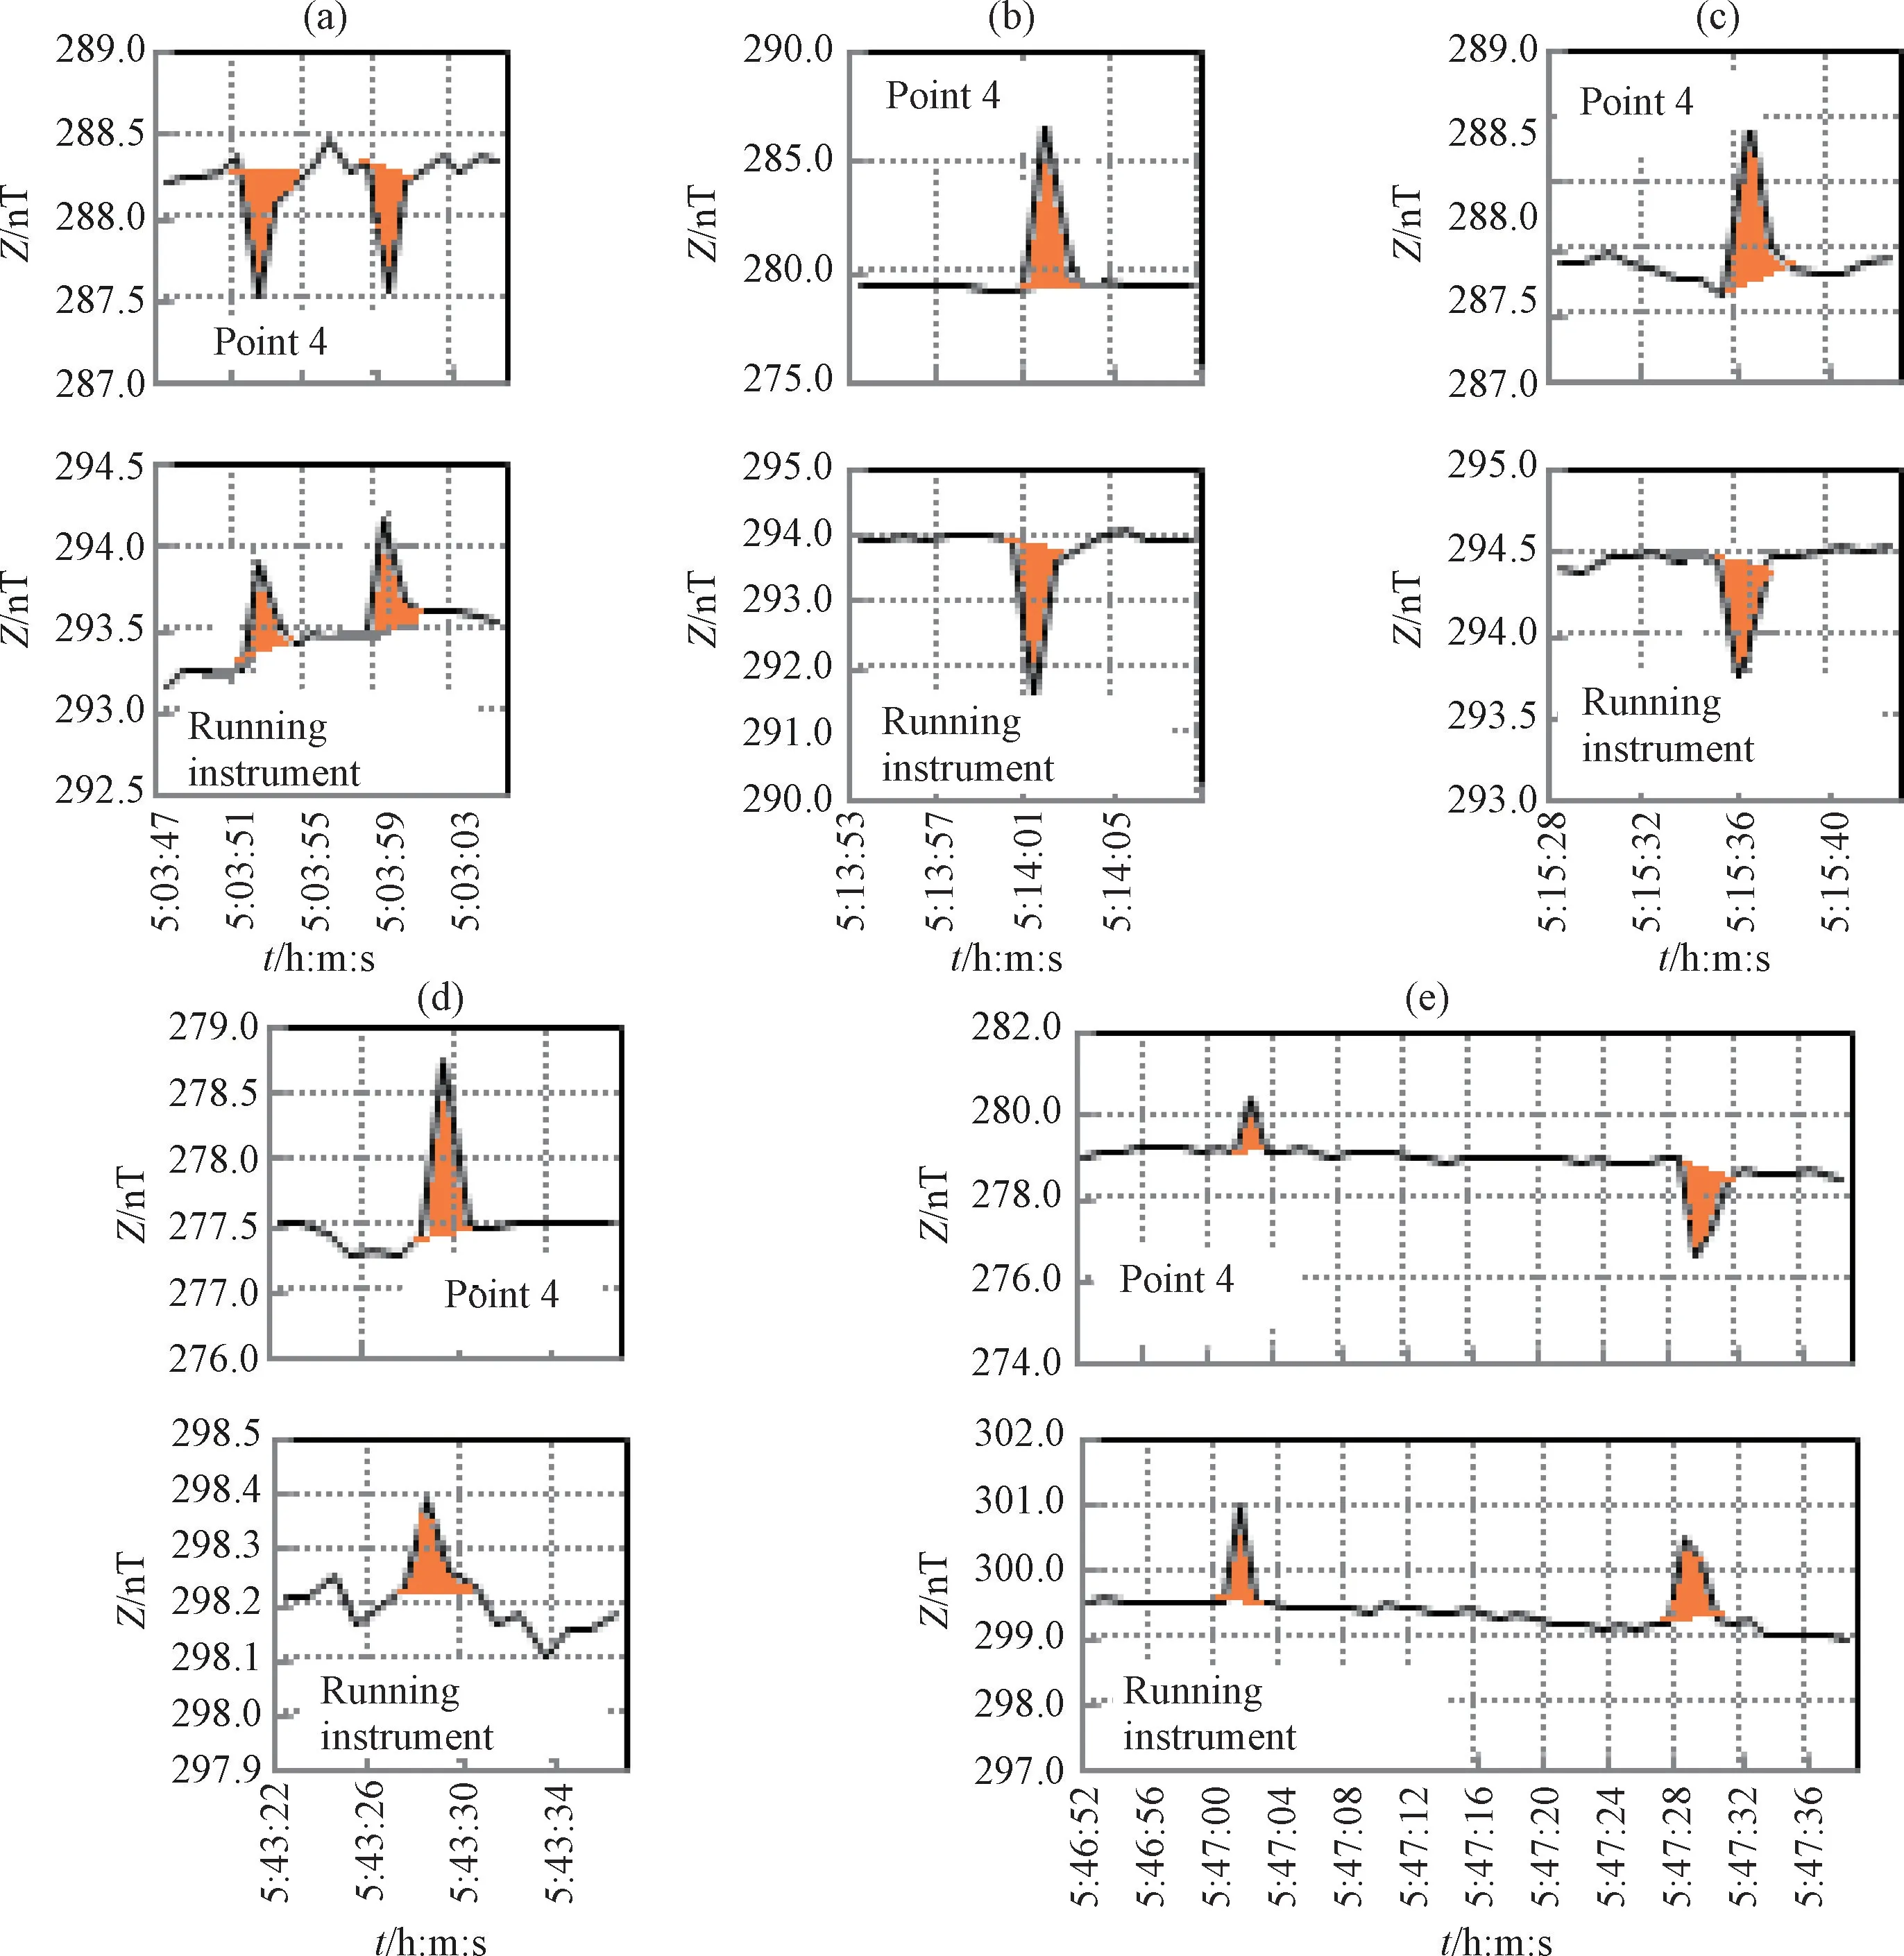
Figure 8 Comparison of interference between measuring point 4 and seismic station operating instruments during time period 05 on August 05th,2017

Figure 9 Comparison of interference between measuring point 5 and seismic station operating instruments during time period 01-02 on August 06th,2017
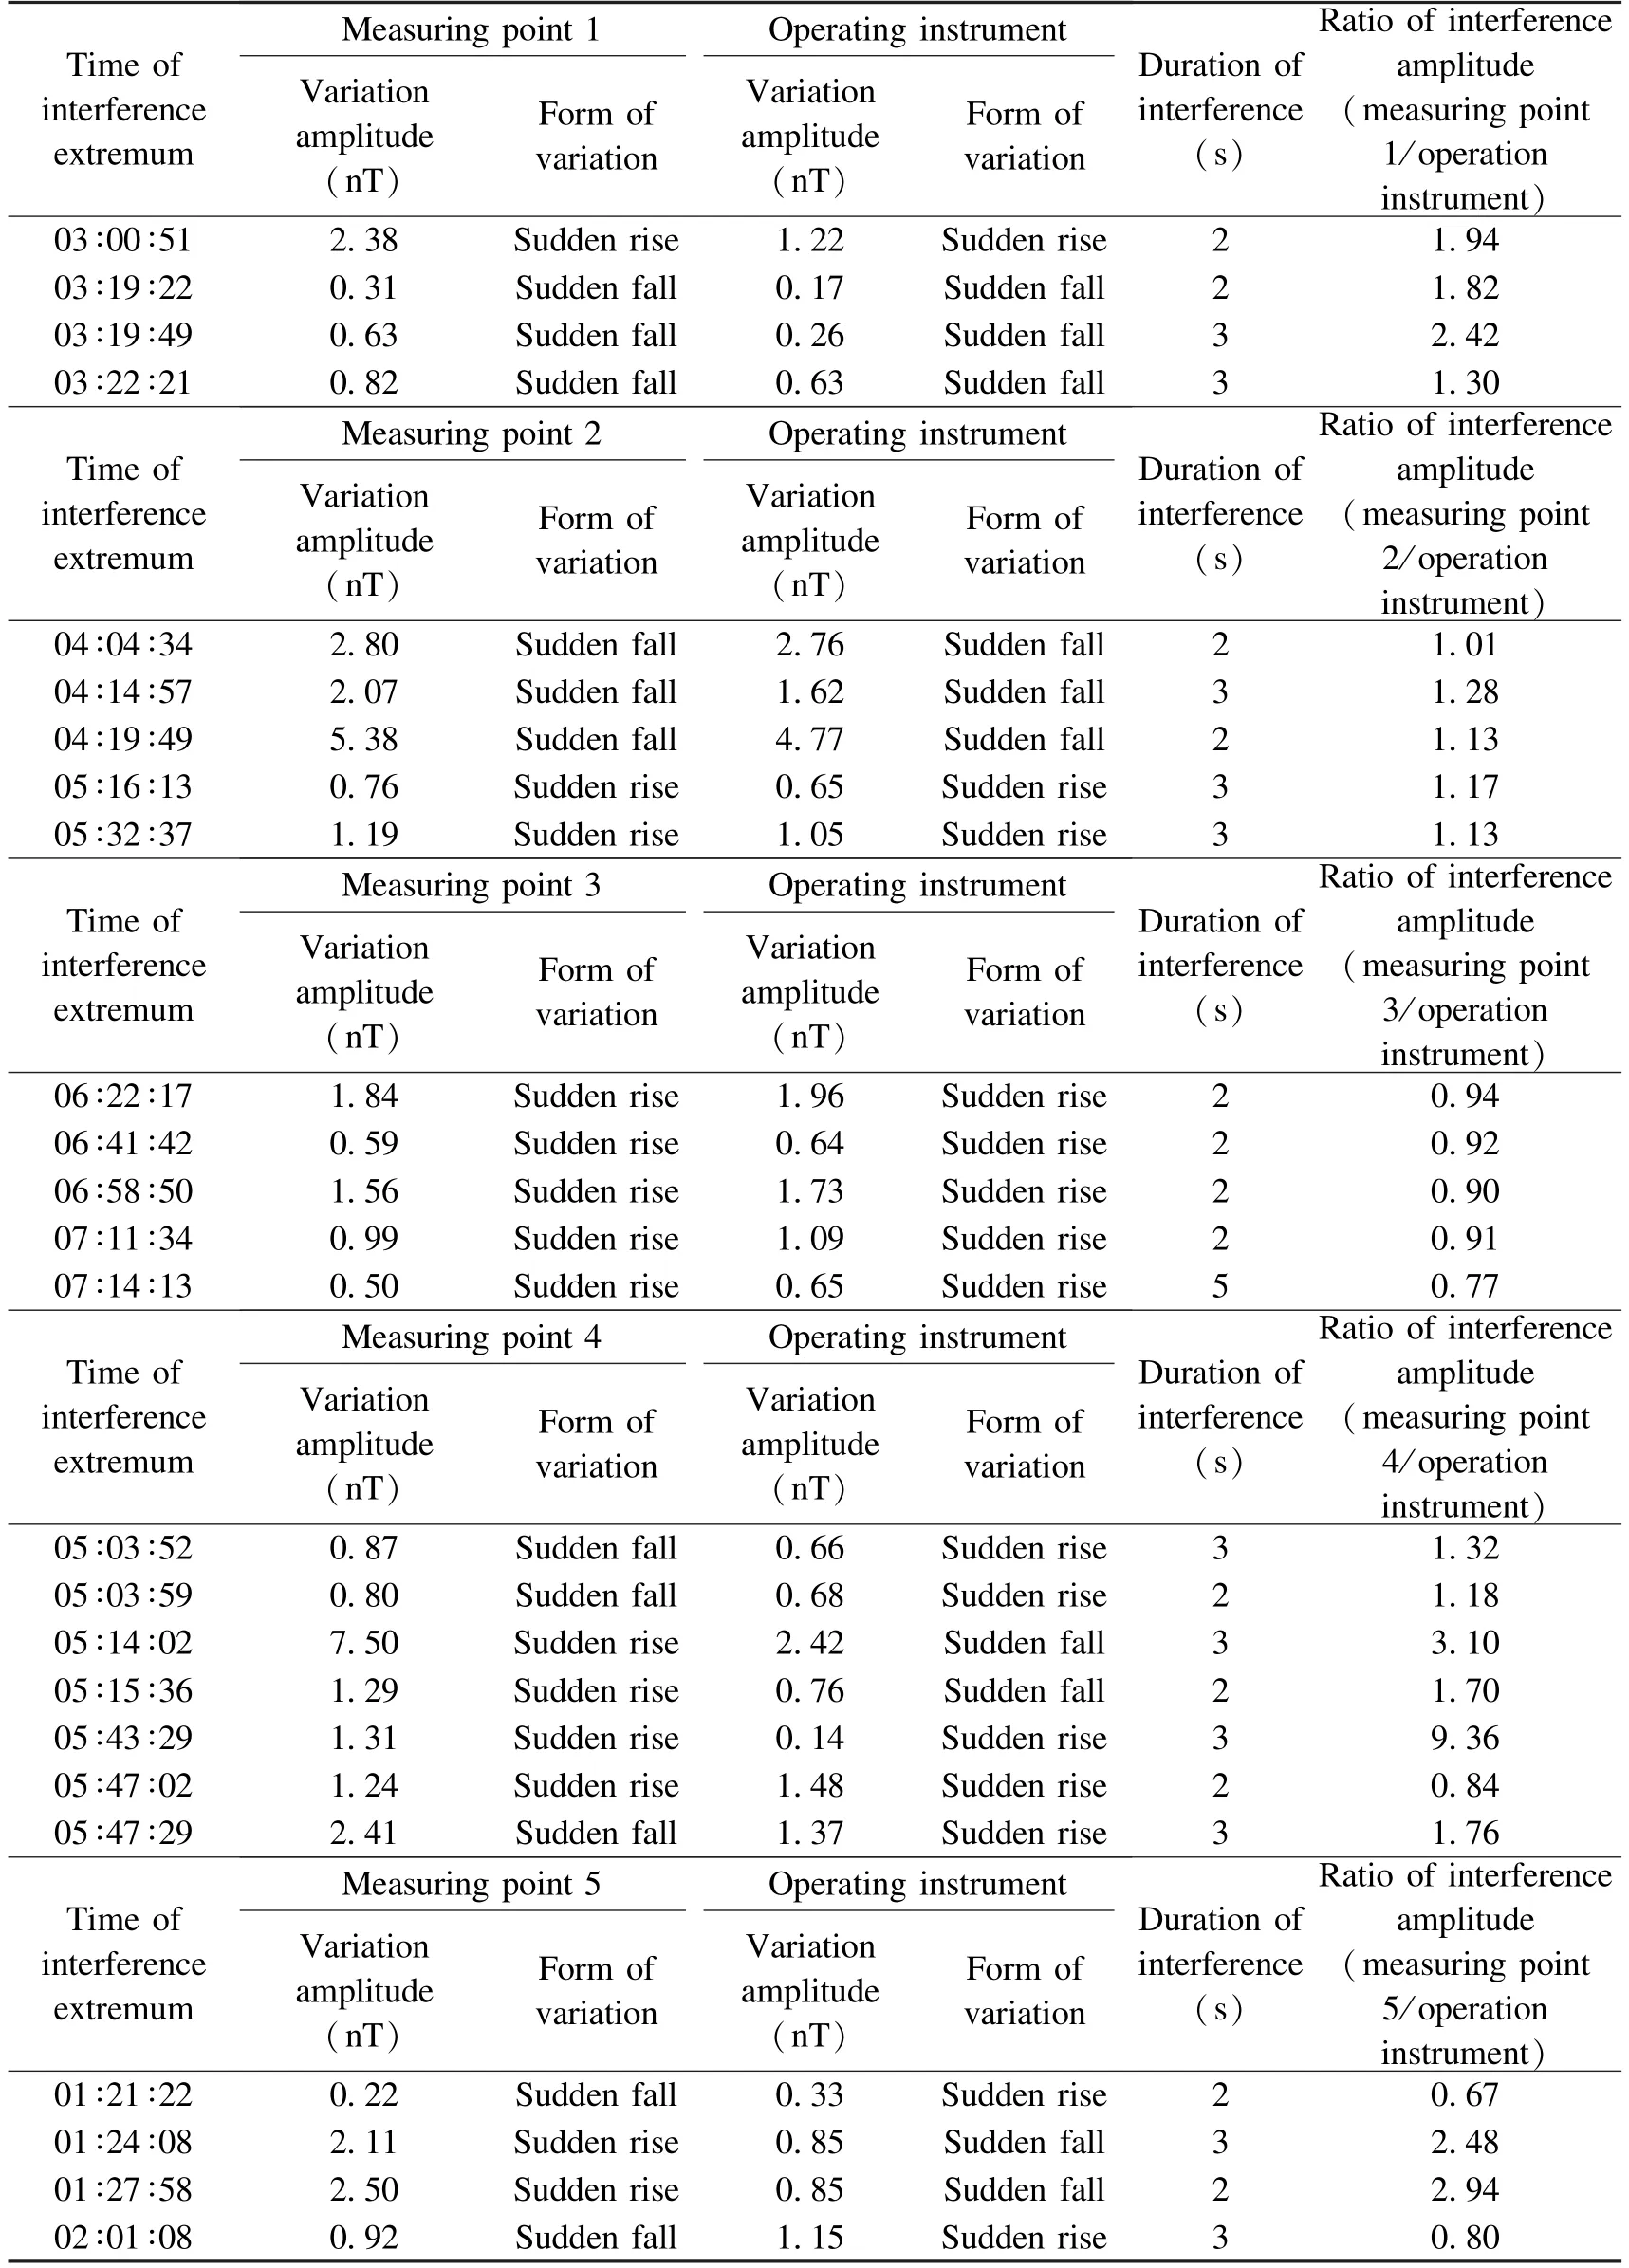
Table 2 Variation characteristics of observation data at each measuring point
Therefore,during the earth resistivity DC power supply (current is stable) at a comprehensive electromagnetic observation station,the influence quantity on the geomagnetic component and the direction of the order variable are unchanged.However,the power supply current of the earth resistivity of each seismic station is set differently,so the degree of influence of the geomagnetic component is also different.HVDC transmission interference also follows this principle,however,the direct reason of the interference is the unbalanced current between the positive and negative lines.Such circumstances may lead to transmission current is changed which may lead to the switch between bipolar and unipolar operation,or the circuit breaks down,the electric current in two lines will be different.(Tang Bo et al.,2011).The additional vector magnetic field generated by it will have an impact on the DC magnetic field along the line over nearly ten thousand square kilometers.The same HVDC transmission line may result in different interference amplitude,order variable direction or mode,and the reason is the change of the current system of the transmission line itself.
The transient large-energy discharge phenomenon of electrified railways also conforms to the principle of Equa.2.The main difference between it and the DC transmission system is that the randomness and the obvious current instability of transient changes.Besides,the strength of the generated magnetic field is relatively weak,and it is difficult to capture the source of interference.
5 CONCLUSIONS
The monitoring of geomagnetic stations is increasingly affected by the environmental factors,especially in first-and second-tier cities.The main sources of interference are electricity transmission and construction of electrified system facilities.This paper analyzes two main types of power supply interference encountered in the observation of theZ-component second data of the Changli Seismic Station FGM Fluxgate Magnetometer.One type is the impact of DC transmission(or power supply),and the other one is the impact of electrified railway discharge.
DC transmission (or power supply) interference is closely related to changes in the current system of the interference source,such as magnitude of current,distance and orientation of the interference source,etc.Although the characteristics of each change are not the same,they basically vary in steps,and are often recognizable because of the repeated occurrences.In addition,according to the experimental observations in this paper,we consider that the discharge phenomenon of the electrified railway,caused by the contact of pantograph system or other reasons during the operation,is a factor that may cause random small interference in the geomagnetic second data of Changli Seismic Station.This discovery explained the similar phenomena that appeared in the data of previous years and correct the previous misjudgment.Prior to this experiment,in the daily data processing at Changli Seismic Station,such interference had been described as unstable working system,unstable power supply,or occasional sudden jumps with a certain degree.As a result,the changes in the site environment has been ignored.Through this experimental study,we not only inspect and determine the interference sources,but also provide a very useful reference for peer seismic monitoring work.
From another perspective,we can also see that the information sensitivity of the second sampling rate of digital geomagnetic observation is much better than the minute sampling rate and analog observation.Numerous electromagnetic interference signals are extremely easy to capture.In daily work,we should pay attention to collecting information from broader channels.
ACKNOWLEDGEMENT
I would like to thank Gao Xiwei from Gaoyou Station,Jiangsu Earthquake Agency for providing assistance for Fig.1.
 Earthquake Research Advances2020年2期
- Earthquake Research Advances的其它文章
- Influence of Bedding and Mineral Composition on Mechanical Properties and Its Implication for Hydraulic Fracturing of Shale Oil Reservoirs1
- Progress and Prospect of Geophysical Research on Underground Gas Storage:A Case Study of Hutubi Gas Storage,Xinjiang,China1
- Analysis of Anomalous Characteristics of Regional Crustal Deformation before the September 16th,2019 Zhangye MS5.0 Earthquake,Gansu,China1
- Study of the Seismogenic Structure of the October 12th,2019 MS 5.2 Beiliu Earthquake,Guangxi,China1
- New Understanding of Variation Characteristics of Well Water Level in Majiagou Mine,Tangshan City,Hebei,China1
- Microseism Variations in Response to Antarctic Seasonal Changes in Sea Ice Extent1
