Analysis of Anomalous Characteristics of Regional Crustal Deformation before the September 16th,2019 Zhangye MS5.0 Earthquake,Gansu,China1
MA Haiping ,WANG Qian ,ZHANG Bo ,WU Shanyi ,WANG Pengtao ,DOU Xiying and LI Minjuan
1) Gansu Earthquake Agency,Lanzhou 730000,China
2) Lanzhou Geophysical Field Science State Observation Station,Lanzhou 730000,China
To study the crustal movement in the vicinity of the epicenter before the Zhangye MS5.0 earthquake in 2019,the characteristics of crustal deformation before the earthquake are discussed through the GPS velocity field analysis based on the CMONOC data observed from GPS.The baseline time series between two continuous GPS stations and the strain time series of an area among several stations are analyzed in the epicenter area.The resulting time series of baseline azimuth around the epicenter reflects that the energy of the fault in the northern margin of Qilian Mountain is accumulated continuously before 2017.Besides,the movement trend of azimuth slows down after 2017,indicating the stress accumulation on both sides of the seismogenic fault zone has reached a certain degree.The first shear strain and EW-direction linear strain in the epicentral area of the Zhangye MS5.0 earthquake remain steady after 2017,and the surface strain rate decreases gradually after 2016.It is illustrated that there is an obvious deformation loss at the epicentral region three years before the earthquake,indicating that a certain degree of strain energy is accumulated in this area before the earthquake.
Key words:Zhangye MS5.0 earthquake; GPS reference station; Velocity field;Baseline azimuth time-series; Strain time series
INTRODUCTION
AnMS5.0 earthquake occurred in Ganzhou District,Zhangye City,Gansu Province(100.35°E,38.6°N) at 20 ∶48 on September 16th,2019 (hereinafter referred as ZhangyeMS5.0 earthquake),the focal depth of the earthquake is about 11 km (http://www.csi.ac.cn/).The earthquake occurred in the Sunan-Qilian section of the northern margin of the Qilian Mountains fault zone.The fault is located in the southern margin of the Hexi Corridor Basin,the North Qilian fault zone in the uplift area between the northeast margin of the Qinghai-Tibet Plateau and the Alxa Block (Institute of Geology,China Earthquake Administration,1993).The Sunan-Qilian section is approximately 200 km long with a dip angle of 60°.It is a thrust and left-lateral strike-slip active fault of the Q3(late Pleistocene Quaternary).The vertical sliding rate of the reverse fault zone in the northern margin of Qilian Mountains since Holocene is less than 1 mm/a (Yang Haibo,et al.,2017).According to the statistics of historical earthquake catalogues since 1900,there have 9 earthquakes withM≥5.0,(8 earthquakes with 5.0≤M≤5.9 and 1 earthquake withM≥6.0) within 100 km of the epicenter.The largest earthquake is the Minle-ShandanM6.1 earthquake occurred on October 25th,2003.TheM≥5.0 earthquakes have a characteristic of concentrated cluster activities sometimes within 100 km of the epicenter.From 1984 to 1992,4 earthquakes withM≥5.0 have occurred successively,and the quiescence and shock are always alternated.The occurrence of the ZhangyeMS5.0 earthquake may indicate that there is still risk of earthquakes withM≥5.0 in the future.
The geological settings in the study area are complex and characterized by intense tectonic movements,leading to numerous historical earthquakes.Thus,it is necessary to study the crustal deformation state before the earthquake.The GPS stations constructed by CMONOC project which provides basic data for crustal deformation analysis.In this paper,based on the GPS flow observation and continuous observation data products provided by the First Monitoring Center,China Earthquake Administration,in combination with the data processing details referred to previous research (Zhan Wei et al.,2011),the crustal deformation before the earthquake are discussed through the comprehensive analysis of the GPS velocity field,the inter-station baseline time-series,and the strain time series near the epicenter.The results can provide basic data for understanding the seismogenic process and mechanism of the earthquake.
1 ANALYSIS OF GPS VELOCITY FIELD
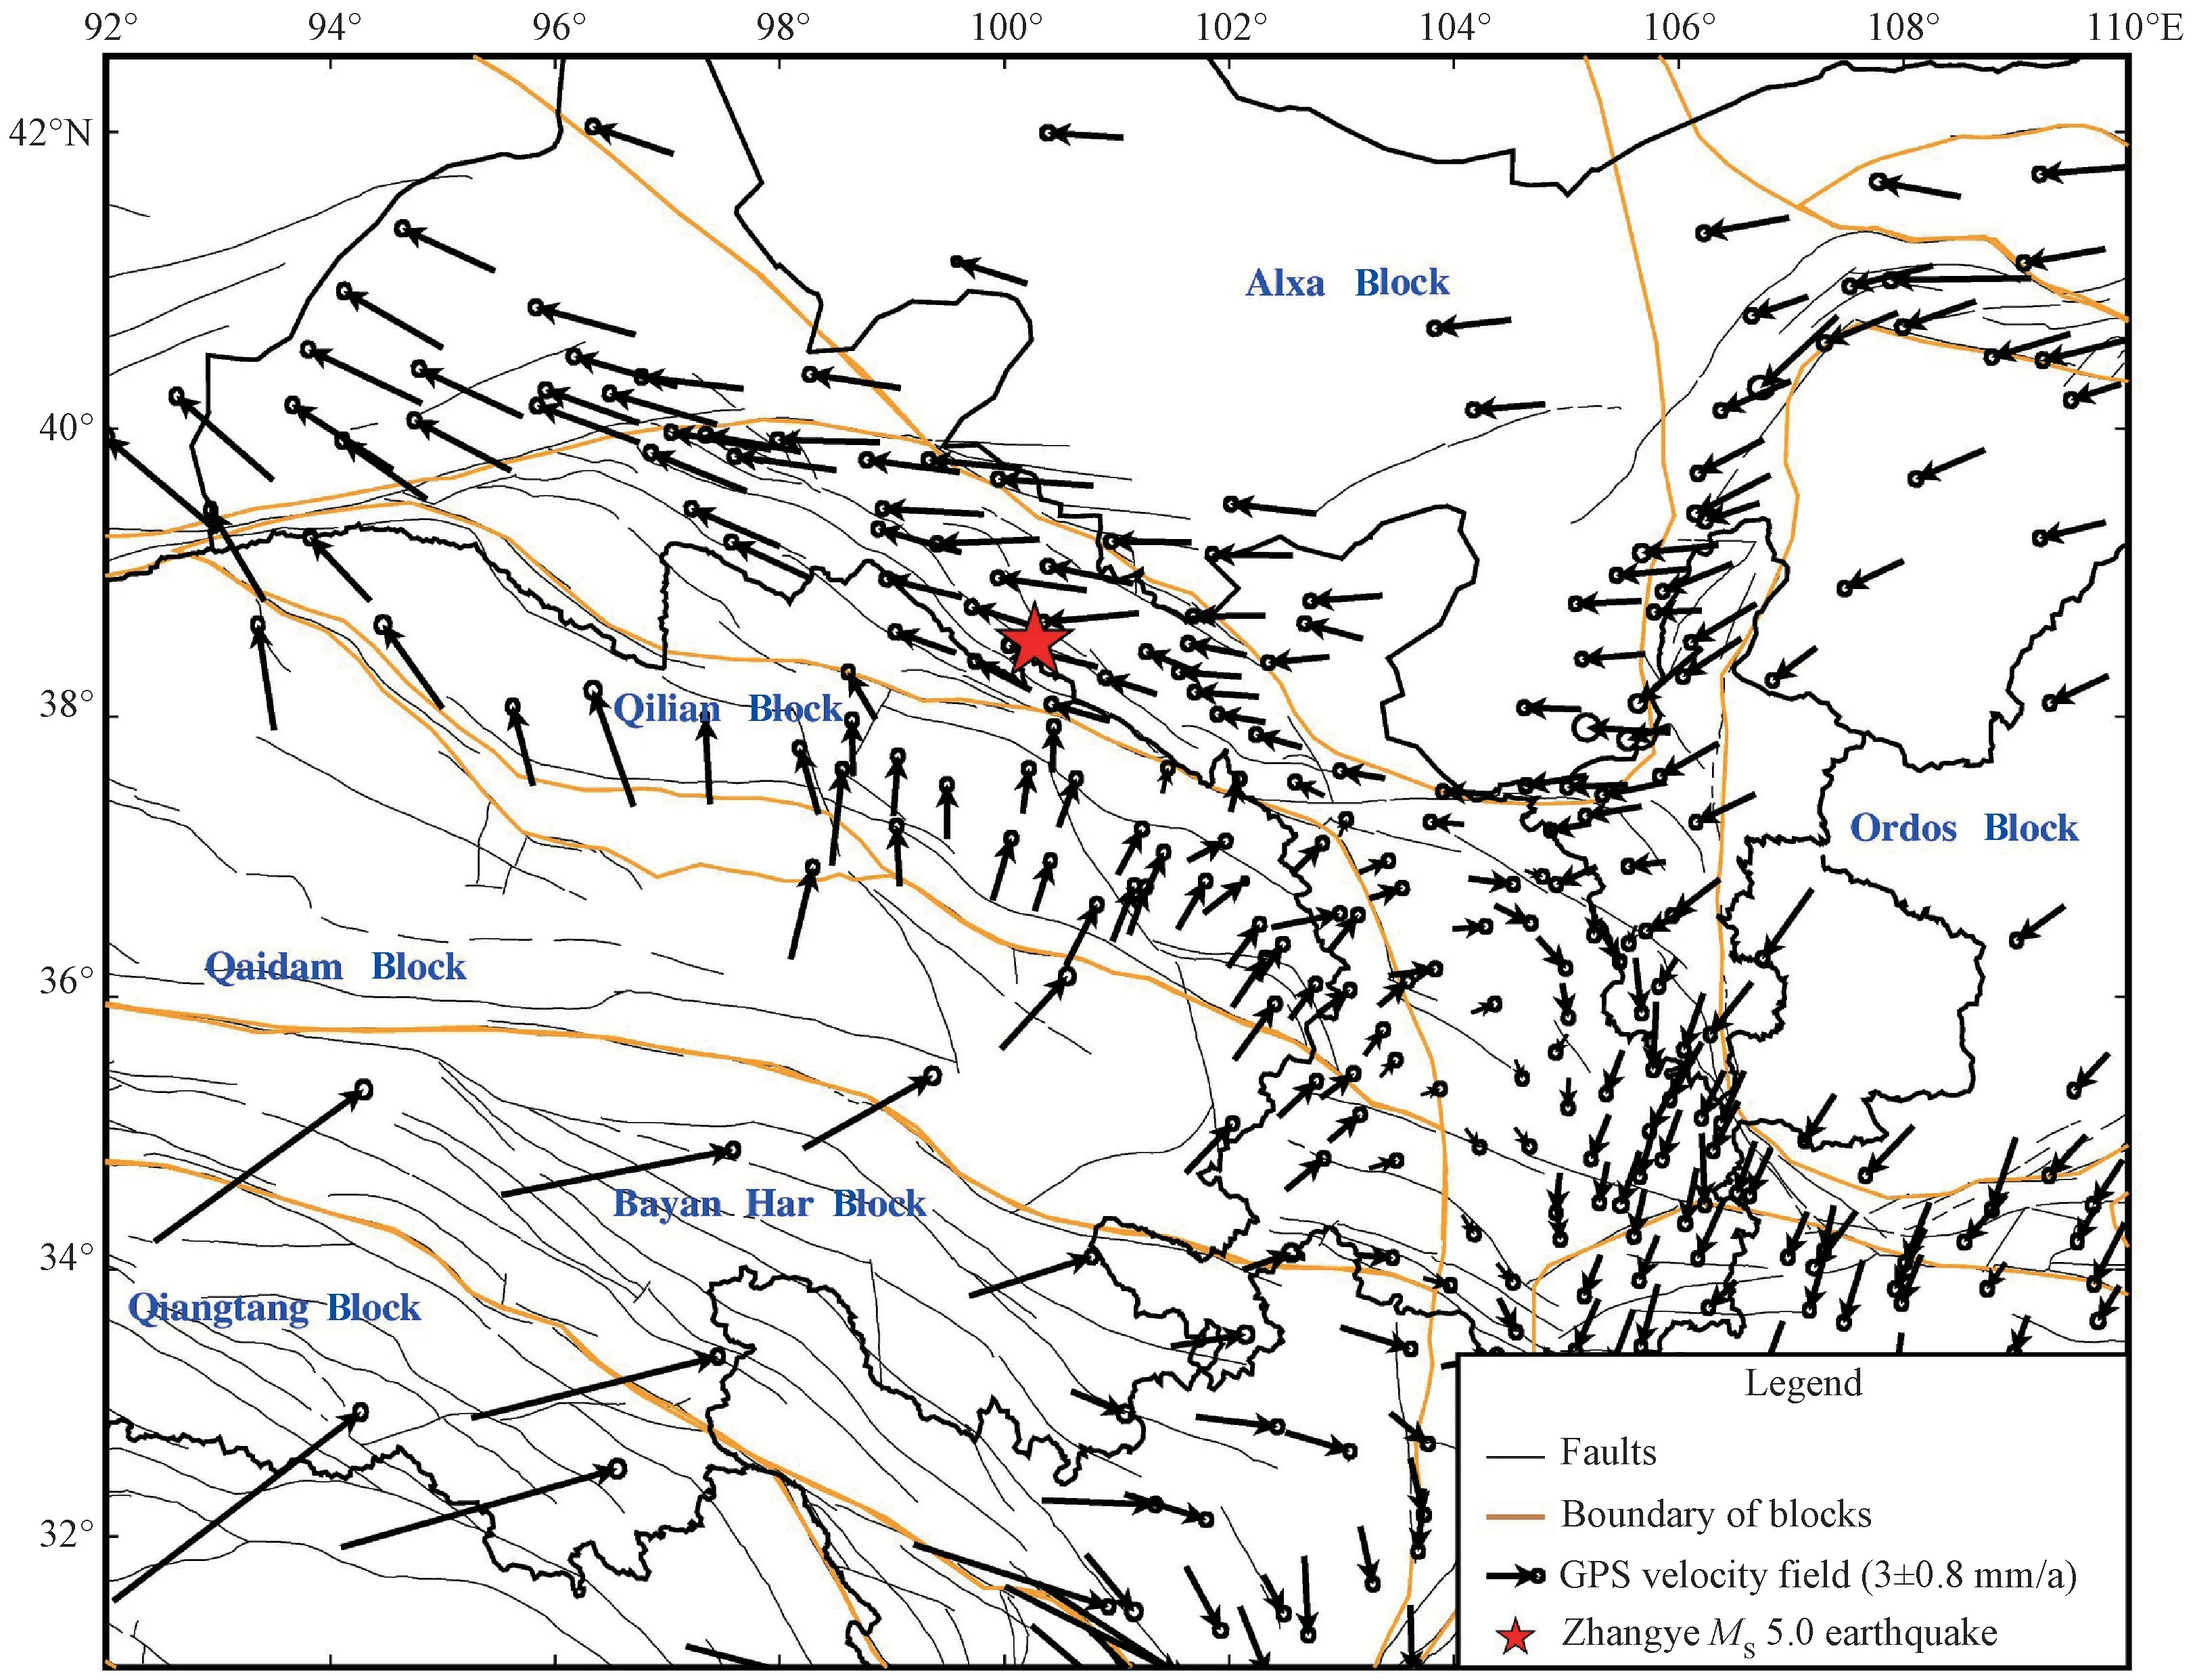
The epicenter of the ZhangyeMS5.0 earthquake is located in the Qilian seismic belt,which is situated in the relatively special region of the northeastern margin of the Qinghai-Tibetan Plateau.Fig.1 shows the fault zone,the block boundary,and the 1999-2007 GPS velocity field based on South China datum.As shown in Fig.1,the Qinghai-Tibetan Plateau,which locates in the southwestern part of the study area,is formed by the convergence of the Indian Plate.However,compared with the tectonically active southwestern part,two rigid blocks named Alxa and Ordos in the north and east of the study area seem more stable.Therefore,the magnitude and direction of the velocity field are strongly different in the Qilian seismic belt and its surroundings.According to Fig.1,the distribution of velocity field on the south side of the Qilian seismic belt is decreased from far to near.In addition,the directions are quite different:the directions within 32°N-34°N are dominantly SSE.The size of velocity field is obviously reduced,and the directions of approximately 100°N have an obvious bifurcation phenomenon near the Qilian seismic belt.The direction of velocity field on the west side of the study area varies from NNE to N and finally to NW from east to west,however,the direction of the velocity field on the east side changes from NNE to NE and finally change to NEE from west to east.The direction of velocity field on NE side of Qilian seismic belt changes from SW to W and then to NW gradually from east to west due to the effect of the stable Alxa Block.Moreover,the epicenter of this earthquake is located at the southwest side where the far-field velocity is large and the near-field velocity is small,and the direction of velocity field on both sides of the seismogenic fault is significantly different.It is indicated that the study area is located in a stress accumulation zone with the high possibility of strong earthquakes.

Figure 1 GPS velocity field near the epicenter of Zhangye MS5.0 earthquake (South China datum)
2 ANALYSIS OF THE BASELINE TIME SERIES
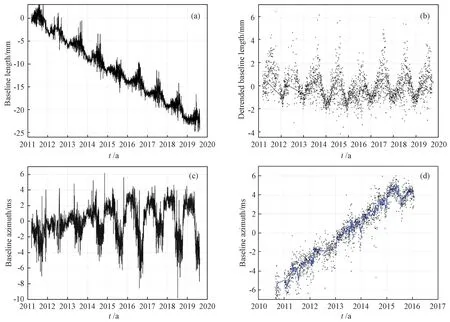
The time series of GPS inter-baseline length refers to the length variation curve versus time based on the data of two GPS continuous stations.The GPS inter-baseline azimuth time series is used to calculate the azimuth variation curve with time using the data of two GPS continuous stations.The inter-station baseline time series is less affected by the frame of reference,which can directly reflect the shortening or extension of the crust in the direction of the connection between the two stations,that is,the dynamic changes of the relative motion between the two stations.In detail,it can be used to describe the characteristics of stretching,extrusion,strike slip of the fault belt or block boundary belt crossed (Zhang Fengshuang,et al.,2011; Jiang Zaisen,et al.,2009; Guo Binghui,et al.,2018).To discuss the crust movement behaviors of the epicenter,the length and azimuth of baselines of the surrounding areas of ZhangyeMS5.0 earthquake is calculated.The distribution of GPS continuous stations and baseline QHQL-NMAY is shown in Fig.2,the length and azimuth time series curve of baseline QHQL-NMAY are shown in Figs.3(a),(b),and (c).However,due to the sparsity of GPS continuous stations near the epicenter area as well as the lack of observation data of GSML stations since the second half of 2017,only the baseline QHQL-NMAY can be analyzed.After summarizing and analyzing the changes of GPS baseline length and azimuth near the epicenter of the ZhangyeMS5.0 earthquake,we find that there is an abnormality in the azimuth time series curve of NE to the baseline QHQL-NMAY before the earthquake,where the result of NW to the baseline GSGT-QHQL is normal,because the direction of the baseline is similar to the direction of the velocity field shown in Fig.1.However,the direction of the velocity field on both sides of the seismogenic fault spanned by the baseline QHQL-NMAY is significantly different.

Figure 2 Distribution of GPS continuous stations in and around the epicenter of Zhangye MS5.0 earthquake
The baseline QHQL-NMAY lies across the northern margin of the Qilian Mountains fault zone.As shown in Fig.3 (a),the slope of the baseline length time series is negative,indicating that the baseline is in a shortening state.The shortening rate is -2.78±0.01 mm/a,and the annual change rate is 4.97×10⁻⁷/a,illustrating that both sides of the seismogenic fault are in a stable compression state.However,the detrended time series of the baseline length shows that the trend changes from decrease to rise after 2015,as shown in Fig.3(b).Also,the shortening rate of the baseline slows down after 2015.As shown in Fig.3(c),the baseline azimuth time series has a positive slope from 2011 to the middle of 2014,indicating that the baseline remains in a steady state during the period of anticlockwise rotation from NE direction.The variation of the baseline azimuth time series increases significantly from 2014 to 2017,the upward trend of the peak is relatively stable,while the downward trend of the trough is decreased.The upward trend of the peak is obviously stable after 2017.The low value from 2017 to 2018 is down to -4 ms,and the low value from 2018 to 2019 begins a new round of downward trend.The continuous rise of azimuth time series curve before 2017 indicates that the energy of fault stress field in the northern margin of Qilian Mountain is in a state of continuous accumulation,and the slow trend of azimuth after 2017 indicates that the stress accumulation on both sides of the fault zone has reached a certain extent.Fig.3(d) shows the baseline azimuth of QHME-GSJT before the MenyuanMS6.4 earthquake.It can be seen from Fig.3(d) that the azimuth time series of the baseline QHME-GSJT spanning the seismogenic fault has a trend of slowing down 10 months before the MenyuanMS6.4 earthquake.Noted that the analysis results of the baseline QHME-GSJT time series show that the baseline length also has anomalies 2 years before the earthquake(Ma Haiping,et al.,2017),which is different from the result that there is no abnormal change in the baseline length in this earthquake.

Figure 3 Time series variation of GPS baselines before the Zhangye MS5.0 earthquake and comparison with baseline time series anomalies before the Menyuan MS6.4 earthquake
3 ANALYSIS OF STRAIN TIME SERIES
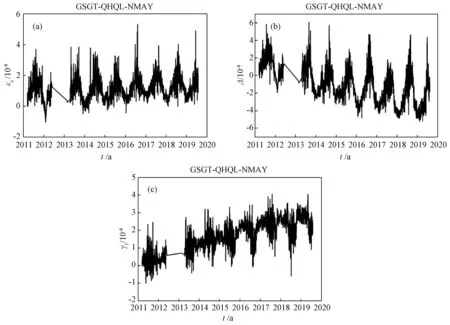
The strain time series refers to the time series of continuous deformation parameters in a small area in the seismogenic zone.It is calculated based on the data of 3 or more GPS continuous stations as well as the strain model (Jiang Zaisen,et al.,2007; Zhou Jun,et al.,2017;Ma Haiping,et al.,2016).The strain parameters are unaffected by the reference datum and can be used to analyze the deformation properties and strength of the small areas.In order to further discuss the dynamic process of crustal deformation and the degree of strain accumulation in the epicenter region before ZhangyeMS5.0 earthquake,the time series of the continuous deformation parameters of three GPS continuous stations including GSGT (Gaotai,Gansu),NMAY (Ayouqi,Inner Mongolia) and QHQL(Qilian,Qinghai)around the earthquake epicenter are calculated,as shown in Fig.4,where (a) is the time series of the linear strain in the EW directionεe,(b) is the time series of surface strainΔ,and (c) is the time series of the first shear strainγ1.The strain parameters of the two areas on the east and west sides of the previous area are calculated,as well as two deformation units consisting of GSJY-GSGT-QHQL and QHQL-GSGL-NMAY GPS continuous stations.The first shear strain parameterγ1in these two small regions are abnormal,and its time sequence curve is shown in Fig.5.
According to Fig.4(a),the EW linear strain has an upward trend from 2013 to the end of 2017,whereas the trend flattens after the half past 2017.It is indicated that there has been no eastward movement in the past two years before the earthquake.As shown in Fig.4(b),the slope of the surface strain is negative,indicating the cumulative trend of surface strain is shrinkage.In addition,the change is not linear accumulation,which is represented by a faster to slower process.The cumulative rate of strain is much faster before 2016,and slowed down after 2016.The contraction rate decreases from -0.84×10⁻⁸/a to -0.22×10⁻⁸/a.As shown in Fig.4(c),The first shear strain rate is positive,indicating the NW trending seismogenic fault is in the state of left-lateral strike-slip movement.However,the trend slows down after the half past 2017.The time series of the continuous deformation parameters in the nearby regions of the ZhangyeMS5.0 earthquake is calculated.Fig.5 shows the first shear strain time series of GSJY-GSGT-QHQL and QHQL-GSGL-NMAY.According to Fig.5,theγ1time series changes after 2017.The curve shown in Fig.5(a)turns downward,and the curve shown in Fig.5(b) down,indicating the mutual movement of both sides of the fault zone slowes down.It is illustrated that the left-lateral strike-slip rate is significantly weakened.The W-direction movement on the north side and the Edirection movement on the south side of the fault zone significantly slowes down,which is consistent with the results in Fig.4(a).According to the analysis above,there is sign of deformation deficit in the earthquake area.It is illustrated that the area has accumulated a high degree of strain energy before the ZhangyeMS5.0 earthquake.Thus,a background abnormal change was formed in the area before the earthquake.

Figure 4 GPS strain time series in the epicenter of the Zhangye MS5.0 earthquake

Figure 5 The first shear strain γ1 time series nearby the region of the Zhangye MS5.0 earthquake
4 CONCLUSIONS AND DISCUSSION
(1) The epicenter of this earthquake is located at the southwest side where the far-field velocity is large and the near-field velocity is small.The direction of velocity field on both sides of the seismogenic fault is significantly different,indicating a stress accumulation zone with risk of strong earthquakes.
(2) The results of GPS continuous inter station baselines show that the movement trend of the northern margin of the Qilian Mountains is stable from 2010 to the middle of 2017.However,the trend of baseline azimuth has changed since 2017.The trend of the left-lateral strike-slip movement slows down obviously in the two years before the ZhangyeMS5.0 earthquake,illustrating that the energy of the epicenter stress field is in a certain accumulation state during this period.
(3) The strain rate of the deformation unit shows that the first shear strain and EW direction linear strain flattened obviously since the end of 2017 before ZhangyeMS5.0 earthquake.However,the surface strain rate has gradually weakened since 2016.It is indicated that the epicenter had accumulated a high degree of strain energy before the ZhangyeMS5.0 earthquake.Therefore,there have been significant background abnormal changes before the earthquake.
(4) According to the analysis results of strain time series in epicenter area before the 2016 MenyuanMS6.4 earthquake,the linear strain in EW direction and surface strain also have the same trend of slowing down,with significant deformation deficit and strain accumulation (Ma Haiping,et al.,2016; Ma Haiping,et al.,2017).Considering the characteristics of tectonic movement of the seismogenic faults and the variation of velocity field in the epicentral region,the characteristics of regional crustal deformation before the two earthquakes are similar.At the same time,the slowing trend of the EW line strain and surface strain also has a better indication for gestating strong earthquakes in the fault zone with the same characteristics of tectonic movement in this region.
ACKNOWLEDGMENT
The authors are grateful to the First Monitoring and Application Center of China Earthquake Administration provided GPS data products.
 Earthquake Research Advances2020年2期
- Earthquake Research Advances的其它文章
- Influence of Bedding and Mineral Composition on Mechanical Properties and Its Implication for Hydraulic Fracturing of Shale Oil Reservoirs1
- Progress and Prospect of Geophysical Research on Underground Gas Storage:A Case Study of Hutubi Gas Storage,Xinjiang,China1
- Study of the Seismogenic Structure of the October 12th,2019 MS 5.2 Beiliu Earthquake,Guangxi,China1
- Analysis of Power Supply Interference of Geomagnetic Second Data Observation-Take Changli Seismic Station as An Example1
- New Understanding of Variation Characteristics of Well Water Level in Majiagou Mine,Tangshan City,Hebei,China1
- Microseism Variations in Response to Antarctic Seasonal Changes in Sea Ice Extent1
