Response surface methodology-based optimization of ultrasound-assisted extraction of β-sitosterol and lupeol from Astragalus atropilosus (roots) and validation by HPTLC method
Perwez Alam, Nasir A.Siddiqui, Ali S.Alqahtani, Anzarul Haque, Omer A.Basudan, Saleh I.Alqasoumi,Abdullah A.AL-Mishari, M.U.Khan
1Department of Pharmacognosy, College of Pharmacy, King Saud University, P.O.Box-2457, Riyadh-11451, Saudi Arabia
2Department of Pharmacognosy, College of Pharmacy, Prince Sattam bin Abdulaziz University, Al-Kharj, KSA
3Department of Pharmaceutical Chemistry & Pharmacognosy, Unaizah College of Pharmacy, Qassim University, Al Qassim, Saudi Arabia
ABSTRACT
KEYWORDS: β-sitosterol; Lupeol; Box-Behnken design; Astragalus;High performance thin layer chromatography
1.Introduction
β-sitosterol, a plant steroid has been extensively studied and shows anti-HIV (by immunomodulatory mechanism), antiviral (against tobacco mosaic virus), anti-hepatotoxic, anti-cardiotoxic, and antioxidative activities[1].The triterpenoids have also been found to possess a wide spectrum of biological activities such as antiinflammatory, hypocholesterolemic, insulin-regulating potential,antiviral (particularly lupeol for hepatitis), anti-herpes simplex virus,anti-microbial, and anti-proliferative acitivities[2].β-sitosterol and lupeol have been analyzed using HPTLC in different plants such as Tephrosia purpurea (L.) Pers.(β-sitosterol and lupeol ranged from 0.043% to 0.125%, 0.023% to 0.045% w/w, respectively), Hibiscus species (aerial parts; 1.18% and 0.75% w/w for β-sitosterol and lupeol,respectively), Sisymbrium irio L (0.21% w/w for β-sitosterol).Some compounds have been analyzed using HPLC in different species of Astragalus like astragalosides and iso flavonoids[3-6], but till now, no report has been published on the quantification of these biologically important phytoconstituents in Astragalus atropilosus (A.atropilosus)using HPTLC method.
Ultrasonic-assisted extraction is an economical and easily operated extraction technique in comparison to the other techniques such as supercritical fluid extraction and microwave-assisted extraction.The enhanced extraction by ultrasonic treatment is mainly attributed to its mechanical effects, which largely expedite the mass transfer between immiscible phases at low frequency by super agitation[7,8].
Response surface methodology (RSM) is a more economical,convenient, diversified, logical and time-saving statistical technique than the conventional single parameter optimization, and has been used to simultaneously optimize different variables involved in the process.The various extraction parameters such as extraction time, extraction temperature, liquid to solid ratio, solvent ratio, etc.have been optimized for several phytoconstituents viz.betulinic acid from Tecomella undulata, triterpenoids from Jatropha curcas, embelin from Embelia ribes and phytosterol from Saccharum officinarum L[9-13].Among various response surface designs available in RSM, Box-Behnken design (BBD) is more labor efficient (requiring the minimum number of experimental runs), and quite suitable for fitting second-order polynomial equations of three or more experimental factors[14-17].BBD is known to be more competent than central composite and three-level full factorial RSM designs, as it allows estimation of quadratic model parameters, sequential design building and lack of fit determination for the proposed model.In this experiment, only 17 runs were needed for a three-factorial (33) study.BBD can also help in analyzing the quadratic response surface and generating a second-order polynomial model.The HPTLC is a widely used chromatographic technique in the quantitative analysis of herbal extracts, herbal drugs, and its supplements because it is rapid, less expensive, highly sensitive, precise, and has the potential to measure a large number of samples efficiently[18-22].
In the present experiment, authors planned to optimize various extraction parameters such as liquid to solid ratio, extraction temperature and extraction time for the maximum yield of β-sitosterol and lupeol in chloroform extract of A.atropilosus (AACE) by applying Box-Behnken design of RSM along with the quantitative estimation of β-sitosterol and lupeol in AACE for the first time by a validated, simple and efficient HPTLC method.
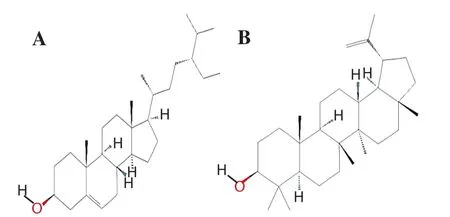
Figure 1.Chemical structure of β-sitosterol (A) and lupeol (B).
2.Materials and methods
2.1.Plant material and chemicals
Roots of A.atropilosus (voucher no.14471) were collected from the Tamniah area of Saudi Arabia.The plant material was authenticated by Dr.Mohamed Yousef, a taxonomist at Pharmacognosy Department, College of Pharmacy, King Saud University, and the voucher specimens were deposited in the herbarium, Department of Pharmacognosy.The roots were washed and dried at room temperature.After drying, roots were broken into small pieces,powdered and stored for further processing.The standards β-sitosterol and lupeol (Figure 1) were procured from Sigma Aldrich.The chemicals hexane, ethyl acetate, and chloroform were purchased from BDH chemicals.
2.2.Ultrasonic extraction and determination of β-sitosterol and lupeol
The extraction of the powdered root of A.atropilosus was carried out by ultrasonic vibrations (ultrasound-assisted extraction) using Sonics Vibra cell (Model VCX-750; Sonics, USA).The effect of single factors on extraction procedures was determined as follows:
(1) Effect of liquid to solid ratio on the extraction:
Root powder (1.0 g) was put into a 50 mL conical flask and extracted with various volumes of chloroform (4, 6, 8, 10, 12, 16, 20 mL) to get different liquid-to-solid ratios keeping the extraction time(40 min) and extraction temperature (40 ℃) constant throughout the experiment.Each experiment was repeated 5 times (n=5) and the obtained extracts were merged, filtered and dried at low pressure with rotavapour to get the final extractive yield.
(2) The effect of temperature on extraction:
A total of 10 mL of chloroform was added to 1 g of powdered root in a 50 mL flask for each experiment, and the extraction was performed for different extraction temperatures (30, 40, 50, 60,70, 80 ℃) at constant extraction time (40 min).Each experiment was repeated 5 times (n=5) and the obtained extracts were merged,fi ltered and dried at low pressure with rotavapour to get the final extractive yield.
(3) The influence of time on the extraction:
A total of 10 mL of chloroform was added to 1 g of powdered root in a 50 mL flask for each experiment and the extraction was executed for different time variables (10, 20, 30, 40, 50, 60 min) at constant extraction temperature (40 ℃).Each experiment was repeated 5 times (n=5) and the obtained extracts were merged, filtered and dried at low pressure with rotavapour to get the final extractive yield.
On the basis of the above finding of the influence of single factor on extraction yield, the ultrasound-assisted extraction procedure for RSM was set as below: root powder was taken into a conical flask(50 mL) and chloroform was added with different liquid-to-solid ratios (10-14 mL/g), temperature (60-80 ℃) and time (40-60 min).
2.3.Experimental design of RSM
A 33factorial BBD (Design-Expert Software, Trial version 12, Stat-Ease Inc., Minneapolis, MN, USA) of RSM (17 runs) was applied to optimize the extraction variables viz.liquid to solid ratio (P1:10, 12, 14 mL/g), temperature (P2: 60, 70, 80 ℃) and time (P3: 40,50, 60 min) to get the maximum yield (% w/w) of total extractive matter (R1), β-sitosterol (R2) and lupeol (R3).The appropriate range of different variables was determined according to single-factor experiments.The preparation and analysis of all the samples were carried out in triplicate.A nonlinear quadratic model equation generated by this experimental design is shown below:
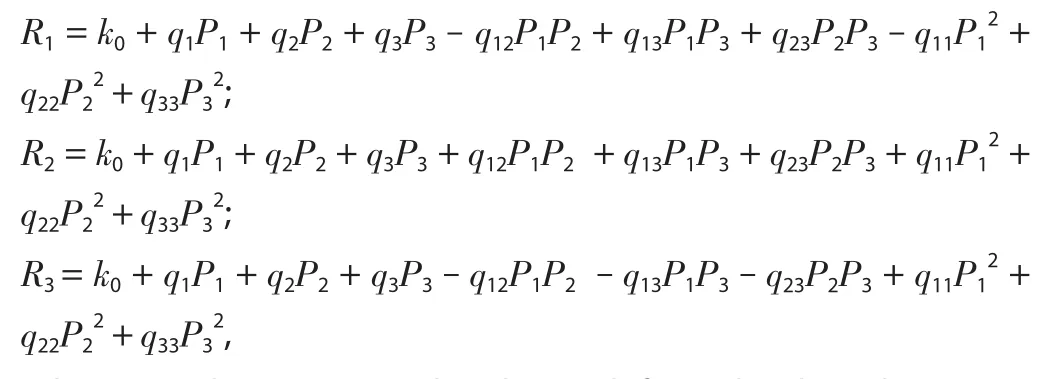
Where, R is the response related to each factor level combinations;k0is intercept; q1, q2, q3are linear coefficients; q12, q13, and q23are the interaction coefficients while q11, q22, and q33are the quadratic coefficients.The independent variables were P1, P2, and P3while R1,R2and R3were the dependent variables.The results of various initial trials were used to choose the range of independent variables.Here all the variables including solvent to solid ratio, temperature and sonication time were studied at three levels, low (-1), medium (0)and high (+1).The obtained extracts were filtered using filter papers and used to determine the content of β-sitosterol and lupeol by using validated HPTLC method.
2.4.HPTLC analyses of β-sitosterol and lupeol
All the 17 BBD runs of the AACE (2 mg/mL) were applied as spots(10 μL) on a 10 cm×20 cm glass-backed silica gel 60F254HPTLC plate (Merck, Germany) with a band size of 6 mm using Automatic sampler-4 (CAMAG, Switzerland).Before the application, the extract solutions were filtered using a 0.22 μm filter fitted with a microliter syringe (CAMAG).Then the post-application of the plate was developed in a twin trough glass chamber (Automatic Development Chamber-2, CAMAG) saturated with the mobile phase[mixture of hexane and ethyl acetate in the ratio of 8:2 (v/v)] for 20 min at controlled temperature [(25 ± 2) ℃] and controlled humidity[(60 ± 5)%] and the chromatogram was developed up to a height of 8.0 cm.The post-development of the TLC plate was air-dried (30 min), derivatized with p-anisaldehyde reagent and dried again at 110 ℃ for 10 min (in a hot air oven) to furnish the clear and compact spots of all the phytoconstituents present in the sample along with the markers (β-sitosterol and lupeol).The plate was scanned by using TLC scanner-3 (CAMAG) in absorbance mode at λ max = 518 nm and the concentrations of β-sitosterol and lupeol in all the seventeen runs were quantified by using regression equation obtained from the calibration curve of a β-sitosterol and lupeol standards.
2.4.1.Calibration curve preparation
A stock solution (1 mg/mL) of standards β-sitosterol and lupeol in chloroform was prepared.The stock solution was further diluted with chloroform in order to get seven different dilutions viz.10, 20,40, 60, 80, 100 and 120 μg/mL.All the seven dilutions of β-sitosterol and lupeol (10 μL, each) were applied in triplicate on the HPTLC plate to furnish concentrations of 100, 200, 400, 600, 800, 1 000 and 1 200 ng/band.Furthermore, the linear least-squares regression was used to treat the data of peak area versus the concentration of biomarkers.
2.4.2.Validation
The developed HPTLC method was validated for accuracy,precision, robustness, the limit of detection (LOD) and limit of quantification (LOQ) as per the International Conference on Harmonization guidelines[23].The recovery as accuracy studies of β-sitosterol and lupeol was accomplished by the standard addition method.Additionally, the analyte was spiked with various concentrations (50%, 100%, and 150%) of β-sitosterol and lupeol and reanalyzed by using the proposed HPTLC method in triplicate.The % relative standard deviation (RSD) and recovery were calculated, and the intra and inter-day precisions of three replicates for β-sitosterol and lupeol determination were executed at three concentrations (400, 600 and 800 ng/band).The % RSD of peak areas were calculated.However, for the robustness study of the developed HPTLC method, a small intentional modification was applied to the composition of the solvent system, the mobile phase volume (18, 20, 22 mL) and the saturation time (10, 20, 30 min).Moreover, the effects on the result were calculated as SD and% RSD.The LOD and LOQ for the β-sitosterol and lupeol were calculated by using equations (1) and (2), respectively:


Where SD is the least standard deviation and α is the slope of the curve.
The specificity of the developed HPTLC method was confirmed by analyzing β-sitosterol and lupeol standards and its presence in AACE.Furthermore, the spots for β-sitosterol and lupeol in AACE were established by comparing the Rfvalue, color and the peak of the spot in the samples with those of the standard.
2.5.RSM model and validity testing
To analyze the experimental results, BBD of RSM (Design-Expert™software, version 12) was used, and P-value < 0.05 were considered to be significant.Additionally, independent variables of the extraction process such as P1, P2, and P3were concurrently optimized by using BBD.The ultrasonication extraction of the crude drug was executed by using the optimized conditions in triplicate and the yield of R1, R2and R3was compared with predicted values for the model validation.
3.Results
3.1.HPTLC analysis of β-sitosterol and lupeol
Out of these solvents, hexane and ethyl acetate in the ratio of 8:2,v/v was found to be quite selective.The developed HPTLC method provided a sharp, compact and well-defined peaks of β-sitosterol and lupeol at the Rfvalues of 0.22 and 0.34, respectively (Figure 2A).Figure 2B shows that the selected solvent system had a very good resolution for the separation of β-sitosterol and lupeol from other constituents of AACE.The identities of the bands were confirmed by overlaying the spectra of all the extracts with the spectra of β-sitosterol and lupeol (Figure 2C).Furthermore, the linear regression data obtained for the calibration curves (n=6) showed a good linear relationship over a wide range of concentrations(100-1 200 ng/band) with respect to peak area (Supplementary Table 1).The linear equation/correlation coefficients (r2) for β-sitosterol and lupeol were found as Y= 10.363X + 522.03/0.997 2 and Y=11.442X + 790.77/0.994 1, respectively.The LOD/LOQ (ng) for β-sitosterol and lupeol were found as 10.32/31.28 and 21.17/64.16,respectively.
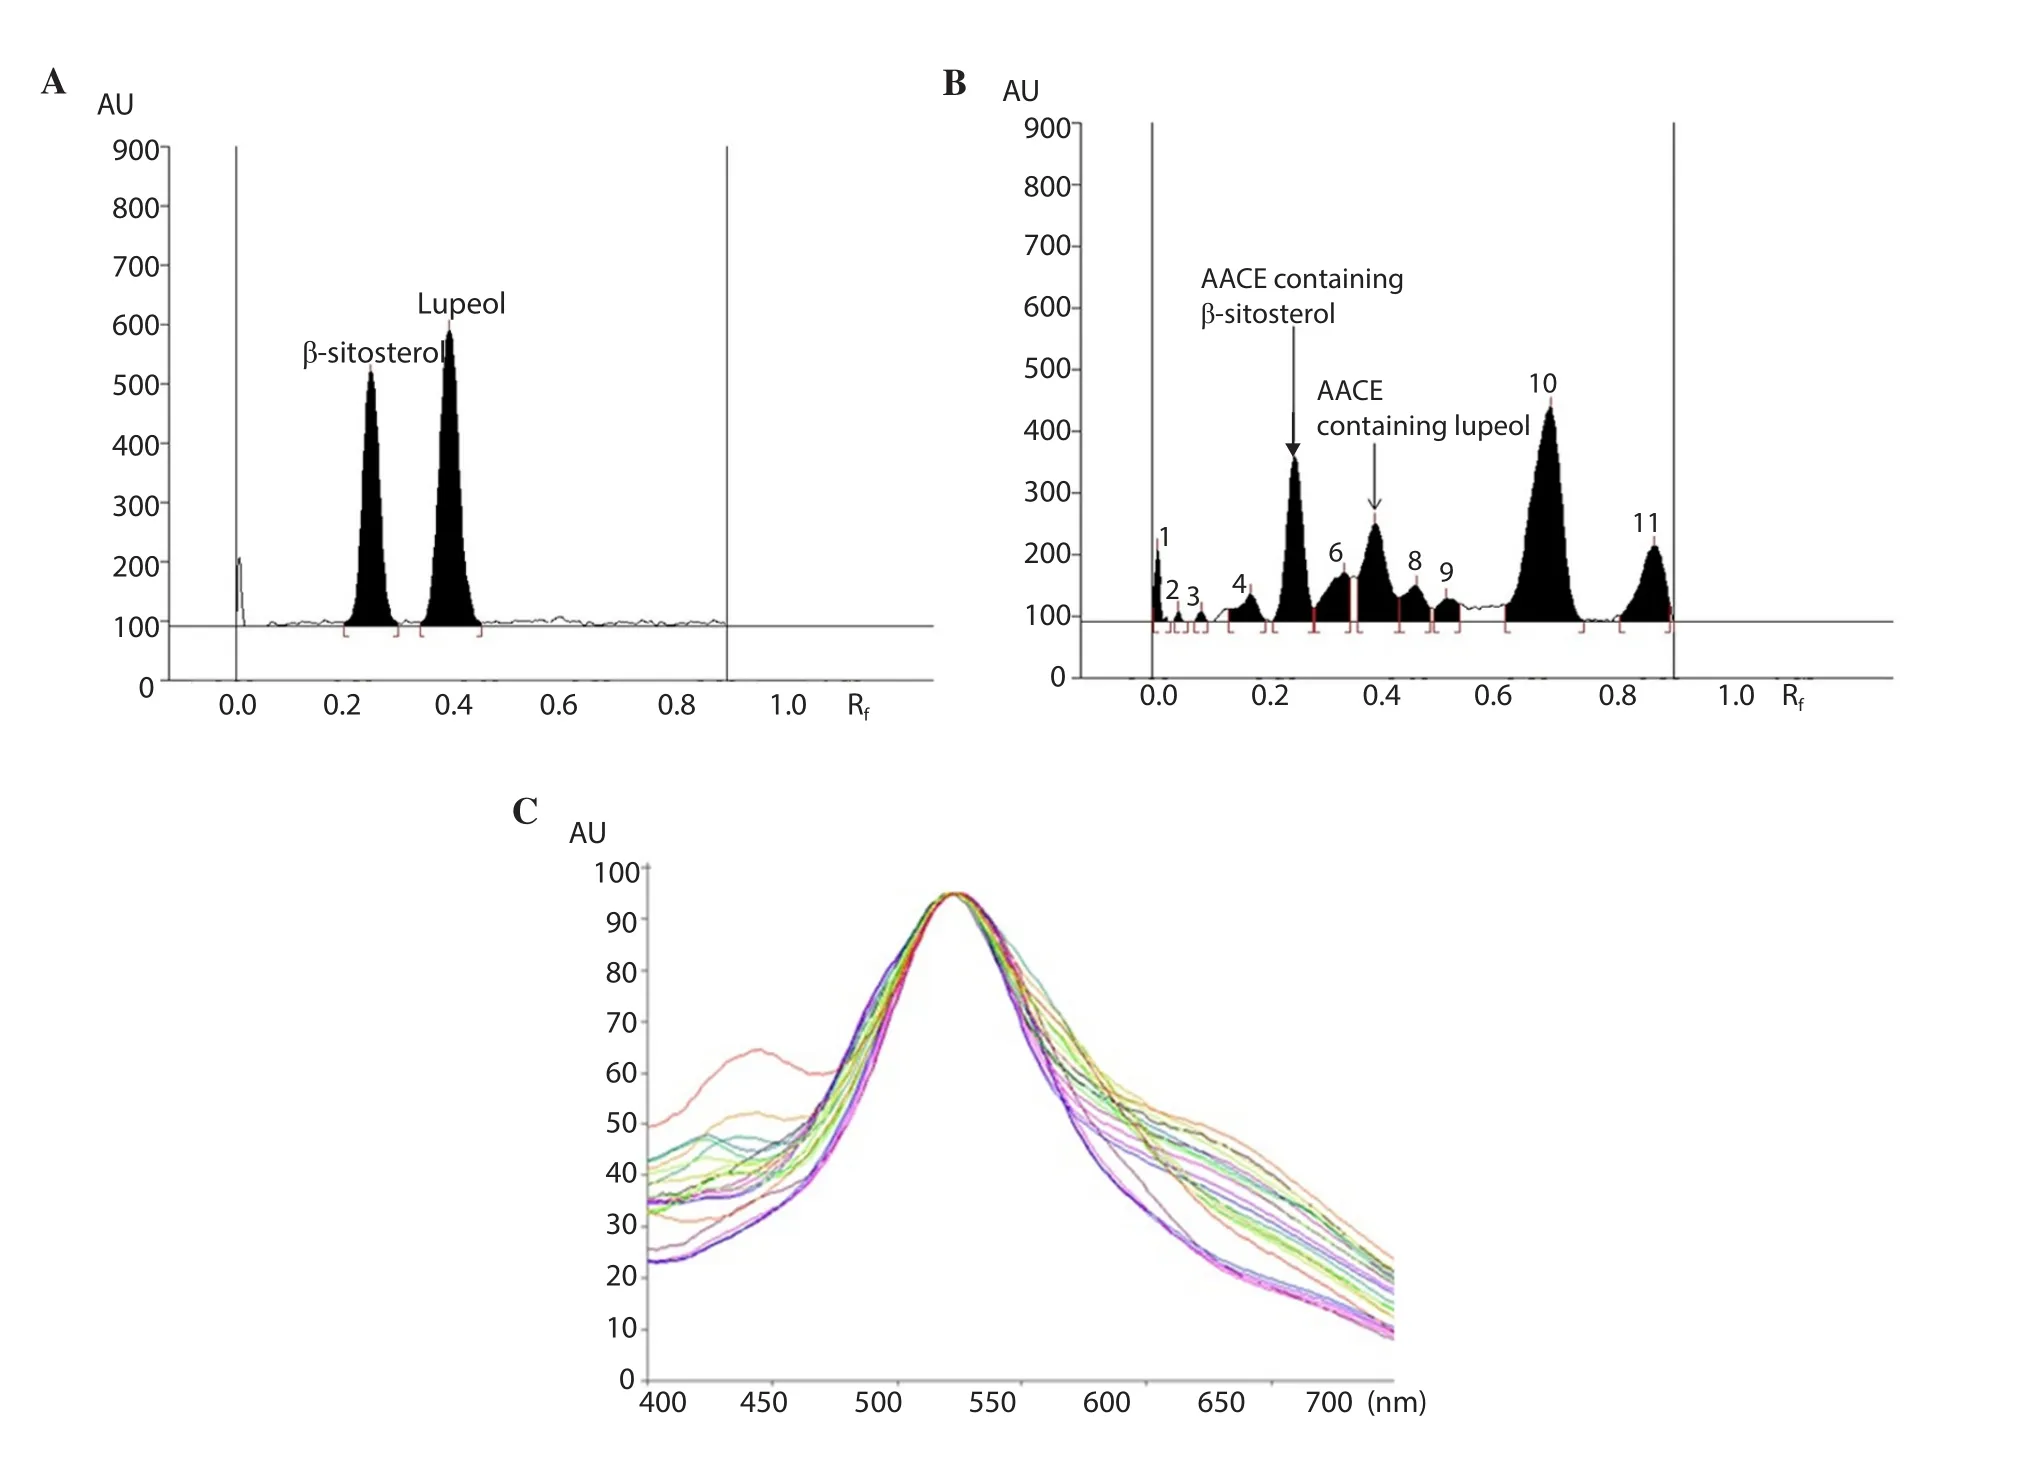
Figure 2.High performance thin layer chromatography (HPTLC) chromatogram and spectral comparison.A: HPTLC chromatogram of standards β-sitosterol and lupeol; B: HPTLC chromatogram of β-sitosterol and lupeol estimation in chloroform extract of Astragalus atropilosus (β-sitosterol, spot 5, Rf = 0.22;lupeol, spot 7, Rf = 0.34) using mobile phase: hexane: ethyl acetate (8:2, v/v) at λ max= 518 nm; C: Spectral comparison of all tracks.AACE: chloroform extract of Astragalus atropilosus.
On one hand, the % RSD for intra-day/inter-day precision of β-sitosterol and lupeol were found as 1.209-1.337/1.087-1.287 and 1.231-1.522/1.219-1.447, respectively (Supplementary Table 2).The accuracy was calculated by recovery analysis which afforded recovery of 98.26%-99.59% and 98.15%-99.43%, respectively for β-sitosterol and lupeol (Supplementary Table 3).On the other hand,the % RSD of β-sitosterol and lupeol were found as 0.978-1.423 and 0.999-1.315, respectively for the accuracy of the proposed method.The low values of % RSD of β-sitosterol and lupeol in robustness studies are recorded in Supplementary Table 4.
3.2.Effect of single-factor tests with ultrasonic extraction of AACE
3.2.1.Effect of extraction time (P3) on the yield of AACE
The Supplementary Figure 1A shows that the extraction yield(% w/w) of AACE was affected by variation in P3(10, 20, 30,40, 50 and 60 min) [where the other two factors P1(liquid to solid ratio) and P2(extraction temperature) were fixed at 10 mL/g and 40 ℃, respectively].In addition, the (%) extraction yields of the AACE increased significantly from 4.10% to 5.71% when P3increased from 10 to 40 min.However, no change was observed with further increase in P3from 40-60 min, which indicated that 40 min was the time limit to get the maximum AACE yield.
3.2.2.Effect of extraction temperature (P2) on the yield of AACE
The selected extraction temperatures (P2) were 30, 40, 50, 60, 70 and 80 ℃, respectively, to study the impact of extraction temperature on the AACE extraction yield (%), keeping the other two factors P1(10 mL/g) and P3(40 min) constant (Supplementary Figure 1B).The result demonstrated that the AACE extraction yield was increased with an increase in P2, reaching the maximum at 60 ℃.However,no significant difference was observed by further increasing P2from 60 ℃-80 ℃.
3.2.3.Effect of liquid to solid ratio (P1) on the yield of AACE
The impact of P1on the extraction yield of AACE is shown in Supplementary Figure 1C.The AACE extraction yield was significantly increased from 35.1 to 53.3 mg/g as the P1increased within the range of 4 to 12 mL/g, due to the increase of the driving force for the mass transfer.However, as the P1continued to increase,the extraction yields did not differ significantly any longer.
3.3.Model fitting
The (% w/w) quantity of β-sitosterol (R2) and lupeol (R3) of each experimental BBD run was estimated by validated HPTLC method,and the results are shown in Table 1 along with the total extraction yield (R1).A quadratic model was found to be the best fit model and the comparative results of regression analysis for model and response regression equation for the final proposed model are listed in Supplementary Table 5.The values of adjusted R2/predicted R2for R1, R2, and R3were found as 0.978 2/0.955 1, 0.990 4/0.911 0 and 0.992 7/0.940 1, respectively which were close to 1.This indicated a high degree of correlation between the observed and predicted values.Similarly, the difference between the adjusted R2and predicted R2is less than 2, which is required to fit the model.“Adequate Precision” measures the signal to noise ratio which should be greater than 4 to fit the model.In this experiment, the signal to noise ratios were found as 48.77, 31.33 and 36.08 for R1,R2, and R3, respectively.Table 2 showed the analysis of variance(ANOVA) for the fitted quadratic polynomial of R1, R2, and R3from A.atropilosus.The “lack of fit F-value” was found as 1.38, 3.01, and 2.05 for R1, R2, and R3which showed that the “lack of fit” was not significant and showed the validity of RSM results.Furthermore, in this experiment, the model F-value for R1, R2, and R3was found as 149.82/100.33/133.09 which suggests that the model was significant.
3.4.Effect of extraction parameters (P1, P2, P3) on R1, R2 and R3, and RSM analysis
The contributions of each independent variable are shown in Table 3.The linear variables (P1, P2, P3), the interaction variables(P1P2) and the quadratic variables (P12, P32) were found significant(P<0.05), and affected the R1whereas other variables (P2P3, P1P3and P22) were found insignificant (P>0.05).All the linear and the quadratic variables along with the interaction variables (P1P2,P2P3) were found significant (P<0.05) and affected the R2except the interaction variable P1P3(P>0.05).In the case of R3, all the variables (the linear, quadratic and interaction variables) were found significant (P<0.05) and affected it.Furthermore, the R2/coefficient of variation (% CV) of the model for R1, R2and R3were found as 0.994 8/0.28, 0.992 3/0.39 and 0.994 2/0.97, which indicated a good precision and reliability of the experimental values.Moreover, threedimensional (3D) plots were constructed to visualize the relationship between independent variables and R1, R2and R3according to the generated quadratic polynomial model equation of the coded factors:
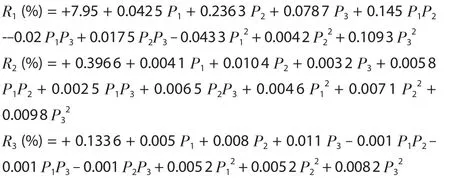
A positive value of the variables’ coefficients indicated that it is in favor of optimization.However, a negative value indicated a reverse relationship between the independent variables and the response(R1, R2and R3).Therefore, it is evident from the equation 1, 2 and 3 that the variables such as P1, P2and P3had a positive effect on R1,R2and R3, respectively.It also revealed that the relationship between the response and the variables was not constantly linear.When more than one variable is changed simultaneously, the variables can show various degrees of response.
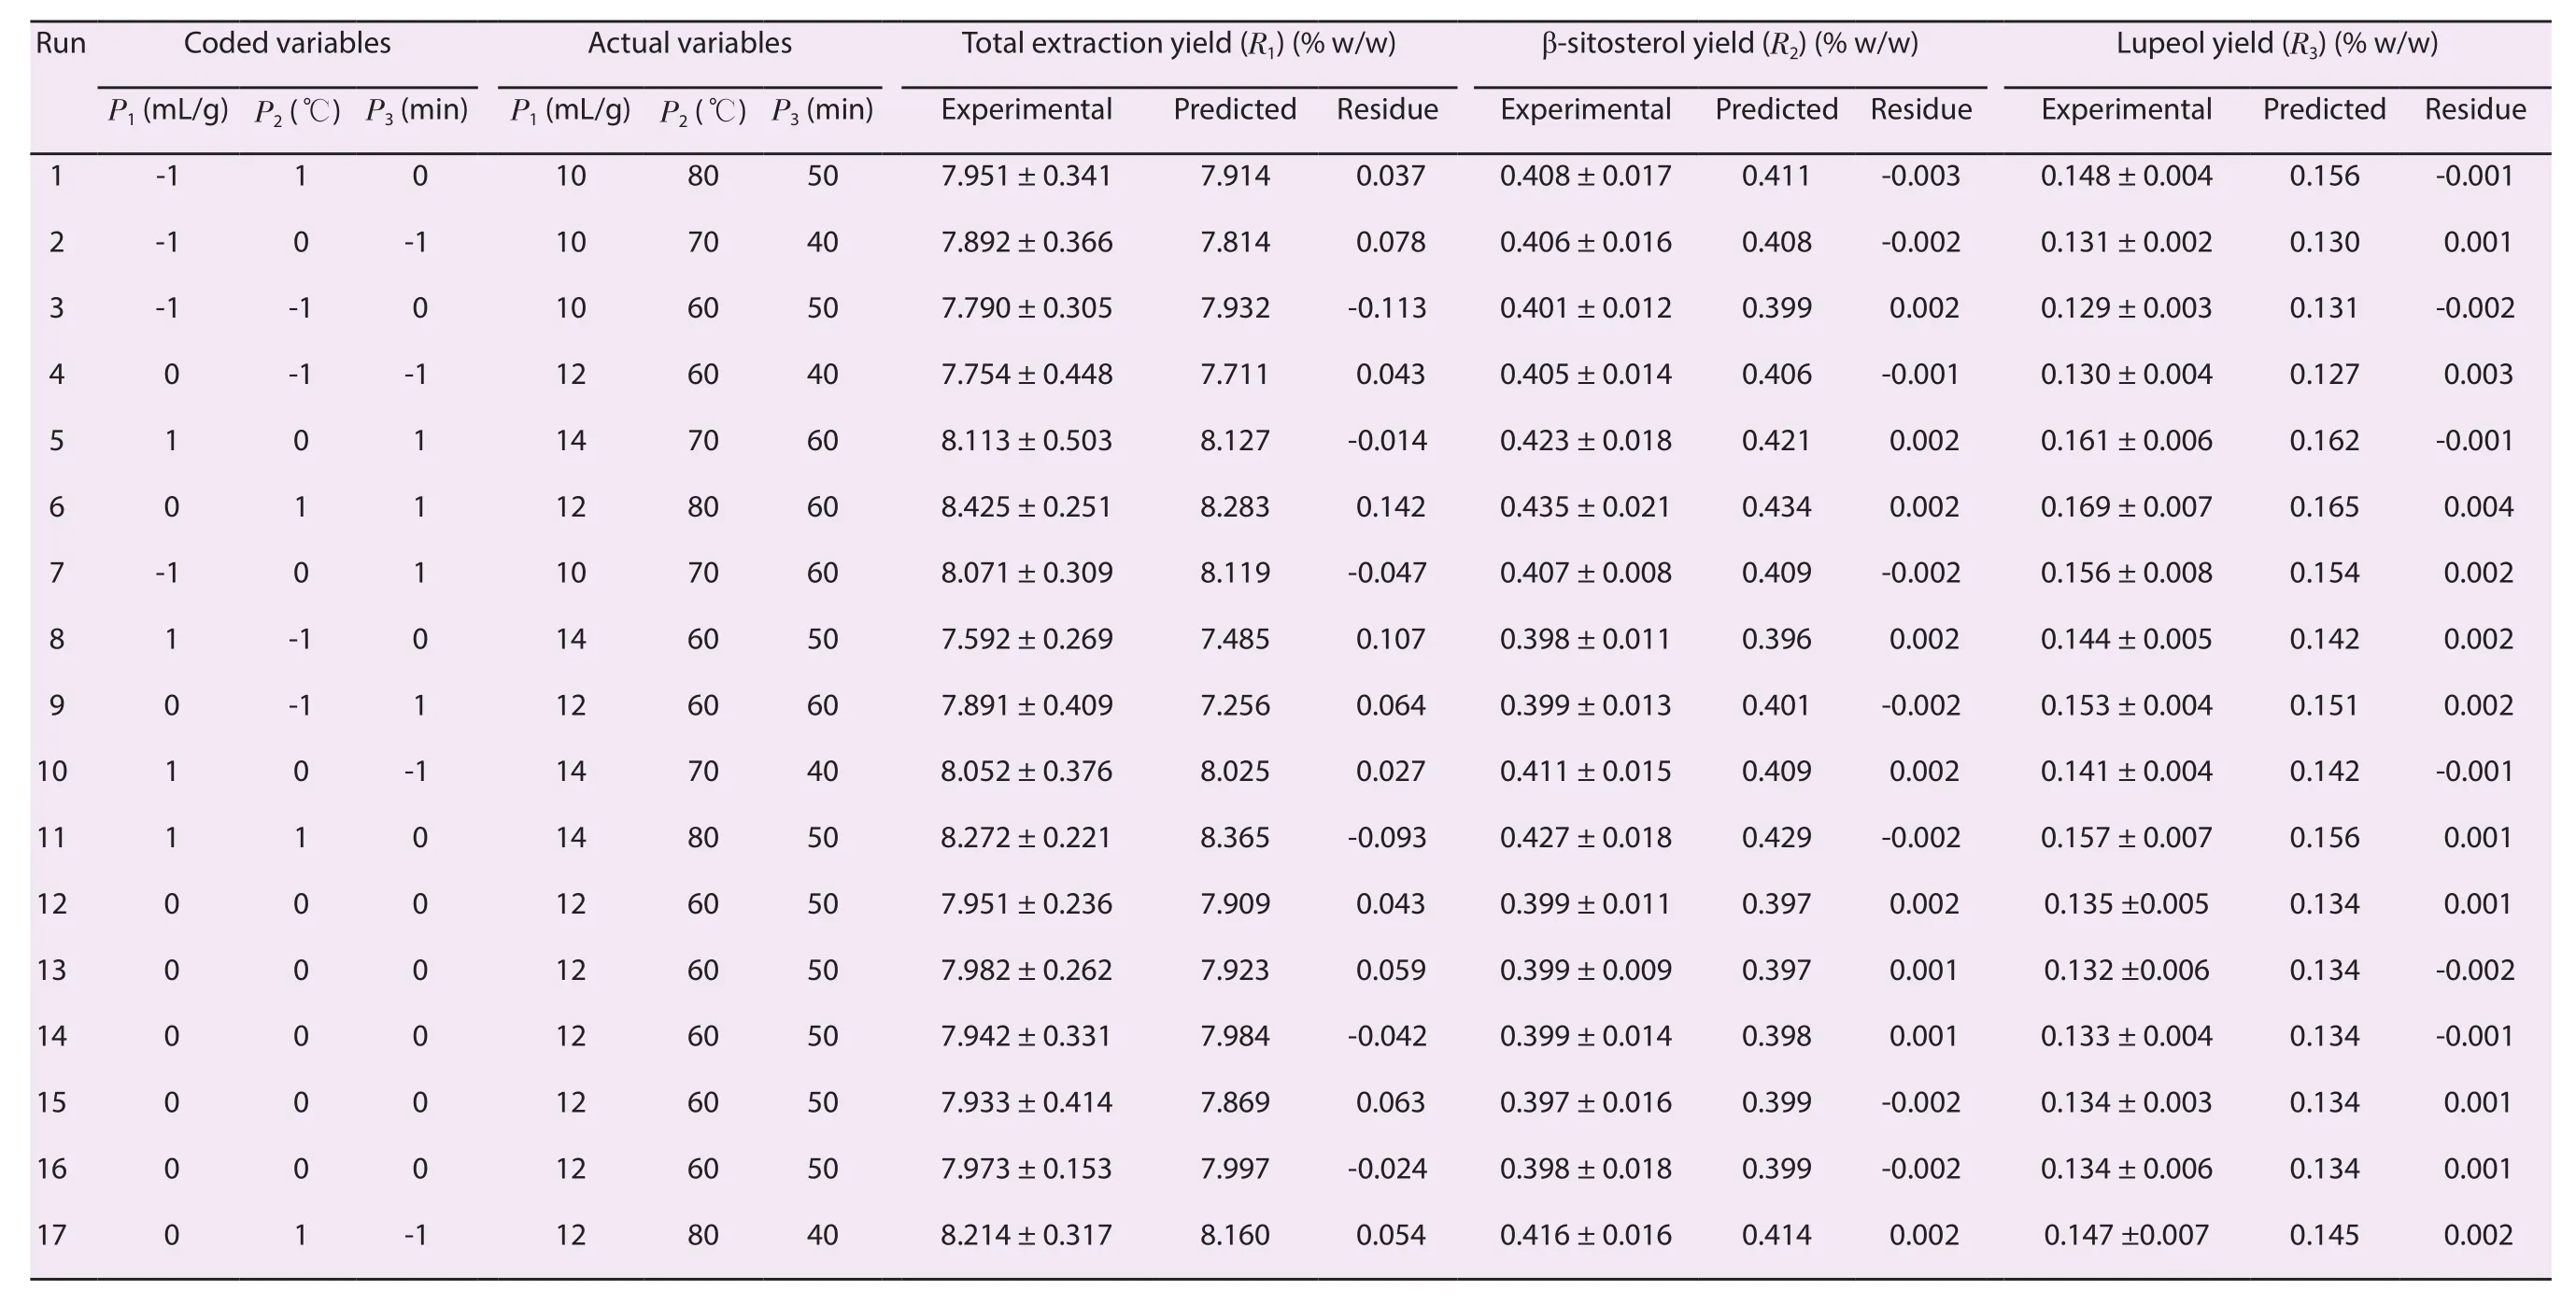
Table 1.Response surfacecentral composite design (uncoded) andresults for R1, R2, andR3.

Table 2.ANOVA for the fitted quadratic polynomial model of R1, R2 and R3.
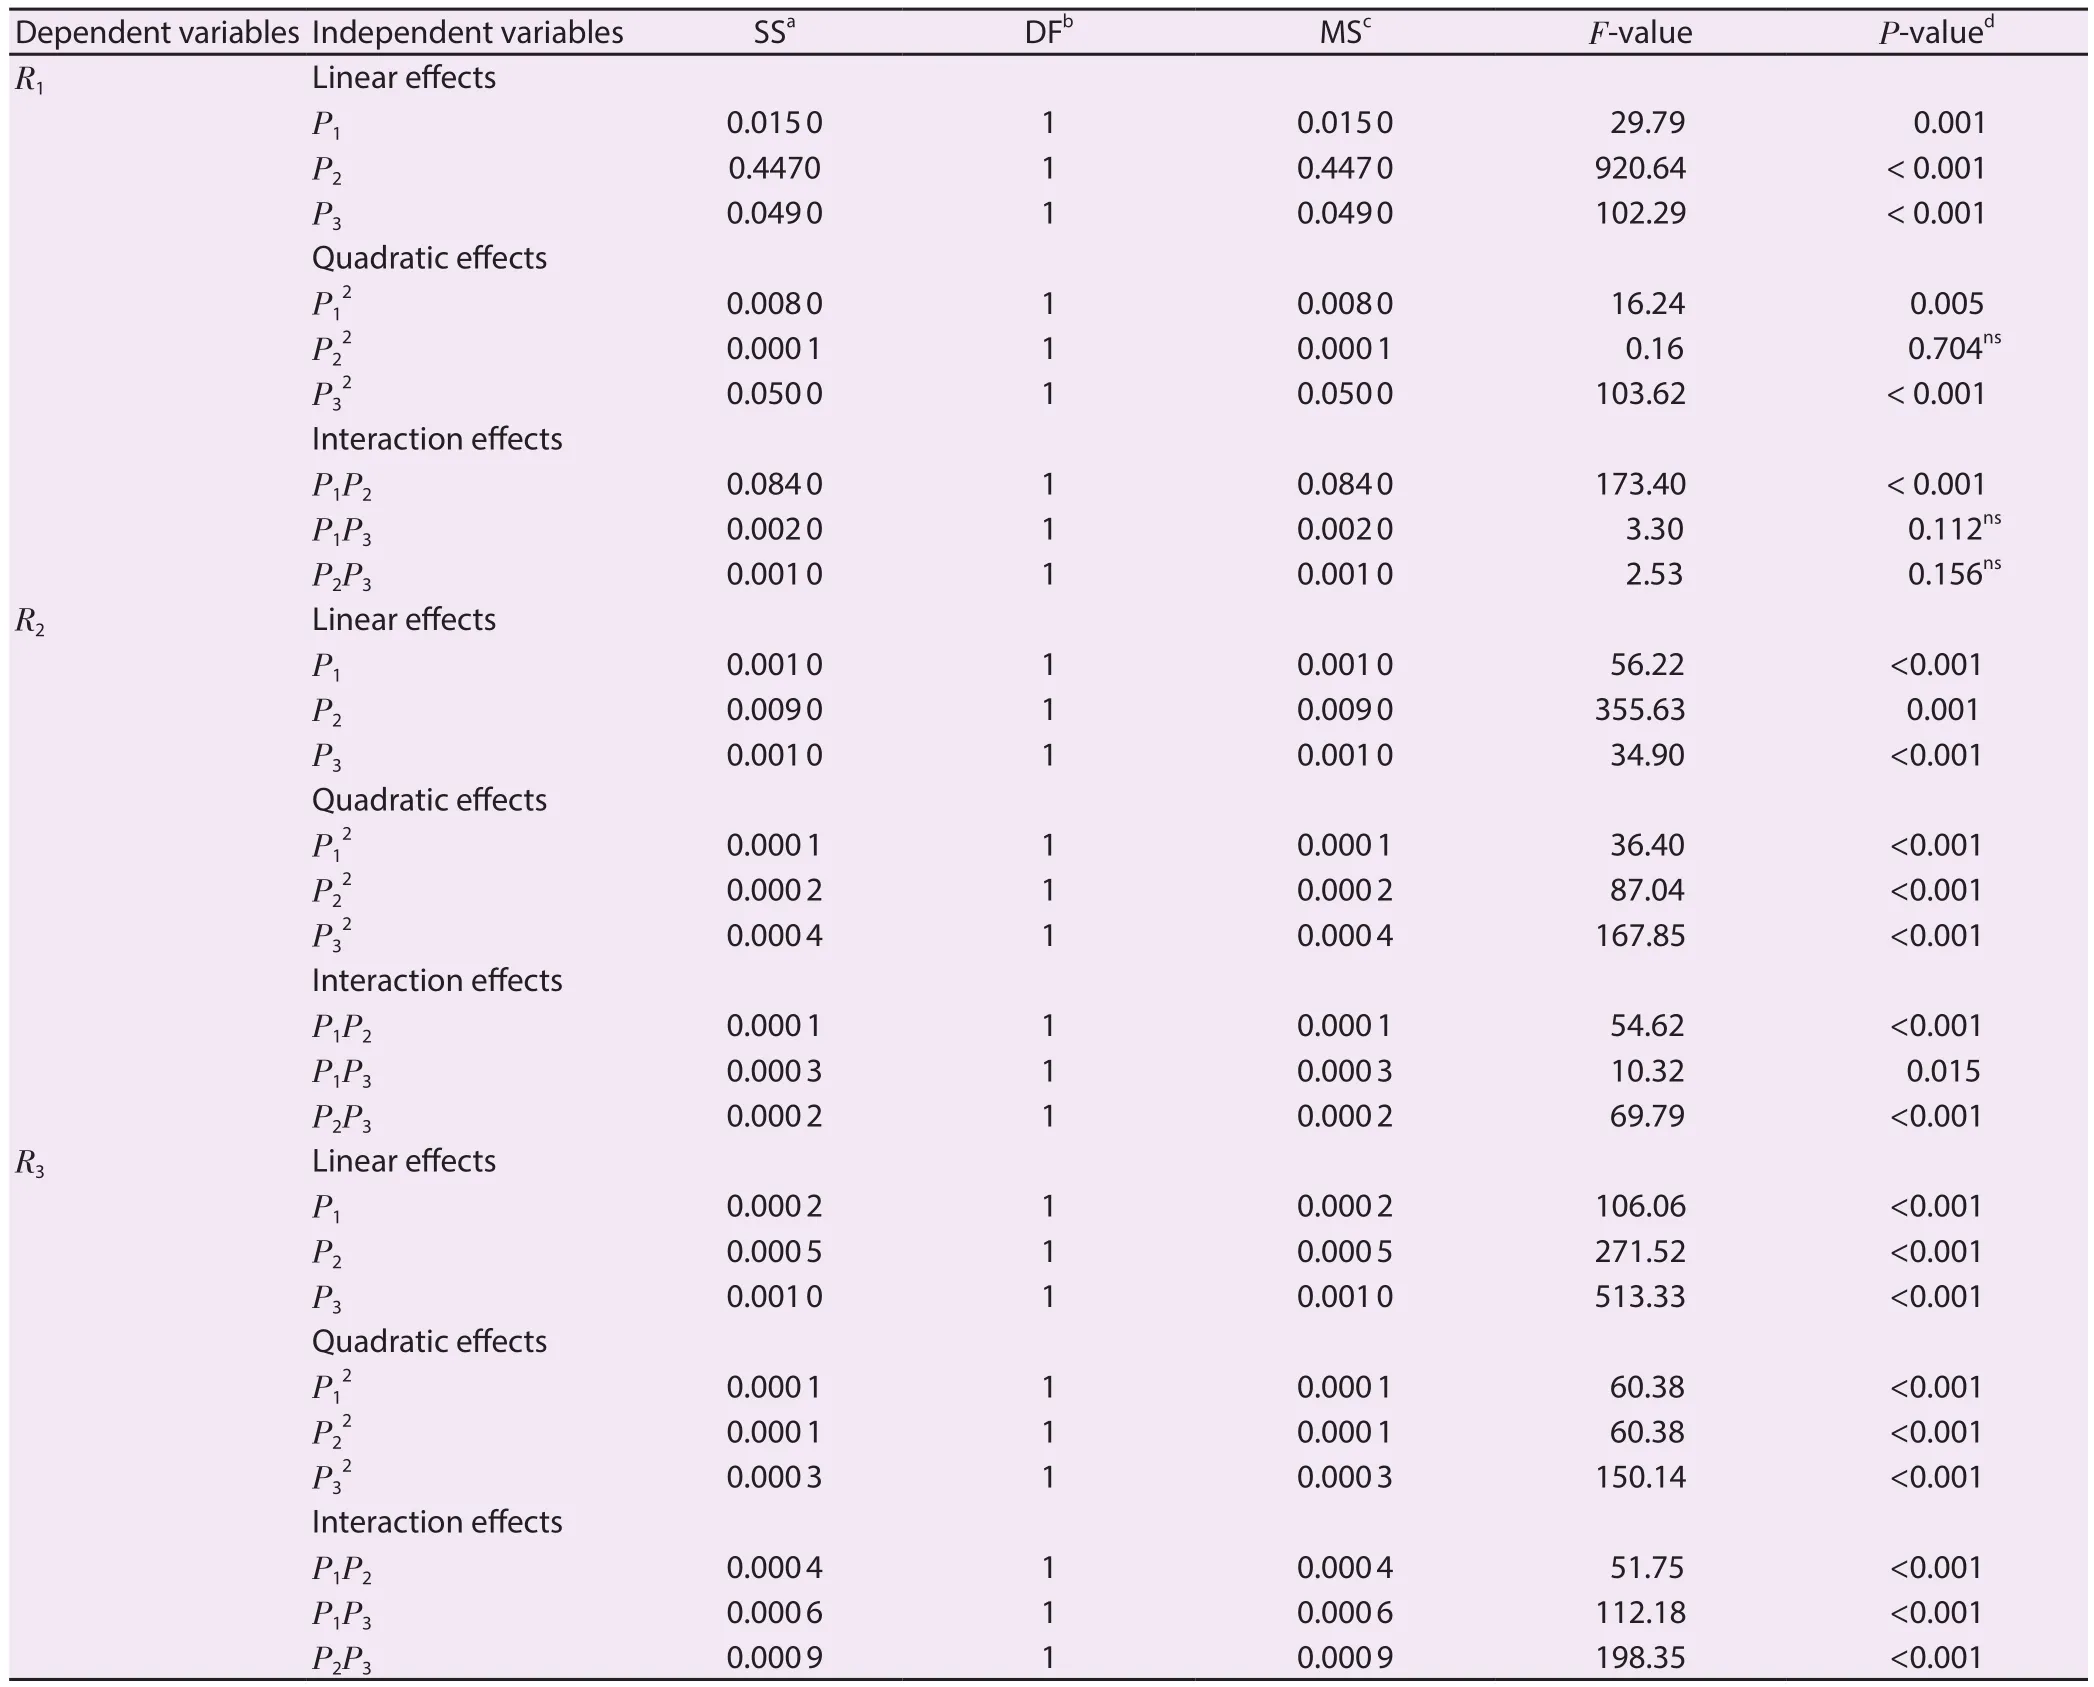
Table 3.Significance of each response variable effect showed by using the F ratio and P-value in the nonlinear second-order model.
The combination ratio of all the variables (P1, P2and P3) for the extraction was selected based on the results of R1, R2and R3using three-dimensional response surface plots.As shown in Figures 3A&C, 4A&C and 5A&C, the R1, R2and R3were increased positively with the increase in P2up to 78℃ when P1and P3were fixed at 12 mL/g and 50 min, respectively.Figures 3B, 4B and 5B showed an increase in R1, R2and R3at longer P3and lower P1when P2was fixed at 60 ℃.
3.5.RSM validation
For the R1, R2and R3checkpoints, the yield evaluation result was found to be within the limits.For the validation of the RSM results of R1, R2and R3, the experimental values of the responses were compared with the anticipated values and the percentage prediction errors were found to be 1.40%, 1.60%, and 1.05%, respectively.This helps in establishing the validity of the generated equation and describing the domain of applicability of the RSM model.The linear correlation plot between predicted and experimental values for R1, R2and R3showed a high value of R2(ranging from 0.990 5-0.997 3), indicating excellent goodness of fit (P<0.001)(Supplementary Figure 2).
3.6.Optimization and verification of the model for the extraction parameters
The optimum extraction process parameters were determined by maximizing the responses R1, R2and R3.During the optimization stage, the desirability function of the Design-Expert™(version 12) statistical software was applied to obtain the best compromise of response.The predicted optimal condition for the extraction process was found at 13.0 mL/g (P1), 76 ℃ (P2), and 56.5 min (P3)which resulted in the extraction of 8.496%, 0.445% and 0.169% w/w of R1, R2and R3, respectively.The extraction process once more repeated by modifying the optimum extraction conditions viz.13.5 mL/g (P1), 78 ℃ (P2) and 60 min (P3) and the total extraction yield(R1), β-sitosterol yield (R2) and lupeol yield (R3) were found as(8.462±0.440)% w/w, (0.451±0.020)% w/w and (0.172± 0.010)%w/w, respectively.There was no significant difference (P>0.05)between the predicted and obtained values.Therefore, this model may be applied for the optimization of the extraction process of β-sitosterol and lupeol from the roots of A.atropilosus.
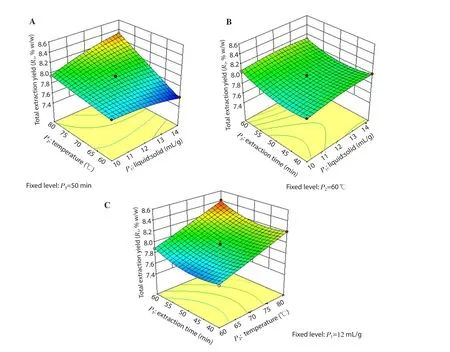
Figure 3.Response surface model 3D plots showing the effects of P1, P2 and P3 on R1.(A) the effect of P1 and P2 on R1; (B) the effect of P1 and P3 on R1; (C)the effect of P2 and P3 on R1.
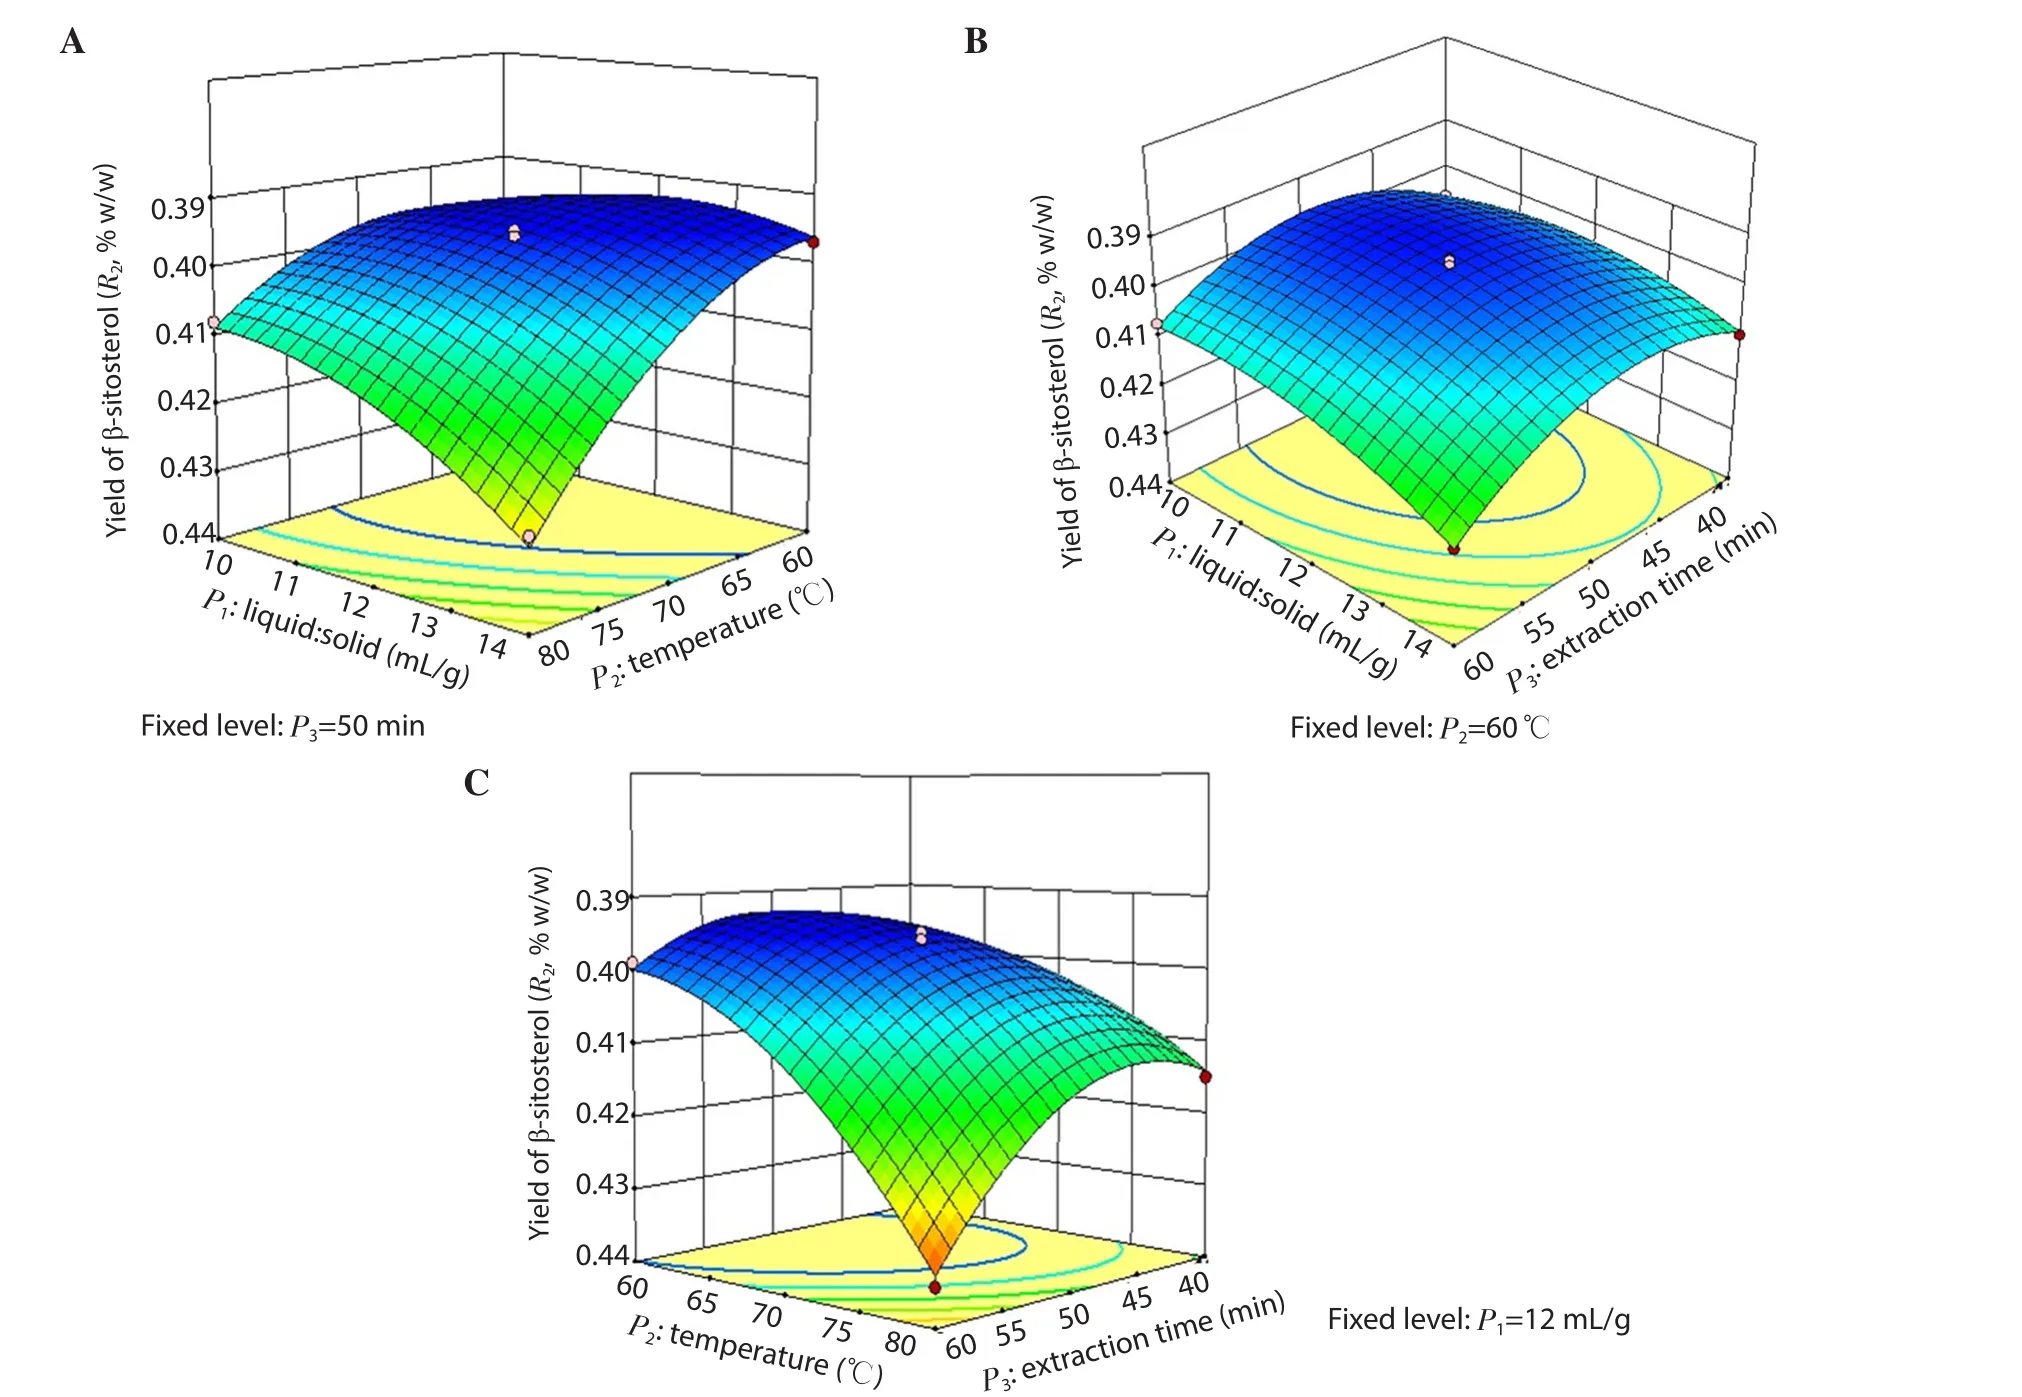
Figure 4.Response surface model 3D plots showing the effects of P1, P2 and P3 on R2.(A) the effect of P1 and P2 on R2; (B) the effect of P1 and P3 on R2; (C)the effect of P2 and P3 on R2.
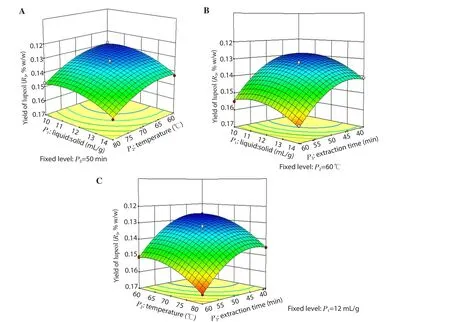
Figure 5.Response surface model 3D plots showing the effects of P1, P2 and P3 on R3.(A) the effect of P1 and P2 on R3; (B) the effect of P1 and P3 on R3; (C)the effect of P2 and P3 on R3.
4.Discussion
The simultaneous quantification of β-sitosterol and lupeol in all the fractions of AACE collected during BBD runs was carried out by validated HPTLC method using hexane and ethyl acetate as suitable mobile phase, which showed a good resolution and a separation of β-sitosterol and lupeol along with the other phytoconstituents available in all the fractions of AACE.The developed method was validated as per the guideline of WHO.The low values of % RSD of β-sitosterol and lupeol indicated an excellent precision for intra-day/inter-day study and the highest accuracy of the proposed method.Furthermore, the low values of % RSD for β-sitosterol and lupeol obtained by deliberately changing the mobile phase composition and the time and temperature of the saturation clearly indicate that the mobile phase is robust.
The effect of extraction time as a single factor for the ultrasonic extraction of AACE was tested.The result showed that the (%)extraction yields of the AACE increased significantly with the increase in time from 10 to 40 min.However, no significant increase was seen after that.Consequently, the time affects the liquid circulation and turbulence produced by the cavitation, which causes an increase in the extraction efficiency by increasing the contact surface area between the solvent and the targeted compounds[24].The increase in the extraction time may lead to the degradation of the triterpenoidal compounds.Similarly, in the case of the extraction, the temperature affects the yield increased with temperature till 60 ℃.However, no significant increase was observed after that.The increase in the extraction yield with increasing temperature is because of the higher mass transfer rate,which leads to higher molecular diffusion[25].The effect of liquid to solid ratio on the extraction yield of AACE was also studied.It was observed that yield increased with the increase in liquid to solid ratio,which may be due to the increase of the driving force for the mass transfer.Therefore, it is consistent with the fact that higher liquid to solid ratios increases the contact surface between the plant material and the solvent, which enhances the mass transfer of soluble compounds from material to solvent[26,27].Based on these observations, the ranges of the three independent variables for the optimization of the ultrasonic extraction method by BBD of RSM were selected as liquid to solid ratio:10-14 mL/g, the extraction temperature: 60-80 ℃ and the extraction time: 40-60 min.
The seventeen runs of BBD were carried out and analyzed with the help of validated HPTLC method to find out the quantity of β-sitosterol and lupeol.Consequently, a quadratic model was found to be the best fit model for the BBD analysis.The values of the adjusted R2/predicted R2for R1, R2and R3were found to be close to 1, which indicated a high degree of correlation between the observed and predicted values.Furthermore, the difference between the adjusted R2and the predicted R2is less than 2, which is required to fit the model.The “Adequate Precision” measuring the signal to noise ratio was found more than 4, which indicated an adequate signal and can be used to navigate the design space.In addition, the low “lack of fit F-value” was found for R1, R2and R3, which indicated that the “lack of fit” is not significant and showed the validity of RSM results.The “lack of fit F-value”test for the model explains the deviation in the data around the fitted model.If it is significant, it means that the model does not fit the data well, hence the insignificant lack of fit is good to fit the model.In this experiment, the model F-value for R1, R2and R3was found to be high,which suggests that the model was significant.
The significance of each extraction variables (P1, P2, P3) effects on R1,R2and R3and the RSM analysis was evaluated.The interactions of P1and P3and the square root of P1produced negative effects on R1which indicated that if P1were to be doubled then R1will robustly decrease.Moreover, the interactions of P1and P2, P1and P3, and P2and P3along with the square roots of P1, P2and P3produced positive effects on the R2, which suggested that the increase in any variable will increase the R2.The interactions of P1and P2, P1and P3, and P2and P3produced negative effects on R3while the square root of P1, P2and P3produced the positive effects, which indicated that if the square root of variables P1, P2and P3were to be doubled then R3will greatly increase.
The 3D plots were constructed to visualize the relationship between the independent variables (P1, P2, P3) and R1, R2and R3.It was clear from the 3D plot that P2(extraction temperature) had a more significant effect on the R1, R2and R3.The maximum yield of R1, R2and R3were obtained at an optimum temperature of 78 ℃.This proves that a higher temperature is helpful in enhancing the compound yield as it increases the diffusion coefficient and solubility, although it may also cause compound degradation[28].For a high yield of R1, R2and R3, the optimum extraction temperature, the extraction time and the liquid to solid ratio were found as 78 ℃, 60 min and 13.5 mL/g, respectively.
To validate the RSM results, the experimental values of the responses were compared with the anticipated values.In addition, the percentage prediction errors were evaluated which established the validity of the generated equation and the applicability of the RSM model.The low magnitudes of error, as well as the significant values of R2in the present experiment, prove the high prognostic ability of the RSM.
In summary, the experimental findings indicated that BBD for RSM and a validated HPTLC method may be highly efficient and promising techniques for optimizing the extraction conditions and the quantitative analysis of β-sitosterol and lupeol from A.atropilosus roots.All the selected variables, their interactions, and quadratic terms had a significant impact on the yield of the total extraction (R1), β-sitosterol(R2) and lupeol (R3).The model prediction can be used to optimize the yield of R1, R2and R3from A.atropilosus (roots) within the limits of the experimental variables.The modified optimal extraction conditions for R1, R2and R3in the A.atropilosus root were found as P1(liquid to solid ratio) of 13.5 mL/g, P2(extraction temperature) of 78 ℃and P3(extraction time) of 60 min.Under these optimal extraction conditions, the experimental yield of R1, R2and R3was found as(8.462±0.440)% w/w, (0.451±0.020)% w/w and (0.172±0.010)% w/w, respectively, which agreed closely with the predicted yield value.The quadratic polynomial model was most appropriate with regard to R1(R2/% CV= 0.994 8/0.28), R2(R2/% CV= 0.992 3/0.39) and R3(R2/% CV= 0.994 2/0.97).The values of adjusted R2/predicted R2for R1, R2and R3were found as 0.978 2/0.955 1, 0.990 4/0.911 0 and 0.992 7/0.940 1, respectively (close to 1) and its difference was less than 2.This indicated a high degree of correlation and good model fitting.The signal to noise ratio were 48.77, 31.33 and 36.08 for R1,R2and R3, respectively, which indicated an adequate signal and can be used to navigate the design space.Furthermore, the linear correlation plot between the predicted and experimental values for R1, R2and R3showed a high value of R2(ranging from 0.990 5-0.997 3), indicating the prognostic ability of the RSM design.In this study, the solvent system developed for the HPTLC analysis of β-sitosterol and lupeol was found to be excellent in resolving their peaks efficiently and the low values of LOD and LOQ showed the great sensitivity of the developed method.In the future, the extraction of β-sitosterol and lupeol from the A.atropilosus (roots) using the ultrasonic extraction can be used as an alternative natural source of β-sitosterol and lupeol for the pharmaceutical industries.The findings of the RSM analysis can be applied in the future for the maximum extraction of the β-sitosterol and lupeol in other species of genus Astragalus.The obtained statistical data supports the applicability of the developed HPTLC method for the quality control of herbal preparations containing β-sitosterol and lupeol.
Conflict of interest statement
We declare that there is no conflict of interest.
Acknowledgments
The authors are grateful to the Researchers Supporting Project Number (RSP-2019/132), King Saud University, Riyadh, Kingdom of Saudi Arabia.
Authors’ contributions
PA: Planning, execution, manuscript writing and correspondence;NAS: HPTLC analysis of different exttracts; ASA: BBD analysis;AH: literature survey; OAB: ultrasonic extraction of crude drug;SIA: manuscript writing; AAM: collection, drying and storage of crude drug; MUK: data analysis.
 Asian Pacific Journal of Tropical Biomedicine2020年6期
- Asian Pacific Journal of Tropical Biomedicine的其它文章
- Enzyme-treated date plum leave extract ameliorates atopic dermatitis-like skin lesion in hairless mice
- Leishmania tropica: The comparison of two frequently-used methods of parasite load assay in vaccinated mice
- Formononetin alleviates diabetic cardiomyopathy by inhibiting oxidative stress and upregulating SIRT1 in rats
- Moringa oleifera leaf ethanol extract ameliorates lead-induced hepato-nephrotoxicity in rabbits
- Standardized extract of Centella asiatica ECa 233 inhibits lipopolysaccharide-induced cytokine release in skin keratinocytes by suppressing ERK1/2 pathways
