Leishmania tropica: The comparison of two frequently-used methods of parasite load assay in vaccinated mice
Fatemeh Nemati Zargaran, Mosayeb Rostamian, Alisha Akya, Hamid M.Niknam
1Infectious Diseases Research Center, Health Institute, Kermanshah University of Medical Sciences, Kermanshah, Iran
2Immunology Department, Pasteur Institute of Iran, 69 Pasteur Avenue, Tehran 13169-43551, Iran
ABSTRACT
KEYWORDS: Leishmania tropica; Vaccinated mice; Limiting dilution assay; Parasite load assay, Real-time PCR
1.Introduction
Leishmaniasis is an intracellular protozoan disease, with different forms, namely, cutaneous, mucocutaneous, and visceral leishmaniasis[1].Cutaneous leishmaniasis (CL) in the Middle East is mainly caused by Leishmania major (L.major) and Leishmania tropica (L.tropica).In contrast to L.major, little studies have been done on L.tropica.Furthermore, these two species are different in many aspects and cause different forms of diseases in humans and animal models.It has been found that in comparison to L.major, L.tropica is heterogeneous genetically, leading to variable manifestations[2].
In inbred BALB/c mice which are the most studied animal models in leishmaniasis, compared with L.major which results in a severe lesion, L.tropica causes mild pathogenesis with small (or no)swelling in infection sites[3-8].
There is no approved and available vaccine for CL.However, there are numerous researches ongoing in this field.The assessment of Leishmania vaccine efficiency has been traditionally performed by measuring lesion size in the animal models.However, there is always no direct correlation between the lesion size and parasite’s burden within the lesion or other organs[9,10].Moreover, some Leishmania species (such as some isolates of L.tropica) do not cause measurable lesions in the most studied animal models including BALB/c mice[3,4,6,11].These issues led to the development of reliable techniques for the quantification of Leishmania parasites load as a better criterion for the evaluation of vaccine efficiency.
There are two frequently-used methods for parasite load measurement: the older method of limiting dilution assay (LDA)and the newer method of real-time PCR.LDA is a sensitive method based on the in vitro culture of infected tissues[12,13].LDA method has been evaluated many times and its suitability for Leishmania quantification has been shown for many Leishmania species.However, it has some limitations including being laborious, timeconsuming, more prone to fungal and bacterial contaminations and also needs counting by technicians that may increase human errors[14,15].Thus, the more recent technique of real-time PCR has been developed with some advantages including faster process and being less prone to human manipulation errors in comparison to LDA[14,16,17].Real-time PCR has also been used for the clinical diagnosis of Leishmania[18].Despite these advantages, there is no enough evidence to support the replacement of LDA by realtime PCR.Although there are studies that compared these two methods[14,16], no information is available for comparing these methods for measurement of L.tropica load which causes mild pathogenesis in BALB/c mice model.Furthermore, as far as we know, there is no report to compare these two methods in vaccinated/unvaccinated experimental groups.Therefore, in the present study,using different vaccinated/unvaccinated BALB/c mice groups, the two methods of LDA and real-time PCR were compared regarding the quantification of L.tropica parasite load.
2.Materials and methods
2.1.Parasites
L.tropica strain MHOM/AF/88/KK27 which has been isolated from Afghanistan and kindly donated by Dr.D.Sacks (Laboratory of Parasitic Diseases, National Institute of Health, Bethesda, Maryland,USA) and L.major strain MRHO/IR/75/ER as a gift from M.Mohebali (School of Public Health, Tehran University of Medical Sciences, Tehran, Iran), were used in this study.All procedures of maintaining and species confirmation, parasite culture and preservation of their virulence were done as stated in our previous reports[11,19].
2.2.Antigens and adjuvants
Whole-cell soluble Leishmania antigen (SLA) of L.tropica and recombinant L.tropica stress-inducible protein-1 (rLtSTI1) were used as antigens in this study.SLA antigen was prepared as previously reported[3] and rLtSTI1 was cloned and expressed in Escherichia coli expression system[20].Two adjuvants were used: R848 (resiquimod)and monophosphoryl lipid A (MPL) which were purchased from Sigma-Aldrich (Taufkirchen, Germany) and Invivogen (Toulouse,France), respectively.
2.3.Animals, immunization, and infection
BALB/c mice, female, 5-7 weeks old were purchased from Pasteur Institute of Iran (Tehran, Iran).Mice were divided into seven groups(10 mice/group) and named as follows: S (vaccinated by L.tropica SLA), SM (vaccinated by L.tropica SLA+MPL), SR (vaccinated by L.tropica SLA+R848), L (vaccinated by rLtSTI1), LM (vaccinated by rLtSTI1+MPL), LR (vaccinated by rLtSTI1+R848), and phosphate buffered saline (PBS) (vaccinated by PBS as negative control).A naive unvaccinated group was challenged by L.major(indicated by L.m) to compare the swelling pattern of L.tropica with L.major.
Vaccination and challenge programs were done as previously reported[21].Brie fly, vaccines were injected subcutaneously in the hind footpad of mice three times with two weeks interval.Six weeks after the last vaccination, mice were challenged subcutaneously with 2 × 10⁶stationary promastigotes with ~30% morphologically metacyclic as assessed by Ficoll enrichment[22].
2.4.Ethical statement
The whole study was approved by the Ethics Committee of the Pasteur Institute of Iran (license number 95/0201/20704).All procedures involving mice followed the National Institutes of Health(NIH) Guide for the Care and Use of Laboratory Animals (NIH publication # 80-23) and Pasteur Institute of Iran guidelines for animal care.
2.5.Footpad swelling measurement
Footpad swelling development was monitored biweekly using a dial-gauge caliper (Mitutoyo, Kawasaki, Kanagawa, Japan).The swelling values were obtained using the following formula: Swelling value = Tui- Ti, where Tuiis the values of thickness of uninfected footpad and Tiis the values of thickness of contralateral infected footpad.
2.6.Parasite load assay
Two methods were used for parasite load assessment.The draining lymph nodes of mice were removed from the infected footpad,homogenized, and divided into two parts.One part was applied for parasite load assay by LDA; another part was used for parasite load assay by real-time PCR.LDA was done by diluting tissue samples to extinction in a biphasic medium, as previously reported[12].Brie fly,the lymph node cell suspensions were serially diluted (ten-fold) in culture medium (RPMI-1640) and added to Novy MacNeal Nicolle(NNN) medium in 96-well plates in triplicate to the extinction of parasite growth.The highest dilution, at which parasites can be seen by microscopic inspection, was recorded as lymph node parasite load.The geometric mean of individual titers was used to compare the parasite load of different experimental groups.
Parasite load measurement by real-time PCR was done as previously described[12,23].Briefly, DNA of the lymph nodes was extracted using DNeasy Blood & Tissue Kit (Qiagen, USA).Equal dilutions(10 ng/μL) of each sample were prepared and hot-start real-time PCR was done using SYBR green master mix in final volumes of 25 μL, using the following primers which target the conserved region of the kinetoplast DNA: Forward, 5’- GGGTAGGGGCGTTCTGC-3’;Reverse, 5’- TACACCAACCCCCAGTTTGC-3’.
The program of thermocycling was as follows: 95 ℃ (4 min), 42 cycles of 95 ℃ (10 s) and 60 ℃ (35 s) followed by melting analysis.In order to quantify the parasites, using different dilutions of 108to 100 copies of L.tropica genomic DNA, a standard curve was generated.The number of parasites DNA copies as a representative parasite load of each sample was calculated automatically by the apparatus software by interpolating cycle threshold (CT) of each sample in the standard curve.Two negative controls were used in each run: 1) DNA from the lymph node of naive mice (negative control), 2) distilled water (non-template control).
2.7.Statistical analysis
Multiple comparisons were done by the analysis of variance(ANOVA) and the two-way comparisons between the groups were done by student’s t-test using GraphPad Prism software (version 6.0).The correlation coefficient of data was found out by Spearman’s test.P-value < 0.05 was assumed to be significant.In order to express the data, the mean value ± standard deviation (SD) was applied.
3.Results
3.1.Swelling measurement
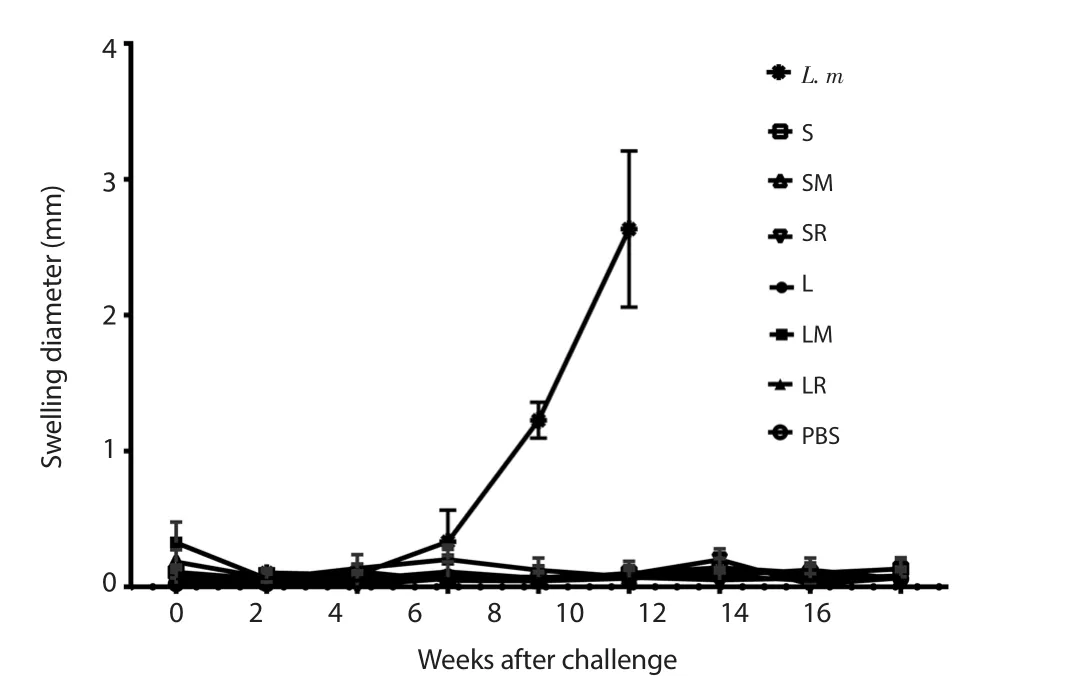
The mice’s footpad thicknesses were measured up to 16 weeks after the challenge.No (or little) swelling was observed in all experimental groups challenged by L.tropica (Figure 1).Conversely,unvaccinated mice challenged by L.major showed significant lesion diameters up to 10 weeks after challenge when the measurement was discontinued due to necrosis in the footpad.

Figure 1.Footpad swelling measurement.Each bar demonstrates mean ±SD of swellings.The measurement was discontinued for L.m 10 weeks after challenge due to necrosis.S: SLA, SM: SLA+MPL, SR: SLA+R848, L: rLtSTI1,LM: rLtSTI1+MPL, LR: rLtSTI1+R848, L.m: A naive group challenged by Leishmania major.SLA: soluble Leishmania antigen, rLtSTI1: recombinant Leishmania tropica stress-inducible protein-1, MPL: monophosphoryl lipid A.
3.2.Real-time PCR setting
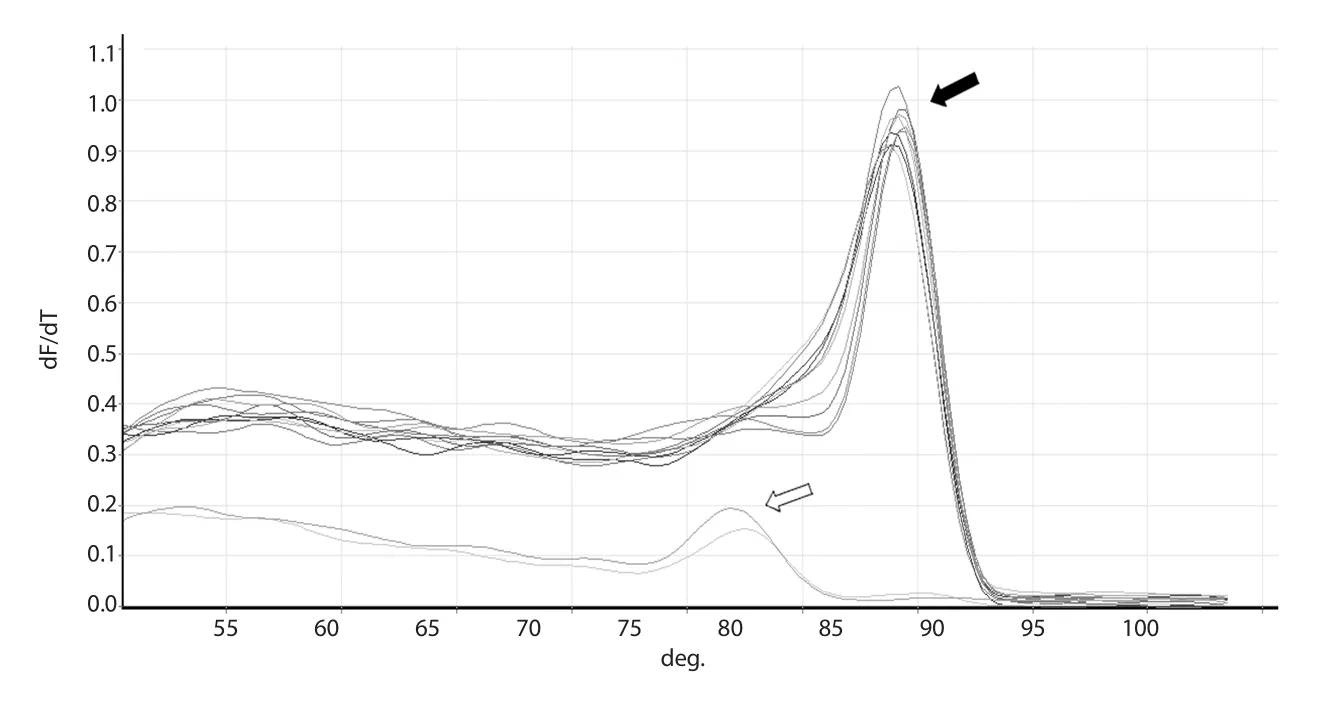
At the end of each run, melting curve analysis was performed to detect non-specific double-stranded reaction products.A single peak with the melting temperature of ~84 ℃ was observed for each sample, indicating a specific PCR product (Figure 2).Moreover,single bands of ~150 bp corresponding to target amplicon of kDNA were observed for all real-time PCR products running on 2% agarose gel which re-confirmed the melting analysis results.
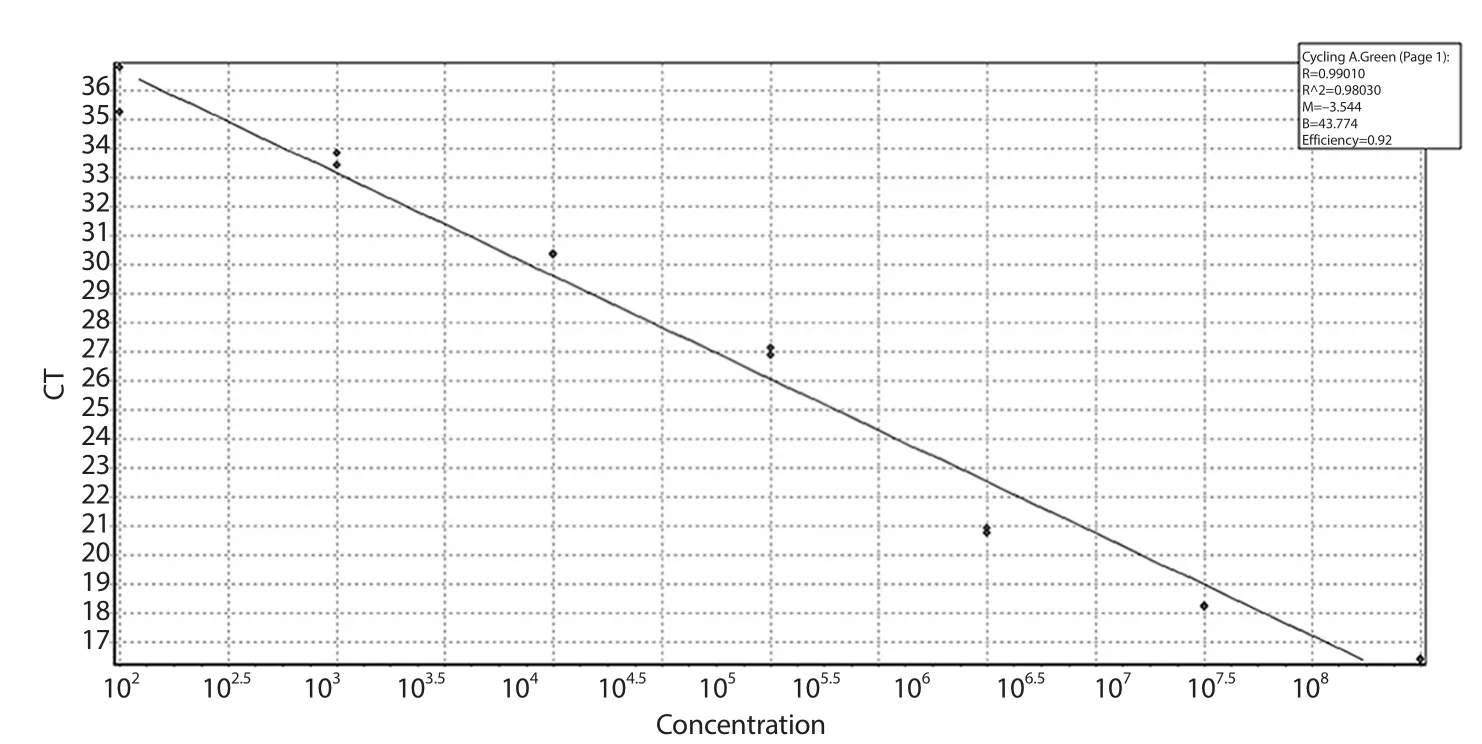
The standard curve was made using 10-fold serial dilutions of 108to 100 copies of L.tropica genomic DNA to perform quantification of Leishmania parasites.The suitability of the standard curve was shown by the amplification efficiency of 0.92 and the correlation coefficient (R2) value of 0.98 (Figure 3).
3.3.Parasite load assay
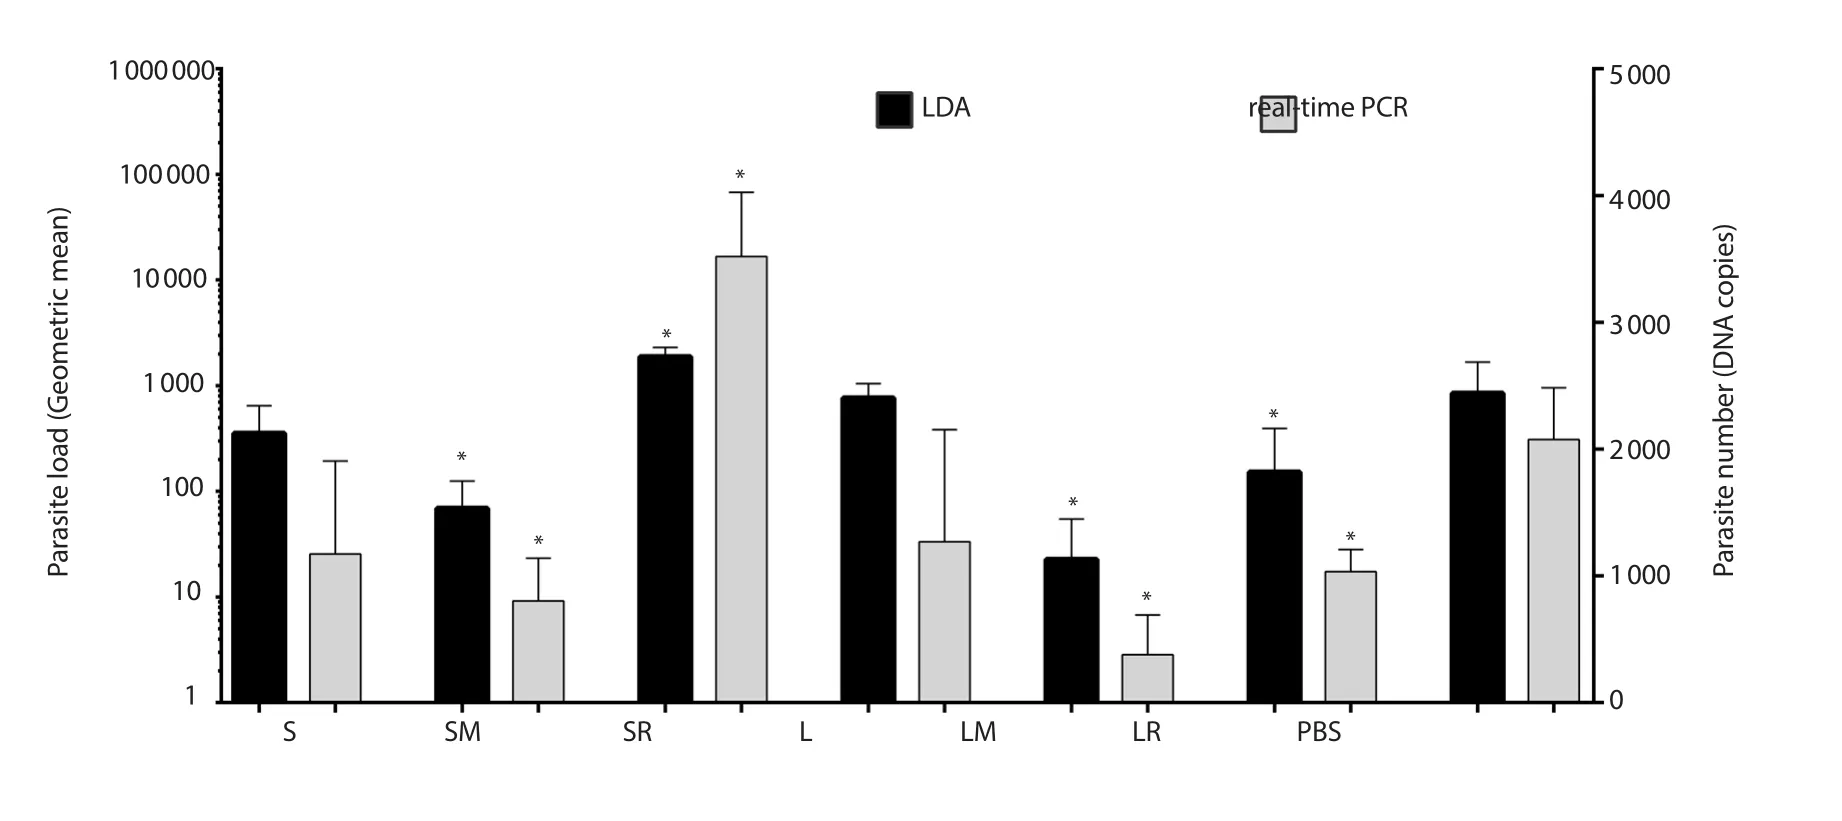
Two months after challenge, parasite load was assayed in all groups by LDA and real-time PCR methods.Both LDA and real-time PCR assays showed approximately similar results.According to results of both assays, groups SM, SR, LM, and LR had significant differences with the control (PBS) group.In addition, wherever parasite load of a group is estimated high (or low) by one method,the estimated parasite load by another method is the same, although the statistically significant differences were only seen between some groups.In both methods, the mice which received MPL + rLtSTI1 showed lower and mice which received R848 + SLA showed higher parasite load than others (Figure 4).

Figure 2.Melting curve and 2% gel electrophoresis of the amplified fragment of kDNA gene.A single peak at ~84 ℃ of melting curve (shown by black arrow) indicates the purity of the real-time PCR product and lack of any non-specific primer dimer.Both non-template and negative controls show a peak at ~75 ℃ corresponding to non-specific primer dimer(shown by white arrow).

Figure 3.Standard curve of real-time PCR.The plot demonstrated the mean CT values ± SD from two replicates against the number of parasites.The amplification efficiency and the correlation coefficient (R2) values of the standard curve were 0.92 and 0.98,respectively.
In order to compare real-time PCR and LDA, a statistical Spearman’s correlation coefficient analysis was performed.The results showed the correlation coefficient was 0.659 for the parasite burden between two methods with statistically significant difference(P = 0.001), confirming that real-time PCR results were correlated with LDA results and could be an appropriate alternative for it.
4.Discussion
As shown in our study and the previous reports[3,4,6,7], L.tropica causes mild pathogenesis in BALB/c mice with a small or no detectable swelling in the injection site.Consequently, the assessment of its pathogenesis by swelling development is not promising and the parasite load in animal tissues can be a more reliable criterion for this purpose.
Two quantification methods were used for determining the parasite load of the lymph node of vaccinated/unvaccinated animal models,namely, LDA and real-time PCR method.The results indicated that both methods can produce approximately similar results in terms of showing relationship between parasite load of different experimental groups.In other words, if the parasite load of a group is higher than another group, both methods can show this difference.However,there are some advantages and limitations of both methods.It is noteworthy that the number of parasites counted by real-time PCR was not the same as that estimated by LDA.This can be explained by different counting bases used by each technique or by the fact that LDA only quantifies live parasites instead of both live and dead parasites that are counted in the real-time PCR method.
LDA is more prone to errors due to more manipulations required for relatively long time cultures and counting errors by eyeinspection[14,15].In LDA, the parasite load is usually counted 10 days after seeding homogenized tissue into culture plates[12].However,it seems that for L.tropica longer time is needed, since in a study by Anderson et al., the parasite load was counted 15-30 days after primary culture[5].In the present study, in some cases, especially where parasite load was low, we hardly observed live parasites in the highest dilutions that need more eye-inspections for longer times(especially when many samples were examined).These conditions may in turn increase visual errors.To test the possible longer time of cultivation for L.tropica parasite detection in LDA assay, we inspect some culture plates 25 days after primary culture, but they showed similar results as 10 days-inspection detections and no improvement was seen which leaves the issue unsolved.

Figure 4.Parasite load of the lymph nodes in mice determined by LDA and real-time PCR assays.Significant differences between each group and PBS were indicated by “*”.Left and right Y-axes show units of LDA and real-time PCR, respectively.S: SLA, SM: SLA+MPL, SR: SLA+R848, L: rLtSTI1,LM: rLtSTI1+MPL, LR: rLtSTI1+R848.PBS: phosphate buffered saline, SLA: soluble Leishmania antigen, rLtSTI1: recombinant Leishmania tropica stressinducible protein-1, MPL: monophosphoryl lipid A.
Another difference between LDA and real-time PCR methods is the SD values of parasite burden between similar samples (e.g.two similar mice of one group) and also between replicates with each other which is much higher in LDA in comparison to real-time PCR,suggesting that real-time PCR is a more efficient method.These differences may be due to the error-prone process of LDA from the culturing process to technician eye-inspection of the parasites.The SD values of LDA in our results are shown on log10 scale and much higher than the SD values depicted for real-time PCR method which are shown on linear scale.
On the other hand, LDA has some advantages which make it a frequently-used method.In contrast to real-time PCR method which counts all live or dead parasites (because it counts DNA without discrimination between DNA of live or dead parasites), LDA only detects live parasites.Furthermore, LDA is cheaper due to no need for expensive devices such as a real-time PCR apparatus.
The present and previous studies[10,14,16,17,23,24] showed the efficiency of real-time PCR to quantify Leishmania species and revealed that real-time PCR could be a good alternative for LDA with advantages such as reproducibility, sensitivity, rapidity, and feasibility.Thus, the overall results of the present study indicate that in order to quantify the parasite load of vaccinated/unvaccinated animal models for L.tropica, both LDA and real-time PCR methods can be used.However, due to lower errors and faster process, the real-time PCR method is preferred.
Conflict of interest statement
The authors declare that there are no conflicts of interests.
Funding
This work was supported by Pasteur Institute of Iran (funding No:754) and Kermanshah University of Medical Sciences (funding No:980467).
Authors’ contributions
MR and HMN contributed to the study design.Material preparation, data collection and analysis were performed by FNZ,MR and HMN.The first draft of the manuscript was written by MR,AA, and HMN.All authors read and approved the final manuscript.
 Asian Pacific Journal of Tropical Biomedicine2020年6期
- Asian Pacific Journal of Tropical Biomedicine的其它文章
- Enzyme-treated date plum leave extract ameliorates atopic dermatitis-like skin lesion in hairless mice
- Formononetin alleviates diabetic cardiomyopathy by inhibiting oxidative stress and upregulating SIRT1 in rats
- Moringa oleifera leaf ethanol extract ameliorates lead-induced hepato-nephrotoxicity in rabbits
- Standardized extract of Centella asiatica ECa 233 inhibits lipopolysaccharide-induced cytokine release in skin keratinocytes by suppressing ERK1/2 pathways
- Response surface methodology-based optimization of ultrasound-assisted extraction of β-sitosterol and lupeol from Astragalus atropilosus (roots) and validation by HPTLC method
