
An approach for predicting digital material consumption in electronic warfare
2020-04-09 18:47:30XiongLiXiaodongZhaoWeiPu
Defence Technology 2020年1期
Xiong Li,Xiao-dong Zhao,Wei Pu
Military Exercise and Training Center,Army Academy of Armored Forces,Beijing 100072,China
Keywords:Electronic warfare Support vector regression(SVR)Prediction model Decision-making
ABSTRACT Electronic warfare is a modern combat mode,in which predicting digital material consumption is a key for material requirements planning(MRP).In this paper,we introduce an insensitive loss function(ε)and propose aε-SVR-based prediction approach.First,we quantify values of influencing factors of digital equipments in electronic warfare and a small-sample data on real consumption to form a real combat data set,and preprocess it to construct the sample space.Subsequently,we establish the ε-SVR-based prediction model based on“wartime influencing factors-material consumption”and perform model training.In case study,we give 8 historical battle events with battle damage data and predict 3 representative kinds of digital materials by using the proposed approach.The results illustrate its higher accuracy and more convenience compared with other current approaches.Taking data acquisition controller prediction as an example,our model has better prediction performance(RMSE=0.575 7,MAPE(%)=12.037 6 and R2=0.996 0)compared with BP neural network model(RMSE=1.272 9,MAPE(%)=23.577 5 and R2=0.980 3)and GM(1,1)model(RMSE=2.095 0,MAPE(%)=24.188 0 and R2=0.946 6).The fact shows that the approach can be used to support decision-making for MRP in electronic warfare.©2020 China Ordnance Society.Production and hosting by Elsevier B.V.on behalf of KeAi Communications Co.This is an open access article under the CC BY-NC-ND license(http://creativecommons.org/licenses/by-nc-nd/4.0/).
1.Introduction
Material requirements planning(MRP)has been a very popular and widely used production control method since 1970s[1,2].Since MRP presents to the user a valuable future work load[3],predicting digital material consumption is one of cores and key problems of MRP.Digital material is w hat is used to perform electronic warfare tasks and include data acquisition controller,combat identification friend of foe(IFF)system,and command and control(C2)system,for example.Digital material plays an important role in logistics and supply chain management for electronic warfare.To grasp exactly digital material consumption is the premise to determine demands of logistics reasonably and provide category and quantity of logistics accurately.Thus,it can realize transition from traditional“extensive”support to“accurate”support truly and achieve high-efficiency logistics for electronic warfare in the right place at the right time.
Unfortunately,some factors increase difficulty to predict digital material consumption.New equipments at nowadays have more complicated structures,higher degree of automation and technical content,more diversified operational missions,larger operational radius and more challenges in logistics compared to old equipments.Equipments may suffer attacks and damages from enemy's planes,gun fire and other explosives in any place of the battle field at any time.Battle damage of equipments is closely related with the enemy's weapons,equipments,ammunition types and attack modes on the battle field.It includes not only“hard damages”of casualties and equipment damage which are caused by various bullets,shells,bombs and guided missiles,but also“soft damages”of computer system breakdown and electronic equipment failures which are caused by graphite bombs,electromagnetic interference and computer viruses.As for digital material,equipment damages because of electronic warfare are especially fatal.After battle damage,there are often more materials that have to be exchanged.Thus,as to wartime application of digital equipment,there are more diversified fault phenomena and more serious damages,resulting in significantly high difficulty of repair.In addition,battle damages and natural faults in electronic warfare have significant differences in term of damage positions and damage mechanism.Since there is not a linear relationship between them,it is impossible to determine wartime digital material consumption by multiplying simply peacetime digital material consumption by a proportional coefficient.
According to our investigation and research,we know that neural network model and grey model play important roles in the field of forecasting.Neural network modeling can be used to predict flow stress of high strength armor steels[4].As far as grey model is concerned,Zeng et al.have not only promoted the innovation of this method[5,6],but also successfully applied this method to energy forecasting,and solved the practical problem of how to scientifically predict energy consumption[7,8].Yaseen et al.have presented a model on hybrid artificial neural network coupled with rolling mechanism and grey model algorithms for stream flow forecasting with relatively good prediction performance[9].In the issue of predicting material consumption,some researchers propose mainly back-propagation(BP)neural network[10-12]and grey prediction model GM(1,1)[13-15].These two approaches are widely and successfully applied in predicting peacetime material consumption.
Moreover,as a powerful tool for data classification and regression in machine learning,support vector machine(SVM)[16-20],including support vector classification(SVC)and support vector regression(SVR),has become another feasible and popular prediction method.In the past decades,SVM has been successfully applied to a variety of real-world problems,such as electricity forecasting[21]and traffic flow prediction[22].
In terms of this research field,although the three forecasting methods mentioned above have been widely used,unfortunately,the researches on prediction for wartime digital material requirements are very deficient.Especially under the premise that the sample data is scarce due to the limitation of actual combat,there is a lack of research centering on predicting digital material consumption in electronic warfare with higher accuracy and more convenience.The purpose of this paper is to solve the above practical problem.Based on SVC,an insensitive loss function(ε)is introduced.With considerations to advantages of ε-SVR,aε-SVR based approach is proposed to predict digital material consumption in electronic warfare.Our method is proposed to meet the needs of wartime MRP.On the basis of selecting and preprocessing a small amount of data on digital material consumption in actual combat,the future material requirements can be accurately predicted without actual combat by constructing ε-SVR-based prediction model.Based on the predicted results,model checking is carried out to ensure validity of the model.Note that during this modeling process,we compare and analyze different kernel functions and finally selected the appropriate kernel function,as well as combine leave-one-out cross validation(LOO-CV)and grid search method to train the model and determine the optimal parameters,so as to ensure that the proposed prediction model can meet the actual needs.As for methodology,our approach is more efficient and convenient than traditional machine learning algorithms in solving the four problems:small sample,high dimension,structural selection and local extremum.As for the practical applications,it is found that the prediction results based on our method are more accurate than those based on BP neural network model and GM(1,1)model.
The rest of the paper is organized as follow s:Section 2 describes the research problem and presents its methodology.Section 3 details the steps of construction of sample space.Section 4 expounds the procedures of construction of ε-SVR-based prediction model and model training.Section 5 states a study case and illustrates its results.Section 6 discusses the conclusion and future work.
2.Problem description and research methodology
Logistics and supply chain management involves an integrated approach with the integration of information,transportation,inventory,warehousing,material handling,and packaging,and recently added security[23].MRP in logistics and supply chain management for electronic warfare is intended for military purposes,and is used to meet wartime demands.In wartime,equipment damages come into being and engagement of the opposed forces inevitably engenders battle damages and material consumption.One of key tasks of military logistics and supply chain management is to afford moderate material support by predicting material consumption reasonably.
2.1.Problem description
MRP is regarded as one of the most widely used systems for production planning and control in industry[1].MRP is a management scheduling and control technique designed to minimize inventory investment,to maximize production and operating efficiency and to improve customer service.Usually MRP is achieved based on the forecasted demand and/or f i rm sales orders for a finished product[2].Effective production planning and control systems are those that produce the right parts,at the right time,at competitive costs[3].Therefore,predicting material consumption is essential to material inventory control.
In recent years,with the application of high-tech,formed units become more and more types of equipment,the structure of equipment is also more complex,and different units in the preventive maintenance of equipment often adopt different maintenance strategies.The phenomenon results in material consumption patterns more difficult to grasp and varieties,quantity and cost of predicting spare parts consumption becoming more arduous[24].
As for electronic warfare,domination of the electromagnetic spectrum is a crucial component of the 21st century warfare.In the harsh electromagnetic environment of the modern battle field,it is of the utmost importance to deny the opposing force the opportunity to attack or exploit the detection/interception of friendly communications assets through the deployment of electronic protection measures in order to attain low probability of detection,low probability of interception and anti-jam[25].As the demand has the feature of irregularity and lumpiness,predicting digital material consumption in electronic warfare is very difficult.Nonparametric approaches,like the empirical method,are suitable for spare parts since they can represent the erratic and lumpy demand behavior.A limited number of observations prevent the empirical method from achieving high performance[26].
Thus problems form:to predict digital material consumption in electronic warfare,how to definitude its parameters?Is there another prediction approach that is applicable to wartime MRP and more effectual than common approaches?
2.2.Research methodology
To attack the above critical challenge,we propose a ε-SVR-based approach to predicting digital material consumption.At first,quantized values of influencing factors of digital equipments in electronic warfare and a small-sample data on real consumption need to be used as the input,forming a real combat data set.Then,these data need to be preprocessed,so that the sample space is constructed.Subsequently,prediction is carried out according to the sample space and the ε-SVR-based prediction model.The corresponding digital material loss can be used as output,by which we can get the predicted value of digital material consumption.The general process of this methodology is illustrated in Fig.1.

Fig.1.Flow chart of the ε-SVR-based prediction approach.
The main phases include:
(1)Construction of sample space.According to the needs of wartime MRP,find appropriate battle events and complete abstraction on them.On the one hand,classify related wartime data,i.e.,battle damage and logistics data,then extract and collect data on real digital material consumption in historical battles,thus generating small-sample data.On the other hand,classify influencing factors of digital equipments from the abstracted combat events,and quantify their values.Thus,data preprocess can be achieved and the corresponding sample space can be constructed.
(2)Construction of model and model training.Use wartime influencing factors as the input variables and corresponding material consumption as the output variable to construct the ε-SVR prediction model.After selecting the appropriate kernel function,perform learning training of training samples with the ε-SVR prediction model,and determine the optimal parameters of models through adjustment and optimization.Then,use this prediction model with determined parameters to predict new samples.
(3)Prediction results and model checkout.Obtain ε-SVR-based prediction results on digital material consumption in electronic warfare,and then check out this prediction model according to these results.
Compared with traditional machine learning algorithms represented by neural network,the proposed approach has some unique characteristics,which determine its outstanding advantages in solving “over fitting”and “curse of dimensionality”in high dimensional pattern recognition with small sample size and local extremums,as shown in Table 1.
3.Construction of sample space
Military logistics and supply chain management covers lifecycle management and support of equipments and maintenance materials.It requires assessment in and after battle as well as prediction before battle.In this study,we analyze the important influencing factors of equipment damage in electronic warfare and their quantitative measures,and their real consumption data.The data set can be viewed as a sample space and is used to predict digital material consumption to support MRP in logistics and supply chain management for electronic warfare.
3.1.Formation of real combat data set
Under information conditions,electronic damage is mainly related with electromagnetic environment consisting of artificial and natural types.Except for special weathers,natural electromagnetic environment affects electronic equipments slightly.Therefore,electromagnetic environment in electronic warfare mainly refers to the artificial one.
Electronic system in modern equipments mainly includes information acquisition system,signal conditioning system,information processing system,electronic execution system,power management system and electromagnetic interference system.Since digital equipments have more electronic devices,they are easy to encounter electronic attacks from the enemy.Electronic attacks refer to the actions that assault electronic information device,system,network and related weapon system or operators by using electronic jamming devices and some electronic destructionweapons.Electronic jamming is to reduce performance of enemy's electronic information equipments or system and even make them failure by electromagnetic energy.Generally,electronic jamming won't destroy electronic equipments.How ever,electron destruction refers to the damage from the enemy by using anti-radiation weapons,directed energy weapons or electromagnetic pulse weapons.This paper focused on electronic damage caused by electromagnetic pulse weapons.
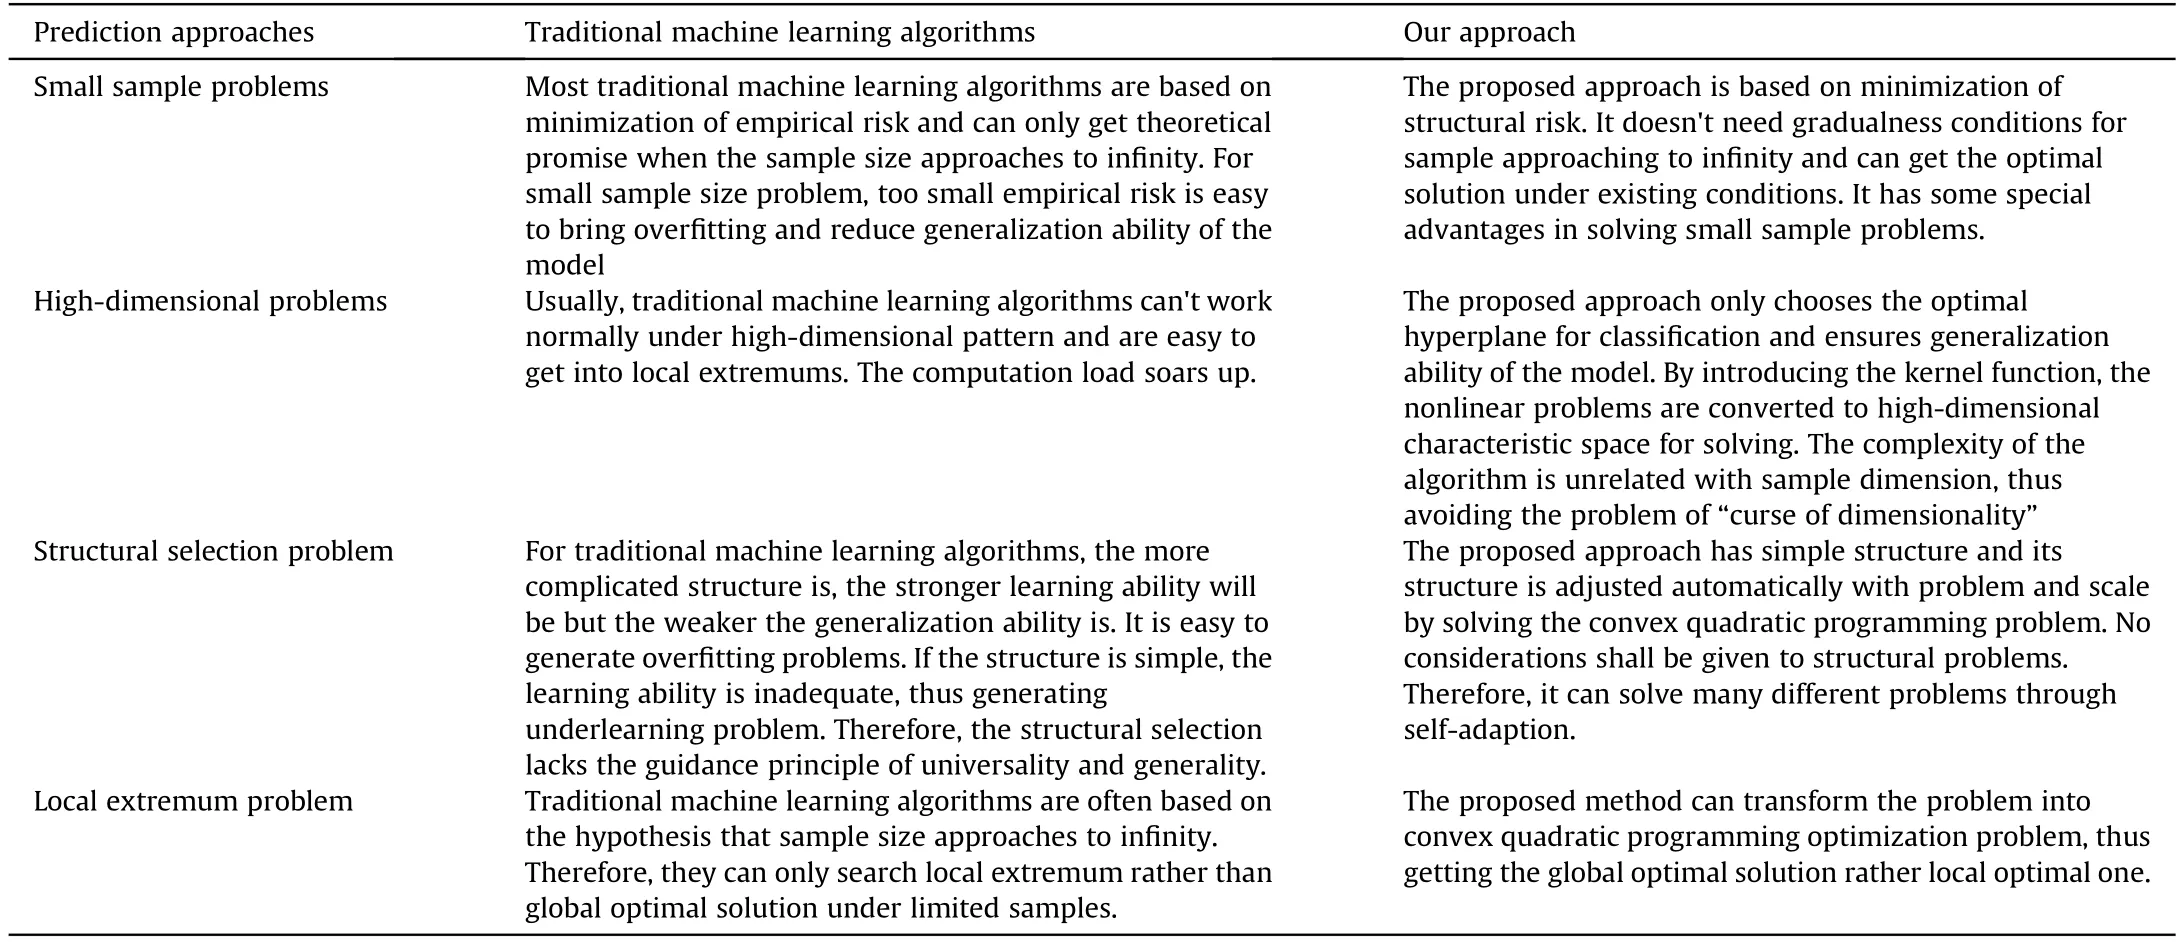
Table 1 Comparison of traditional machine learning algorithms and our approach.
We consider the key role of electromagnetic pulse weapons in interfering and destroying digital equipments by generating strong electromagnetic pulses,which strength is mainly expressed by field strength or power density.If spatial attenuation of electromagnetic pulse is overlooked and its energy conforms to uniform distribution,field strength of electromagnetic pulse(E)and power density(q)can be expressed as[27]:
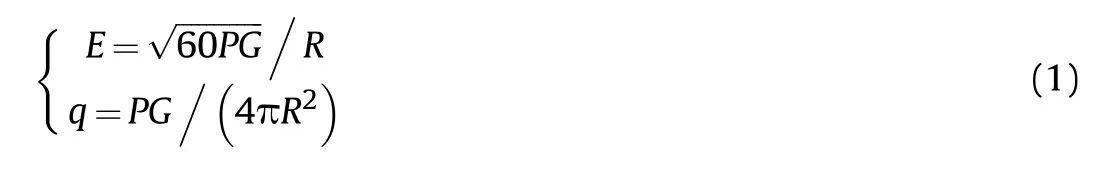
where P is radiation power of electromagnetic pulse weapons,G is antenna gains of electromagnetic pulse weapons and R is the straight distance between the attacked target and the emission source of electromagnetic pulse weapons,that is,the attacking distance of electromagnetic pulse weapons.Electromagnetic radiations with different power densities influence electronic equipment differently[27,28],as listed in Table 2.
According to the above analysis,as for digital material in electronic warfare,the two important influencing factors of electronic damage and their quantitative measures can be listed in Table 3.The quantitative measure values form a real combat data set which can lay the data foundation for ε-SVR-based prediction.3.2.Data preprocessing
To reduce impacts of different measurement techniques on results,all collected historical real combat data are normalized according to Eq.(2).

where x′iis numerical value of data i in one project after normalization,xiis actual value of data i in one project,and xmaxis maximum value of data in one project.
The real combat data set after normalization can be used as the sample space of model for model training.
4.Construction of model and model training
The SVR-based prediction model is a typical intelligent model as it has the potential to identify a highly nonlinear system for its ability to approximate complex nonlinear systems[22].By introducing the insensitive loss function(ε)into SVC,we can obtain ε-SVR,and thus expand SVM application from classification to regression.Classification problem is different from regression problem.Value range of the former is limited and fixed values,while one of the later is an arbitrary real number.ε-SVR searches on a function f(x)by using SVR according to know n training set D,thus controlling the absolute error between the predicted value of this function and the real value within ε(ε is approaching to 0 as much as possible).Moreover,the function f(x)must be as smooth as possible,thus forming a“pipe”that uses the function f(x)as the axis with a radius of ε.Since the pipe position is determined by sample points on the“pipe wall”,these sample points are called“support vectors”.The basic idea for ε-SVR-based prediction is to find these support vectors,by which the predicted values with high accuracy and small sample can be obtained.
4.1.Construction of model
The established prediction model uses wartime influencing factors as its input.The basic structure is shown in Fig.2.The goal of the model is to find a function that can reach minimum expected risk of prediction results based on know n real combat data set,thus enabling to predict digital material consumption in a new combat.Based on the principle of minimum structural risk,the optimal function is searched by using the mathematical method of ε-SVR.

Table 2 Influences on electronic equipment from Electromagnetic radiations with different power densities.
If the constructed sample space set with real combat data is D={(xi,yi)|i=1,2,…,m},where xi∈Rnis the influencing factor set related with battle damages,yi∈R is digital material consumption,i is the i th battle event,n is the number of chosen influencing factors,and m is sample size,that is,the number of chosen battle events.
The prediction system for regression estimation can be described as follows.

where f(x)is the predicted consumption,ω·φ(x)is an unknown and represents the inner product of vector ω and mapping function φ(x),and b is the offset.Our target is to minimize the regression risk with the fixed value of ω and b.
The optimal regression function is developed with finding the minimum of the followings[29].
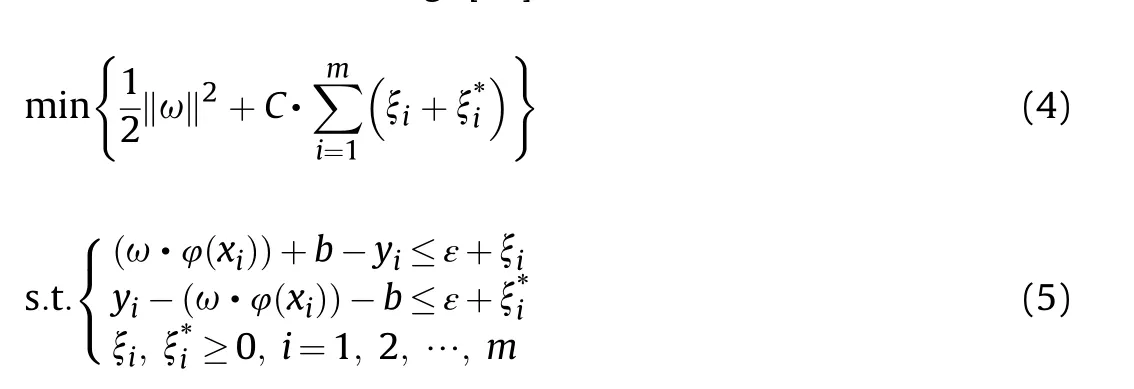
where C(C>0)is balance coefficient,which reflects penalty degree to samples with higher error than ε when compromising between confidence interval and empirical risk.Higher C represents heavier penalty is the confidence interval and reflects expression capacity of the function set,ξiand ξ*iare the slack variables representing upper and lower constants of the system outputs,andreflects empirical risk.
The mathematical problem in Eq.(5)is a typical quadratic programming optimization problem.According to the Lagrange theory,we can obtain the expression of vector ω as:
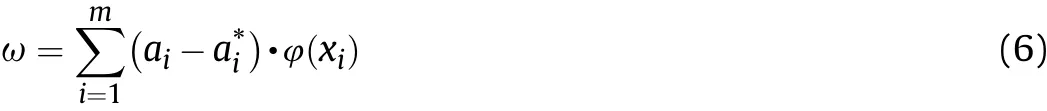
where aiand a*iare Lagrange multipliers.
Bring Eq.(4)into Eq.(2)and the predicted value of the unknown point x can be obtained as follow s.
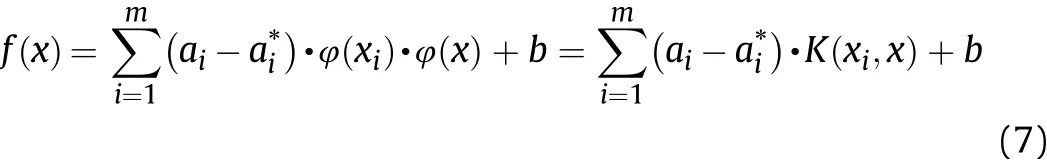
where K(xi,x)=φ(xi)·φ(x)is the kernel function[16-18].
4.2.Prediction model training
After the ε-SVR prediction model is constructed,a certain kernel function and optimal parameter values of this model need to be determined,and the evaluation indices for predicting results needs to be used to decide whether the model training ends.
4.2.1.Selection of kernel function
In SVR-based prediction,selection of kernel function and parameter setting are very important.They determine accuracy and precision of prediction results directly.
Different kernel functions map sample space onto a highdimensional space through different feature transformations and then make linear regression of mapped data in the highdimensional space.Common kernel functions include[16,17]:
(1)Linear kernel function

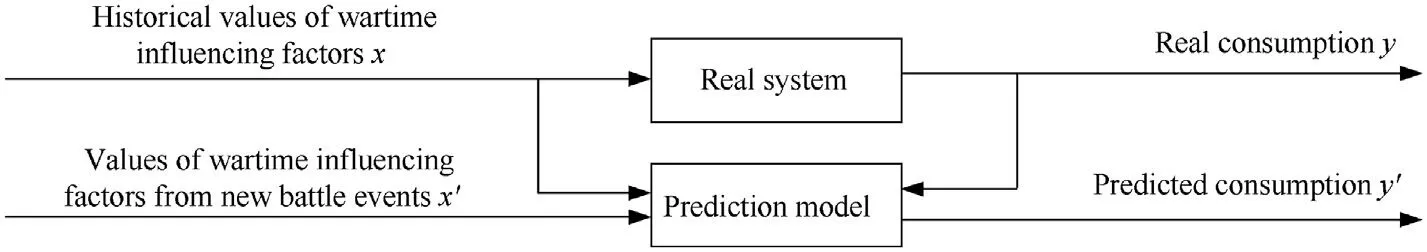
Fig.2.Basic structure of the prediction approach.
(2)Radial basis function(RBF)kernel function

(3)Sigmoid neutral network kernel function

(4)Polynomial function

In actual application process,RBF kernel function is widely used because it can approximate any nonlinear functions and becomes the first choice of kernel function.Main reasons are introduced as follow s:
(1)RBF kernel function can make nonlinear mapping.It can map input samples into in finite-dimensional space,thus realizing linear regression.It has wider application range than linear kernel function.
(2)RBF kernel function has fewer parameters than neural network kernel function and polynomial kernel function.It only involves one parameter(σ).Therefore,it is easier to determine parameters of RBF kernel function in the calculation,showing small complexity.
(3)RBF kernel function is symmetric about y-axis and function images are very smooth.RBF kernel function has arbitrary order of derivatives,thus enabling to map input samples into in finite-dimensional space.
Hence,with few data or without early experiences,RBF kernel function is the best choice.In addition,polynomial function is suitable for orthogonal normalization data,and can map lowdimensional input space to high-latitude feature space.It belongs to a global kernel function,allowing data points far apart to have an impact on the value of the kernel function.How ever,there are relatively many parameters for polynomial kernel function.When the order of polynomial function is relatively high,the learning complexity will be too high,and the phenomenon of“over-fitting”will easily occur.To prevent this potential problem,in this study,RBF kernel function is used to estimate digital material consumption.
4.2.2.Determination of optimal parameters
In this study,the ε-SVR prediction model of RBF kernel function is used in which 3 parameters,namely,insensitivity(ε),regularization parameter(C)and width of RBF kernel function(σ)are determined.Among them,ε is boundary of error.The larger the error range is,the more insensitive of the model,the fewer corresponding support vectors and lower prediction accuracy will be.C is degree of punishment of training model,which mainly controls empirical risk and maintain VC-dimensional equilibrium.Higher C means more severity of punishment.σ reflects sensitivity of support vectors to changes of input samples in the training process.Higher σ reflects slower response of support vector and it can't adjust quickly and timely according to changes of input samples,while lower σ shows higher sensitivity to support vector.It is easy to cause learning failure due to great influences of input samples on support vector.
In this study,we determinate the optimal parameters by combining leave-one-out cross validation(LOO-CV)and grid search method.CV is often used to quantify the predictive ability of a statistical model.In k-fold CV,the whole dataset is partitioned into k parts with k analyses,where one part is omitted for training with validation on the omitted part.LOO-CV is a special case of k-fold CV with k=n,the number of observations.When the dataset is small,LOO-CV is appealing as the size of the training set is maximizing[30].LOO-CV identifies the variable subset belonging to the true model(i.e.incorrect models will not be selected),but it also selects additional variables.That means that minimizing the LOO-CV estimate results in over fitting and thus in a larger prediction error[31].The deficiencies of LOO-CV can be overcome by combining grid search method.When using a grid search to minimize an objective function,the general strategy is to compute the objective function value at each point in the search grid and to retain only the point with the low est objective function value[32].
Because of the small sample space and less data,LOO-CV and grid search method are combined to train the ε-SVRmodel to find the optimal parameters when predicting digital material consumption in electronic warfare.The specific steps are as follow s:
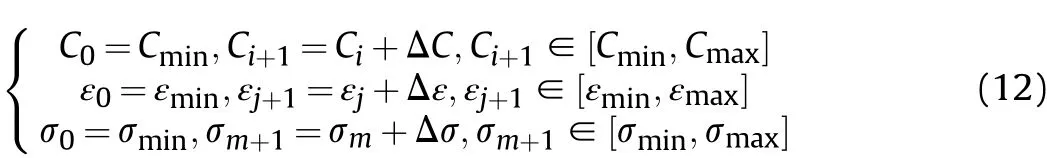
(1)Determine the range of three parameters and the difference within the range of values,as shown in equation set(12),and form a combination of parameters(Ci,εj,σm).
(2)Assume that there are n(n≥3)samples in the sample space,numbered from 1 to n.Respectively,each sample(in the sample space with 1#~n#samples)is used as the test set,while the rest n-1 samples are used as the training set.The model is trained n times with each combination of parameters,and n measurement values are obtained,and then the mean square error is calculated.This mean square error is the corresponding accuracy value of this combination of parameters.
(3)Compare the mean square errors of different combinations of parameters.When the mean square error is the minimum,the corresponding combination of parameters is the optimal one for this measurement model.
4.3.Evaluation indices
The digital material consumption which is predicted by the established ε-SVR model based on“wartime influencing factorsmaterial consumption”has some deviation with actual consumption.This is know n as the estimation error.Estimation error can reflect accuracy of the model and is the critical condition whether the model training ends.Comprehensive study and analysis of estimation error can increase prediction accuracy of the model continuously and provide references for improved model.Meanwhile,the established model is trained.In the process of searching optimal parameters,accuracy of evaluation indices is increased continuously.Therefore,it is very important to choose appropriate evaluation indices.Previous studies have introduced several important indices,such as mean absolute error(MAE),mean relative error(MRE),root mean square error(RMSE),mean absolute percentage error(MAPE),and determination coefficient(R2)[9,29,33].These studies have proved that these indices can comprehensively and reasonably evaluate the prediction methods.Based on these works,we use the following 7 indices,including relative error(RE)and mean square error(MSE).
(1)RE
RE refers to the ratio of absolute value of difference between predicted value and true value(absolute error)and real value after some training times of the model.It reflects relative degree of deviation of predicted value from real value.The calculation formula is shown in Eq.(13).Smaller RE indicates smaller deviation of predicted value from real value and the higher prediction accuracy.Compared to relative error,relative error can reflect credibility of prediction results better.

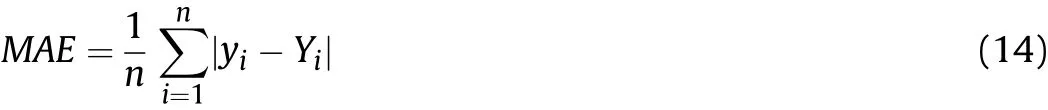
(2)MAE
MAE is the average value of absolute deviations between all individual observations and arithmetic averages.MAE can avoid the problem of mutual cancellation of errors,so it can accurately reflect the actual prediction error.When the predicted value coincides with the real value,it is equal to 0,meaning that this is a perfect model.Greater MAE reflects greater prediction error.MAE can be calculated as Eq.(14).
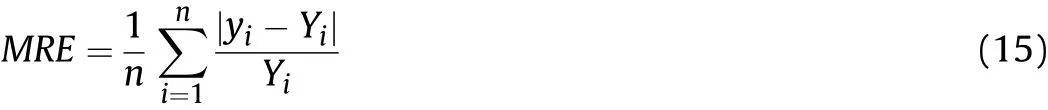
(3)MRE
MRE refers to the average value of relative error between predicted value and real value after several times of model training.It reflects accuracy and stability of the prediction model.The calculation formula is shown in Eq.(15).Smaller MRE reflects higher overall prediction accuracy of the model and higher stability.
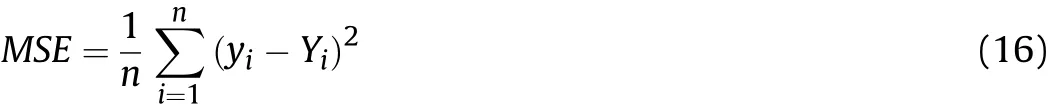
(4)MSE
MSEis the mean square of error between model predicted value and real value.It can evaluate change degree of estimation results.The calculation formula is shown in Eq.(16).Smaller MSE re flects higher prediction accuracy of the model.
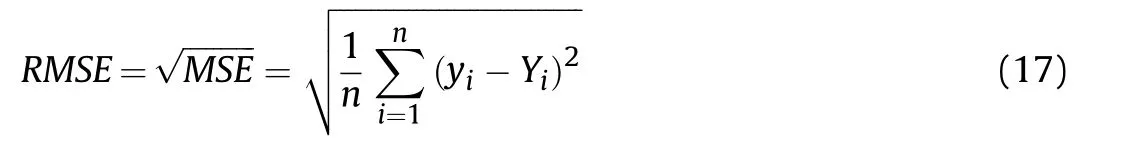
(5)RMSE
RMSE is actually the square root of MSE,so it is usually more intuitive than MSE to evaluate the accuracy of a measurement process.Similarly,when the predicted value coincides with the real value perfectly,it is equal to 0,that is,the greater the error,the greater the value.RMSE can be calculated as Eq.(17).
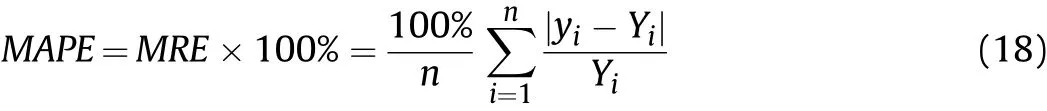
(6)MAPE
MAPE can be used to measure the predicted results of a model.MAPE is 0%means that it a perfect model,while MAPE more than 100%represents a poor model.Obviously,for the same set of data,the smaller MAPE,the better the predicted effect of the corresponding prediction method.Compared with MRE,it just emphasizes multiplying by 100%.But this makes it more accurate than MRE to describe the error value.RMSE can be calculated as Eq.(18).
(7)R2
R2method aims at exploring how much better the predicted value can be compared with the case where only the mean value is used.Its value range is[0,1].1 indicates that all the predictions match the real results perfectly.That is to say,the closer R2approaches 1,indicating that the predicted value matches the true value more approximately.R2can be calculated as Eq.(19).
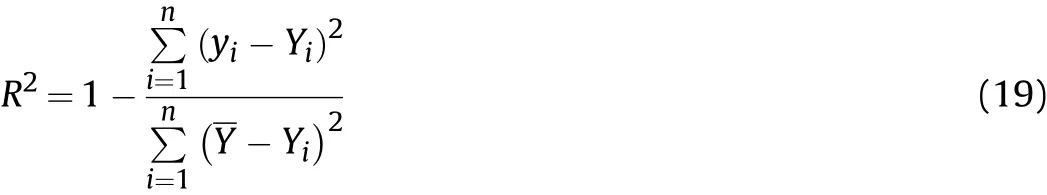
In Eq.(13)~Eq.(19),yiis predicted value of the model,Yiis real value of data corresponding to the predicted value in the sample space,andrepresents the average value of true values.
5.Case study
In this paper,we take a combined digital army element which plays as the Red Force as study object.During its assault to the Blue Force,it suffers electronic attacks from the Blue Force,subsequently its some electronic equipment is damaged and digital material requirement is presented.
5.1.Selection and preprocessing of data
We give 8 historical battle events with battle damage data to verify feasibility and validity of the above predicting approach.The radiation power density of electromagnetic pulse weapons(q)and attacking distance(R)of the Blue Force in 8 electronic warfare operations are used as model input.The historical consumption data of data acquisition controller(Sk),historical consumption data of combat IFF system(Sm)and number of faults of C2system in a vehicle-mounted computer(Sr)of one equipment are used to construct the real combat dataset listed in Table 4.
Data in Table 4 are preprocessed and results are shown in Table 5.Thus we establish the sample space according to the data in Table 5,which provides a basis for training model and verifying model.
5.2.Prediction results and model checkout
We determine the optimal parameters and perform accuracy tests by using SVM_SteveGunn toolbox and MATLAB R2012a software.The ranges of the parameters and the difference within the ranges are set up,as listed in Table 6.
By combining LOO-CV and grid search method,we take 1#~6#samples as training samples to train the ε-SVR model through multiple operations and debugging based on software.That is to say,based on the fact that there are only a few battle events found in this research due to the limitation of actual combat,the training sample space is constructed with 6 samples from 1#sample to 6#sample,which is used to train the model and find the optimal parameters.Then the test sample space is constructed with 6 samples from 3#sample to 8#sample.Among them,3#~6#samples are used to test the fitting degree of the constructed model to know n data,while 7#sample and 8#sample are used to test the predicting ability of the constructed model.Thus we find values of the optimal parameters of digital material consumption in the prediction model,as listed in Table 7.
Then,we take 3#~8#samples as test samples to input the model with the determined the optimal parameters,and thus obtain the prediction results.Results are compared with actual values and predicted values by our model,BP neural network model and GM(1,1)model in Table 8,Table 9,Table 10,Fig.3,Fig.4 and Fig.5,since these two methods are currently used widely in predicting material consumption.
According to prediction results,the predicted value by the maintenance material consumption prediction system for digital equipments in warfare is similar with real value,which agrees with historical data basically.This reveals that the proposed approach can be used to predict digital material consumption of digital equipments in electronic warfare.The fact indicates its usability and applicability.
Table 8,Table 9,Table 10,Figs.3-5 show that compared to BP neural network model and GM(1,1)model,the ε-SVR model used in the system has better abilities of data fitting and data prediction in electronic warfare.In terms of predicting data acquisition controller consumption,our model increases the prediction accuracy remarkably(MAE=0.278 6,MRE=0.120 4,MSE=0.331 4,RMSE=0.575 7,MAPE(%)=12.037 6 and R2=0.996 0)compared with BP neural network model(MAE=1.170 6,MRE=0.235 8,MSE=1.620 2,RMSE=1.272 9,MAPE(%)=23.577 5 and R2=0.980 3)and GM(1,1)model(MAE=1.856 3,MRE=0.241 9,MSE=4.3891,RMSE=2.095 0,MAPE(%)=24.188 0 and R2=0.946 6).According to the prediction results on combat IFF system consumption,similarly, our model has better prediction performance(MAE=0.065 6,MRE=0.062 8,MSE=0.023 0,RMSE=0.151 8,MAPE(%)=6.277 0 and R2=0.997 7)compared with BP neural network model(MAE=1.077 0,MRE=0.373 4,MSE=1.195 1,RMSE=1.093 2,MAPE(%)=37.342 8 and R2=0.883 1)and GM(1,1)model(MAE=1.269 6,MRE=0.434 0,MSE=1.761 6,RMSE=1.327 3,MAPE(%)=43.397 5 and R2=0.827 7).As for predicting number of faults of C2system in a vehicle-mounted computer,again,our model achieves better prediction accuracy (MAE=0.335 2,MRE=0.027 5,MSE=0.357 9,RMSE=0.598 3,MAPE(%)=2.749 0 and R2=0.998 0)compared with BP neural network model(MAE=2.229 8,MRE=0.104 4,MSE=5.257 8,RMSE=2.293 0,MAPE(%)=10.436 4 and R2=0.970 3)and GM(1,1)model(MAE=2.315 1,MRE=0.155 5,MSE=6.486 6,RMSE=2.546 9,MAPE(%)=15.548 5 and R2=0.963 4).Therefore,the proposed approach can predict maintenance material consumption for digital equipments in electronic warfare accurately.The fact indicates its good performance and efficiency.
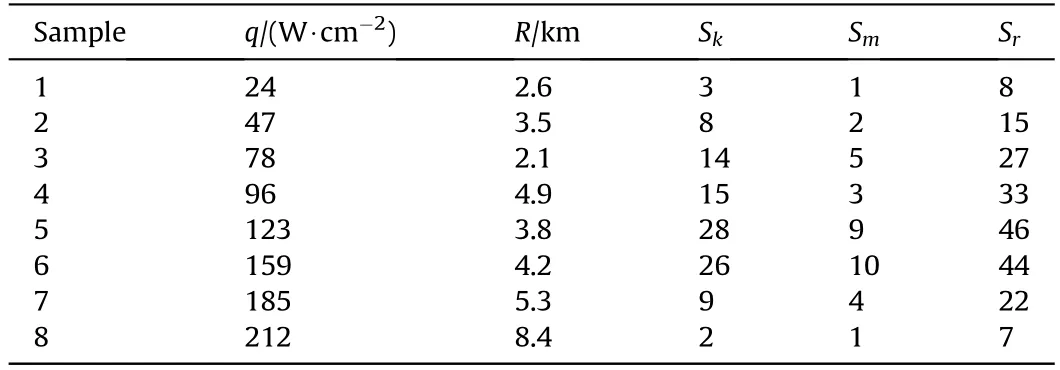
Table 4 Quantitative values of battle damage data.
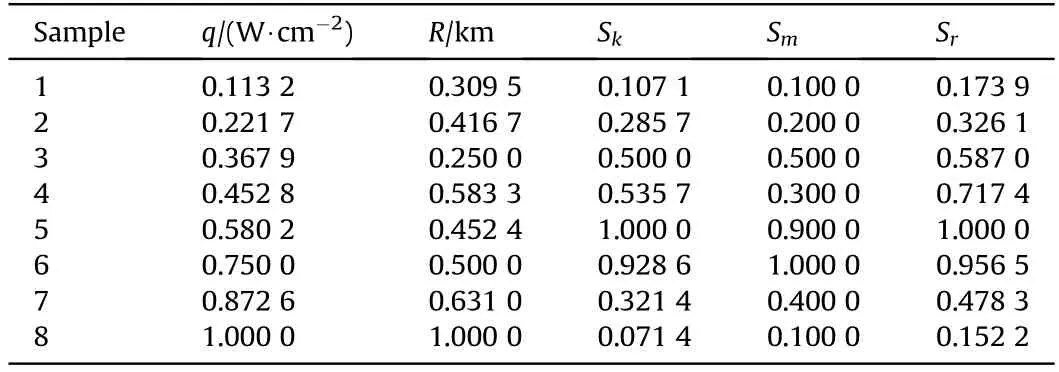
Table 5 Quantitative values of battle damage data after normalization.
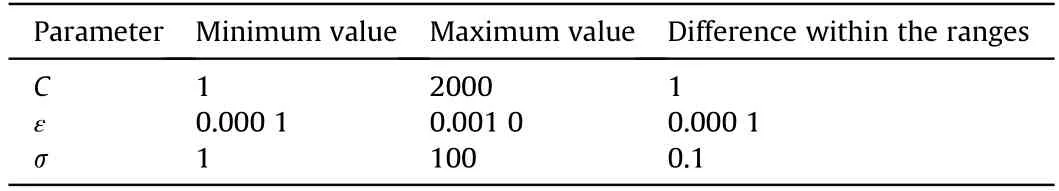
Table 6 Ranges of the parameters and difference within the ranges.
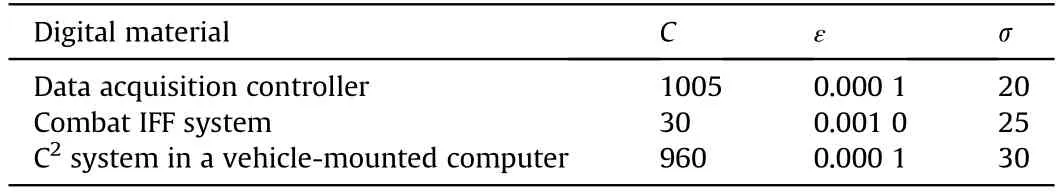
Table 7 Values of the optimal parameters of digital material consumption.
Furthermore,we give the significance analysis in this research by using χ2test to compare prediction accuracy for the ε-SVR model,BP neural network model and GM(1,1)model,since the situation we study meets the condition of χ2test[34,35].Let xibe predicted values and μibe real values for a sample.According to the principle of statistics,when the samples are tested several times,xigenerally obeys the normal distribution N(μi,σ2)[36,37].Thus,obeys the standard normal distribution N(0,1).Each test sample in this study is independent of each other,degree of freedom of this χ2test is equal to the number of samples.Therefore,we obtain
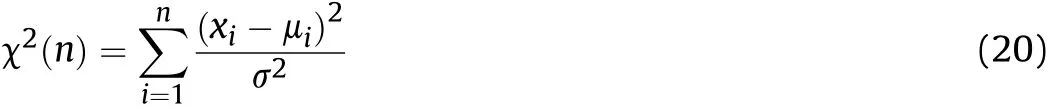
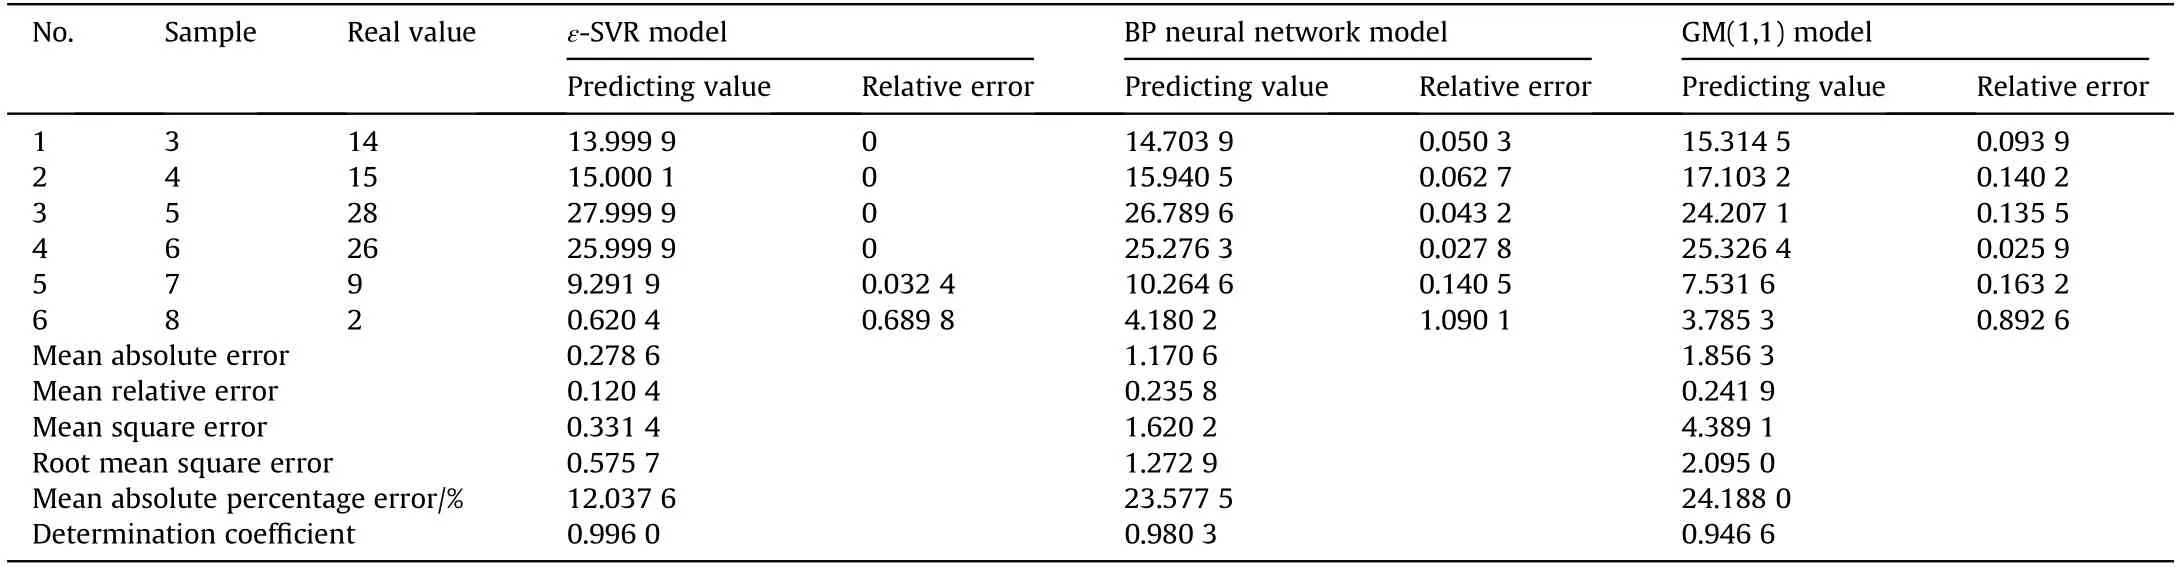
Table 8 Comparison of prediction results for data acquisition controller consumption by using different models.
Table 9 Comparison of prediction results for combat IFF system consumption by using different models.

Table 10 Comparison of prediction results for number of faults of C2 system in a vehicle-mounted computer by using different models.
where n=6 since the number of samples is 6 for a certain digital material.We set confidence levels as p=0.95 and p=0.90 respectively,and obtain=12.592,=10.645 in the statistical table by Zhuang and He[38].We set different variances σ2and can calculate the corresponding values of χ2by Eq.(20),as listed in Table 11.When χ2<χ2p(n),we think the sample data has passed the test and mark it as“√”,otherwise“×”.We find that,as for our model,it is possible to pass all tests even when σ2is small.How ever,as for BP neural network model and GM(1,1)model,when σ2gets smaller,they get more difficult to pass the test.Especially,when the confidence level is set smaller(from 0.95 to 0.90),the difficulty of passing the test gets bigger in GM(1,1)model.This fact means that our model has better performance and higher accuracy than BP neural network model and GM(1,1)model.
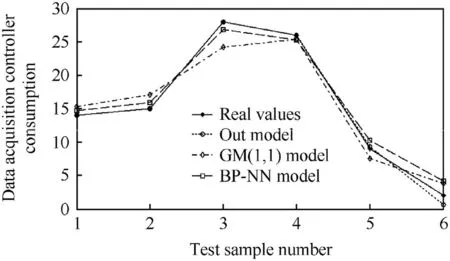
Fig.3.Comparison of prediction results and real values for data acquisition controller consumption.
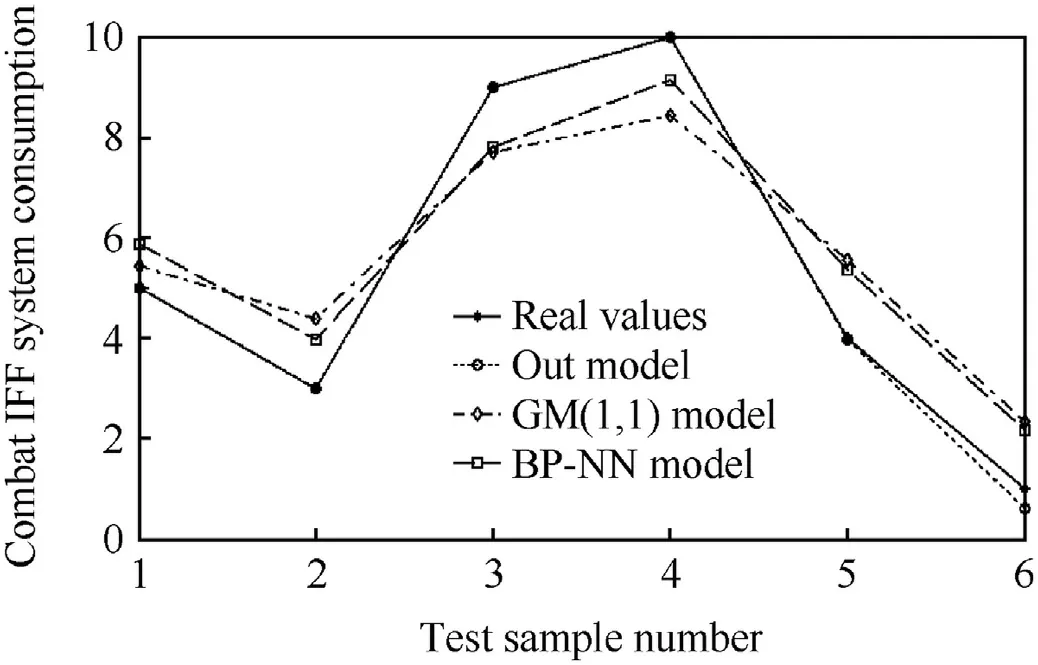
Fig.4.Comparison of prediction results and real values for combat IFF system consumption.
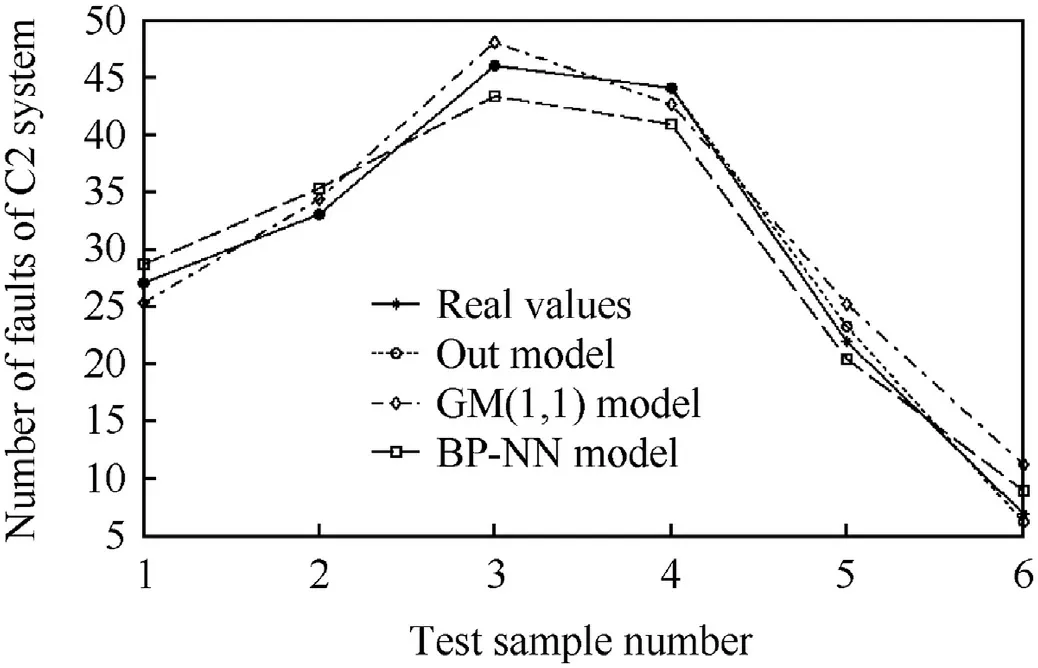
Fig.5.Comparison of prediction results and real values for number of faults of C2 system in a vehicle-mounted computer.
6.Conclusion and future work
With considerations to actual demands which are predicted from digital material consumption in electronic warfare,a ε-SVR based approach for estimating the“digital material consumption in warfare”is proposed.Firstly,important influencing factors of electronic damages of digital equipments are analyzed.The actual combat dataset is constructed and data preprocessing is performed.Secondly,the prediction model is constructed for model training.Finally,consumptions of 3 digital equipments in digital assault operations of ground force are predicted,which verifies feasibility of the proposed approach.Predicted results are compared with BP neural network model and GM(1,1)model,which prove the higher accuracy of the proposed approach.This approach has three characteristics:prediction under small sample size,fast and effective gaining of global optimal value,as well as high agreement between predicted results and actual values.
It is impossible that one model is useful for all applications.It should be noted that our model is aimed at predicting digital material consumption in electronic warfare.In view of the new development of military and technologies,especially artificial intelligence technology and computing technology,new requirements are put forward for MRP,which also puts forward higher requirements for wartime material consumption prediction.Thus,there are several possible extensions to this work.(1)Input of the model.More attentions should be paid to wartime influencing factors analysis to improve the consistency between the model and the real system.(2)Performance of the model.More attentions should be paid to the self-learning ability of parameter optimization algorithm to improve the intelligent level and efficiency of the model.Specifically,improvements can be made in the following two areas.On the one hand,although we have proved that RBF is appropriate to this study,how to use other kernel functions,such as polynomial function,to further carry out more comparative analysis,is an important work in the future.On the other hand,recent learning machine methods,especially extreme learning machine(ELM)algorithm[39,40],deserve our attention in the follow-up study.ELM has become a popular research topic due to its several unique characteristics:ease of use,fast learning speed,good generalization performance,suitable for almost all nonlinear activation functions and suitable for fully complex activation functions.Next step,we need to carry out more in-depth comparative experiments and draw principles from this field.(3)Application of the model.The proposed algorithm could be generalized to solve more general material consumption problems.Furthermore,a computer aided management system should be developed to perform somefunctions of an MRP system and provide visual illustrations for predicting digital material consumption.
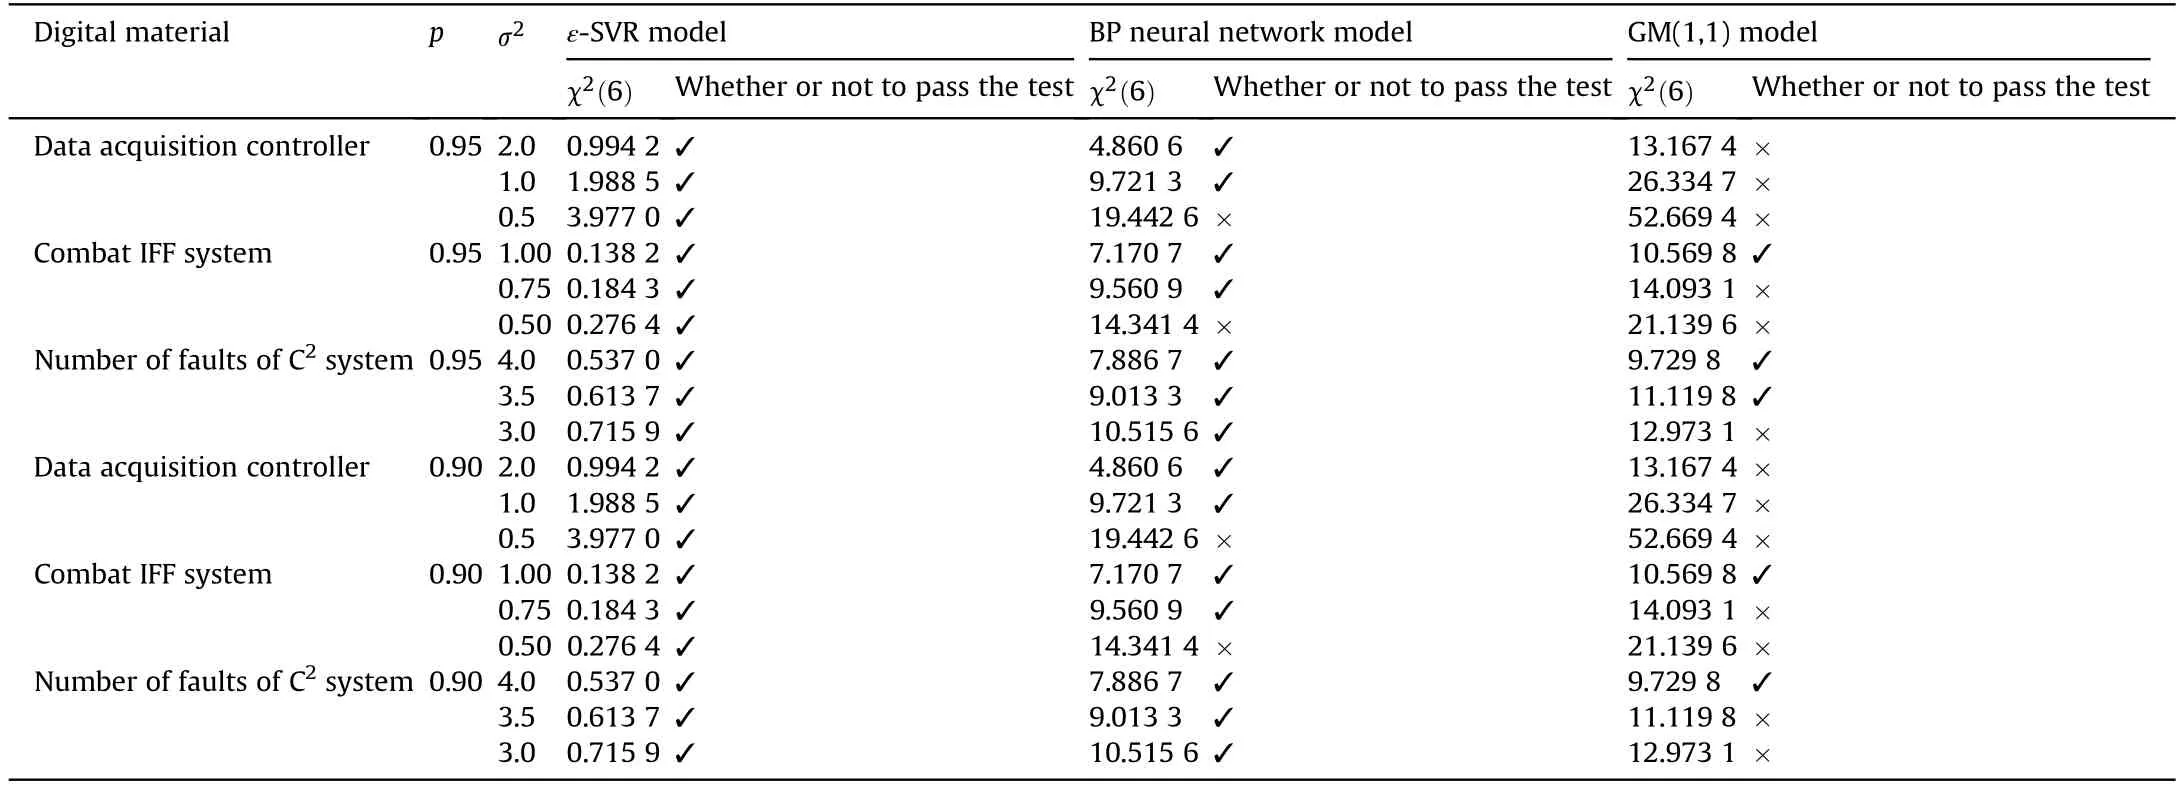
Table 11 Significance analysis by using χ2 test.
Acknowledgement
This research was funded by National Natural Science Foundation of China(grant number 61473311,70901075),Natural Science Foundation of Beijing Municipality(grant number 9142017),and military projects funded by the Chinese Army.

- Defence Technology的其它文章
- Initial alignment of compass based on genetic algorithm-particle swarm optimization
- The non-isothermal gravimetric method for study the thermal decomposition kinetic of HNBB and HNS explosives
- A non-myopic scheduling method of radar sensors for maneuvering target tracking and radiation control
- Research on construction of operation architecture based on complex network
- Estimating the metal acceleration ability of high explosives
- Shaped charge penetration into high-and ultrahigh-strength Steel-Fiber reactive powder concrete targets