The non-isothermal gravimetric method for study the thermal decomposition kinetic of HNBB and HNS explosives
Hamid Reza Pouretedal,Sajjad Damiri,Zahra Bighamian
Faculty of Applied Chemistry,Malek-ashtar University of Technology,Shahin-Shahr,Iran
Keywords:HNS HNBB Decomposition Thermal Kinetic
ABSTRACT The hexanitrostilben(HNS)is a thermally stable explosive that can be prepared from hexanitrobibenzyl(HNBB).Therefore,the investigation of thermal stability of HNBB can be important in the yield of preparation of HNS.The decomposition kinetic of HNBB and HNS are studied by non-isothermal gravimetric method.The TG/DTG curves in non-isothermal method are obtained in range of 25°C-400°C at heating rates of 3°C/min,5°C/min,8°C/min,10°C/min and 12°C/min.The data of weighttemperature are used for calculation of activation energy(E a)of thermal decomposition reactions by methods of Ozawa,Kissinger,Ozawa-Flynn-Wall(OFW)and Kissinger-Akahira-Sunose(KAS)as modelfree methods and Strink's equation as model-fitting method.The compensation effect is used for prediction of mechanism and determination of pre-exponential factor(ln A)of the decomposition reaction.A reduction 60 kj/mol for the average of activation energy of thermal decomposition reaction of HNBB is obtained versus HNS.This result shows the low er thermal stability of HNBB in comparison to HNS.The Avrami equation(A3/2)with function f(α)=3/2(1-α)[-ln(1-α)]1/3 indicates the predicted mechanism for thermal decomposition reaction both explosives.©2020 China Ordnance Society.Production and hosting by Elsevier B.V.on behalf of KeAi Communications Co.This is an open access article under the CC BY-NC-ND license(http://creativecommons.org/licenses/by-nc-nd/4.0/).
1.Introduction
The reaction of TNT with sodium hypochlorite under modified conditions is due to production of hexanitrobibenzyl(HNBB),which can be isolated and then further oxidized to 2,2′,4,4′,6,6′-Hexanitrostilbene(HNS)[1,2].The stability of HNBB such as thermal stability can be an important parameter in the yield of HNS production.The structures of HNS and HNBB are shown in Fig.1.
The difference between of structure of HNBB and HNS is the existence of-CH2-CH2-and-CH=CH-,respectively.This difference can be due to the different in thermal stability of mentioned energetic materials.
HNS is a famous and insensitive energetic material that is applied in many military systems.Its thermal stability is seen in temperatures of over 200°C[3,4].As mentioned,it is an insensitive explosive that will not inadvertently initiate when exposed to various environments,such as electrostatic discharge,drops,friction,or elevated temperature.HNS has a melting point at 316°C-318°C and decomposition of the material occurs very close to the melt[3,4].The activation energy for the solid state HNS-IV can be estimated from the slow heating rate data of DSC curves that is approximately 275 k J/mol.On the other hand,the activation energy of 164 k J/mol is obtained from high scan rate data of DSC curves for molten HNS-IV[5].The activation energy and frequency factor were obtained as 125 k J/mol and 6.3×10⁸s-1,respectively,from DSC data for thermolysis of HNSby Miner and Oxley[6].
The literature survey show ed that there is not any research on the study of thermal stability and the kinetic of the thermal decomposition of HNBB.In this research,we studied the kinetic of the thermal decomposition of HNBB and comparison with HNS explosive by non-isothermal gravimetric method.
The thermogravimetric analysis(TGA)method in among of thermal analysis methods can be used for study the kinetic of weight loss of a solid material in thermal decomposition reaction.For investigation of kinetic parameters,it is needed the obtaining of a parameter as conversion fraction,α,from TGA data(the variations of weight versus temperature and or time).In non-isothermal TGA method,the variations of weight are followed versus the temperature at a given constant heating rate.The conversion fraction of α for a weight loss process is defined as[7,8]:

Fig.1.The structures of HNS(A)and HNBB(B)explosives.

where w is the weight of the sample(gram)and the subscripts,i and f,respectively,refer to the values at the initial and the end of the weight loss process.The rate of weight loss as well as the rate of conversion fraction,dα/d t,for TGA experiments is expressed by Refs.[9,10]:

In Eq.(2),k(T)is rate constant and depends to the temperature.Also,the function of conversion,f(α),is depends to the mechanism of the thermal degradation process.The k(T)is often modeled successfully by the Arrhenius Eq[11,12].

In the Arrhenius equation,Ea,A,R and T is the activation energy(k J/mol),the preexponential factor(or the frequency factor,s-1),the gas constant(8.3136 J/(mol·K))and the absolute temperature(K),respectively.By using Eq.(2)and Eq.(3),the follow ing equations are obtained.

where β is the heating rate(°C/min)and g(α)is the integral function of the mechanism of the reaction.The non-isothermal method for determining kinetic parameters of a thermal decomposition reaction shows two advantages:i)need to a single sample and fewer data and ii)the kinetics of thermal decomposition can be calculated over an entire temperature range[13,14].
2.Experimental
The samples of HNS(HNS-II,m.p.305°C)and HNBB(m.p.286°C)were prepared by Chemical Laboratory.The size of particles was 1μm-20μm.The purity level(~100%)was confirmed by High Performance Liquid Chromatography(HPLC)for both samples.
The TG/DTG curves of HNS and HNBB samples were obtained by using a Mettler Toledo AG TGA/SDTA 851e.Non-isothermal thermogravimetic measurements were carried out from 25°Cto 450°C at heating rates of 3°C/min,5°C/min,8°C/min,10°C/min and 12°C/min.The initial weight of samples was 0.2 mg.Continuous recordings of sample temperature and weight loss and its first derivatives were taken.Alumina sample containers were used(70μL volume)with alumina powder as the reference material.Nitrogen atmosphere was applied during the analysis(flow rate of 50 m L/min).The precision of temperature was within±0.1°C.
3.Results and discussion
3.1.The TG/DTG curves
The TG and DTG curves of HNS and HNBB samples at heating rates of 3°C/min,5°C/min,8°C/min,10°C/min and 12°C/min are shown in Fig.2 and Fig.3,respectively.
The TG curves for both samples of HNS and HNBB in nonisothermal thermogravimetric method show a weight loss in one step in range 295°C-360°C.The Tp(temperature of peak in DTG curves)for HNS are observed at temperatures of 325.09°C,332.17°C,337.89°C,342.91°C and 346.98°C,respectively,at heating rates of 3°C/min,5°C/min,8°C/min,10°C/min and 12°C/min.While,the Tpvalues for DTG curves of HNBB at heating ratesof 3°C/min,5°C/min,8°C/min,10°C/min and 12°C/min are seen at temperatures of 316.42°C,324.91°C,333.78°C,336.41°C and 341.65°C,respectively.HNS is one of the prominent heat resistant explosives which can withstand temperature up to 325°C[3].The obtained results indicate that the thermal stability of HNBB is lower versus HNS.So that,the temperature of initial and peak in DTG curves show a nearly reduction 10°C for thermal decomposition reaction of HNBB.The weaker bond of C-C(single bond)versus C=C(double bond)can be due to thermal instability of HNBB in comparison to HNS.
Comparison of melting point temperatures of HNS and HNBB(305°C and 286°C,respectively)with initial temperatures of thermal decomposition in TG curves shows the melting of the samples and then the decomposition.Therefore,the liquid-phase thermolys was happened in thermal decomposition of HNS and HNBB[15,16].The HNS and HNBB can be initially undergoing an intramolecular and or intermolecular hydrogen abstraction reaction.The extent of each reaction is dependence to the steric factors.The steric factor are different for the studied samples because the groups of-CH2-CH2-(allylic hydrogen)and-CH=CH-(vinylic hydrogen)in HNBB and HNS,respectively.Thus,it is expected the difference between the kinetic parameters of thermal decomposition reactions of HNSand HNBB[15-17].
3.2.The kinetic of thermal decomposition
The DTG curves of HNS and HNBB samples at heating rates of 3°C/min,5°C/min,8°C/min,10°C/min and 12°C/min were shown in Figs.1(B)and Fig.2(B),respectively.The α values are calculated by Eq.(1)and the data of dα/d T are obtained based on the surface area of DTG curves.The α-T and dα/d T-T curves are presented in Fig.4 and Fig.5 for non-isothermal thermogravimetric data of HNS and HNBB samples.
The Strink's[18]Eq.(6)as a model-free method is used for calculation of Eavalues of thermal decomposition reaction of HNS and HNBB samples in range 0.1-0.9 of conversion fraction(α)with interval of 0.05.

The Eavalues are obtained from the straight line slope of ln(βi/T1.92α,i)vs.1/Tα.The Eavalues and regression coefficients of straight lines are given in Table 1.
As seen,the average of activation energy of thermal decomposition reaction of HNS explosive is higher than HNBB nearly 60 k J/mol.This result shows the lower thermal stability of HNBB explosive[1,2].
Among the other model-free methods[19-21],the Ozawa(Eq.(7)),Kissinger(Eq.(8))Ozaw a-Flynn-Wall(OFW,Eq.(9))and Kissinger-Akahira-Sunose (KAS,Eq.(10))are also used for calculation of the activation energies of decomposition reactions of HNS and HNBB samples based on DTG data.
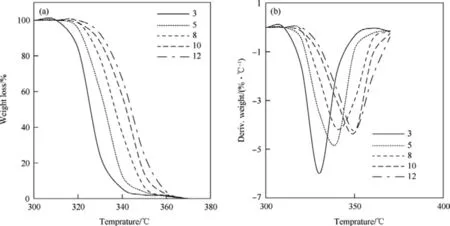
Fig.2.TG(A)and DTG(B)curves of HNS sample at heating rates of 3°C/min,5°C/min,8°C/min,10°C/min and 12°C/min.
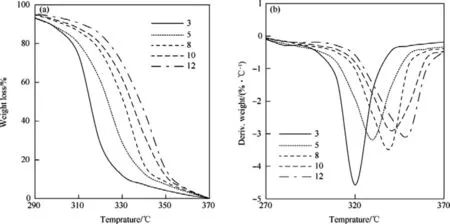
Fig.3.TG(A)and DTG(B)curves of HNBB sample at heating rates of 3°C/min,5°C/min,8°C/min,10°C/min and 12°C/min.
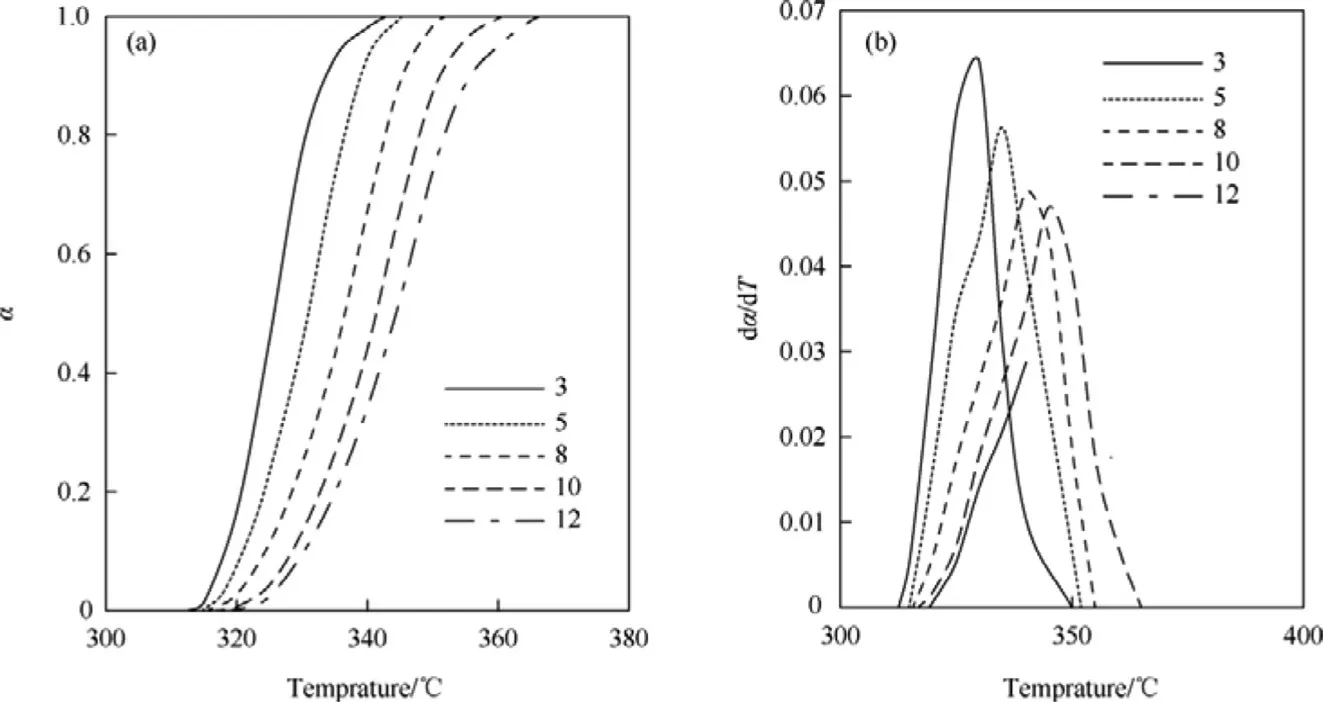
Fig.4.The curves of α-T(A)and dα/d T-T(B)for non-isothermal thermogravimetric data of HNS sample at heating rates of 3°C/min,5°C/min,8°C/min,10°C/min and 12°C/min.


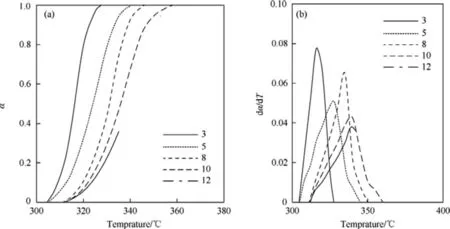
Fig.5.The curves of α-T(A)and dα/d T-T(B)for non-isothermal thermogravimetric data of HNBB sample at heating rates of 3°C/min,5°C/min,8°C/min,10°C/min and 12°C/min.
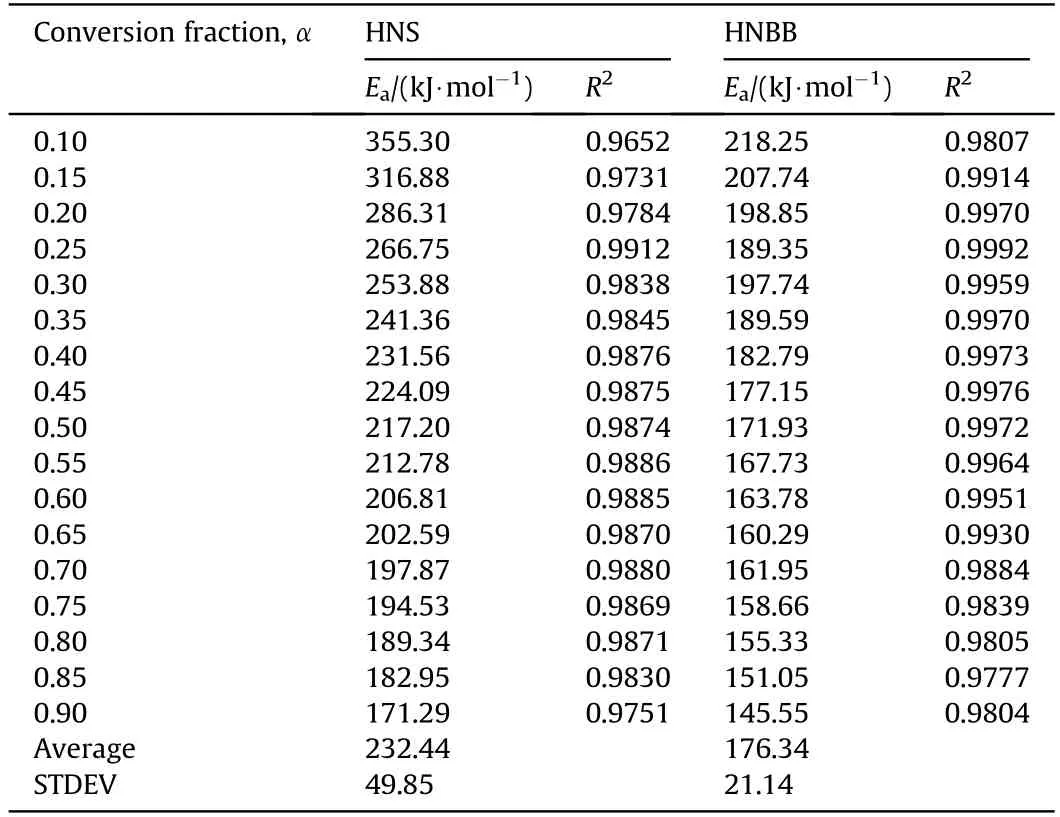
Table 1 The E a values and regression coefficients of straight lines in various conversion fractions in range 0.1-0.9 with interval of 0.05.

In these equations,the Tmor Tpare the maximum temperature or peak temperature of DTG curves.The activation energy(Ea)can be evaluated from the slope of the straight line which gives the best regression coefficients(R2)[22].The straight lines are obtained from ln(β)vs.1/Tp(Eq.(7)),ln(β/Tm2)vs.1/Tm(Eq.(8)),ln(β)vs.1/T(Eq.(9))and ln(β/vs.1/Tm(Eq.(10)).The obtained resultsusing methods of Ozawa,Kissinger,OFW and KASare collected in Table 2 that shows the higher thermal stability for HNS sample versus HNBB sample.

Table 2 The E a values(k J/mol)of HNS and HNBB samples by the model-free methods.
For prediction of the reaction model(f(α)and or g(α)),the compensation effect in the model-fitting method was used[23].As report in published papers,there are at least forty functions for prediction of a solid state reaction[23,24].But,according to the sigmoidal shapes of α-T curves(Figs.3(A)and Fig.4(B)),the Avrami equations in among of the reaction models are used(Table 3).In the initial,the theoretical z(α)values are calculated from f(α)and or g(α)functions using Eq.(11).Then,the experimental values of(dα/d t)α and Tα2are used for obtaining the values of experimental z(α)using Eq.(12)-Eq.(14).Finally,the curves of z(α)values(theoretical and experimental)versus α values are obtained and the theoretical z(α)curve are compared to experimental z(α)curves.A suitable model is selected for prediction of the mechanism of thermal decomposition reaction from fitting and matching of z(α)values of experimental and theoretical in the plots[25].The reaction models describe how solids transform from one phase(state of matter)to another at constant temperature[14,24].
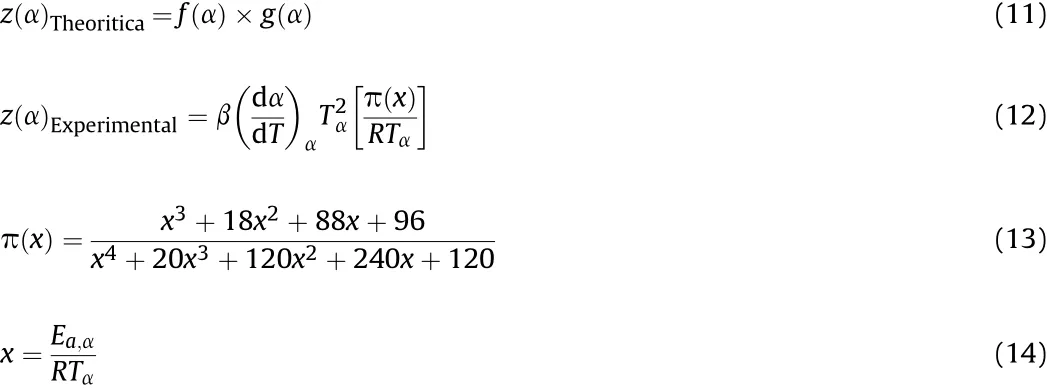

Table 3 The kinetic functions of the common models in solid-state reactions with respect to the sigmoidal shapes of α-T curves.
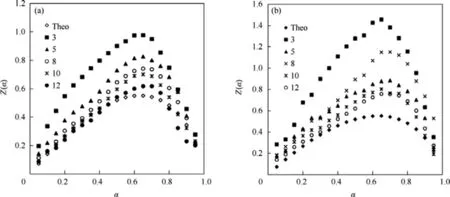
Fig.6.The plots of theoretical and experimental z(α)versus α at different heating rates(°C/min)for model A3/2,(A)HMS and(B)HNBB explosive.

Table 4 The statistical parameters of RSS and S2 values.
When this method was applied for all of the reaction models(Table 3),the mechanism function of Avrami-Erofeev A3/2,nucleation reaction mechanism,appeared as the best pattern because it demonstrated the minimum difference between experimental and theoretical data of z(α)values.Therefore,this model can be selected as the most probable model[26].The curves of z(α)values of theoretical and experimental versus α at different heating rates for model A3/2are presented in Fig.6.
For accurate prediction of the reaction model,the non-linear regression method[14]as the difference between theoretical and experimental z(α)values was calculated through the residual sum of square(RSS)and variance(S2)that should be minimum according to Eq.(15)and Eq.(16).

The S2and RSS values of model A3/2(g(α)=[-ln(1-α)]2/3)for thermal degradation reaction of HNS and HNBB samples are given in Table 4.
The kinetic triplet include A,Ea,and the reaction model are used for describe an overall process of the thermal transformation.Thus,in final,the pre-exponential factor(A)is determined after the chosen of mechanism function of A3/2(f(α)=3/2(1-α)[-ln(1-α)]1/3)and determination of the activation energy resulted from the model-free methods using Eq.(17)[27].The obtained values in different heating rates are given in Table 5.

where,Eois activation energy(k J/mol)of the model-free methods,αmaxand Tmax(K)are the maximum values of α and T in the α-T curves,and f' is derivative of f(α)function in αmax.
3.3.Thermal explosion temperature
For insure safe storage and process operation of an explosive,the thermal explosion temperature(Tb)is an essential parameter.This parameter is defined as the lowest temperature to which a specific charge might be heated without undergoing thermal runaway[28,29].In order to obtaining Tbvalue,the peak temperature(Tpo)corresponding to β→0 must be obtained from Eq.(18).The Tpiis the peak temperature in different heating rates of βiand b,c and d are coefficients[28,29].The Tpois obtained 301.89°C and 296.54°C for HNS and HNBB,respectively,by multiple linear regression method.Infinal,the critical temperature of thermal explosion(Tb)is calculated 317.08°Cand 314.74°C using Eq.(19).

4.Conclusions
The energetic material of HNBB can be used for preparation of HNS and therefore,the study of its thermal stability is important.The kinetic parameters of thermal decomposition of HNBB are extracted from TG/DTG data in non-isothermal method and compared to the results of thermal decomposition reaction of HNS.The peak temperatures in DTG curves and activation energy of thermal decomposition show ed the lower thermal stability of HNBB in comparison to HNS.Although,the predicted mechanism for thermal decomposition reaction both explosives is similar as nucleation reaction mechanism(Avrami-Erofeev,A3/2).

Table 5 The pre-exponential factor of thermal degradation reaction of explosives of HNSand HNBB.
Acknowledgement
We would like to thank the research committee of Malek-ashtar University of Technology(MUT)for supporting this work.
- Defence Technology的其它文章
- An approach for predicting digital material consumption in electronic warfare
- Initial alignment of compass based on genetic algorithm-particle swarm optimization
- A non-myopic scheduling method of radar sensors for maneuvering target tracking and radiation control
- Research on construction of operation architecture based on complex network
- Estimating the metal acceleration ability of high explosives
- Shaped charge penetration into high-and ultrahigh-strength Steel-Fiber reactive powder concrete targets

