Investigation on the spatial distribution characteristics of behindarmor debris formed by the perforation of EFP through steel target
Xin Wang,Jianwei Jiang,Shengjie Sun,Jianbing Men,Shuyou Wang
State Key Laboratory of Explosion Science and Technology,Beijing Institution of Technology,China
Keywords:Behind-armor debris EFP FEM-SPH adaptive conversion algorithm Spatial distribution
ABSTRACT The behind-armor debris(BAD)formed by the perforation of an EFP is the main damage factor for the secondary destruction to the behind-armor components.Aiming at investigating the BAD caused by EFP,flash X-ray radiography combined with an experimental witness plate test method was used,and the FEM-SPH adaptive conversion algorithm in LS-DYNA software was employed to model the perforation process.The simulation results of the debris cloud shape and number of debris were in good agreement with the flash X-ray radiographs and perforated holes on the witness plate,respectively.Three dimensional numerical simulations of EFP's penetration under various impact conditions were conducted.The results show that,an ellipsoidal debris cloud,with the major-to-minor axis radio(a/b)smaller than that caused by shaped charge jets,was formed behind the target.With the increase of target thickness(h)and decrease of impact velocity(v0)and obliquity(θ),the value of a/b decreases.The number of debris ejected from target is significantly higher than that from EFP.Based on the statistical analysis of the spatial distribution of the BAD,An engineering calculation model was established considering the influence of h,v0 and θ.The model can with reasonable accuracy predict the quantity and velocity distribution characteristics of BAD formed by EFP.©2020 China Ordnance Society.Production and hosting by Elsevier B.V.on behalf of KeAi Communications Co.This is an open access article under the CC BY-NC-ND license(http://creativecommons.org/licenses/by-nc-nd/4.0/).
1.Introduction
An explosively formed projectile(EFP)is a type of projectile with high speed and flight stability formed by an explosively driven liner[1,2].The damage caused by the EFP to the target is mainly as a result of the penetration effect,and also includes some secondary destructions like the behind-armor debris,shock wave and combustion.The behind-armor debris(BAD),composed of the residual EFP itself,eroded particles from the EFP,and particles ejected form target[3],is the main damage factor of the secondary destruction to the components after the target.Exploring the quantity and the mass distribution characteristics of BAD and constructing the distribution model are of great significance for the comprehensive evaluation of the EFP's damage capability.
Some researchers have employed experimental methods to study the BAD formed by EFP.Dawe[4]explored the BAD by witness plates,and the mitigation performance was specifically studied.Heine[5]and Mostert[6]used high-speed photography and flash X-ray radiography to capture the shape of the BAD,respectively.Kim[7]obtained the distribution characteristics of BAD by a two-stage light gas gun launching copper and tantalum EFP simulation projectiles,meanwhile a semi-empirical model of BAD was established.Some scholars hoped to investigate the forming mechanism of BAD from the perspective of numerical simulation.Dalzell[8]and Li[9]used smoothed particle hydrodynamics(SPH)algorithm with an added strain failure model to carry out the two and three dimensional simulation of BAD.Xing[10,11]used the theoretical and numerical simulation results of EFP's perpendicularly penetration,to get the f i t factor of Mott formula considering the variable cross-section characteristics of EFP.Although good fragment cloud shapes are obtained,the SPH algorithm has difficulty to adequately predict the fragment boundary envelope,which may result in incorrect estimation of the debris number by statistical methods.Therefore,there is still a need for further optimization of numerical simulation methods.
There is no direct model for describing the spatial distribution of BAD after EFP's penetration.How ever,in the study of space debris,shaped charge jets and long-rod projectiles' high-speed collision,scholars have established correlation models for statistical and spatial distribution based on theory,experiment and numerical simulation.The models that characterize the statistical law s of debris are the Grady[12,13]semi-empirical model based on energy conservation theory,the Yarin[14]theoretical model,the Held[15]model based on experimental data,and other statistical models[16-21].With respect to the spatial distribution models,Deyss[22]and Verolme[23]established the relationship between the debris velocity and scattering angle by tungsten and steel simulated projectiles' collision;Zukas[24]proposed the relationship between the mass and velocity of the debris with scattering angle by the rod projectile's perforation;Arnold[25]and Yao[26]proposed the relationship between the debris number with the scattering angle,and the variation of the scattering angle with the target thickness by shaped charge jet's perforation.Since EFP velocities are much lower than that of space debris and shaped charge jets and its shape is also different from that of long-rod projectiles,the above models are not suitable for the estimation of BAD characteristics resulting from EFP perforations through targets.It is necessary to systematically study the spatial distribution of debris behind the target.
In this investigation,the flash X-ray radiography combined with a witness plate methodology was adopted,and the FEM-SPH adaptive conversion algorithm of LS-DYNA software was employed to research the characteristics of BAD resulting from EFP projectile perforation.The results obtained,are reported in this paper.The numerical simulation results of the shape and quantity of the fragments behind the target were in good agreement with the results of the flash X-ray radiographs and the number of perforation holes on witness plate.A series of three-dimensional numerical simulations of EFP penetration of varies target thickness,impact velocity and obliquity were conducted.Based on a statistical analysis of the spatial distribution of the BAD,an engineering calculation model was established.The model can predict,with reasonable accuracy,the spatial distribution characteristics of the BAD formed from the perforation of an EFP through a target.
2.Experimental study of BAD
2.1.Test setup
In order to obtain the debris cloud shape,a test system,consisting of an EFP warhead,steel target,witness plate,flash X-ray system and support frame,was designed.The EFP warhead was fired in a downward shooting set-up as shown in Fig.1.The distance between the base of the warhead liner and the impact point at on the target was 180 mm,A witness plate was placed parallel to,and at a distance of 500 mm behind the target,to record the impacts from the particles of the debris cloud.The spatial distribution of BAD could be obtained from analysing the holes in the witness plate.
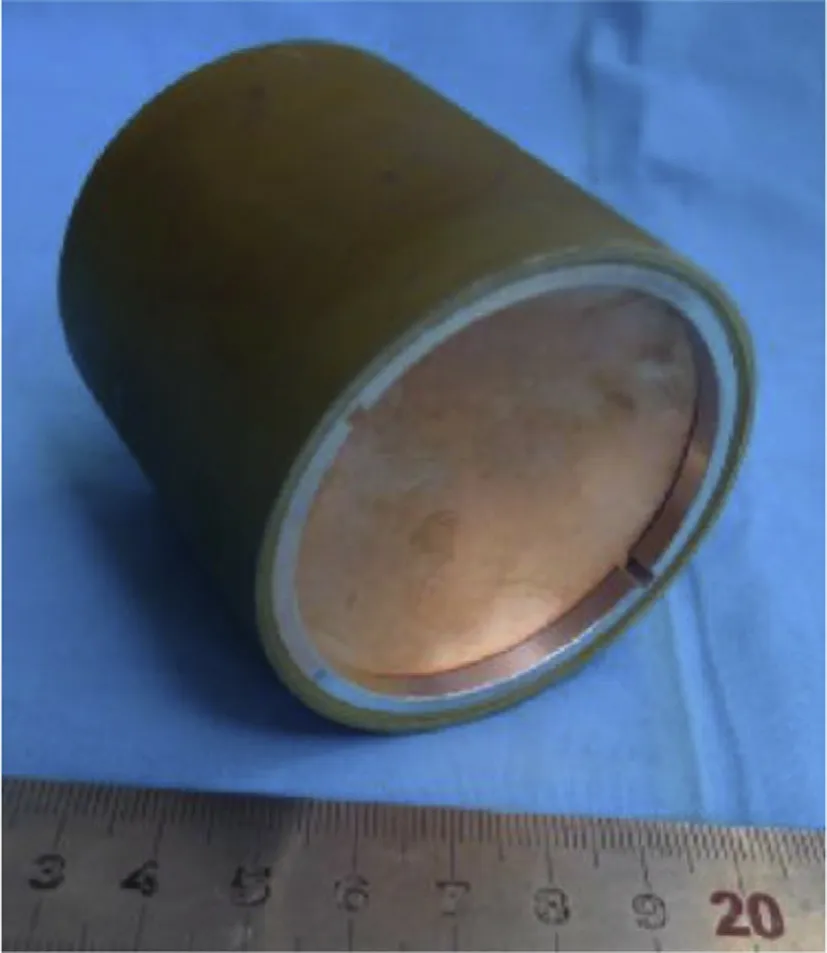
Fig.2.EFP warhead structure.
Flash X-ray radiography was used for the registration of the event.A pair of 4.5 k V Scandish flash X-ray tubes was positioned in slightly different directions through the line-of-fire in order to separate the pictures on the image plates,and initiated with different time delay in order to evaluate the velocity of the debris cloud.
The formed copper EFP had,170μs after initiation,velocity 2120 m/s,total length 41.5 mm and diameter 12.8 mm[27](Fig.3).The penetration capability in 45#steel(medium carbon steel,yield strength 506 MPa)target,at a distance of about 800 mm,was 45 mm.
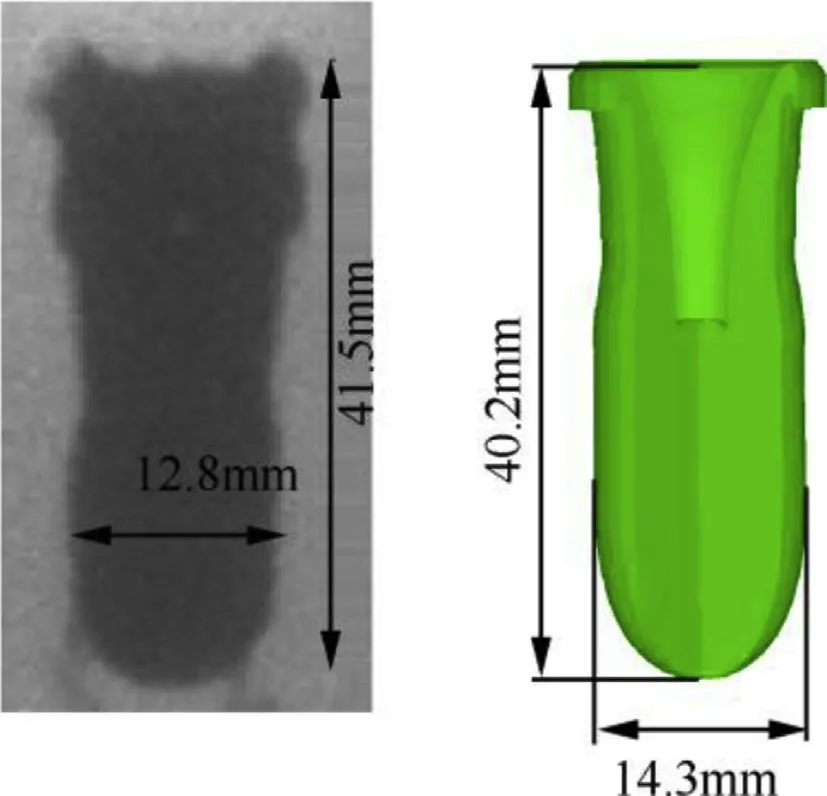
Fig.3.Radiograph of formed EFP.
The steel target,had the dimension 200 mm×200 mm,were made of 45#steel and the target thickness were 10 mm,20 mm,30 mm,and 40 mm,respectively.
The witness plates,with the thickness of 5 mm and lateral dimension 500 mm×500 mm,were made of aluminum alloy.The plate was divided into several concentric circles at equal intervals to count the majority number of fragments in different scattering angles.
2.2.Flash X-ray radiography results and analysis
As shown in Fig.4(a),the debris cloulds take the form of expanding ellipsoids.Fragments varies in size and with clear boundaries.At 80μs,the debris in head and tail of the cloud are larger,while those in the middle are relatively small.The debris cloud continues to expand and forms a truncated ellipsoid with a major-to-minor axis ratio of 1.68 at 95μs.In this condition,the expansion speed of the debris cloud in the head is1678 m/s,and the radial expansion speed 525 m/s.Fig.4(b)indicates that,it is quite clear that fracture has already occurred in the bulge envelope at 60 μs when EFP penetrates the target with thickness of 30 mm.Since the EFP hits the target with a certain angle,the target bulge exhibits slight asymmetry.While at 100μs,the bulge cracked to several large fragments.
2.3.Perforation results and analysis of witness plates
Fig.5 depicts the photographs of the debris perforation on the witness plates after the EFP perforated the steel targets.The distribution characteristics of the debris can be obtained by the number of perforations in certain partition on the plate.
For the case where EFP penetrated steel target with thickness of 10mm(Fig.5(d)),the hole at the center of the witness plate is a circular,indicating penetration by the remnant of the initial EFP.The other holes are small and the number is only about 20,the fragments in each area were separately count ed,shown in Fig.6.A normal distribution of the number of fragments around the center of the plates is assumed.
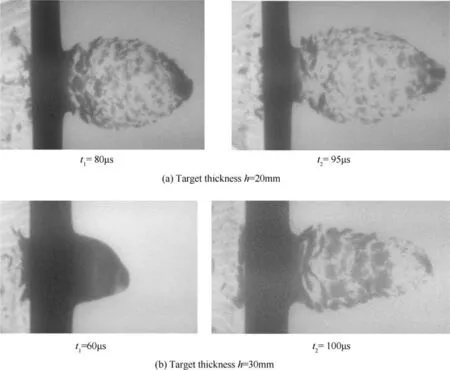
Fig.4.Radiographs of debris cloud at typical time of different target thickness.
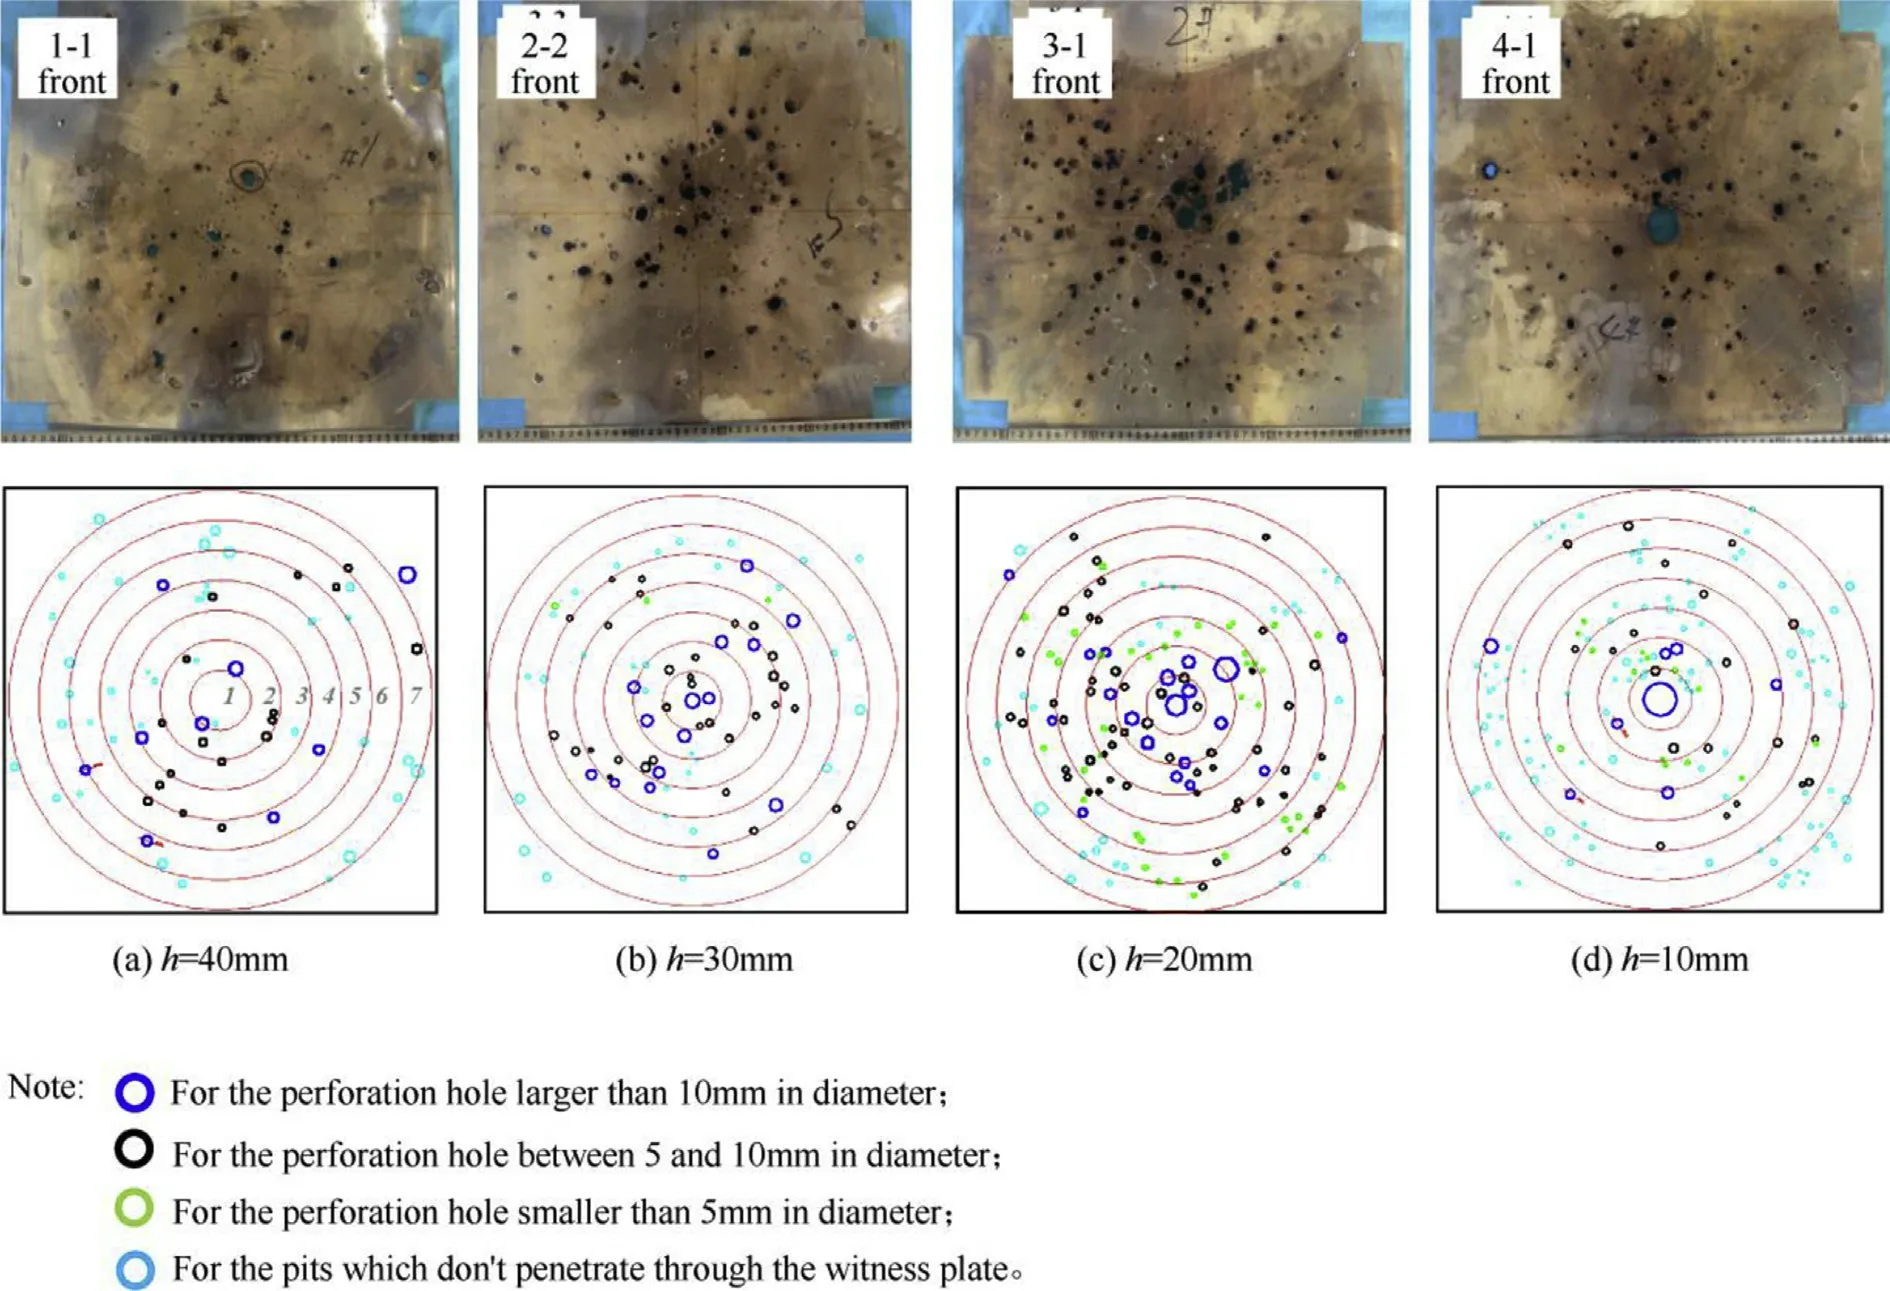
Fig.5.Photographs of the holes on witness plate.
The accurate analysis of the debris mass distribution is challenged by the fact that it is difficult to capture extremely fine fragments.At the same time,the experimental results can only observe the final debris cloud shape.For the spatial distribution of the mass and kinetic energy of the fragment after the target,a more detailed analysis by numerical simulation is needed.indiating limited penetration ability.
It can be seen from Figs.5(b)and(c),when the target thickness increases to 20 mm and 30 mm,the remaining EFP's perforation converted from a large single circular hole to several large perforations at the center of witness plate.At a target thickness of 40 mm(Fig.5(a)),the smaller holes were formed on the witness plate,with only a few fragments penetrating through the plate.Under this condition,the most part of the EFP has been eroded,and the debris peeling from the target penetrates the witness plate.
According to the divided circular(part 1 to 7)on witness plate,
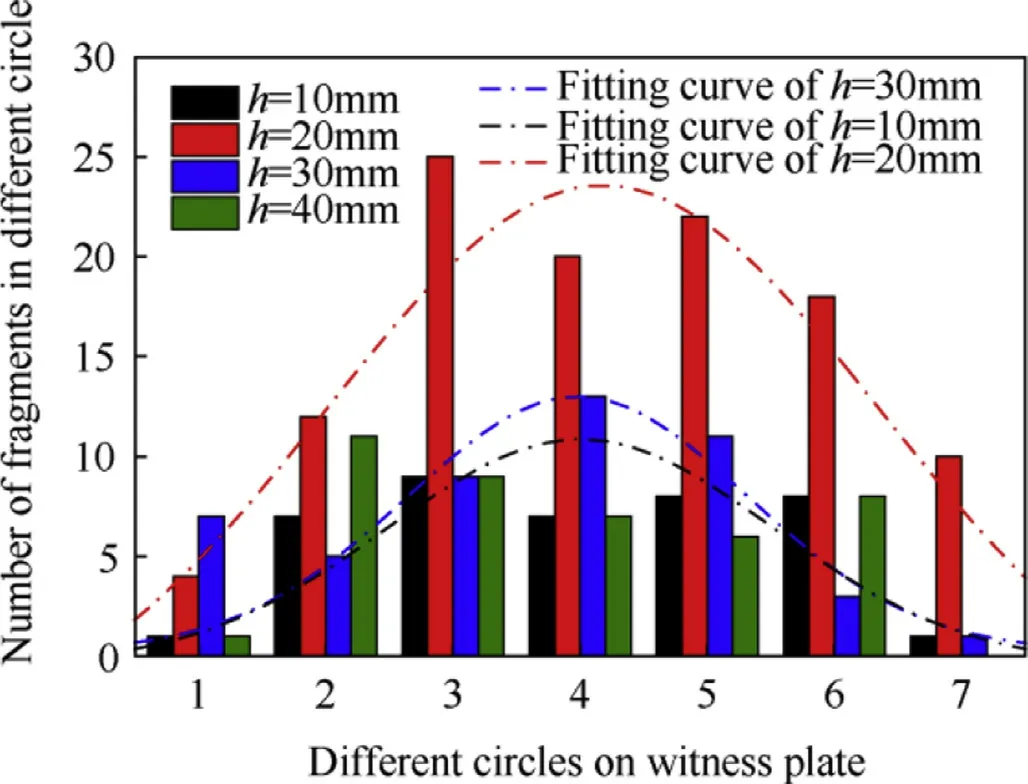
Fig.6.Histogram of number of holes in different circles.
3.Simulation model of the interaction between the EFP and the target
3.1.Simulation algorithm
The aforementioned experimental results have shown that the process of EFP striking the target,accompanied by the dramatic deformation of the projectile,is the result of erosion and fracture behavior of material subjected to shock loading.For the numerical simulation of the impact fracture problem under high strain,the finite element method(FEM)has obvious advantages.It has the capability to use the erosion algorithm to remove the large deformed elements and simulate the fracture phenomenon,but it may inevitably cause distorted deformation of the other elements,which is different from the actual deformation.The SPH[28]algorithm,as a meshless method,has been widely praised for avoiding grid distortion,especially for the simulation of hypervelocity particle clouds.How ever,the fracture mechanism of SPH is independent of the failure algorithm,the fragments boundary is not clear,moreover the calculation time is long compared with finite element method.
The FEM-SPH algorithm[29]is a coupling algorithm of finite element and particle adaptive transformation.It is characterized by finite element method when the material is not destroyed,and converted into particles when the material has failed,thus avoiding the deletion of the grids,distorted deformation and energy imbalance.Some scholars have applied this algorithm to the penetration problem of long-rod projectiles[30].The results from attempts to apply the FEM-SPH adaptive conversion algorithm in LS-DYNA[31]to simulate the BAD cloud of the EFP and to characterize the formation of the larger fragments behind the target,are shown in this paper.
3.2.Discrete model
Fig.7 is a physical model of the interaction of EFP with target.Where,EFP strikes the target at a velocity of v0and angle of θ,and the target thickness is h.The discrete model shown in Fig.8 was designed in LS-DYNA software.Taking into account the symmetry,a half-model was established to simplify the calculation.An optimal mesh size had to be determined,that assures convergence of the numerical scheme in parallel with reasonable time consumption.Thus,the target plate was divided into two parts,namely middle(part A)and surrounding(part B)parts,which were set to different grid scales.The EFP and part A of the target had a grid size of 0.4mm,and part B of target had a grid size of 1 mm.Part A used FEM-SPH adaptive conversion algorithm to achieve conversion between finite element and particle,the EFP and surrounding targets used Lagrange algorithm.
3.3.Material model
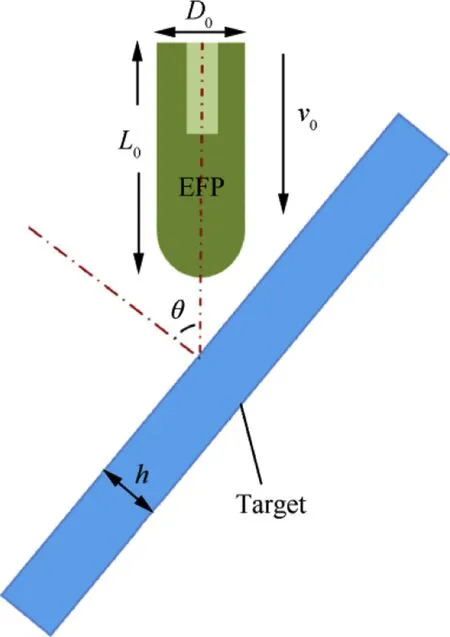
Fig.7.The physical model.
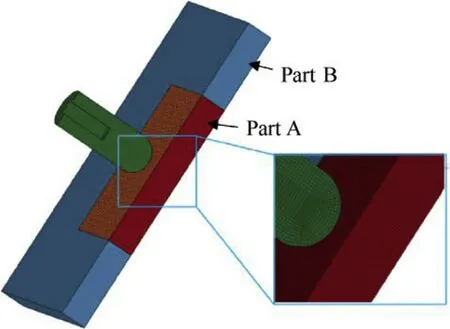
Fig.8.The discrete model.
The materials involved in the interaction between EFP and target studied in this paper are:high-conductivity oxygen-free copper(OFHC),and 45#steel.EFP and target were both modeled by the Johnson-Cook(J-C)material model,which is suitable to model the strength behavior of materials subjected to large strains,high strain rates and high temperatures of penetration progress.The model defines the yield stress σyas[32]:

Where A,B,C,n and m are the material parameters determined by experiments.is the equivalent plastic strain,is the dimensionless effective strain rate at a reference strain rate1s-1.T*is the homologous temperature which is defined by T*=(T-Troom)/(Tmelt-Troom),where T is the current temperature,Troomand Tmeltare the room and melting temperatures,respectively.
In order to describe the material under high strain rate(>105s-1),the equation of state(EOS)of Gruneisen is adopted,in which the pressure p for the compressed material is expressed as

where c0is the intercept of the vs-vpcurve,in which vsand vpdenote the shock-velocity and particle-velocity,respectively.S1、S2、S3are the dimensionless slope coefficients of the vs-vpcurve.М=ρ/ρ0-1 represents the volumetric strain,in which ρ and ρ0denote the current and initial densities.E represents internal energy,γ0is the dimensionless Gruneisen coefficient and a0is the first-order volume correction to γ0.
The EFP penetration process,coupling with the compression of the projectile and the target,the shear damage caused by materials' relative mobility,and tensile failure during expansion,is an extremely complicated process with various failure modes.The key to the success of numerical simulation is to select the failure model which can accurately describe the fracture of materials under complex stress field.Johnson-Cook failure criterion[33],accounts for temperature,strain rate and strain path in addition to the triaxiality of the stress state,is based on damage accumulation.The mold is widely used in the simulation of EFP's penetration,and can better predict the fracture behavior of EFP and target[34].In this paper,this damage model is adopted to characterize the fracture of the EFP and target.The basic form is:

Where D is the damage to a material element,Δεyis the increment of accumulated plastic strain,and εfis the accumulated plastic strain to failure under the current conditions of stress triaxiality,strain rate and temperature.Failure occurs when D=1,and in the finite element simulations,eroded elements are convert to SPH particles that have reached the critical damage.The failure strain εfis defined as

where σ*is the dimensionless pressure-stress ratio defined as σ*=is the mean stress normalized by the effective stressis the effective stress,Among them,D1,D2and D3,obtained by least squares nonlinear fitting,characterize the influence of stress triaxiality on material failure plastic strain εf,D4and D5characterize the dimensionless effective strain rate and homologous temperature on εf.The details of parameters of EFP and target material are listed in Table 1.
3.4.Model validation
Fig.9 is the debris cloud shape when EFP penetrates 20 mm and 30 mm thick targets at specific times,obtained from simulation and flash X-ray radiographs respectively.It was found that the shape of the fragmentation cloud is basically the same with the experiment,while the number of fragments is slightly smaller than that in experiment.Table 2 is a comparison table of the radio of major to minor axis of the ellipsoid cloud,the simulation result was in good agreement with flash X-ray radiographs when EFP penetrating target with thickness of 20 mm,how ever,the difference between simulation and test result of EFP penetrating target with thethickness of 30 mm was 8%.As explained before,EFP impacting the target with thickness of 30 mm at a certain angle,the debris cloud was asymmetrical,which affected the subsequent expansion of fragment cloud.The axis/radial expansion velocity of the debris cloud is1665 m/sand 517 m/s respectively when the EFP penetrates target with thickness of 20 mm.The error was within 2%compared with experimental results.

Table 2 Comparison of the radio of major to minor axis of the debris cloud.
The equal scale simulation model,including witness plate,target and EFP compared with experiment,to calculate the perforation on witness plate was really time-consuming.Here we use an indirect method to count the number of perforable fragments.According to the divided circular areas(part 1-7)on witness plate,the fragments larger than 10 J(the minimum kinetic energy capable of debris penetrating the aluminum plate with thickness of 5 mm)in each area were separately counted in simulation results,and the comparison between simulation and experiments results was listed in Fig.10.
It can be seen that under the three conditions of the target thickness,the number and distribution of perforable fragments obtain by simulation and test were in good agreement,the accuracy of the simulation algorithm could be determined.
In order to obtain the characteristic of BAD under more general conditions,the BAD cloud caused by EFP penetrating target of thickness h at different velocity v0and angle θ were simulated,The range of each influence factors was 10-30 mm,1200-2500 m/s,0°-60°,respectively.The effect of BAD was investigated by comparing the debris cloud shape and the number of particles.

Table 1 Parameters of each material[32,34,35].
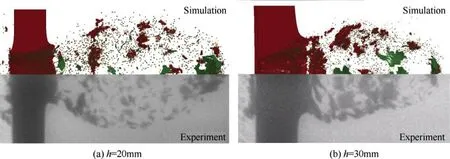
Fig.9.The comparison of debris clouds by simulation and flash X-ray radiographs.
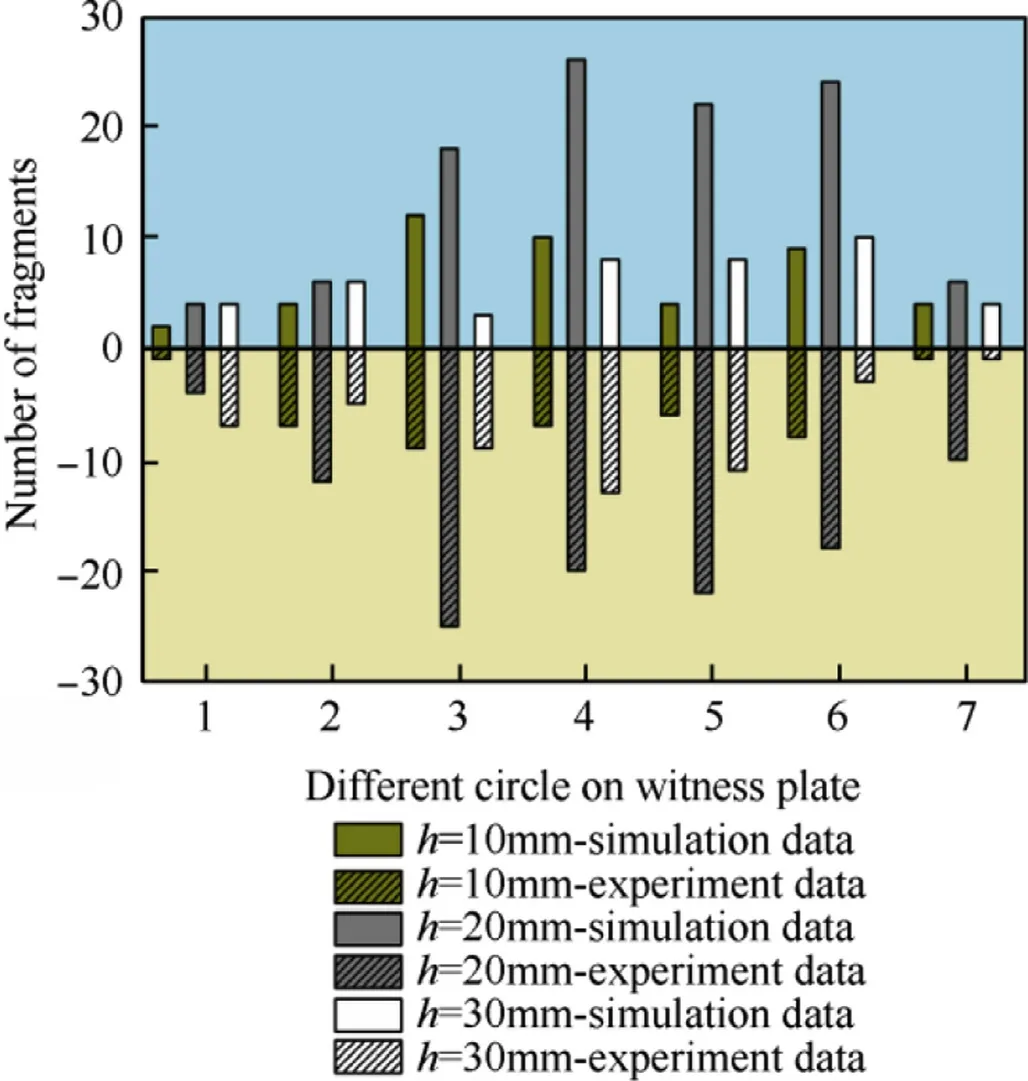
Fig.10.The Comparison of holes in different circles in simulation and experiment results.
4.EFP penetration process analysis and energy distribution determination
4.1.EFP penetration process analysis
We select a process of EFP vertically penetration target of 10 mm thickness at 2100 m/s for illustration.Fig.11 reveals the EFP and target deformation at different times.
At the beginning of the penetration,the background grids of the particles(the brow n portion in the figure)were pre-generated in the middle of the target.As the penetration process proceeds,the failed Lagrange elements will be replaced by particles for subsequent calculation.Under the impact of EFP,45#steel target first expanded to form a bulge,and then the radial and axial cracks emerged,which caused the forming of small fragments or debris.Eroded parts from EFP were also involved in the entire debris cloud.In Fig.12 the velocity distribution image is shown Lagrange elements and SPH particles at 30μs,respectively.
4.2.Energy distribution during penetration
By extracting the energy information of the EFP(Fig.13(a)),the energy conversion process of the EFP penetrating the target plate is clarified.
After hitting the target,the kinetic energy(KEEFP)of the EFP is continuously decreasing,and the incoming compression wave causes the EFP internal energy(IEEFP)to rise.After 60μs,the energy changes tend to be stable,and the EFP stops energy exchange with target,keeping the remaining shape and continuing to fly.
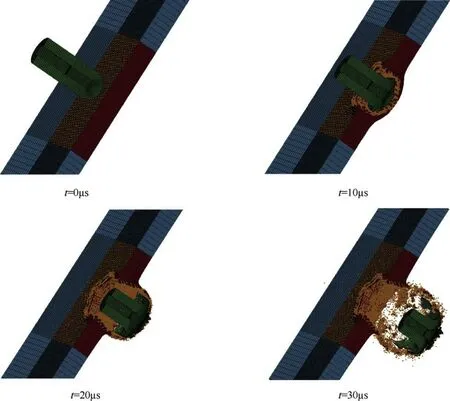
Fig.11.The typical time image of EFP penetrate 10 mm target at normal incidence.
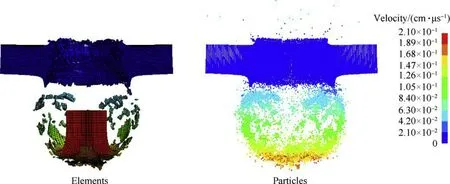
Fig.12.The velocity distribution image of elements and particles(30μs)
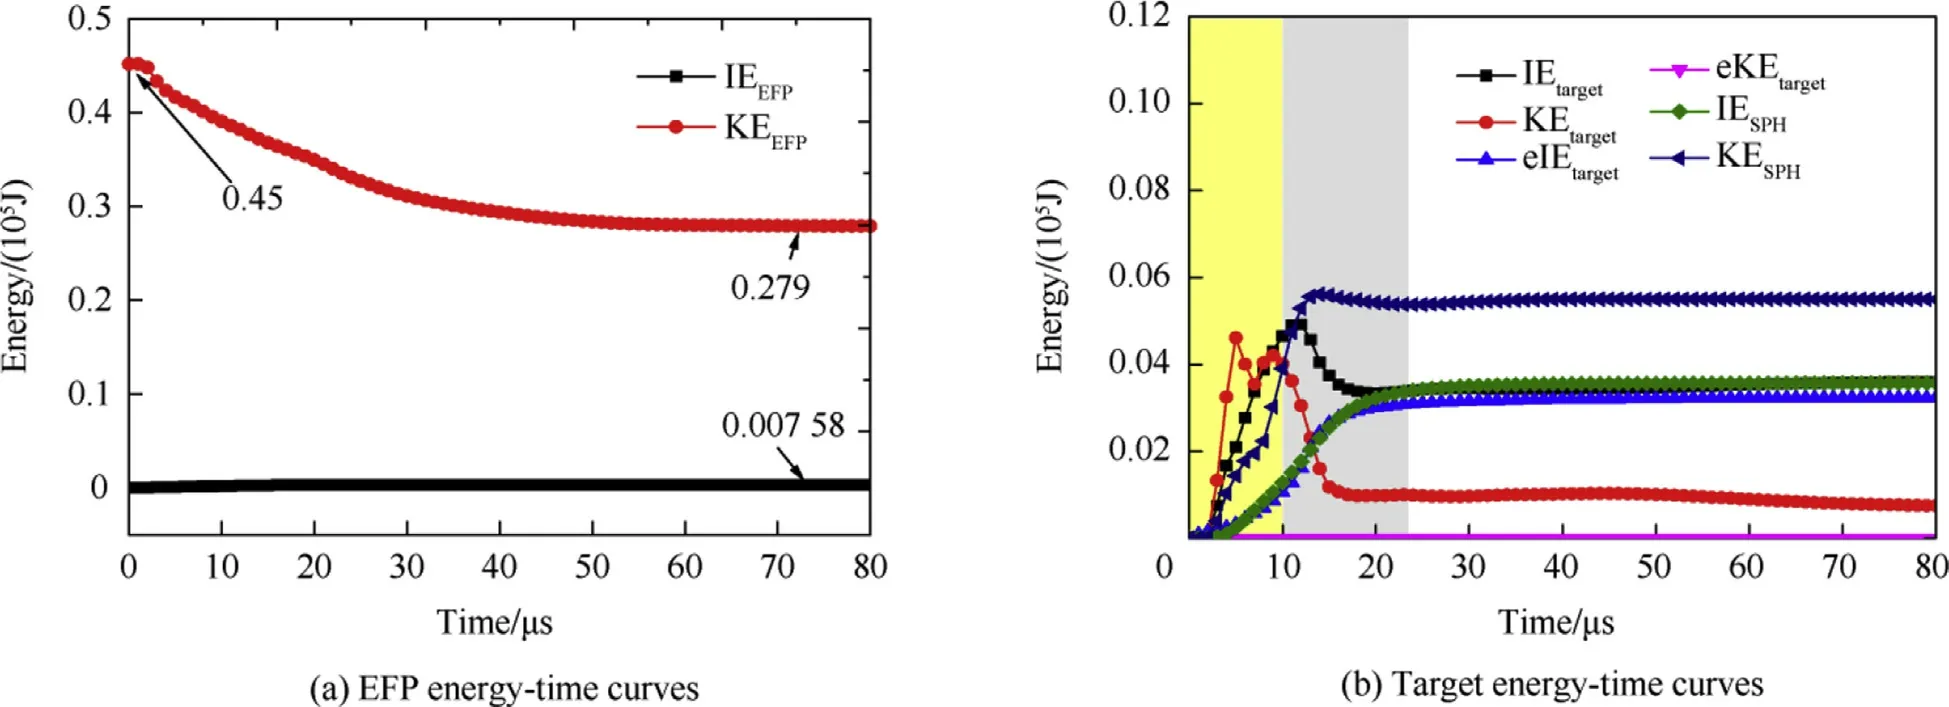
Fig.13.Energy-time curves.
Similarly,Fig.13(b)shows the energy information of the extracted target Lagrange elements and SPH particles.It was the initial time of EFP penetration before the stress wave reaches the target boundary,which means the time before 10μs in the simulation.The internal energy of the target(IEtarget)began to decline because of the non-reflection boundary.Information exchange between the element and the particle occurs during 0-25μs.The internal energy(IESPH)and kinetic energy(KESPH)of the SPH particle show an increasing trend with the input of information such as the velocity of the failed elements,so the kinetic energy of eroded target elements(eIEtarget)remains unchanged due to this transformation.After 25μs,the energy exchange was basically completed,and the subsequent was the fragment cloud expansion process.
Table 3 shows the energy statistics for each part at 80μs.It can be seen that the eroded Lagrange elements has a partial internal energy loss(eIEtarget),and its kinetic energy(eKEtarget)is zero,that is,the kinetic energy of all converted into SPH particles.If we ignore the stress wave energy loss from the boundary,the total energy of this algorithm is 16.19 KJ,and the energy loss of EFP is 16.34 KJ.The difference between these two is 0.92%,which basically satisfies the energy conservation.

Table 3 Summary of energies(×105 J)(t=80μs)
After clarifying the formation process of BAD,we performed the comparative analysis of different conditions to find the spatial distribution characteristic of BAD.The number of fragments was counted by the method described in Ref.[36].The method is to traversal the search of elements one by one,when there is common node of two elements,the two elements are in the same fragment.After comparing all the elements,information about the number of fragments can be obtained.The fragments of the EFP and target are counted separately,the total number of BAD is the sum of the fragments formed by these two parts.The program's specific implementation method is described in the Appendix.
5.Effect analysis of BAD
Considering the scattering characteristics of the complete debris cloud,we take the emission angle α to measure the spatial position of each fragment.Fig.14 is a schematic diagram of the definition of α.The Cartesian coordinates are established with the impact point as the origin coordinates O,the movement direction of the EFP as Xaxis,and the plane perpendicular to the X-axis as YOZ plane.The scattering angle βfis the angle between connection line of fragment position with point O and the X-axis.The βfof fragment which in the positive direction of the Y-axis is defined as βf(-),in the negative direction is defined as βf(+),and the maximum emission angle of the fragment is α.When EFP vertically impact the target,by geometric relationship,βf(-)=βf(+)=0.5α.
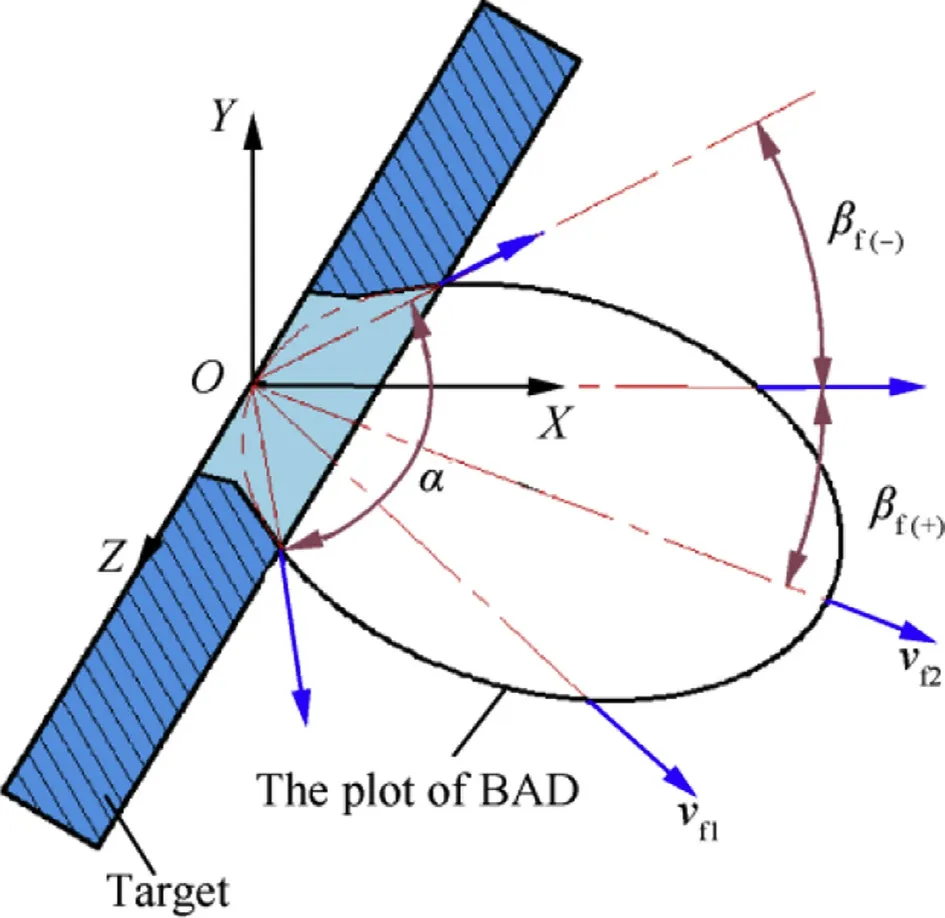
Fig.14.Schematic diagram of evaluation parameters in BAD.
Other evaluation parameters are defined as follows:
v50:ballistic limit velocity at normal incidence,as defined from
De Marre[37],m/s;
vr:residual velocity of EFP,m/s;
vf:particle velocity of BAD,m/s;
mr:residual mass of EFP,g;
Er:residual kinetic energy of EFP,J;
N:the number of fragments of BAD;
vf(βf):the average fragment velocity in the unit scattering angle βf;
N(βf):cumulative number of fragments within the scattering angle βf;
Efrag(βf):cumulative fragment kinetic energy within the scattering angle βf.
With reference to the above parameters,the spatial distribution is quantified.
5.1.The influence of target thickness h
There are a variety of objectives in the battle field.EFP may be applied to attack different targets or different positions on one target.This objectives discrepancy is simplified to the diversity of the target thickness,for the study of distribution characteristics of BAD.The simulation results of the EFP impacting the target of 10 mm,15 mm,20 mm,25 mm,and 30 mm perpendicularly at velocity of 2100 m/s were analyzed.Fig.15 shows the debris cloud shape of EFP through typical thickness target.At 80μs,the fragment cloud is stable,the ratios of major-to-minor axis of the ellipsoid are between 1.5 and 1.6 and decreases with increasing of target thickness.When h=10 mm,the debris is small and the residual mass of the EFP is large.As the thickness of the target increases,the average fragment size increases,and the number of fragments increases accordingly.When the target thickness h is increased to 25-30 mm,the number of debris is correspondingly reduced.The eroded part of EFP broke during the penetration process and becomes part of the BAD(see Fig.16).
5.1.1.The number of fragments
The total number of debris first increases and then decreases with the increase of target thickness.This distribution law can be explained from the perspective of energy balance.The debris is the result of the combination of the target and EFP fragmentation.When EFP penetrates target with 10 mm thickness,the stress wave has not been reflected multiple times in the target,while the EFP has completed the penetration process,so the target has not been fully cracked and shredded[9],resulting in fewer fragments;When the EFP penetrates target with 30 mm thickness,although the complex wave system plays a sufficient role in the spallation of target,the remaining energy of the EFP reaching the target back is too small to drive the fragment away from the target;In the penetration of the 20 mm target,the stress wave propagation matches well with the EFP residual energy,not only the steel target is fully spalled,but also the fragment can fly away from the steel target.
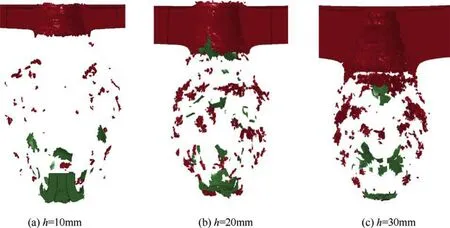
Fig.15.The formed BAD by EFP vertically penetrating target with different thickness(t=80μs).
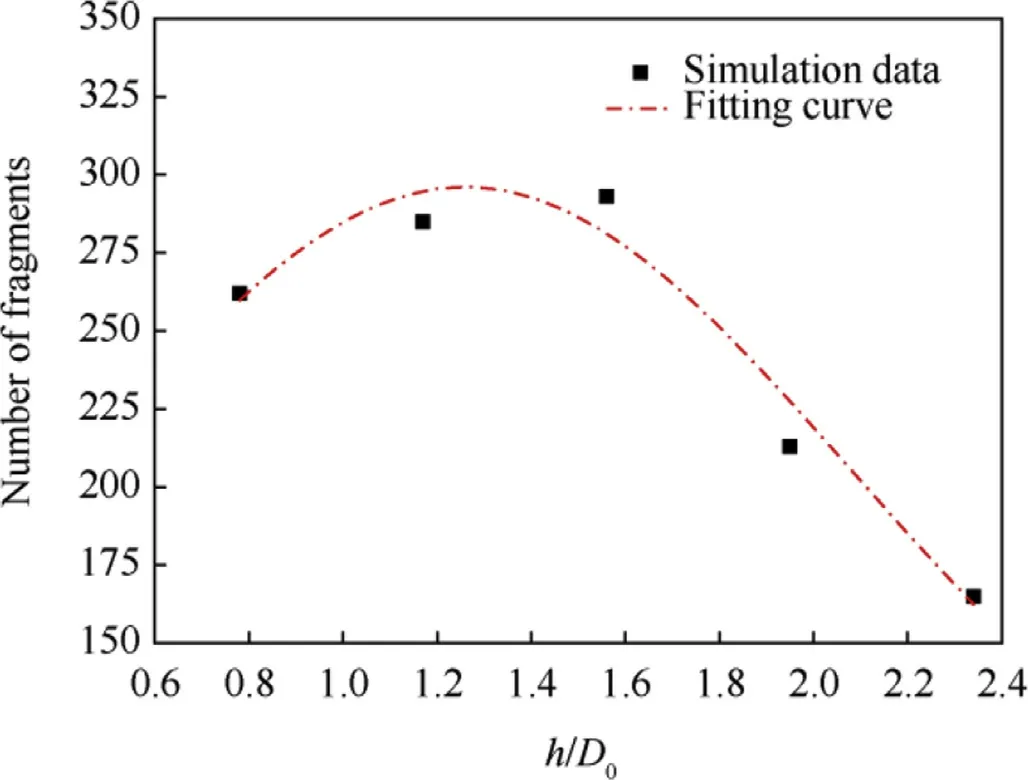
Fig.16.The change curve of the total number of debris with h/D0.
The relationship between the number of fragments and the target thickness can be represented by an exponential distribution,which is fitted by least square method,shown in Eq.(5).And the error between the calculation result and the real result is less than 8.7%.

How ever,the number of fragments behind the target is not the only criterion for the damage power behind the target.In order to comprehensively evaluate the power of the BAD,the mass,velocity and kinetic energy of the fragments need to be considered.
5.1.2.Mass distribution
The mass statistics of the debris is the premise of the kinetic energy evaluation.The fragments mass were sorted in ascending order,and the relationship of debris mass and quantity distribution was obtained,shown in Fig.17.
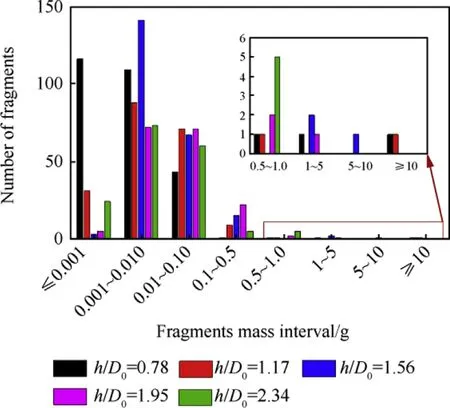
Fig.17.Fragment mass-quantity distribution histogram.
When h=10 mm(h/D0=0.78),the fragments mass is concentrated below 0.01 g,accounting for 82.72%of the total number.As the target thickness increases,fragments mass bteween 0.1-1g starts to increase,and the mass below 0.001g decrease.When h=30 mm(h/D0=2.34),the residual energy of the EFP behind the target is insufficient to form sufficient fragment surface,so the number of debris is reduced.Compared with that of h=25 mm(h/D0=1.95),the large mass fragment formed by target of 30 mm thickness is reduced,while the small mass fragment slightly increases.It should be noted that the mass of the fragments included in the statistics here contains the mass of the residual EFP.
5.1.3.Velocity and kinetic energy distribution
In order to visually compare the mass,velocity and kinetic energy of fragments,the mass-kinetic energy distribution of all the fragments was plotted on a single graph,shown in Fig.18,was established.The horizontal axis is the mass of fragments and the vertical axis kinetic energy,the oblique dotted line is half of the square value of the velocity of the fragment.It is found that the fragmentation velocity is in the range of 9-2100 m/s.The number of fragments between 447 and 2100 m/s is about 70%-80%of the total number.The range of kinetic energy of fragments is from a few joules to several kilojoules,mostly in the range of 0.1-100 J.Fragment kinetic energies larger than 100 Jappear in the fragments with mass larger than 0.1 g,and the velocity higher than 447 m/s.The fragments with velocity lower than 44.7 m/s can't pose a threat to the personnel(an energy criterion for personnel incapacitation of 80 Jis assumed).It can be concluded that for the improvement of the kinetic energy of the BAD,it is required to have both large mass and high residual velocity.
5.1.4.Spatial distribution
The above results were based on the statistics analyze of fragments distribution.Those are two-dimensional information which don't involve three-dimensional spatial relationships.The spatial distribution of the fragments mainly analyzes the three dimensional distribution characteristic of the mass and quantity of the fragments,so as to clarify the damage probability at different positions behind the target.
Fig.19 is the change curve of number of fragments with the emission angle α,which generally exhibits a normal distribution characteristic,that is,the number of debris first increasing and then decreasing when α change from 0°to 100°.When α is small,due to the large residual EFP,the fragments number is relatively small.
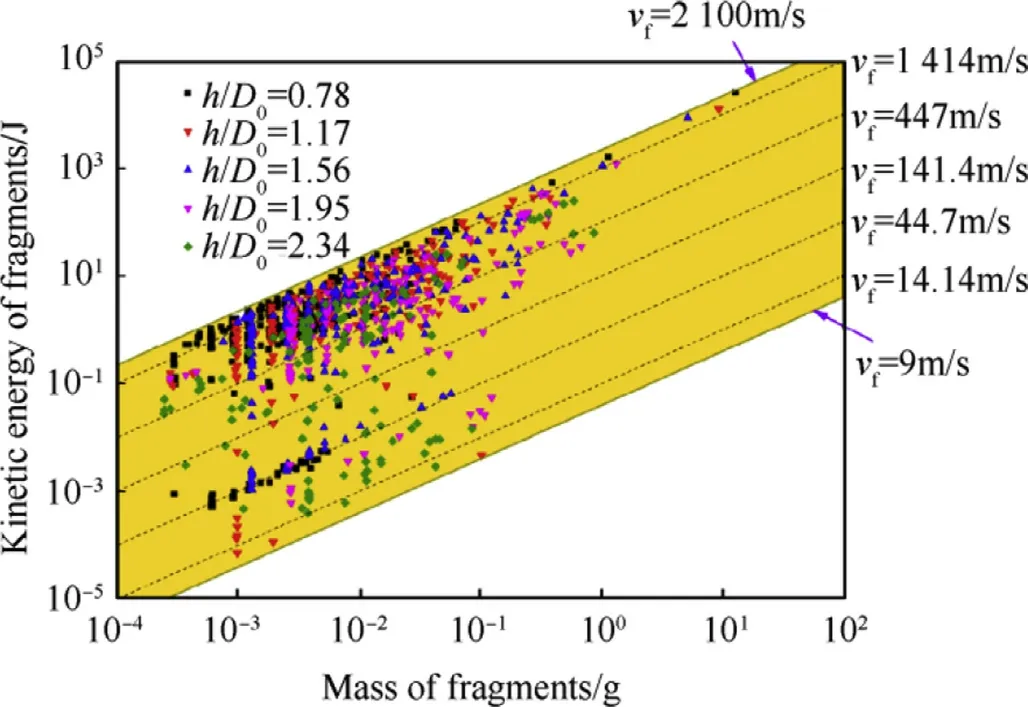
Fig.18.The Mass-kinetic energy scatter plot of debris.
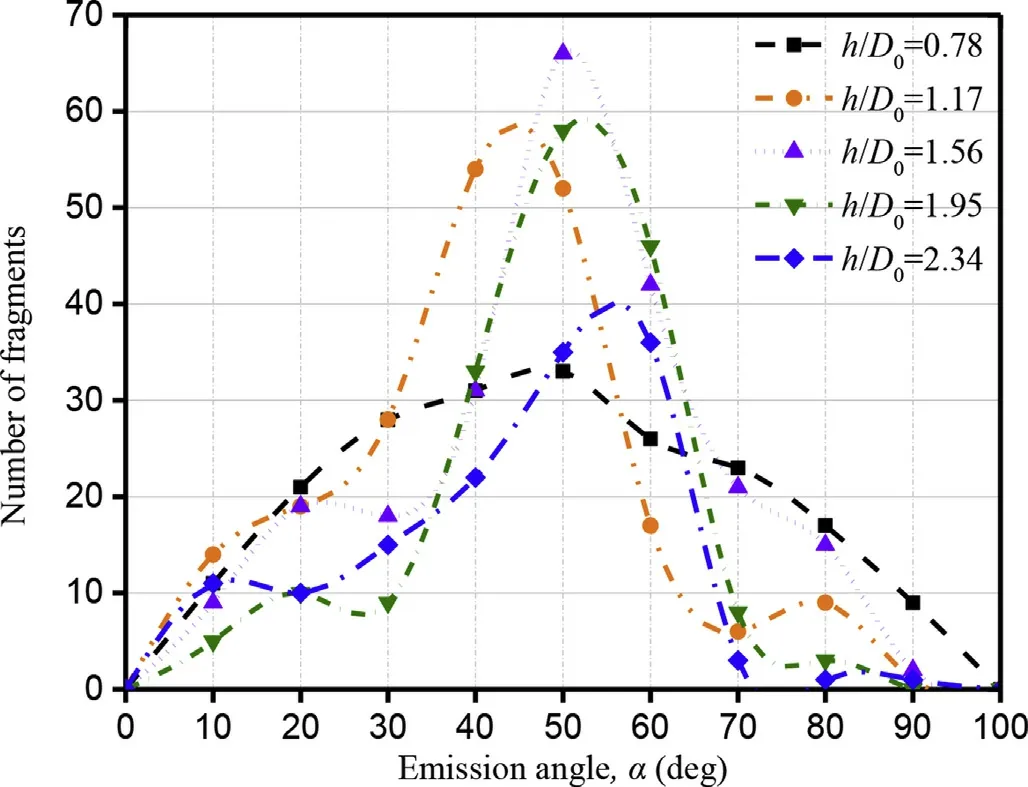
Fig.19.The change curve of fragments number with the α
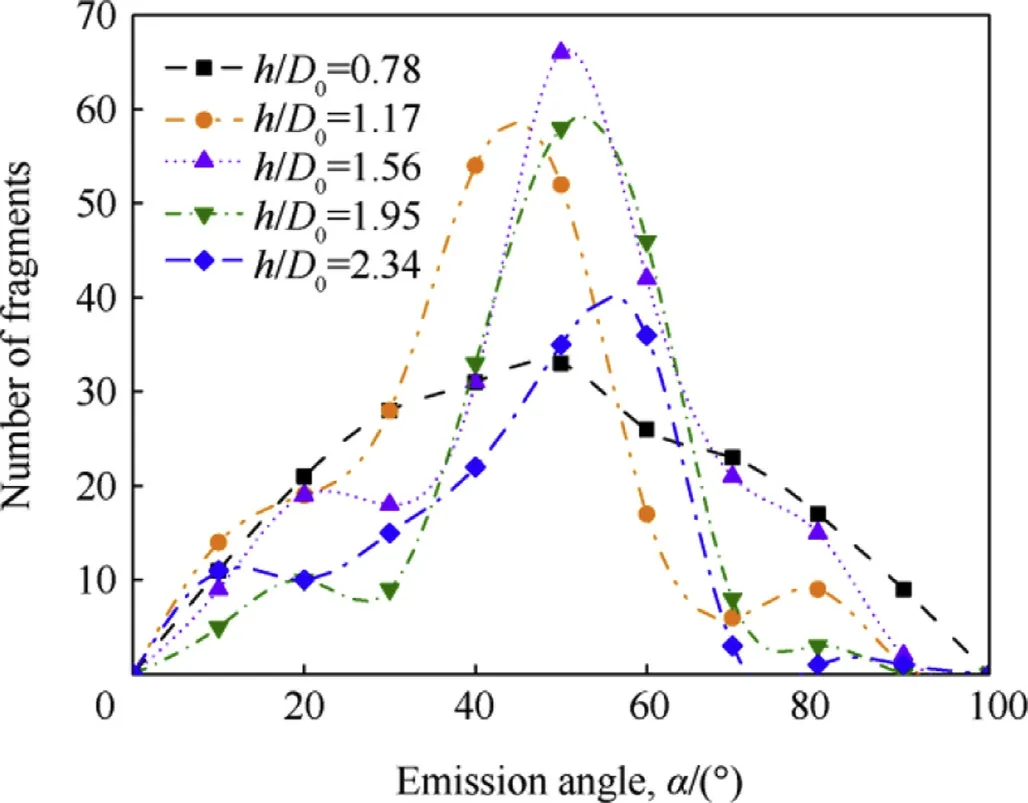
Fig.20.The change curve of debris velocity with α
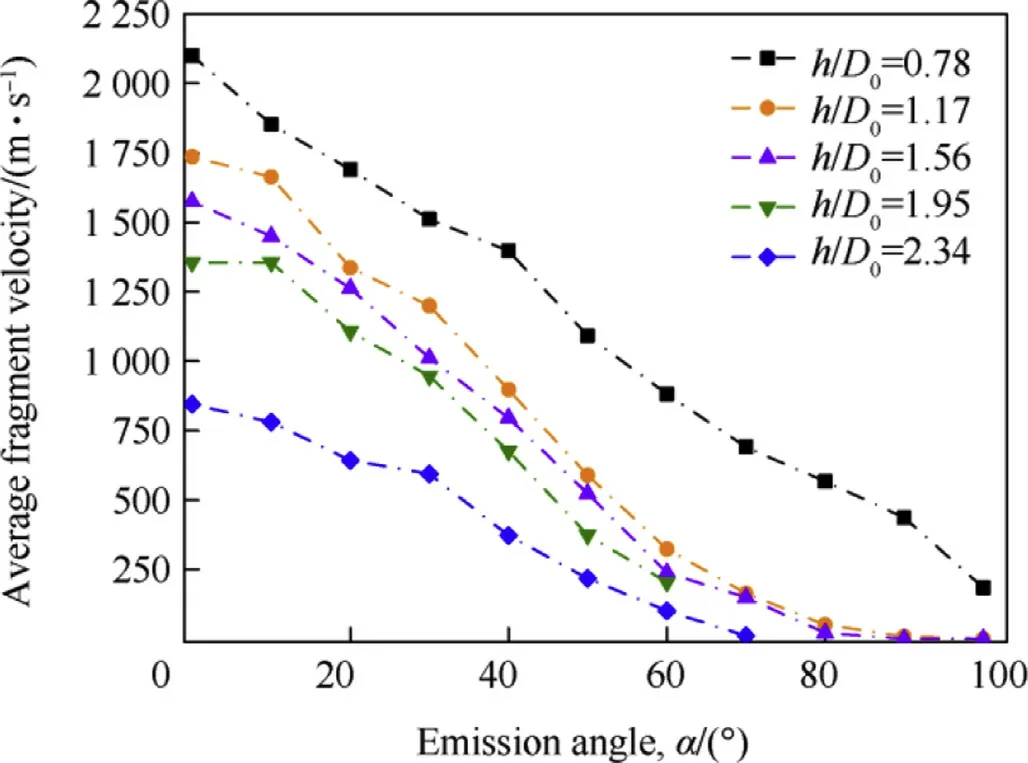
Fig.21.The change curve of debris kinetic energy with α
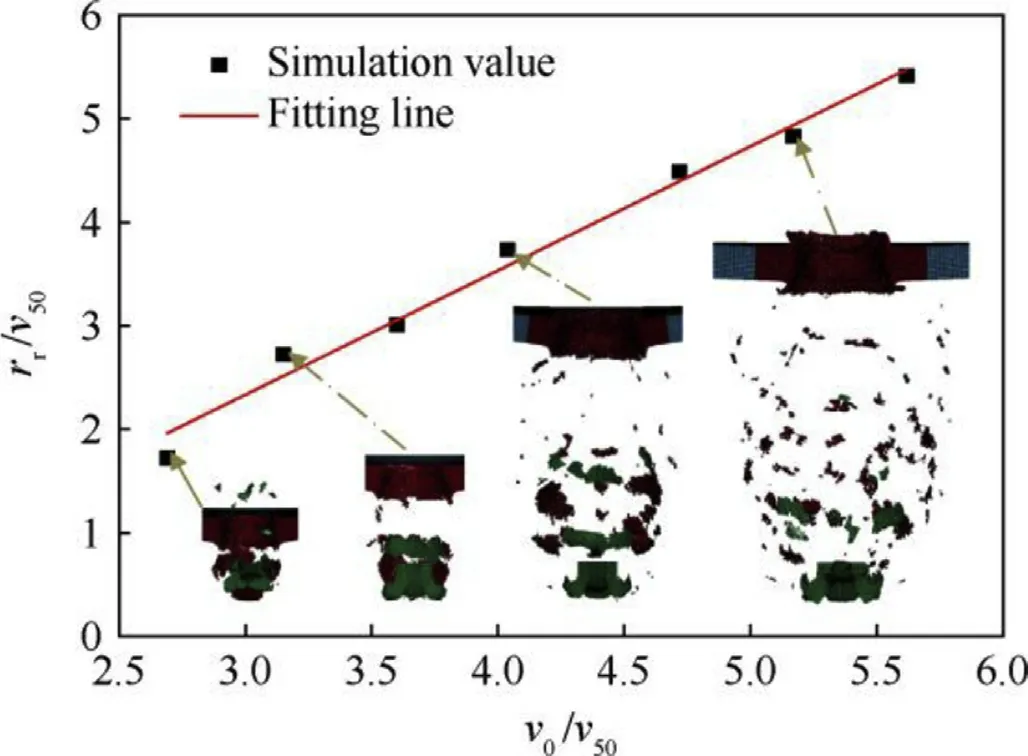
Fig.22.The relationship between nomalized impact velocity and residual velocity of EFP.
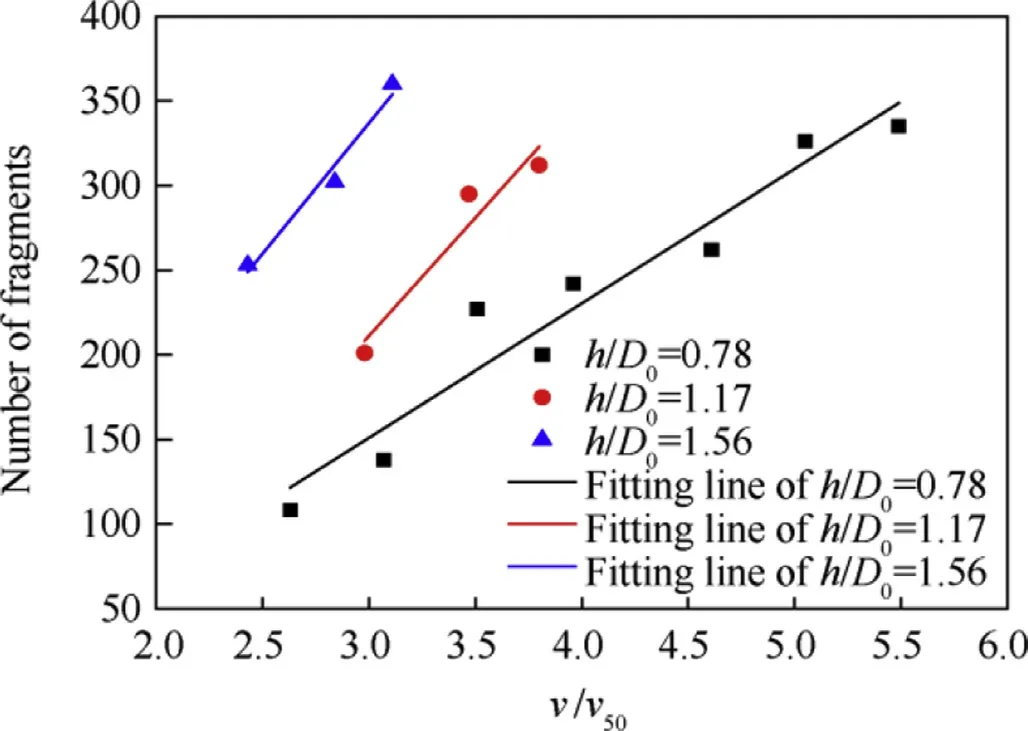
Fig.23.Number of debris of differ-thickness targets at various impact velocities.
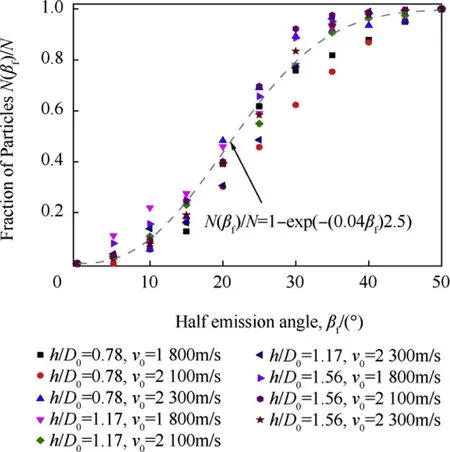
Fig.24.The relation of normalized cumulative fragmentation with βf.
The velocity of the debris gradually decreases with the increase of the emission angle α,as shown in Fig.20.For most target thickness,the velocity decrease in a linear manner.Combined with the kinetic energy distribution characteristics of Fig.21,it can be found that the kinetic energy of the debris decrease exponentially with the increase of α.The kinetic energy of the fragment is larger under the small emission angle,when αincreases,the fragments higher velocities.
Comparing the number of fragments for different thickness and different velocity conditions,the formula for calculating the number of fragments is obtained by fitting,and the error does not exceed 11.8%in the lower velocity range and it does not exceed 6.44%in the higher velocity range.terminal effect potential decreases.When h/D0=1.95,the average kinetic energy of the fragment within small emission angle is improved because the EFP's complete fragmentation.
5.2.The influence of EFP impact velocity v0
In order to investigate the effect of variable impact velocity of the EFP on the BAD distribution,simulation of perpendicular impact of EFPs on the target with velocities between 1200 m/s and 2500 m/s is considered.
Fig.22 is the relationship between nomalized impact and residual velocity of EFP.It is observed that the residual velocity has a linear relationship with the impact velocity with range from 1200 m/s to 2500 m/s.When velocity varies,there are differences in the failure mechanisms of the target.At lower velocity,the EFP energy is insufficient to support the formation of the ellipsoidal debris cloud,only a shearing plug is ejected from the target;as the velocity increases,the radial expansion speed of the fragment increases,and an ellipsoid shape is gradually formed.
5.2.1.The number of fragments
It can be seen from Fig.23 that the number of fragment increases almost linearly with increasing impact velocity for the same target thickness,but the fragments number may not increase at
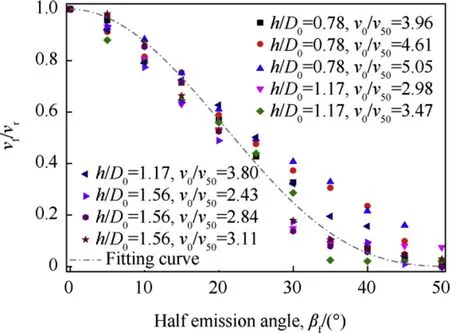
Fig.25.The relation of normalized particles velocity with βf.

5.2.2.Spatial distribution
Since the distribution of fragments has been defined in the previous section,the data is only normalized here to obtain the general spatial distribution of the fragments at different impact velocities and target thickness.
The number of fragments of the EFP that penetrated the steel target thickness of 10 mm,20 mm,and 30 mm at velocity of v0=1800 m/s,2100 m/s,2300 m/s were counted.Fig.24 shows the change curve of the ratio of the cumulative fragment number to the total number with the scattering angleβf.The grow th rate of the fragments increases first and then decreases,which correlates with the Weibull distribution.Most fragments are concentrated in the 15°-30°scattering angle.Considering ratio of the cumulative fragments number to the total number as a function of the scattering angle βf,the formula was obtained by least squares fitting shown in Eq.(7),and the correlation coefficient R2is 0.93.
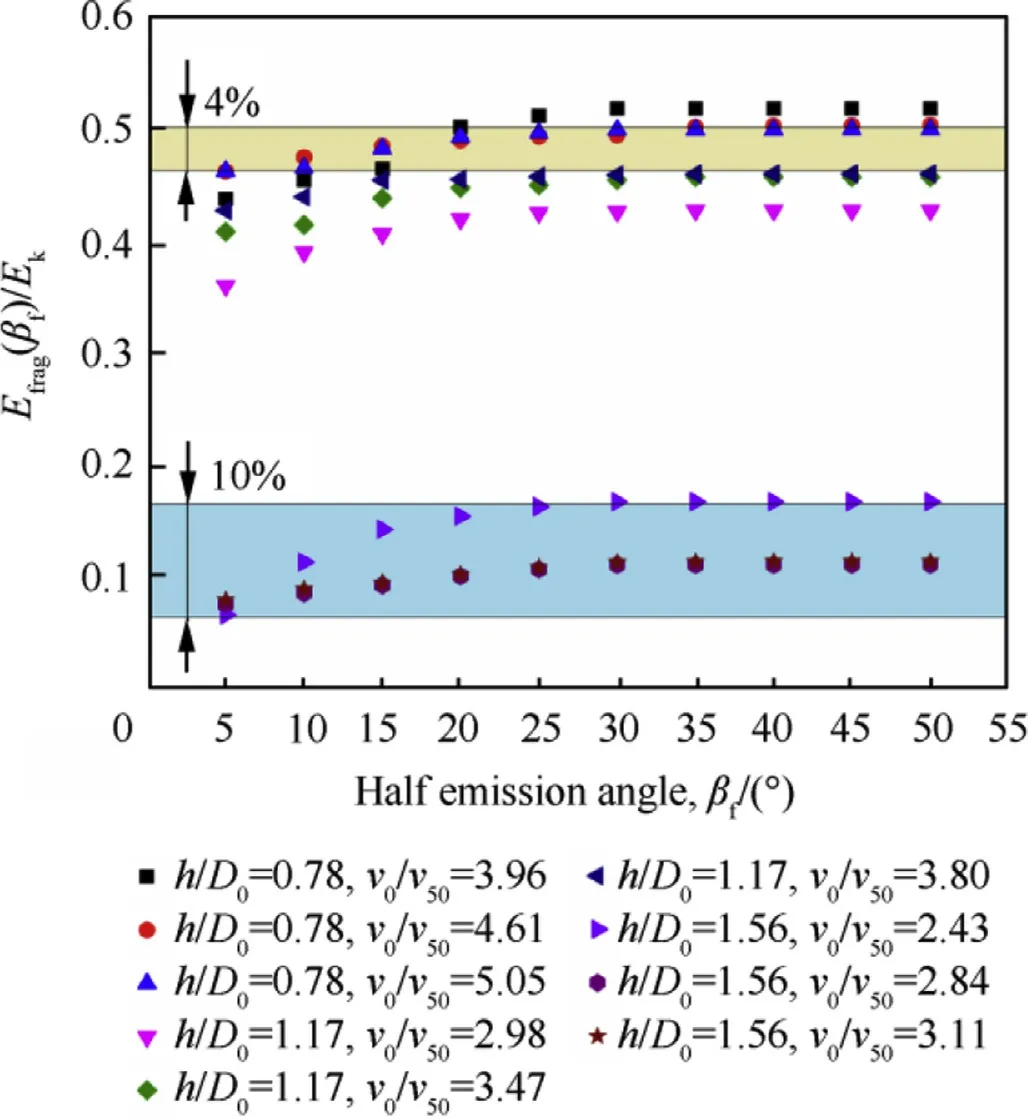
Fig.26.The relation of fragment cumulative kinetic energy with βf.

Fig.25 is the relation of normalized particles velocity with βf.We can see the good consistency in results for different thicknesses and impact velocities.The normalized average fragment velocity mostly decreases in some form of cosine of the scattering angle,and the exact fitting formula is shown in Eq.(8),and the correlation coefficient R2is 0.91.

Fig.26 shows the relation of cumulative kinetic energy of the fragments with scattering angle βf.At the same target thickness,the ratio of total fragment kinetic energy and the initial EFP kinetic energy decreases with the increase of velocity.The ratio only accounts for 4%when EFP penetrates 10 mm target at 2300 m/s(h/D0=0.78,v0/v50=5.05);At the same velocity,this ratio will increase with the increase of target thickness.When the target penetrate into the 20 mm target at 1800 m/s(h/D0=1.56,v0/v50=2.43),the ratio accounts for 10%of initial EFP kinetic energy.
5.3.The influence of impact obliquity θ
In the actual application,EFPs do not alway penetrate the target perpendicularly.The more common situation is to interact with the target at certain angle.It is more meaningful to study the conditions of angled impingement.So the debris clouds formed at obliquity angles θ=0°,15°,30°,45°,60°were simulated.Fig.27 is the typical time image of BAD fromed by EFP with impact velocity of 2100 m/s penetrate through 10 mm thickness target at different obliquity.
As can be seen from the figure,because of the presence of erosion,which offsets the lateral force on the projectile during oblique penetration,the direction of the EFP always moves along the initial motion axis.The debris were distributed on both sides of the motion axis.When θ is in 0°-15°,the debris are distributed symmetrically to the motion axis.When θ is 30°or 45°,the distribution is asymmetric,and the greater of impact obliquity angle,the more obvious the asymmetry.
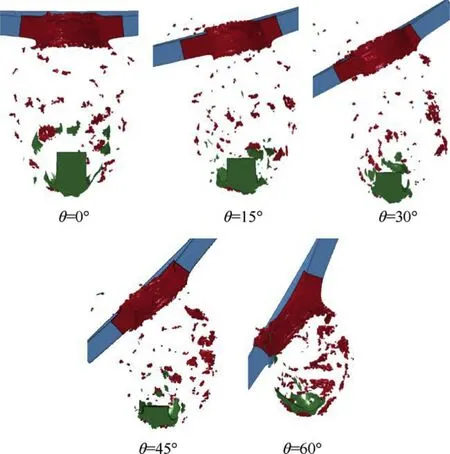
Fig.27.Debris cloud images of different obliquity at 60μs.
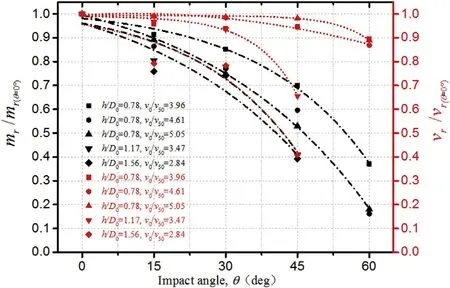
Fig.28.The variation of EFP residual mass and residual velocity with θ
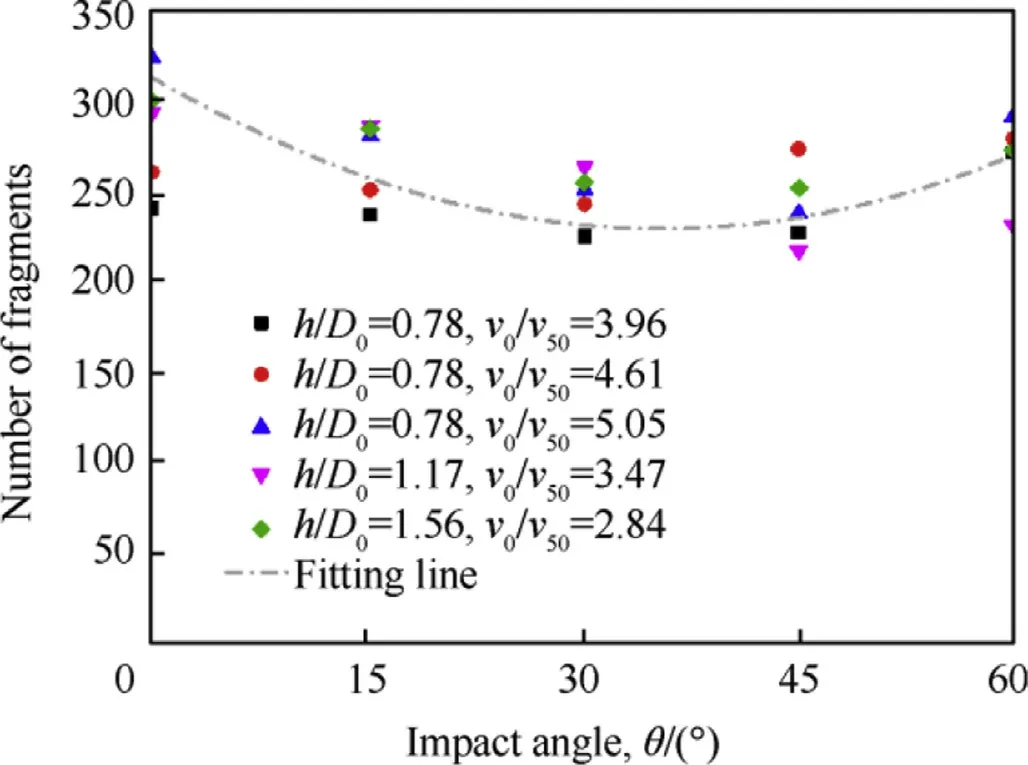
Fig.29.The variation of debris number with θ
The black curve in the Fig.28 represents the relationship of the EFP residual mass with the impact angle.It shows that the residual mass of EFP decreases exponentially with the increase of impact obliquity,and the variation trends of different thicknesses and velocities are basically the same.The red curve is the relationship of EFP residual velocity with the angle.The EFP residual velocity reduction is small when h/D0=0.78 and θ=60°,the decrement is about 10%compared with the normal condition.When h/D0=1.17 and h/D0=1.56,the EFP can't pass through the target at 60°.The remaining velocities of EFP reduced by a large amount,accounting for 48%of when θ=45°compared with normal condition.
5.3.1.The number of fragments
After counting the number of debris(Fig.29),it can be seen that when the impact obliquity increases,the total number of debris decreases first and then increases.
As for the EFP,the side force of EFP increases as the impact obliquity becomes larger during the penetration process,which will aggravate the fragmentation of EFP.As for the target,when the angle increases,the impact area in the target plate increases.Once the velocity component perpendicular to the target is sufficient to penetrate the target,the number of debris shows no tendency to decrease but increase.According to the method proposed in reference[38],by adding an angle correction term,a formula for calculating the number of fragments behind the target is established in consideration of the target thickness,the impact velocity and obliquity,that is,

Where has the form shown in Eq.(6),and f(θ)has the form as follow.The correlation coefficient R2is 0.86.

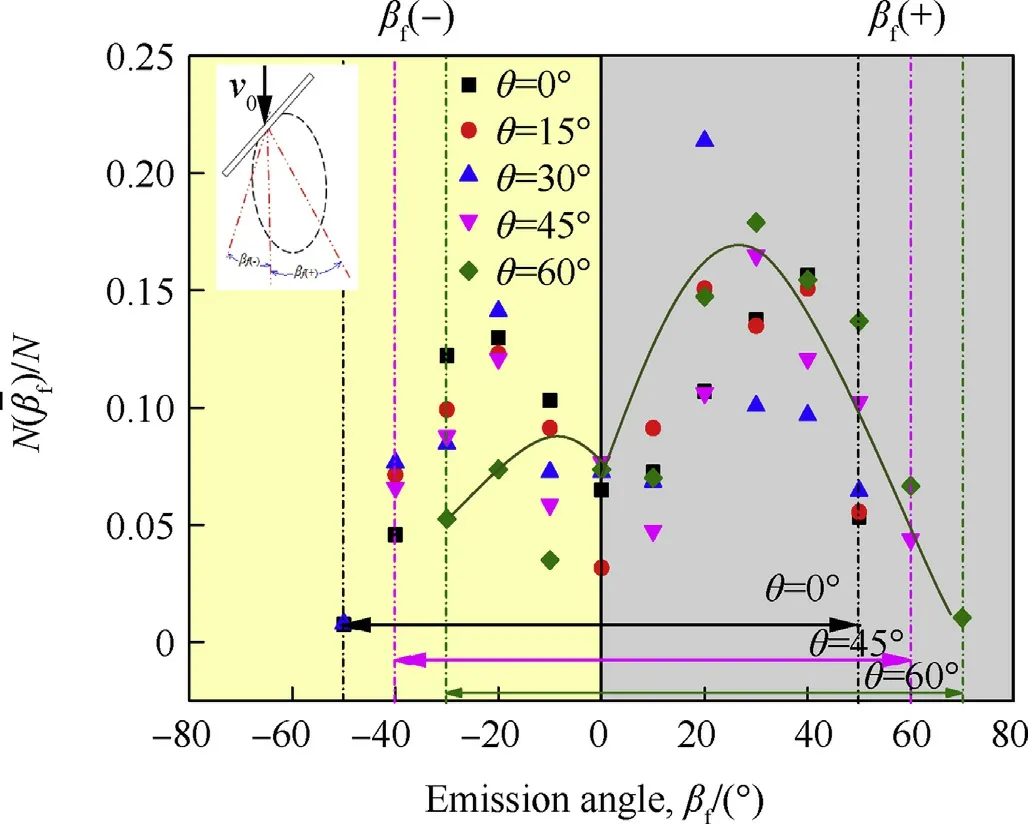
Fig.30.The variation of the ratio of with βf.

Fig.31.The variation of normalized average velocitywith βf.
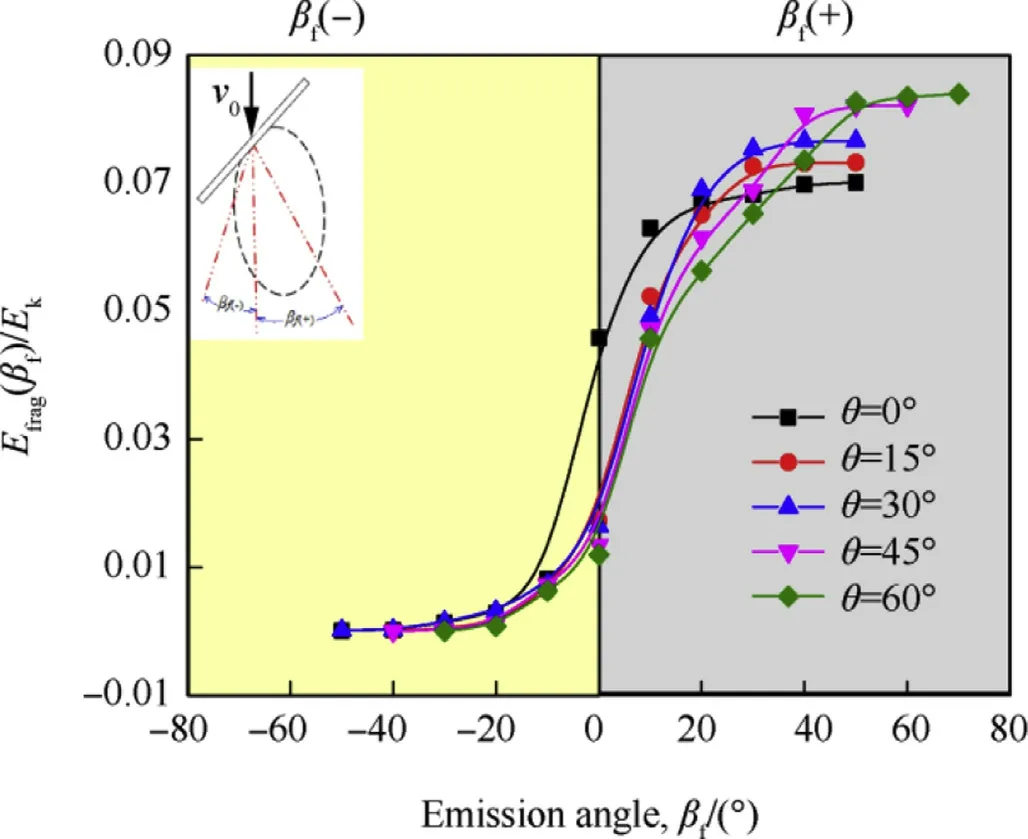
Fig.32.The variation of the ratio of E frag(βf)/E k with βf.
5.3.2.Spatial distribution
It is found that the number,velocity and kinetic energy of debris are asymmetrically distributed due to the impact obliquity.The emission angle is divided into positive and negative directions to obtain the change trends shown in Fig.30-Fig.32.The number of fragments located in βf(+)increases as the obliquity varies,accounting for 50%,56%,67%,75%and 83%,respectively.The distribution law of fragments in the βf(+)and βf(-)conforms to the normal condition respectively.The total emission angle of the fragment is basically unchanged,namely about 100°.The change of fragments velocity is not obvious except for the asymmetry.The maximum kinetic energy region of the fragment is still near the residual EFP motion axis,and the kinetic energy of the fragment accounts for 7%-9%compared with initial EFP's kinetic energy.
6.Conclusions
In this paper,the FEM-SPH adaptive conversion algorithm was used to calculate the BAD and its distribution caused by long-rod EFP impacting multi-thickness targets at various velocities and angles.The conclusions are as follow s:
(1)FEM-SPH algorithm can effectively solve the elements' distortion caused by erosion in the process of penetration,which can also provide a more precise description of BAD.The simulation results are in good agreement with the flash X-ray radiographs.
(2)An ellipsoidal debris cloud was formed behind the target.With the increase of target thickness and decrease of impact velocity and obliquity,the major-to-minor ratio of the ellipsoid decreases.The number of debris ejected from target is significantly higher than debris originating from the EFP.
(3)The distribution of BAD is closely related to the target thickness h,impact velocity v0and impact angle θ of EFP.The number of debris first increases and then decreases with the increase of h from 10 mm to 40 mm.The number of fragments increases linearly with the increase of the v0ranging from 1200 m/s to 2500 m/s.The number of fragments first decreases and then increases with θ varies from 0°to 60°.
(4)For the spatial distrubution,as the scattering angle α increases,the grow th rate of accumulated fragments number correlates with the Weibull distribution.The velocity of the debris decreases when the cosine of αgetting larger.As scattering angle α increases,the kinetic energy of the fragments decreases exponentially.The kinetic energy of debris cloud,except the main parts of residual EFP,accounts for 4%-10%of the initial EFP's kinetic energy.
Acknowledgements
This research work is supported by National Natural Science Foundation of China(Grant no.11872123).
Appendix.The English version of fragment statistics program proposed in Ref.[36]
Through numerical simulation,the mechanical information such as velocity and pressure and the shape information of the fragment are obtained.But the fragment mass distribution cannot be obtained directly.It is necessary to develop the software for statistics based on the numerical simulation.This statistical software has the functions of fragment distinction,mass calculation and statistics.
1.1.The distinction of fragment
Since there is more than one element in each fragment,the nodes number in each fragment may be discontinuous,and one node number may be associated with another fragment.Therefore,only by first determining the components of the fragment based on the element and node information,can the fragment mass be counted.
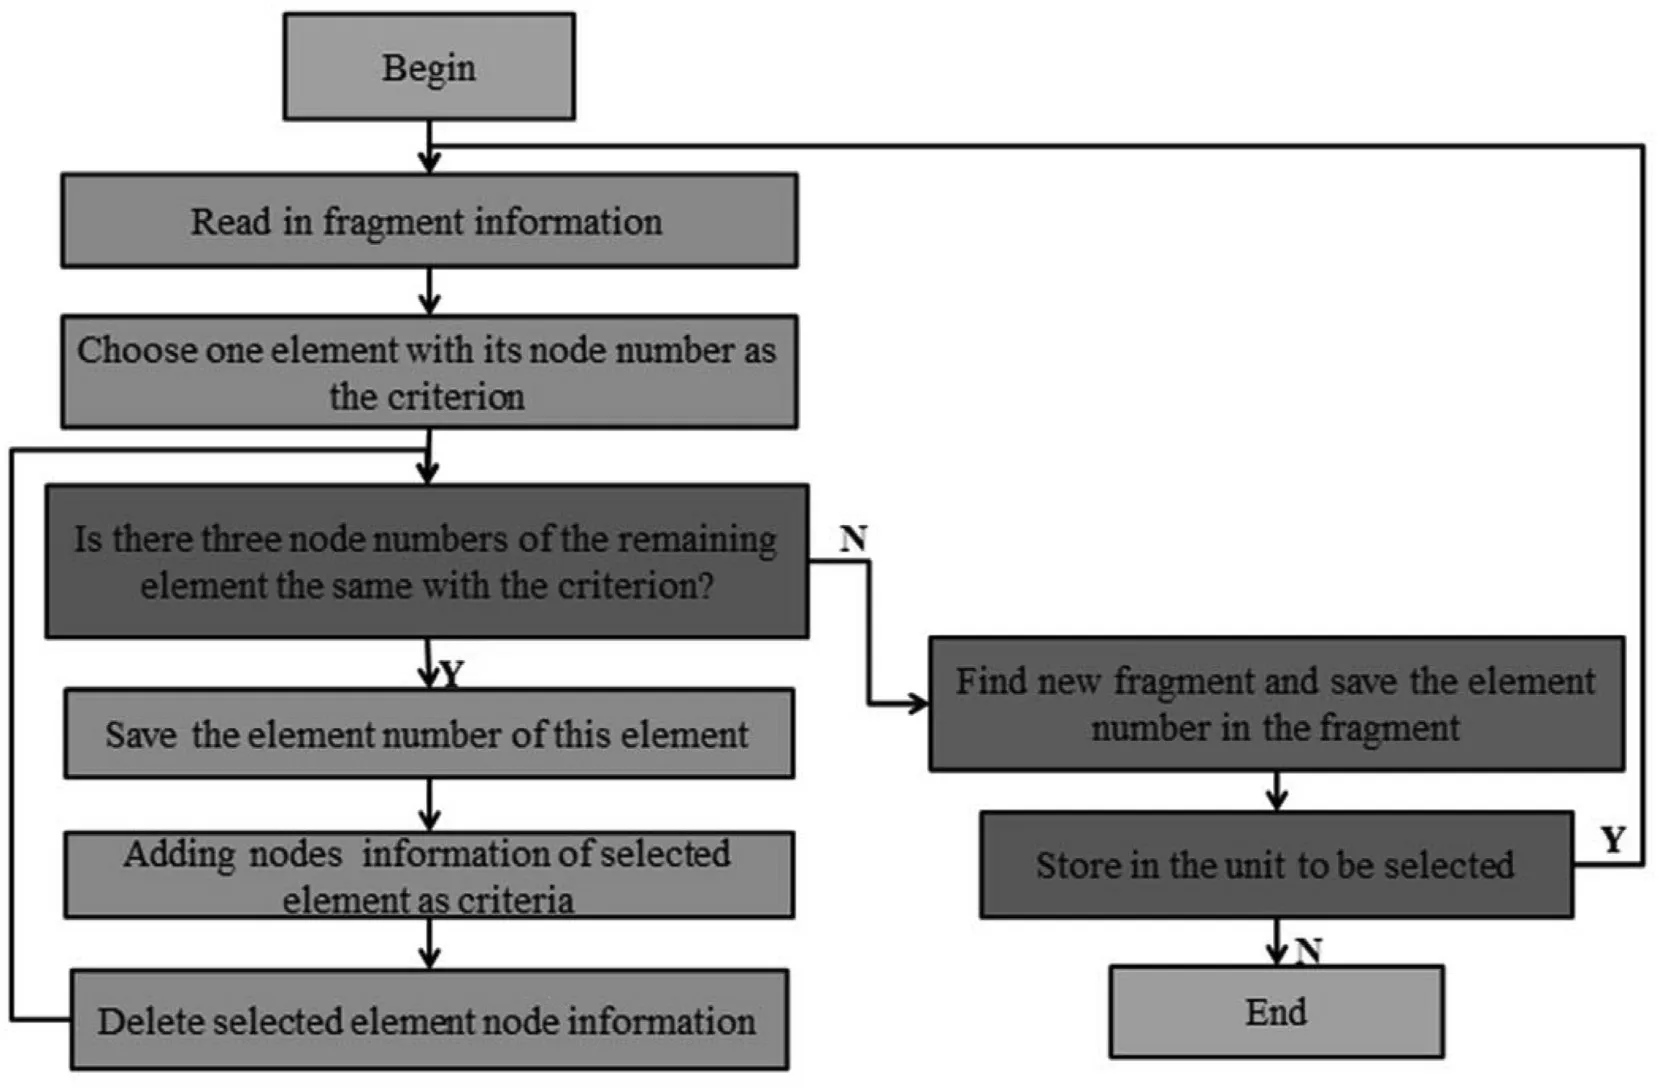
Fig.1.The Procedure of fragment distinction.
In the modeling process,there are four shared nodes between the connected elememts.Therefore,it can be judged whether the two elememts belong to the same fragment according to the same number of nodes existing in them.The procedure of fragment distinction is shown in Fig.1.
1.2.The procedure of fragment mass statistics
In order to calculate the mass of a fragment,it is necessary to calculate the mass of each unit in the fragment,and the sum mass of each unit is the fragment mass.After the mass calculation of all fragments is completed,the quantity of fragments is counted according to the divided mass interval,and the result of fragment mass distribution is obtained.
The key point of fragment mass statistics process is to calculate the mass of each element.The method is to extract eight node coordinates associated with the element and calculate the volume of the element according to the diagonal node coordinates.The procedure of fragment mass statistics is shown in Fig.2.
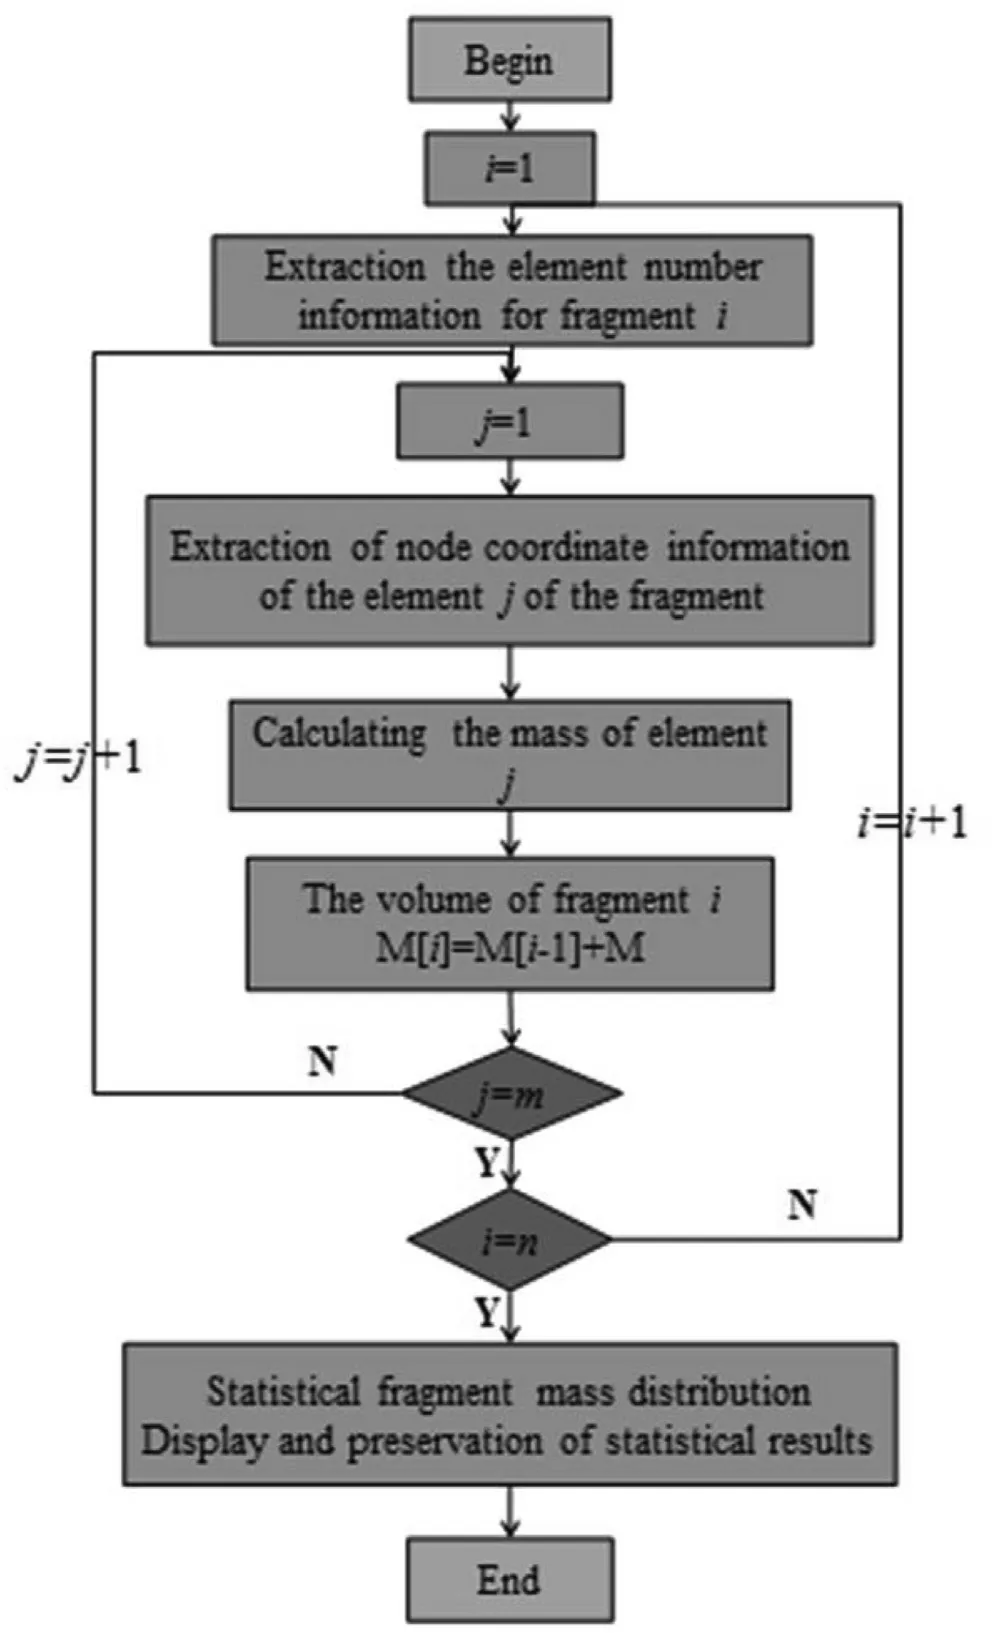
Fig.2.The procedure of fragment mass statistics.
- Defence Technology的其它文章
- An approach for predicting digital material consumption in electronic warfare
- Initial alignment of compass based on genetic algorithm-particle swarm optimization
- The non-isothermal gravimetric method for study the thermal decomposition kinetic of HNBB and HNS explosives
- A non-myopic scheduling method of radar sensors for maneuvering target tracking and radiation control
- Research on construction of operation architecture based on complex network
- Estimating the metal acceleration ability of high explosives

