
Biological manipulation of eutrophication in West Yangchen Lake
2019-09-19 02:40ChunfangCaiJieHeWenChenJunbiaoZhangQianqianWangXuehongSongYuantuYeYonglingWangPingWuXiaminCao
Aquaculture and Fisheries 2019年5期
Chunfang Cai, Jie He, Wen Chen, Junbiao Zhang, Qianqian Wang, Xuehong Song, Yuantu Ye,Yongling Wang, Ping Wu, Xiamin Cao
School of Biology and Basic Medical Sciences, Soochow University, Suzhou, 215123, China
Keywords:Biomanipulation West yangchen Lake Algal bloom Filter-feeding fish Stocking density Ratio of silver carp to bighead carp
ABSTRACT This paper aims to share findings on nonclassical biomanipulation from a field study on eutrophic West Yangcheng (WY) Lake. In the forty years before 2009, cyanobacteria frequently bloomed in WY Lake, an event which has not occurred since 2009. The stocking density of filter-feeding carp was estimated to be more than 50 g/m3 in July after 2009,approximately double the amount observed before 2009,and the ratio of silver carp to bighead carp(SBR)increased from 0.8 to more than 1.6.Compared with the water quality between 2004 and 2007,the total nitrogen(TN)and the chlorophyll-a(Chl-a)concentration decreased while total phosphorus(TP)and transparency (SD) increased significantly after 2009 (P <0.05). The decreasing Chl-a concentration was observed in Jul, Jun, May, Jul, and Mar in 2009, 2010, 2011, 2016, and 2017, respectively. The Chl-a concentration was significantly negatively correlated with TP (P <0.05), and no significant correlation with TN was observed (P >0.05). A significant negative correlation was observed between fish yield and SD(P <0.05). The results also showed that filter-feeding carp more effectively restrained algae growth when SD was low.These results indicated that a high density of filter-feeding fish with increased SBR interfered with the driving effects of nutrients and temperature on the growth of algal biomass and then restrained bloom of algae.It may be necessary to take SD into consideration for determining the appropriate fish stocking density for the biomanipulation of algae.
1. Introduction
Water quality in many lakes worldwide has degraded considerably in recent decades due to increasing eutrophication by point and nonpoint source pollution in watersheds (Søndergaard et al., 2007). Eutrophication often results in harmful algal blooms dominated by cyanobacteria. Cyanobacteria are able to produce potent toxins; therefore,blooms pose a significant risk to human and animal health and could impair the value and potential uses of water (Codd, Morrison, &Metcalf, 2005). A reduction in nutrient loading is essential to the control of eutrophication (Søndergaard, Bjerring, & Jeppesen, 2012).However, lakes are increasingly subject to nutrient inputs related to human activities, including the direct discharge through rivers and aquaculture activities that make it difficult to achieve sufficient reduction of nutrients to mitigate cyanobacterial blooms in lakes. Biomanipulation can therefore be an additional management tool to alleviate cyanobacterial blooms in eutrophic lakes (Xie & Liu, 2001).
In the past, studies have shown that stocking silver carp, bighead carp, or tilapia in eutrophic water bodies is effective for preventing cyanobacterial blooms (Guo et al., 2015; Lu, Jin, Dong, Gu, & Bowen,2006; Wang, Chen, Dahms, Yeh, & Chiu, 2016). It was estimated that fish consume 8 kg of dry microalgae to produce 1 kg of meat(Xie,2003,p. 134). However, there are also studies that have shown that filterfeeding fish stocking increased microalgae biomass or the chlorophyll-a(Chl-a) concentration (Tang, Xie, Lu, Xie, & Wang, 2002; Wang et al.,2016), increased total nitrogen (TN, Anderson, Glibert, & Burkholder,2002) and increased total phosphorus (TP, An & Kaelmpbl, 2003).Based on a large-scale investigation of 45 mid-depth lakes in the Yangtze River Basin,Wang et al.(2008)concluded that silver carp and bighead carp are not suitable biotic agents for phytoplankton control in lake management if the goal is to control phytoplankton and to enhance water quality. The differing results may be caused by different fish stocking density. If the density of filter-feeding carp is high enough,then the grazing intensity on algae will overcome the growth of algal biomass, so the algal bloom could be controlled (Wang et al., 2016).Meanwhile,the speed at which the algae assimilate nutrients would fall because of lower biomass.
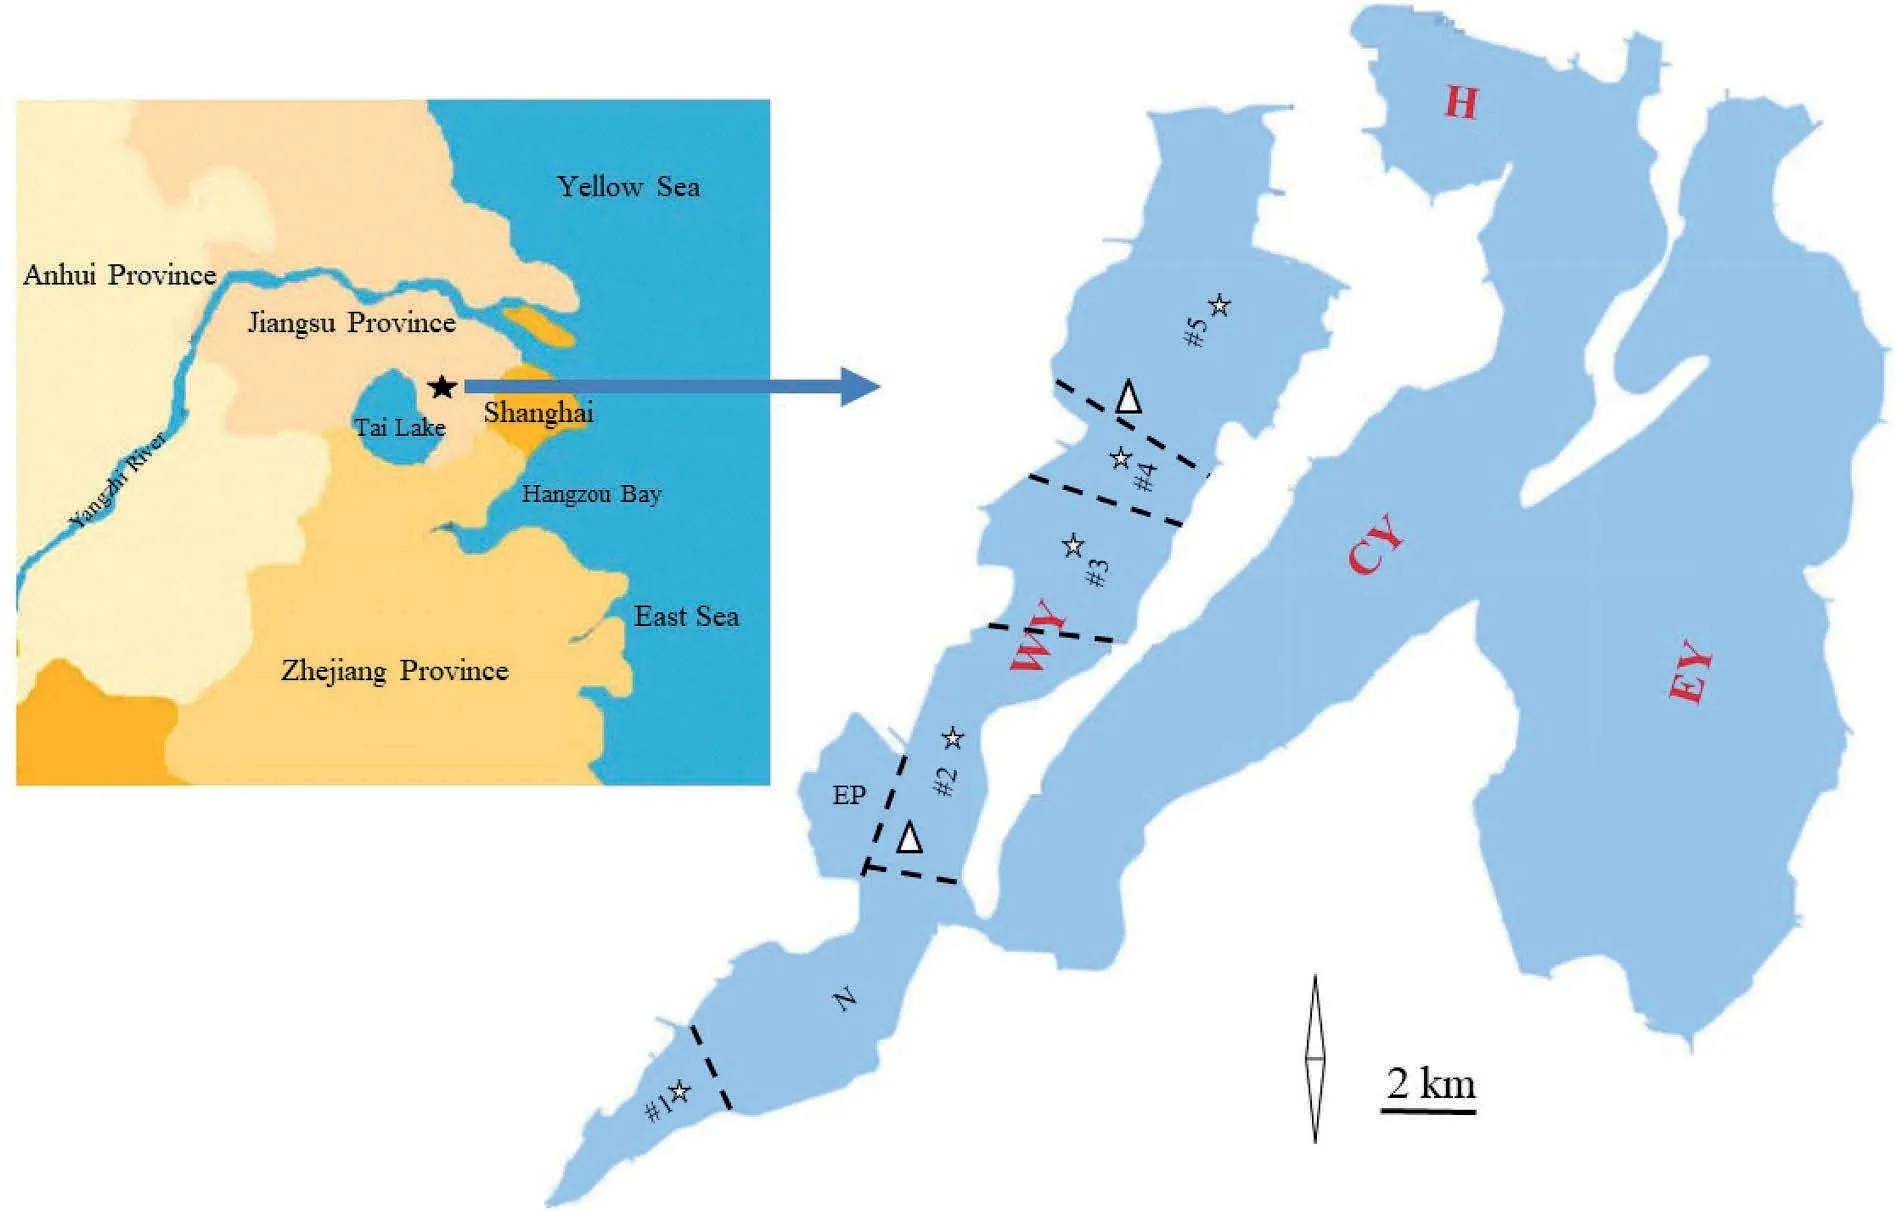
Fig.1. Overview of Yangchen Lake.★:Location of Yangchen Lake;WY:West Yangchen Lake;CY:Central Yangchen Lake;EY:East Yangchen Lake;H:Houdang Lake;EP: Ecological protection zone; N: No fisheries area from 2009 to 2012; #1 - #5: 5 areas enclosed for stocking filter-feeding carp from 2009 to 2012. ┈: Enclosure wall; △: Monitored station from 2004 to 2007; ☆: Monitored station from 2009 to 2017.
West Yangcheng (WY) Lake is a typical shallow eutrophic lake.Cyanobacterial blooms have occurred frequently since the 1960s and the most serious cyanobacterial bloom occurred in 2008. Silver carp and bighead carp have been released in the lake in high density since 2009, and since then the cyanobacterial blooms have disappeared. We have monitored the water quality of WY Lake since 2004 and this field study revealed the different response of biological manipulation to stocking density of filter-feeding carp. Findings from this study might be valuable for a better understanding of nonclassical biomanipulation and for eutrophic water management.
2. Materials and methods
2.1. The geographical location of Yangcheng Lake and the fisheries management profile of WY Lake
Yangcheng Lake is located in northeastern Suzhou City within longitude 120°39′E -120°51′E and latitude 31°21′N -31°30′N. It is part of the ancient Tai Lake with a total area of 117 km2.There are two sand ridges dividing the lake into three regions, including East Yangcheng(EY)Lake,Central Yangcheng(CY)Lake and WY Lake(Fig.1).WY Lake is situated in the upstream region of Yangchen Lake,with a total area of 37 km2and an average water depth of 2.2 m. The water quality of WY Lake is the worst among the 3 regions(Gui,Xue,Yao,&Wei,2011).As a north-south-oriented, narrow lake, the water quality varies in different areas. Water quality in the southern region is worse than in the northern region (Liang, Li, & Ran, 2015).
Cyanobacterial blooms have been observed in WY Lake since the 1960s. From 2002 to 2007, culture pens with sizes of 2 hm2were arranged over 80% of the lake area. Among these pens, two-thirds of which were located in the south,were stocked with 3.3 g/m3silver carp and 4.9 g/m3bighead carp, which require no feeding. One-third of the pens,located in the north,contained cultivated Chinese mitten crab for which artificial feed was used. However, a submerged plant covered more than 60% of the area in crab pens and no cyanobacterial blooms occurred during the summer in the northern area. In the southern region, local cyanobacterial blooms were often observed, mostly outside fish pens. Due to deteriorating water quality, fishers were ordered to leave the lake before the end of 2007. However, the most severe and long-lasting cyanobacterial bloom occurred in 2008.Filter-feeding carp were re-stocked in WY Lake beginning in early 2009 at a much higher density and higher ratio of silver carp to bighead carp(SBR)than before(Table 1). At the time there had been no algal blooms in WY Lake, but they had continued to frequently occur in CY Lake and EY Lake,where the nutrient concentration was lower than in WY Lake (Chen et al.,2019;Gui et al.,2011;Liang et al.,2015;Yang,2013)and the stocking density of filter-feeding carp was similar to that in WY Lake before 2007.
2.2. Density of filter-feeding carp in WY Lake during 2004-2017
From 2004 to 2017,silver and bighead carp of sizes between 60 and 100 g were released in the lake from Jan to Feb each year except for 2009 and 2012. Both silver carp and bighead carp were released in April in 2009, and bighead carp was released in April in 2012. The densities of released fish were shown in Table 1. Fish were harvested mainly during Dec-Jan of the following year and local fishing (more than 15 times in July) was also conducted according to fish growth by nets with a 6-inch mesh to harvest large carps (mostly 2-year-old fish).The size of fish was then obtained by local fishing. The SBR was calculated and the fish stocking density in July was estimated as follows:
Ratio of silver carp to bighead carp (SBR)=density of released silver carp (g/m3)/density of released bighead carp (g/m3)
Stocking density of silver carp (or bighead carp) in July (g/m3)=RD1×weight gain ratio×Survival+ADLH=RD1×(SJ1/SR1) × Survival + ADLH
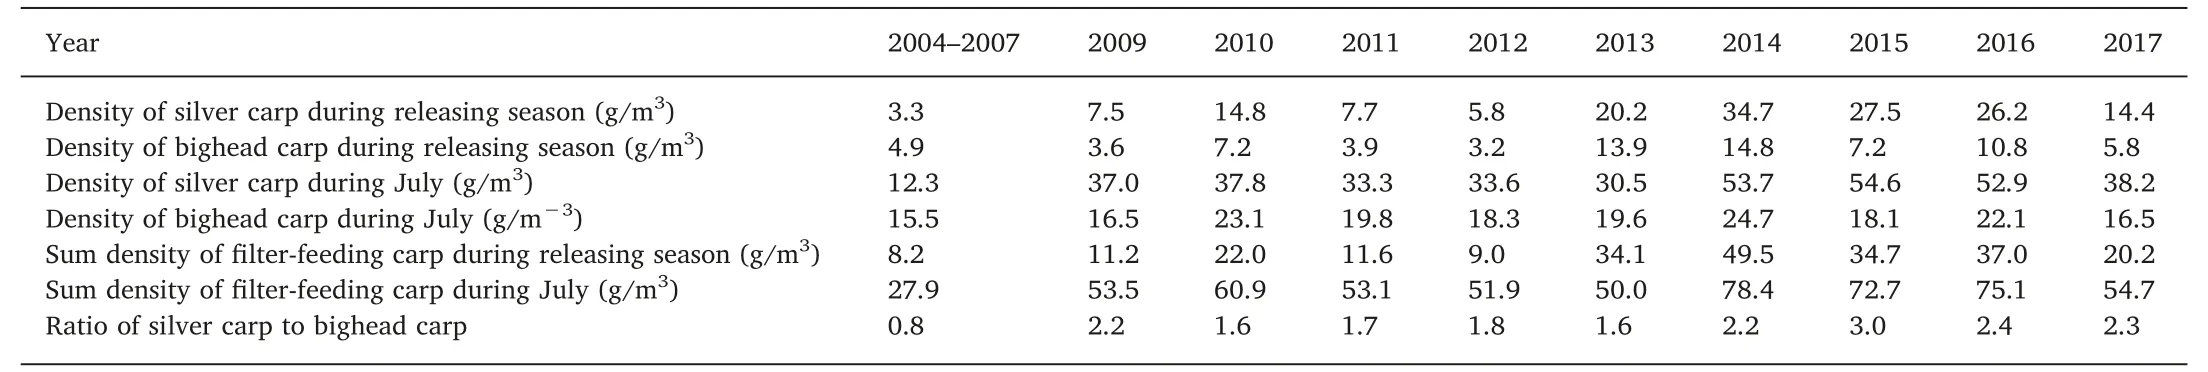
Table 1 The density of filter-feeding carp in WY Lake from 2004 to 2017.
Where RD1: releasing density of 1-year-old fish (g/m3, Table 1);
SR1: size of 1-year-old fish in releasing season (g/fish);
SJ1: size of 1-year-old fish caught in July by local fishing (g/fish);
Survival:set as 70%.However,the survival of carps released in 2009 and bighead carp released in 2012 was set at 50%because the craps were released in April and fish were more stressed during transportation and handling.
ADLH: average density of local harvested commercial size fish in July (g/m3).
From 2009 to 2012,the lake was separated by 5 enclosures(Fig.1).The releasing densities in enclosures #1 through #5 were 13.3, 22.9,13.6,33.1, and 7.3 g/m3,respectively,in 2009;9.3,13.1,9.0,4.4,and 54.5 g/m3, respectively, in 2010; and 11.9, 23.6, 31.3, 25.6, and 0 g/m3, respectively, in 2011 (Table 2).
2.3. Monitoring station and analysis methods for water quality
The monitoring station for water quality is shown in Fig. 1. During 2004-2007, water was sampled 3 times a year. From 2009 to 2011,water was sampled every two months from the center of the 5 enclosures (Fig. 1) and from the same sites during 2016-2017 when the enclosures were removed. The measured variables included transparency (SD), Chl-a (Feng, Li, & Zhu, 2008), TN (SEPA, 2002), and TP(SEPA,2002).The SD was measured visually with a Secchi disc on site.Water samples were collected in a glass bottle 50 cm below the surface and fixed with H2SO4. They were stored at 4°C and analyzed within 5 days.
2.4. Statistical methods
The results are presented as the mean value ± S.E.M. (standard error of the mean). Interannual variability of water quality parameters was analyzed with a univariate general linear model(GLM),where both year and season (month) were considered fixed factors, followed by a post hoc Duncan's test for multiple means comparison. Overall water quality difference between before 2007 and after 2009 was also analyzed by t-test using annual average value. The seasonal variation in TN, TP, and Chl-a concentration was analyzed with Univariate GLMs where the season (month) and sites were considered fixed factors. The correlations between the fish yield and water quality parameters of TN,TP, SD, and Chl-a, and between Chl-a and TN, TP, and SD were analyzed by Pearson correlations. All statistics were conducted in SPSS 19.0 software for Windows. Statistical significance was set at 0.05;however, 0.01 and 0.1 were also used for the Pearson correlation coefficient.
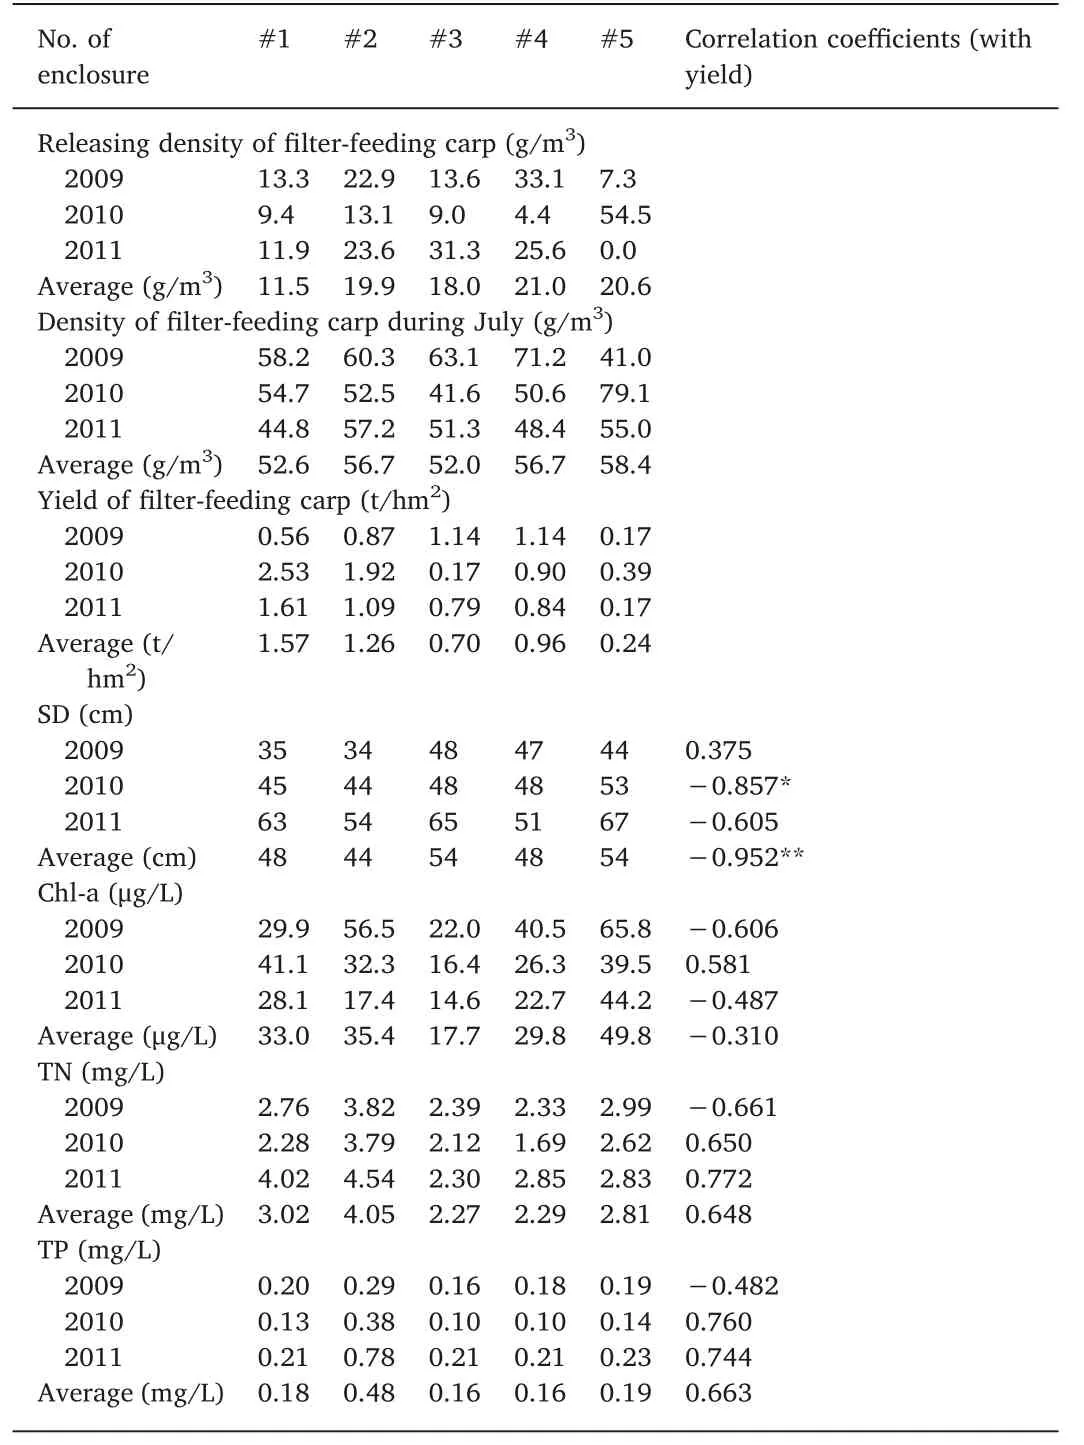
Table 2 The fish density, yield, SD, Chl-a, TN, and TP of each enclosure from 2009 to 2011 and their correlation coefficients.
3. Results
3.1. Density of filter-feeding fish and their ratio
The density of released filter-feeding carp was 11.2 g/m3in 2009,much higher than that during 2004-2007, when it was 8.2 g/m3(Table 1).The SBR was 0.8 during 2004-2007,while it was 2.2 in 2009.The density of filter-feeding carp in July ranged from 50.0 g/m3to 78.4 g/m3from 2009 to 2017, which was about 2 times the density observed from 2004 to 2007 (27.9 g/m3). The SBR ranged from 1.6 to 3.0 after 2009 (Table 1).
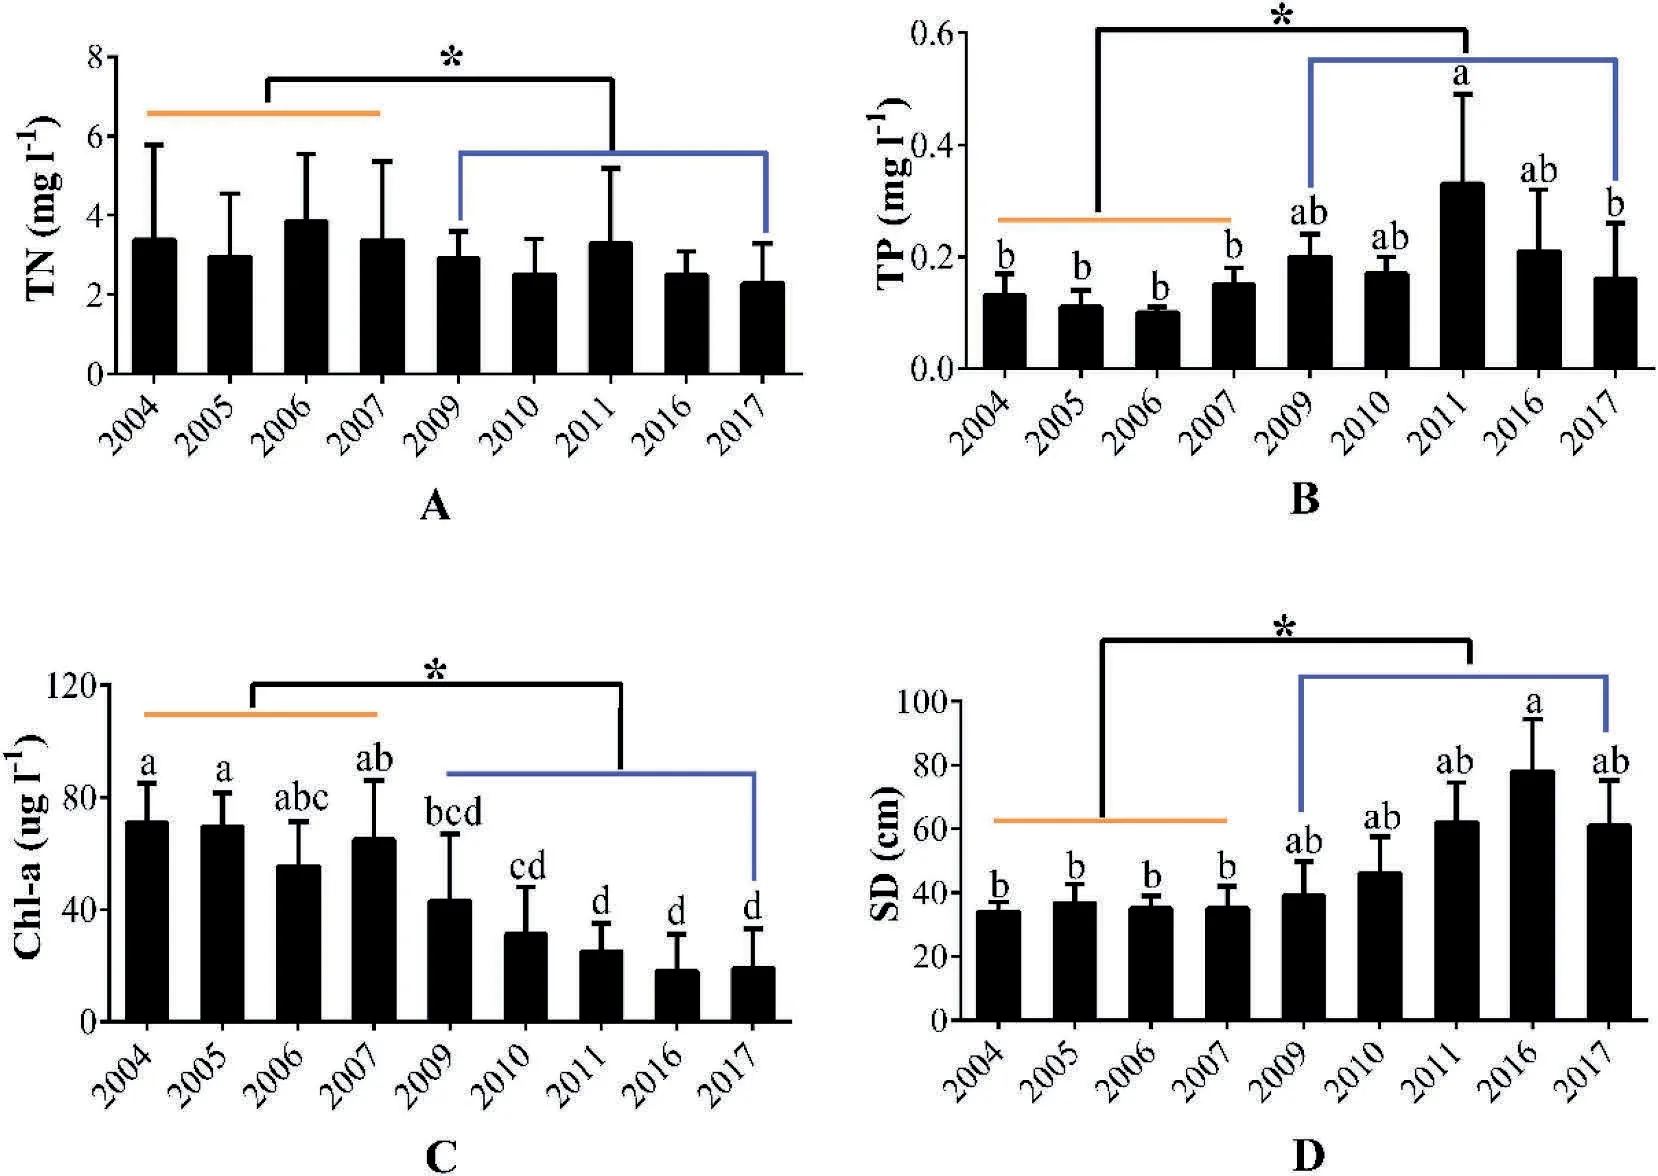
Fig.2. The interannual variations of total nitrogen(TN),total phosphorus(TP),chlorophyll-a(Chl-a)and transparency(SD)in West Yangchen Lake.Columns with different letters are significantly different (P <0.05). * means difference are significantly between before 2007 and after 2009.
3.2. The interannual and seasonal variation of water quality
The interannual variation in the water quality is shown in Fig. 2.The annual average TN concentration ranged from 2.3 to 3.9 mg/L and TP ranged from 0.10 to 0.33 mg/L. A t-test showed TN was lower after 2009 than that during 2004-2007 (P <0.05), although no significant difference was detected by GLM (P >0.05). The TP was significantly higher after 2009 than it was during 2004-2007(P <0.05).The Chl-a was lower after 2009 than it was during 2004-2007 (P <0.05) and showed a trend of continuous decrease after 2009 (Fig. 2). The SD was higher after 2009 than it was during 2004-2007(P <0.05;Fig.2),and the highest value observed in 2016.
Seasonal variations in TN,TP,and Chl-a concentration are shown in Fig. 3. In 2004 and 2007, the concentrations of TN and TP decreased during the summer and the Chl-a increased After 2009, no obvious increase in the Chl-a was observed during the summer. Furthermore,the inflection point of the decreasing Chl-a concentration was observed in Jul, Jun, May, Jul, and Mar in 2009, 2010, 2011, 2016, and 2017,respectively (Fig. 3).
3.3. Correlation analysis of fish yield, density and water quality
The density and annual yield of filter-feeding carp from each enclosure from 2009 to 2011 are shown in Table 2. The 3-year average yield was the highest in enclosure #1 (1.57 t/hm2), followed by enclosures#2(1.26 t/hm2)and#4(0.96 t/hm2),and the lowest yield was observed in enclosure #5 (0.24 ton hm-2).
When assessing the relationship between the yield and the water quality parameters among enclosures from 2009 to 2011,SD showed a significant negative correlation with the 3-year average yield (r=-0.952,P <0.05;Table 2)as well as between the SD and the 2010 yield(r=- 0.857, P <0.1; Table 2). However, a positive correlation was observed between the SD and the 2009 yield (r=0.375; Table 2).
Negative correlations were found between the Chl-a concentration and 2009 (r=- 0.606) and 2011 (r=- 0.487) yields and a positive correlation was observed in 2010 (r=0.581). However, none of these correlations were significant(P >0.1;Table 2).No significant correlation was detected between fish yield and TN or TP (P >0.1; Table 2).
Comparing the Chl-a concentration among enclosures, it was observed to be 39.5 μg/m3in enclosure #5 in 2010, which was higher than in the other enclosures,except for enclosure#1(Table 2).It is also higher than it was in enclosure #1 in 2009 (29.9 μg/m3; Table 2).However, the releasing density in enclosure #5 reached 54.5 μg/m3in 2010, which was more than three times higher than the density in enclosure #1 in 2009 (13.3 μg/m3; Table 2) and higher than the releasing density in the other enclosures in 2010 (Table 2). The fish density in enclosure#5 in July 2010 was also the highest(79.1 μg/m3;Table 2) compared to that in other enclosures and was higher than it was in enclosure #1 in July 2009 (58.2 μg/m3; Table 2).
When assessing the relationship between the fish yield and the water quality parameters from 2004 to 2017, a significant positive correlation with TN (P <0.1, Table 3) and negative correlation with Chl-a (P <0.5; Table 3) was detected. Analysis of the correlations between water quality parameters since 2009 revealed a significant negative relationship between Chl-a and TP (r=-0.311, P=0.045;Table 3)and between Chl-a and SD(r=-0.648,P <0.001;Table 3).No significant correlation was observed between Chl-a and TN(r=0.059, P=0.710; Table 3).
4. Discussion
4.1. Biomanipulation of filter-feeding fish on cyanobacterial blooms
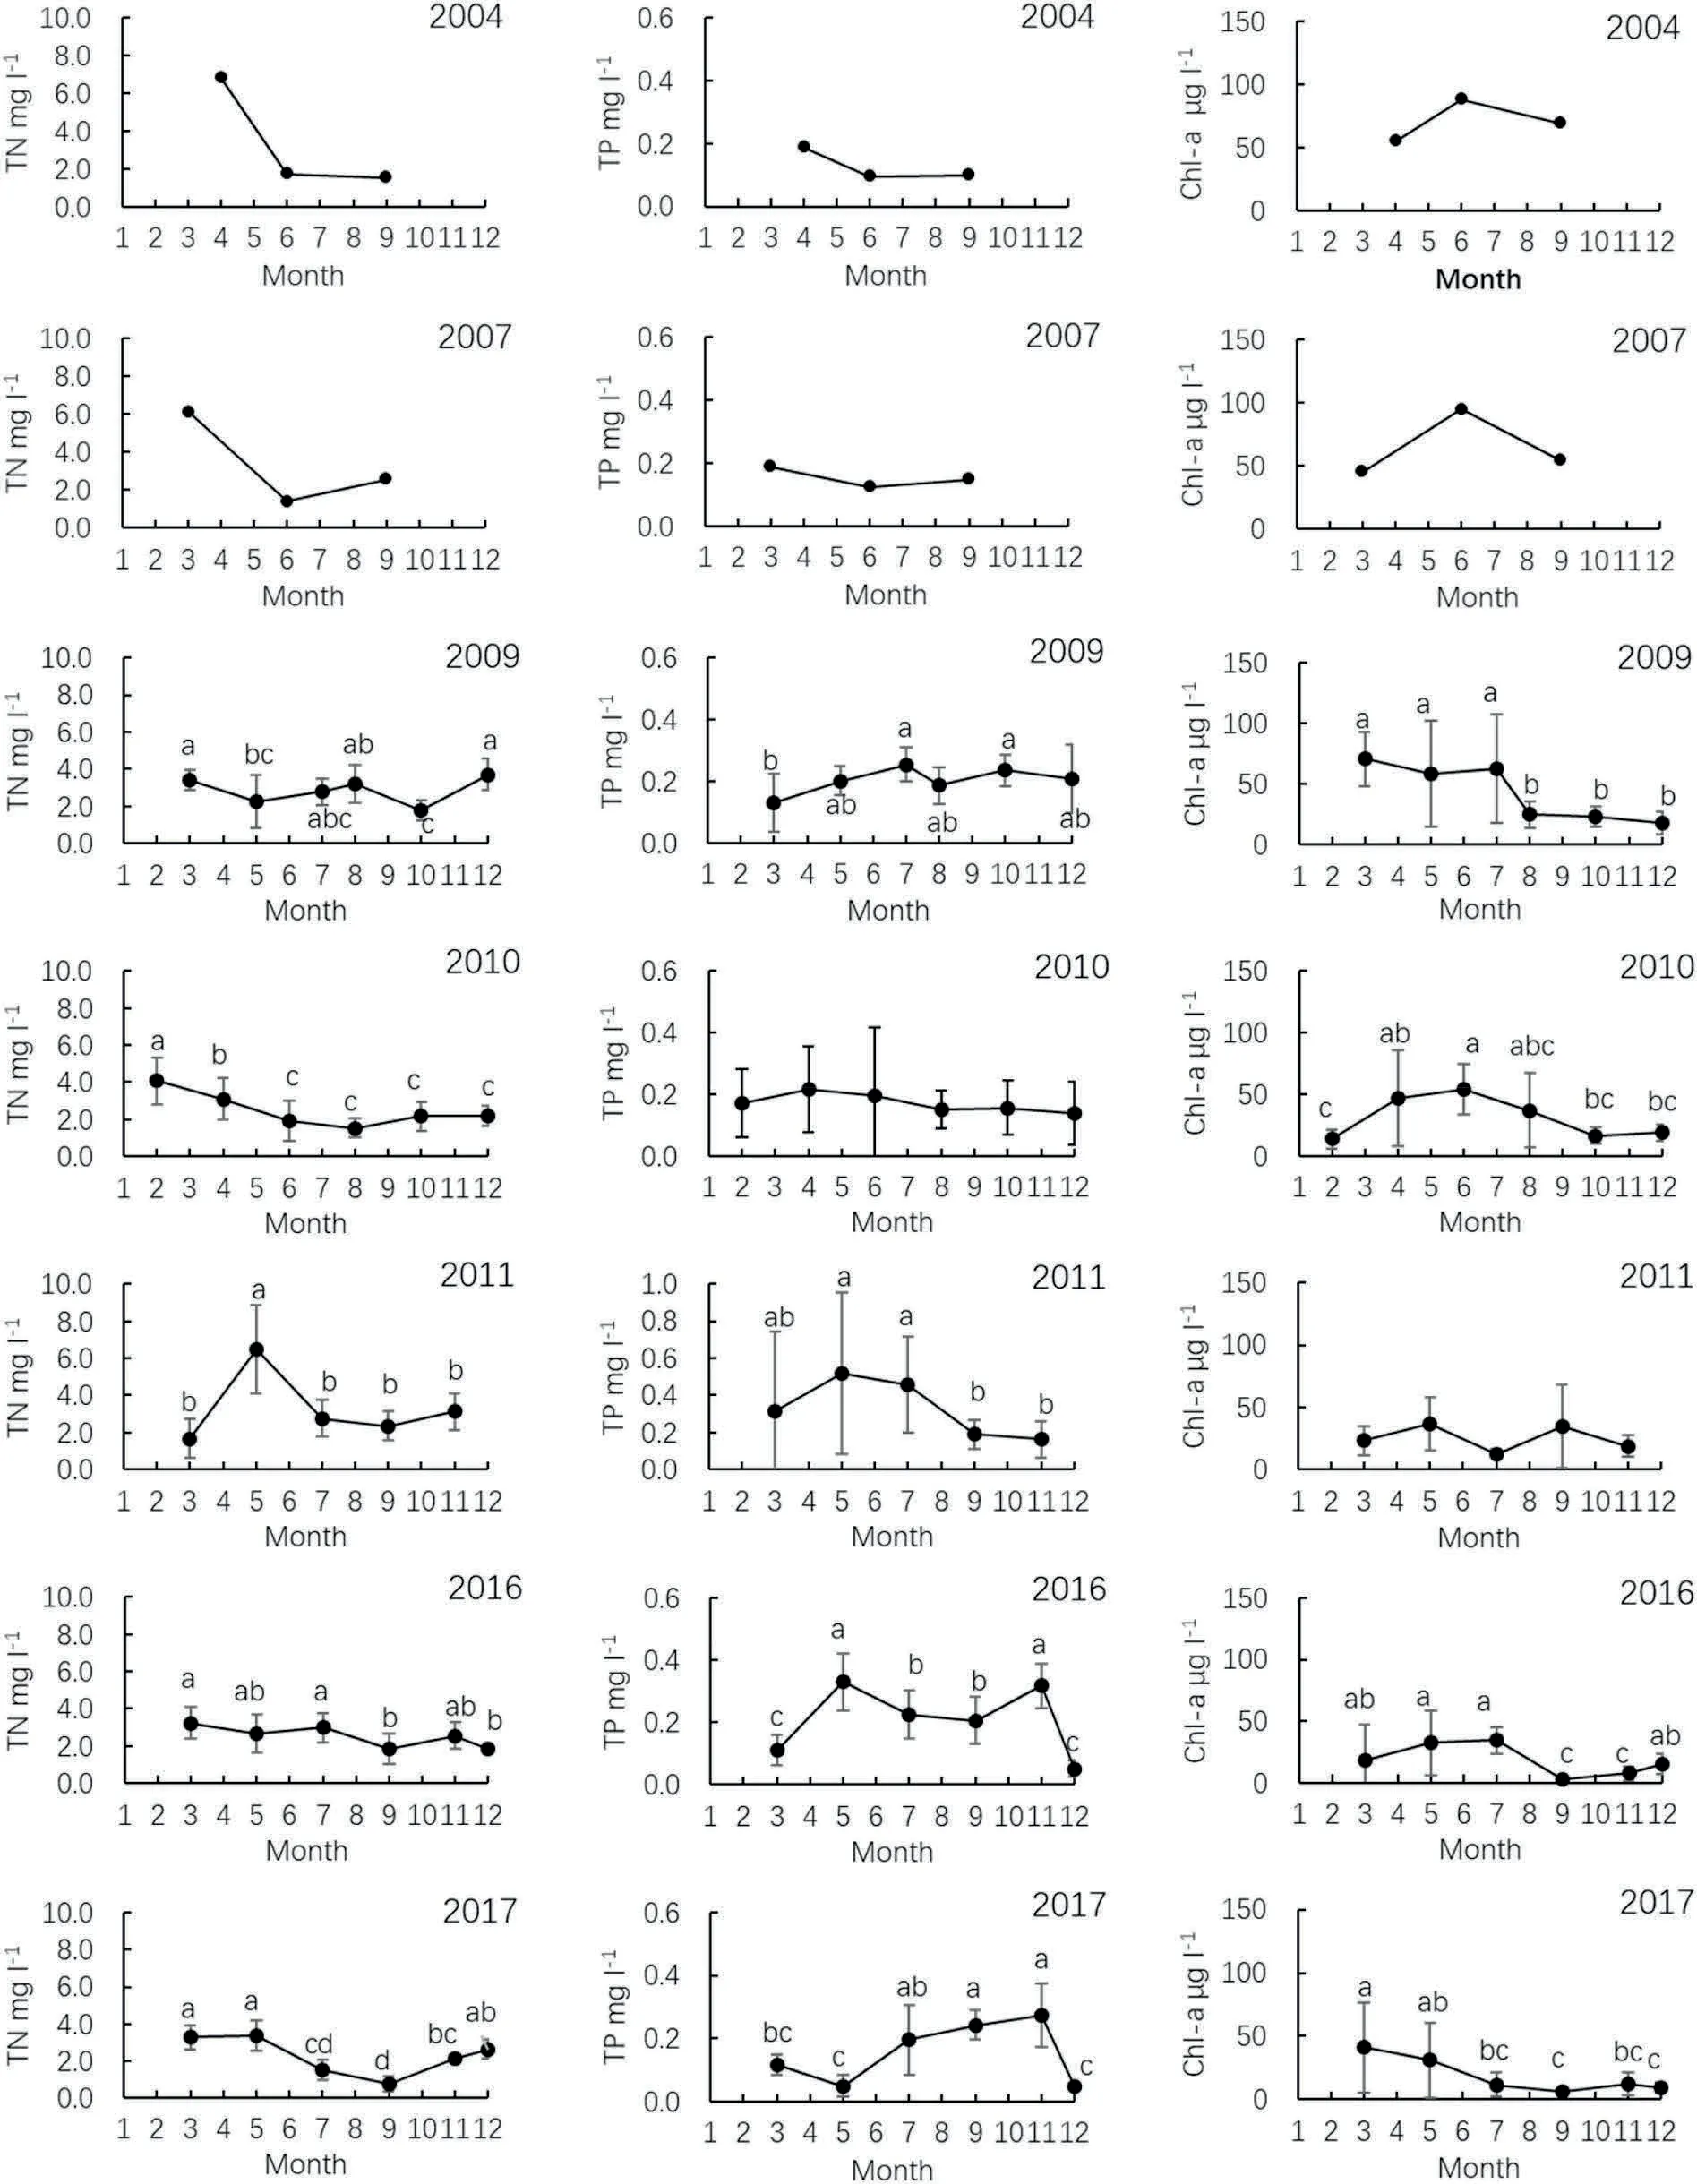
Fig.3. Annual variations in total nitrogen(TN),total phosphorus(TP),and chlorophyll-a(Chl-a)concentrations in West Yangchen Lake.Data with different letters are significantly different (P <0.05).
Algal blooms are complex events that are typically caused by multiple factors occurring simultaneously (Heisler et al., 2008). Of the potential environmental drivers of these bloom, anthropogenic organic pollution and a reduction of nutrient loading that effectively causes a reduction in phytoplankton biomass have received the most attention(Anderson et al., 2002). Empirical models predict that in temperate ecosystems, summer phytoplankton communities could potentially be dominated by cyanobacteria at TP concentrations of 0.1-1.0 mg/L(Downing, Watson, & McCauley, 2001; Jensen, Jeppesen, Olrik, &Kristensen, 1994; Trimbee & Prepas, 1987). The annual average concentration of TP in WY Lake water ranged from 0.16 mg/L to 0.33 mg/L from 2009 to 2017 (Fig. 2), within the range of 0.1-1.0 mg/L and higher than that before 2007; however, no cyanobacterial blooms occurred and a negative correlation was detected between TP and Chl-a(P <0.05,Table 3).Meanwhile,cyanobacteria bloomed every summer in CY Lake and EY Lake during the same period, where TP was lower than in WY Lake(Chen et al.,2019;Gui et al.,2011;Liang et al.,2015).
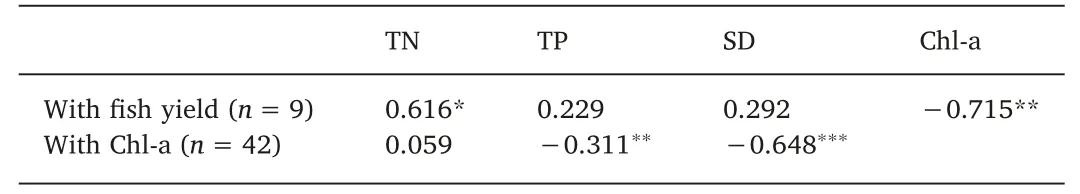
Table 3 The Pearson correlation coefficient with filter-feeding carp yield and Chl-a concentration.
The absence of cyanobacterial blooms in WY Lake could possibly be attributed to the much higher stocking density of filter-feeding carp(Guo et al., 2015) and the high SBR. Phytoplankton was the main food source for both silver carp and bighead carp(Mu et et al.,2012).On the menu of the bighead carp, however, there are more zooplankton and less phytoplankton compared to silver carp (Xie, 1999; Xie, 2001; Mu et al.,2012;Yi,Guo,Ni,&Luo,2016),and zooplankton also suppresses the algal blooms (Mu et al., 2012; Mohamed, Bakr, & Ghramh, 2018).Therefore, silver carp is more effective for restraining algal blooms.During 2004-2007, the SBR was 0.8, and in 2009, it was 2.2. After 2009, the SBR was maintained between 1.6 and 3.0. The high density,as well as the high SBR (Table 1), interfered with the driving effects of nutrients on the growth of algal biomass and suppressed the bloom of algae.
Chlorophyll-a is a component of phytoplankton cells (Jeffrey &Wright, 2006, p. pp33), and its concentration is used as an index of phytoplankton density or biomass (An & Kampbell, 2003; Wang et al.,2016).It is interesting to note in this study that there was no increase in Chl-a during the summers after 2009, and the falling point of Chl-a concentration was observed in Jul, Jun, May, Jul, and Mar in 2009,2010, 2011, 2016, and 2017, respectively. Carp was released into WY Lake in the winter, when the temperature and the fish biomass were low, and the grazing intensity of carp was also low. With increased temperature and fish biomass, the grazing pressure on algae increased and outpaced the growth of algal biomasses, resulting in a decreasing Chl-a concentration during the summer season (Fig. 3). The seasonal variation of Chl-a again proved that filter-feeding carp significantly contributed to the disappearance of cyanobacterial blooms in WY Lake.
The concentration of Chl-a is also considered to be an indicator of primary productivity in a water body (Gusha, Dalu, Wasserman, &McQuaid, 2019). In this study, negative correlation was observed between fish yield and Chl-a concentration (Table 2; Table 3). This phenomenon might be because silver carp and bighead carp take in zooplankton and organic granules in addition to phytoplankton(Xie,1999,2001; Xie & Liu, 2001). An abundance of zooplankton and organic granules would therefore disturb the correlation between fish yield and algae biomass.In addition,when the fish density was high enough,the grazing intensity exceeded the growth of the algae biomass, and there was no other food available,fish would spend a large amount of energy obtained from algae to maintain their basic metabolism and less for growth, which would also cover up the driving effects of algae on fish yield (Fig. 4). Empty gastrointestinal tracts and growth retardation of fish have been observed in fish in WY Lake during recent years (Chen et al., 2019). Furthermore, when the grazing intensity of filter-feeding fish was lower than the growth speed of algae, the algae would grow exponentially beyond fish control. In such conditions, fish grow fast while the phytoplankton biomass remains high (Fig. 4). Wang et al.(2008) noted that lakes with >100 kg/hm2year yields of silver and bighead carp had significantly higher Chl-a than those with <100 kg/hm2year.It indicated that the stocking density was not high enough in these lakes. In addition, as the microalgae exponentially grow under appropriate conditions, the Chl-a concentration would therefore fluctuate sharply over days and even during different times of the day(Banks et al., 2017; Kula, Kalaji, & Skoczowski, 2017), resulting in a weak representation of manually monitored Chl-a concentrations in eutrophic water. Therefore, no statistically significant correlation or even a negative correlation could be observed between Chl-a concentration and fish yield.
Food resources for filter-feeding carp include phytoplankton, zooplankton,and suspended particles,which all produce a lower SD.In this study, a significant negative relationship between the 3-year fish yield and SD(P <0.05;Table 2)was detected.To our knowledge,this study is one of the first to report a significant negative correlation between fish yield and SD.
4.2. Fish stocking density for cyanobacterial control
Xie and Liu (2001) suggested that the threshold biomass of filterfeeding carp was 50 g/m3to control algal bloom. Zhang et al. (2006)reported that 55 g/m3silver carp was most effective for suppressing cyanobacterial blooms,while Wang et al.(2016)reported that 70 g/m3provided the best value.In this study,no algal blooms have occurred in WY Lake since 2009, suggesting that the stocking densities were high enough to control cyanobacterial blooms. The lowest stocking density of filter feeding fish in July was 50 g/m3, with 30 g/m3silver carp and 20 g/m3bighead carp (Table 2). Our result was consistent with these reports.
The releasing density in enclosure #5 reached 54.5 g/m3in 2010,which was more than three times higher than the density in enclosure#1 in 2009 and higher than any other releasing densities in other enclosures in 2010 (Table 2). The fish density in enclosure #5 in July 2010 was also the highest (79.1 g/m3; Table 2) compared to that in other enclosures and was higher than that in enclosure#1 in July 2009(58.2 g/m3;Table 2).However,the Chl-a concentration was also higher in enclosure#5 than it was in the other enclosures,except for enclosure#1 (Table 2). Enclosure #5 is located north of WY Lake, where the SD was higher than in the southern area (Table 2). The high SD suggested that there was less food for fish growth. In contrast, enclosure #1 was located in the southern area of the lake,where the lake is connected to Suzhou City and the upstream water is rich in organic suspended particles.These suspended particles,on the one hand,could have improved fish growth and then intensive grazing on algae,and on the other hand,could have inhibited algal growth by providing shade. From the viewpoint of algal control, it seems beneficial that the water has some amount of suspended substances and that the appropriate releasing density would be increased along with SD.
4.3. Effects of filter-feeding fish on water quality
Microalgae consumed nutrients for their growth (Caporgno et al.,2015; Cuellar-Bermudez et al., 2017) and were then grazed by filterfeeding carp. Nitrogen and phosphorus were then removed from the water body with the harvested fish.From this viewpoint,stocking filterfeeding carp assisted in the removal of nutrients from the water.In this study, TN was lower after 2009 than during 2004-2007 (P <0.05;Fig. 2). However, TP was higher after 2009 than during 2004-2007(P <0.05; Fig. 2). Guo et al. (2015) reported that the TN and TAN concentrations increased while the TP concentration decreased in enclosures stocked with filter-feeding carp. Ke, Xie, and Guo (2009) reported an increased TAN, but not TN, and a slight decrease in TP in enclosures stocked with filter-feeding carp. Zhang et al. (2006) observed that the concentrations of TP and TN were generally lower in enclosures stocked with filter-feeding carp than they were in the ambient lake water measured during July and August. However, the concentrations increased remarkably and were higher in enclosures with a fish stocking biomass of 18 g/m3and 110 g/m3, but not with densities of 55 g/m3. These research results, along with the present ones, indicate that stocking with filter-feeding carp had an impact on the water nutrient levels, but might lead in a different direction depending on the complex interaction among ecosystem factors (Kane,Conroy, Richards, Baker, & Culver, 2014; You et al., 2007).
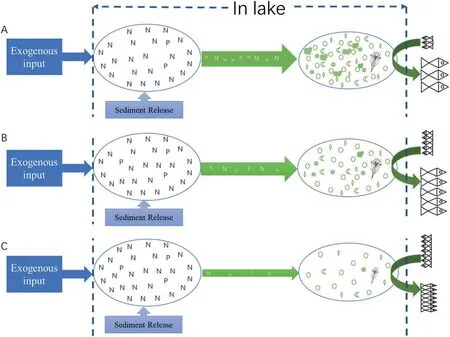
Fig. 4. A schematic diagram showed the response to stocking density on biomanipulation. The growth of algal biomass would be fast (high risk of algal bloom) if the density of the filter-feeding carp is too low. However, the speed at which algae assimilate nutrients is therefore high, and fish grows fast too (A). On the contrary, if the density of the filter-feeding carp is too high, the growth of algal biomass would be restricted (low risk of algal bloom).However, the speed at which algae assimilate nutrients is small in this case, and fish grows slowly (C). To balance the nutrients removal and the algal blooms control,filterfeeding carp should be stocked at an appropriate density (B).
Exogenous input of nutrients into the water body might be one of the main reasons for the increasing of TP in WY Lake (Yang, 2013). In case of high stocking density of filter-feeding carps, grazing on algae overcomes the growth of algal biomass and the speed at which algae uptake nutrients alls because of small biomass (Fig. 4). If the input of exogenous nutrients exceeded the uptake by algae, the nutrition level might increase (not certain, because other microbe and aquatic plants also played a role in reducing nutrition level of water body).This might be the reason for a strong negative correlation between TP and Chl-a(Table 3). This result suggested that the input amount of exogenous nutrients should be monitored in the evaluation of biomanipulation effect in the future.
Excessive stocking density is not conducive to nutrient transport to fish via algae (Fig. 4). In WY Lake, frequent fishing was conducted to catch large fish reducing the grazing pressure on microalgae providing plenty of food for the small fish. Frequent removal of large fish objectively benefits the nutrients transport and export during high stocking density, which deserves more attention.
In conclusion,the high density(50 g/m3) and SBR (>1.6) of filterfeeding fish contributed to the disappearance of cyanobacterial blooms in WY Lake and increased the water SD. Excessive stocking density of filter-feeding fish may be not conducive to nutrient export via algae.Fish yield was negatively correlated with SD in certain conditions and SD might influence the appropriate stocking density of filter-feeding fish.
Acknowledgements
This work was supported by the Twelfth Five-year-plan in the National Research Council of Science and Technology for the Rural Development in China (2015BAD13B06).We thank the managers from the United Company of West Lake Ecological Aquaculture of Suzhou and the members of the Analytical and Testing Center of Soochow University for their assistance with this study. We also thank Prof.Qigen Liu from Shanghai Ocean University for his suggestions on manuscript writing.
 Aquaculture and Fisheries2019年5期
- Aquaculture and Fisheries的其它文章
- Management of China's capture fisheries: Review and prospect
- Vulnerability of inland and coastal aquaculture to climate change:Evidence from a developing country
- Changes in the phytoplankton community structure of the Backshore Wetland of Expo Garden, Shanghai from 2009 to 2010
- Community structure of benthic macroinvertebrates in reclaimed and natural tidal flats of the Yangtze River estuary
- Tilapia processing waste silage (TPWS): An alternative ingredient for Litopenaeus vannamei(Boone,1931)diets in biofloc and clear-water systems