
Vulnerability of inland and coastal aquaculture to climate change:Evidence from a developing country
2019-09-19 02:39MdMonirulIslamAparnaBarmanGoutamKumarKunduMdAlamgirKairBijoyaPaul
Aquaculture and Fisheries 2019年5期
Md Monirul Islam,Aparna Barman,Goutam Kumar Kundu,Md Alamgir Kair,Bijoya Paul
a Interdisciplinary Centre for Conservation Science, Department of Zoology, University of Oxford, Oxfor d OX1 3PS, UK
b Department of Fisheries, University of Dhaka, Dhaka 1000, Bangladesh
c School of Earth Sciences and Environmental Engineering, Gwangju Institute of Science and Technology, 123 Cheomdangwagi-ro, Buk-gu, Gwangju 61005, South Korea
Keywords:Aquaculture Coastal Inland Vulnerability Climate change Bangladesh Developing country
ABSTRACT Developing countries,which contribute 90%of global aquaculture production,are considered global climate risk hotspots. However, no study focuses on measuring district- or sub-national-level aquaculture vulnerability to climatic hazards or disasters. This study has measured the level of aquaculture vulnerability to climate variability and change in all 64 districts of Bangladesh using a composite vulnerability index approach (using 19 climatic, environmental and socio-economic indicators) and geographical information system(GIS). The results reveal that aquaculture in 12 districts namely Satkhira, Mymensingh, Panchagarh, Lalmonirhat, Nilphamari,Thakurgaon, Sunamganj, Dinajpur, Kurigram, Noakhali, Lakshmipur, and Cox's Bazar have very high vulnerability (in order of highest to lowest vulnerability), which are explained by their higher level of exposure,moderate level of sensitivity, and lower to moderate level of adaptive capacity. Among these, 8 districts belong to inland and 4 districts to coastal regions of the country. Three districts, namely Dhaka, Chittagong, and Bandarban,have the lowest level of aquaculture vulnerability(in order of lowest to highest vulnerability)mainly because of very high adaptive capacity and moderate or low level of sensitivity and exposure. This study will punctuate the vulnerability of inland aquaculture and develop and prioritize actions to reduce the climatic impacts.
1. Introduction
Aquaculture is the fastest growing food producing sector globally,with production increasing from about 4 million tonnes in 1970 to 73.8 million tonnes in 2014(FAO,2016).To date,50%of the world's human fish consumption comes from aquaculture and about 18 million people are engaged in fish farming, of which 94% are from Asia (FAO, 2016).Thereby, a developing Asia dominates the world's aquaculture production, accounting for 88.9% of the total volume (FAO, 2016). Bangladesh, the 5th largest aquaculture producer in the world, providing 56.8% of total national fishery production (DoF, 2017), was chosen as study area among the developing countries because aquaculture comprises a significant contribution of the country's rural economy through farm incomes and on- and off-farm employment. This sector provides about 60% of the animal protein intake and more than 11% of its 160 million residents are directly or indirectly involved in this sector for their livelihoods.
Two types of aquaculture are practiced in Bangladesh: freshwater and coastal. Freshwater culture mainly includes pond farming of carps(indigenous and exotic), cichlids, and catfishes, accounting for more than 80%of the total recorded aquaculture production(Shamsuzzaman et al.,2017).Other freshwater culture areas include oxbow lake,prawn farm, and seasonal cultured water-body (paddy field and floodplain)farming of indigenous species including climbing perch, catfishes, and minnows (DoF, 2017). Coastal aquaculture is mainly comprised of shrimp and prawn farming in ghers (coastal pond or enclosures), but cage and pen culture are also practiced (DoF, 2017). Inland pond culture represents the mainstay of aquaculture in Bangladesh, where aquaculture production systems are mainly extensive and improved extensive, with some semi-intensive and intensive systems in very few cases (Hossain, 2014). Future growth in aquaculture is essential to provide sustainable supplies of fish for human nutrition, creating jobs,and meeting the food security of the rapidly growing population.However, climate variability and climate change are major challenges to aquaculture, as it heavily depends on the availability and quality of natural resources, most critically the water.
Climate-induced vulnerability could vary region-to-region depending on climatic zones, geographical areas (inland or coastal), typeof aquaculture system, and which species is farmed. Coastal areas are more exposed to climatic hazards than those located inland.The United Nations Federal Coastal Zone Management Act defines‘the coast’as‘the coastal waters and the adjacent shorelands strongly influenced by each other and includes island,transitional and intertidal areas,salt marshes,wetlands, and beaches. The zone extends inland from the shorelines only to the extent necessary to control shorelands, the uses of which have a direct and significant impact on the coastal waters’ (Haslett,2009). In Bangladesh, there are nineteen coastal districts and the 45 other districts are inland (MoWR, 2006). Inland areas are affected by changes in flooding, temperature, and precipitation, while the coastal areas are affected by these three in addition to a rise in sea level, wave heights, and accelerated land erosion (Cabral et al., 2017; Zsamboky,Fernández-Bilbao,Smith,Knight,&Allan,2011).However,the level of impacts may not be the same for each of these hazards. The vulnerability of a system depends not only on the impacts of hazards,but also on the sensitivity and adaptive capacity of the system(Parry,Canziani,Palutikof, Linden, & Hanson, 2007). As such, inland areas may not be always less vulnerable compared to coastal areas. The coastal region has been the quickest to develop plans for dealing with climate changerelated disasters and hazards, while inland region hazard plans do not discuss climate change (Babcock, 2013). Also, most of the national plans and funding emphasize coastal areas rather than inland areas,but inland areas may also need to develop policy and plans to tackle climate change.
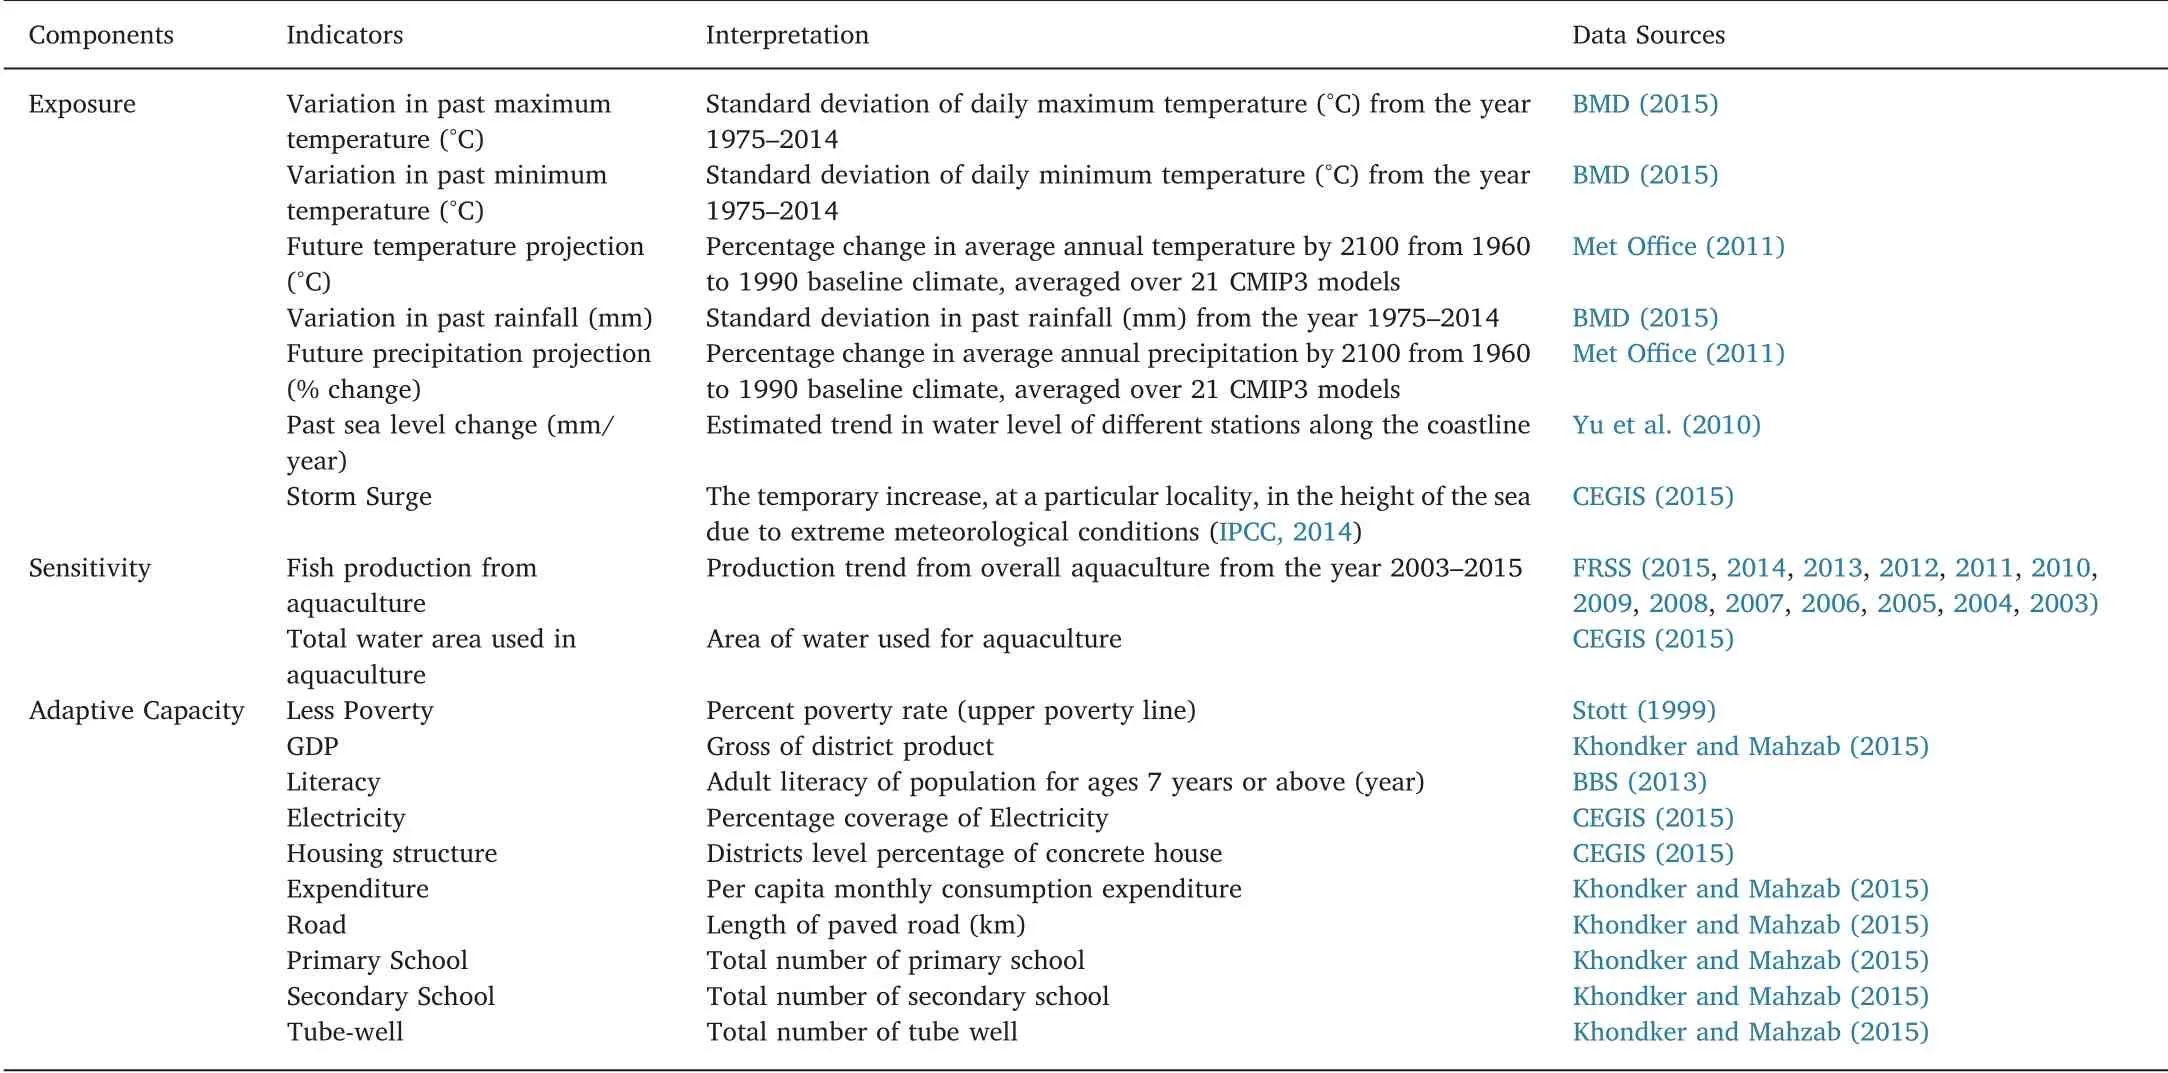
Table 1 Indicators used to calculate exposure, sensitivity and adaptive capacity, and their interpretation.
Bangladesh has 64 districts possessing different geographical characteristics and faces various climatic hazards and disasters. For instance, the northwestern region of Bangladesh has suffered from climate-induced prolonged drought and acute water shortage (Shahid &Hazarika, 2010); the central zone and northeastern regions have suffered from frequent flood, flash flood, and river erosion; and coastal areas have faced cyclones, tidal surge, water logging, saline intrusion,and sea level rise (Shamsuddoha & Chowdhury, 2007). Therefore, it is important to identify the region and/or district aquaculture vulnerability to climate variability and change. This study contributes to this question on which scant research has been conducted. Ali (1999) has given a conceptual statement on overall fish resource vulnerability and adaptation to climate change. Handisyde, Ross, Badjeck, and Allison(2006) have conducted a case study and GIS-based assessment of aquaculture-related vulnerability to climate change at the national level. However, to date, no study has been conducted to measure the district-level vulnerability of aquaculture. Hence, this is the first systematic approach to measure the degree of vulnerability of aquaculture sector to climate variability and change of 64 districts in Bangladesh using a composite vulnerability index approach. We intend to assist national planners and policymakers to build effective planning and develop district-specific adaptation strategies to minimize the aquaculture sector to climate variability and climate change risk.
2. Materials and methods
The study was conducted in 64 districts of Bangladesh.A total of 21 climatic, environmental, and socio-economic indicators were selected for the three components of vulnerability: exposure, sensitivity, and adaptive capacity. The data were analyzed using a composite vulnerability index approach and aquaculture vulnerability was calculated and mapped for 64 districts in Bangladesh.
2.1. Selection of indicators of vulnerability
Aquaculture vulnerability can be defined as the degree to which an aquaculture system or farming operation is susceptible to, or unable to cope with, the adverse effects of climate change, including climate variability and extremes (adapted from Parry et al., 2007). There are three main components of vulnerability (V) as defined by the IPCC:exposure (E), sensitivity (S), and adaptive capacity (AC). Vulnerability is the combined effect of these three components (Parry et al., 2007).
2.1.1. Exposure
Exposure can be defined as the presence of aquaculture-based livelihoods, aquatic species or ecosystems, environmental functions,services, and infrastructure that could be adversely affected by climate variability and change(adapted from IPCC,2014).Exposure indicators selected for aquaculture included variations in past temperature and rainfall, sea-level rise, future temperature and rainfall projection, and storm surge (Table 1).
Increasing water temperature can produce physical changes in pond environment, such as shifts in dissolved oxygen levels that produce more frequent harmful algal blooms and increased incidence of parasitic diseases (Karvonen, Rintamäki, Jokela, & Valtonen, 2010). Toxic substances present in water (e.g. cyanide, phenol, xylene, and zinc)exhibit increased toxicity at elevated temperature. Mass mortalities from harmful algal blooms during summer months has been reported(Rijnsdorp, Peck, Engelhard, Mollmann, & Pinnegar, 2009). Moreover,low temperatures during winter also causes mortality, especially in smaller fish that have fewer energy reserves compared with larger conspecifics (Rijnsdorp et al., 2009). The timing of ovulation and egg quality of fishes are also affected by temperatures experienced during the breeding season (Tveiten, Solevag, & Johnsen, 2001). Rising temperature may affect hatchery-based fish seed production across Bangladesh. Indian major carps and Chinese carps, the main species of aquaculture production in Bangladesh, depend on hatchery-based seed production and are significantly affected by rising temperature. Variation in past maximum temperature, variation in past minimum temperature, and future temperature projections were considered as exposure indicators in this study.
Low rainfall reduces the water available in culture ponds, resulting in higher cost to maintains pond waters.Coastal freshwater aquaculture might be affected by sea level rise via pond inundation and salinity intrusion, respectively. Sea level rise may also exacerbate coastal erosion and flooding of the coastal areas,thereby dislodging coastal fishing settlements and infrastructure (Akankali & Jamabo, 2012). It can also reduce freshwater availability and cause salt intrusion into groundwater. Increased frequency and/or intensity of storm surge and cyclones may cause loss of and damage to aquaculture stock, gear, and facilities.
2.1.2. Sensitivity
The sensitivity indicators selected for this study were(i)total water area used for culture and (ii) fish production from aquaculture(Table 1). If a district is highly dependent on fishes for employment,income, and dietary protein, it will more likely to be impacted by climate-related change (Allison et al., 2009). In this study, the districts that have higher aquaculture dependency have the highest sensitivity,whereas districts with lower aquaculture dependency have the lowest sensitivity.
2.1.3. Adaptive capacity
Adaptive capacity,in the context of this study,is the ability of a fish farmer's community and/or relevant stakeholders to mitigate the adverse impacts of climate change by exercising,for example,educational skill, infrastructure development, and networking. Development of human, institutional, and financial management capacities, which promote effective adaptation and good adaptation practices,reduce the vulnerability to expected climate change. Appropriate infrastructure(e.g. houses, tube-wells, paved roads, schools, and colleges) and technology to facilitate better livelihoods and reduce the vulnerability of the poor (Sperling, 2003). Hence, less poverty, gross domestic product(GDP), literacy, primary and secondary schools, electricity, housing structure, tube-wells, expenditures, and roads were considered as adaptive capacity indicators for this study (Table 1).
2.2. Composite vulnerability index approach
A composite index approach, a type of measurement system that computes vulnerability indices by aggregating data for a set of indicators,was used to conduct a vulnerability assessment.The four steps of calculation included selecting indicators, standardizing indicators,calculating sub-indices, and calculating vulnerability.
2.2.1. Data analysis
Quantitative data collected from various organizations and reports were processed in Microsoft Excel(2013).Three exposure datasets(i.e.variation in past maximum temperature, minimum temperature, and past rainfall) were processed in two steps. Firstly, standard deviations of daily climatic data (max/min temperature and rainfall) for each month from the year 1975-2014 were calculated and then mean deviations were taken to conduct the analysis. The indicators (described in Table 1) were weighted in a different scale and normalized in 0-1 scale using formula (1).

Where, Indexsiis a normalized value of an indicator; Si=is the actual value of the same indicator; Smax=is the maximum value of the same indicator; and Smin=is the minimum value of the same indicator.
Fish production has been used as a positive indicator of sensitivity,where more production is less sensitive.However,formula(1)gives the inverse result(the highest production gives a value of 1 and the lowest production gives a value of 0). So, the standardized values of fish production (found from formula (1)) were further processed to obtain the final sensitivity value using formula (2).

As a negative indicator of sensitivity, total water area used for aquaculture was not inverted, as greater water area has more sensitivity. After standardization, the respective values were combined and again scaled from 0 to 1 using formula (1) to calculate the sub-indices for exposure, sensitivity, and adaptive capacity. Adaptive capacity might reduce the potential impact (PI) of climate change, which is a function of exposure and sensitivity.Two types of approaches,additive and multiplicative, can be used to create a composite vulnerability index as stated in formula (3 and 4),respectively(Allison et al., 2009).
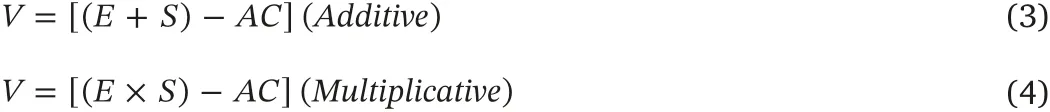
Where, V = Vulnerability; E=Exposure; S = Sensitivity; and AC=Adaptive Capacity.
In the additive approach, the final vulnerability values depend equally on all three components(i.e.exposure,sensitivity and adaptive capacity) (Hajkowicz, 2006). In the multiplicative approach, exposure and sensitivity values are weighted one-quarter each and the adaptive capacity value is weighted one-half of any vulnerability score (Allison et al., 2009). However, there are limitations in robust weighting method (Deressa, Hassan, & Ringler, 2008). Therefore, an additive method of vulnerability was used in this study(Adger&Vincent,2005).
While calculating the vulnerability indices, the indicators can be used as either equal/unweighted (Allison et al., 2009; Hahn, Riederer,& Foster, 2009; Sullivan, Meigh, & Fediw, 2002) or variable/weighted(Eakin & Bojórquez-Tapia, 2008; Gbetibouo, Ringler, & Hassan, 2010;Vincent, 2007). Equal weighting can be used for multiple sets of users and the findings can be scaled up more confidently(Hahn et al.,2009).However, all the indicators might not be uniformly significant for each district and different weights should be given during sub-indices construction (Blaikie, Cannon, Davies,&Wisner,1994;Bohle, Downing, &Watts,1994;Eakin&Bojórquez-Tapia,2008).Again,the currently used weighting methods are either considered to be subjective (e.g., expert judgment)or statistically biased(e.g.,principal component analysis and regression analysis) (Islam, 2013). Given, these limitations in robust weighting method (Deressa et al., 2008), this study has used equal weight for each indicator (Sullivan et al., 2002).
2.3. Mapping of vulnerability
Vulnerability values were also normalized using formula (1). For mapping vulnerability of aquaculture, the normalized values of exposure, sensitivity, adaptive capacity, and vulnerability were dividedinto four quartiles,where quartile 1,2,3 and 4 were categorized as low,moderate, high,and very high,respectively. These values were used to create exposure, sensitivity, adaptive capacity, and vulnerability maps by district using ArcMap 10.3 - a geospatial processing program. Vulnerability values were entered for the administrative boundary of different districts of Bangladesh and marked with different color bases on the level of vulnerability.
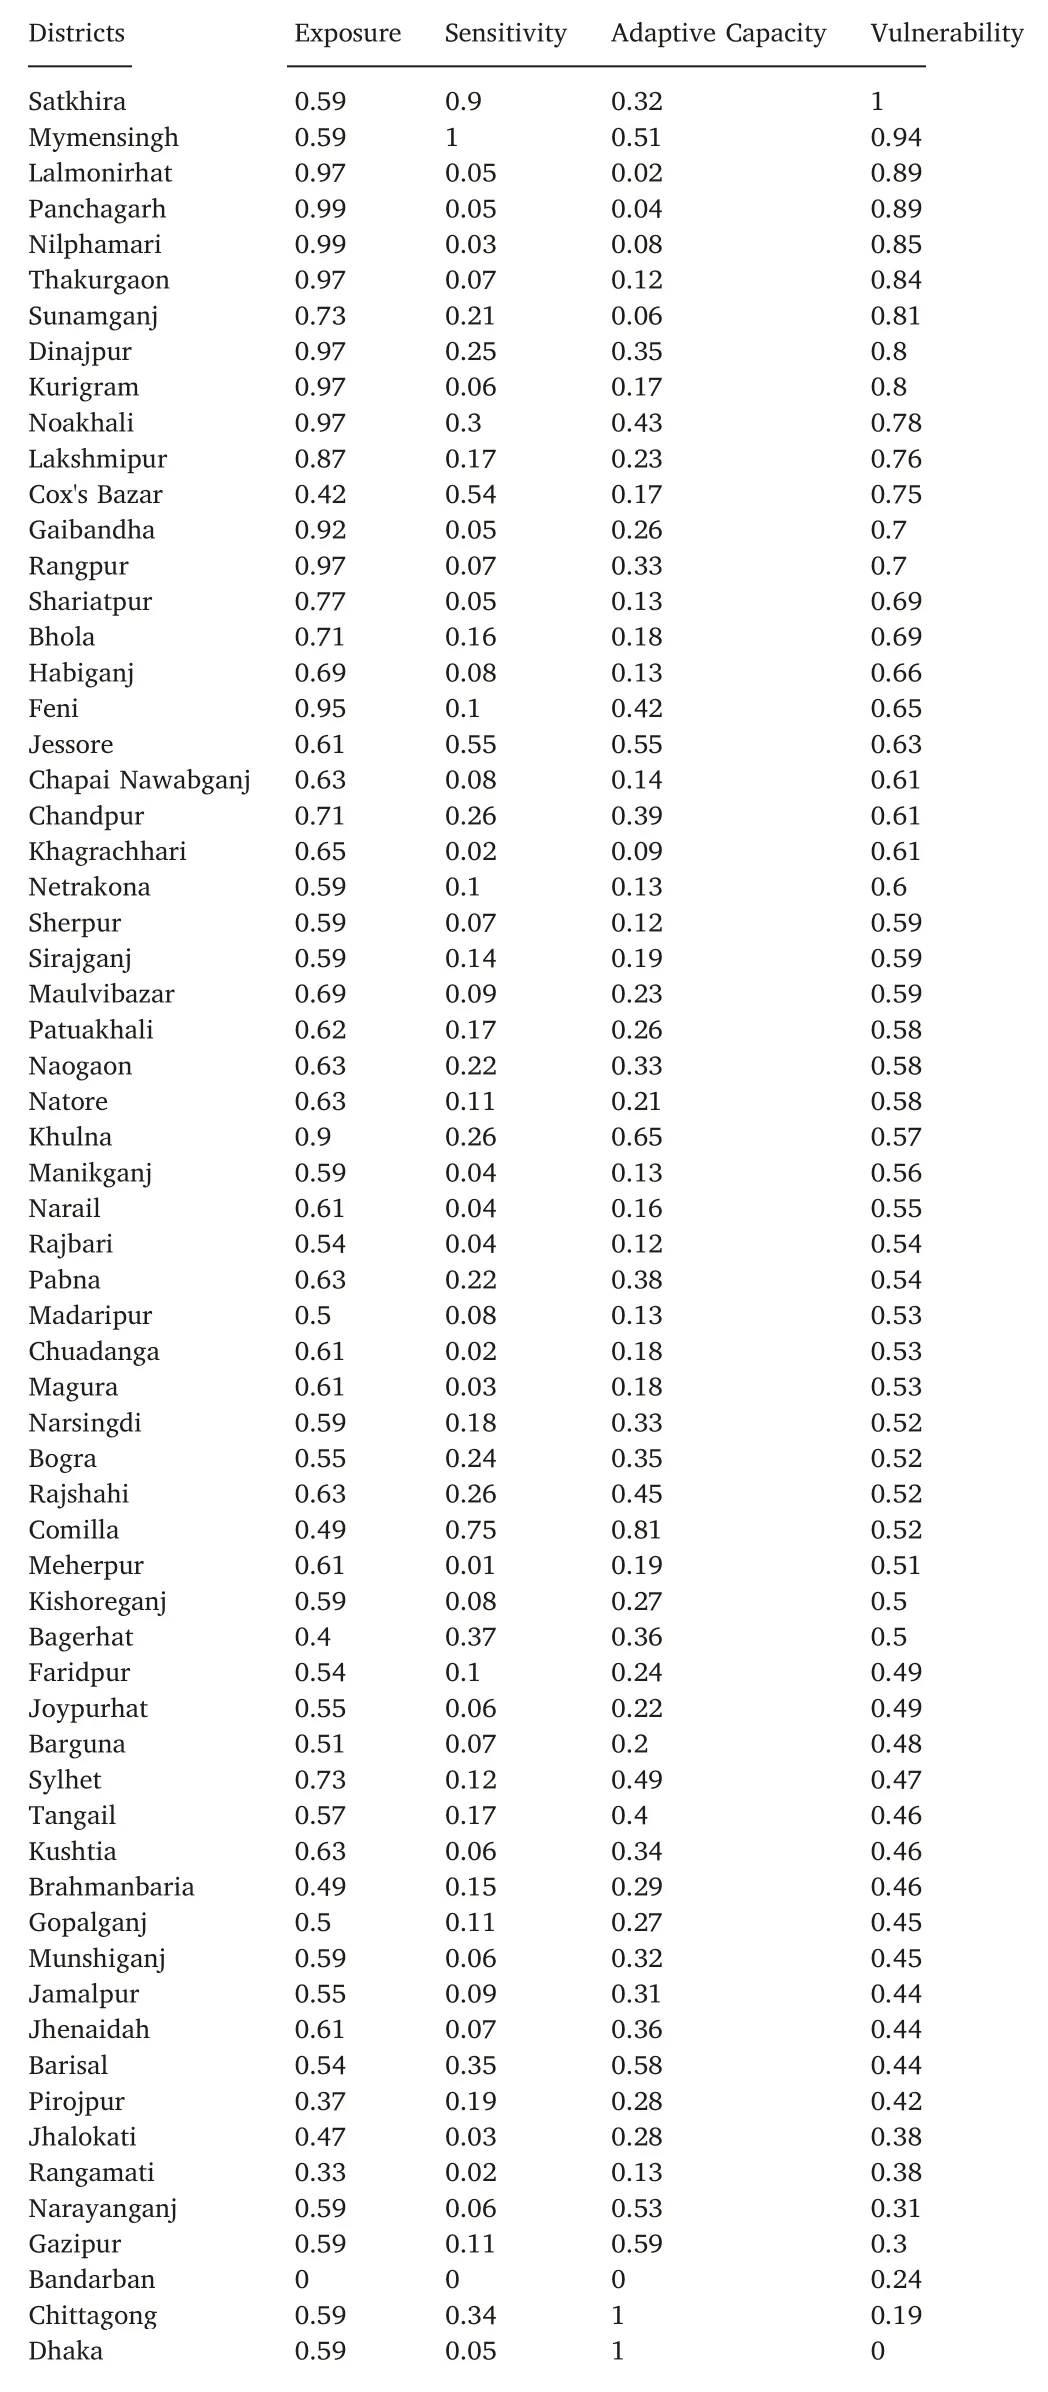
Table 2 Vulnerability values for aquaculture in relation to the values of exposure,sensitivity, and adaptive capacity of 64 districts in Bangladesh.
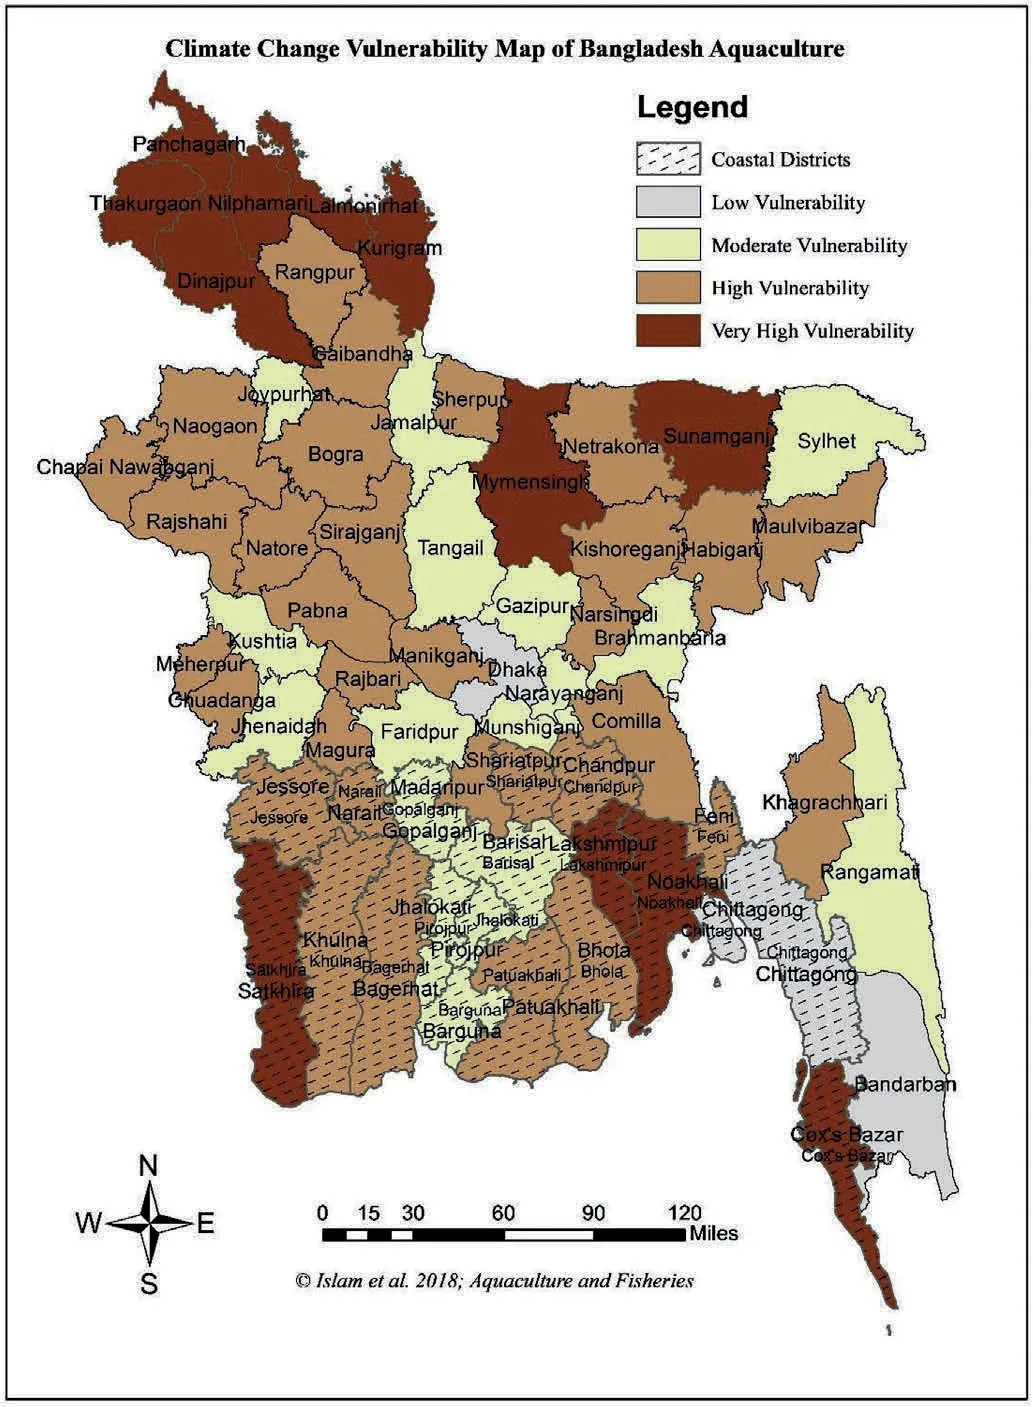
Fig.1. Exposure to climate variability and change of aquaculture in the districts of Bangladesh.
3. Results and discussion
3.1. Exposure
The normalized values of exposure indicators in the 64 districts are presented in Table 2 and the exposure of the aquaculture sector to climate change is shown in Fig. 1. The categorized exposure values are show that all 13 districts are very highly exposed to climate change,spanning the 8 districts (>61.5%) belonging to the inland (northwestern) region (Nilphamari, Panchagarh, Kurigram, Lalmonirhat, Dinajpur, Rangpur, Thakurgaon, and Gaibandha) and 5 districts (Noakhali,Feni,Khulna,Lakshmipur and Shariatpur)in coastal region of the country.
3.2. Sensitivity
The normalized values of sensitivity indicators are presented in Table 2.About 80%of the districts(51 districts)fall into low sensitivity areas. The sensitivity results show that coastal districts are more sensitive than inland areas. Among very highly sensitive districts for aquaculture, two districts belong to the inland region (Mymensing and Comilla), and only the Satkhira district was in the coastal region(Fig. 2). Among highly sensitive districts, both Jessore and Cox's Bazar were in the coastal region of the country. Among moderately sensitive districts,only Dinajpur and Rajshahi belong to the inland region;rest of the districts (Khulna, Bagerhat, Barisal, Chandpur, Noakhali, and Chittagong) were in the coastal region of the country.
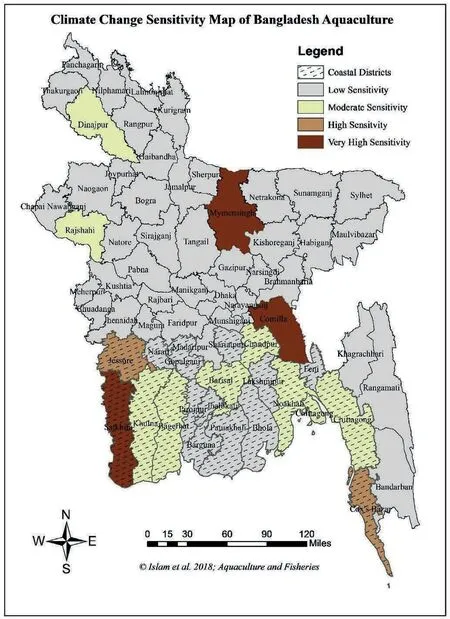
Fig. 2. Sensitivity to climate variability and change of aquaculture in the districts of Bangladesh.
3.3. Adaptive capacity
Most districts (85%) have low or moderate adaptive capacity and were distributed throughout the country (Table 2 and Fig. 3). Only 6 districts have high adaptive capacity,3 of them(Mymensingh,Gazipur,and Narayanganj) belong to the inland region, and other 3 (Jessore,Khulna, and Barisal) belong to the coastal region. Only 3 districts have very high adaptive capacity;2 of them(Dhaka and Comilla)were in the inland region and 1 (Chittagong) was in the coastal region of the country.
3.4. District vulnerability
The results show that there is a strong spatial pattern in the vulnerability of aquaculture in Bangladesh. Among the very highly vulnerable 12 districts in the aquaculture sector(18.75%of all districts),8 districts (Mymensingh, Panchagarh, Lalmonirhat, Nilphamari,Thakurgaon,Sunamganj,Dinajpur,and Kurigram)belong to the inland region, whereas 4 districts (Satkhira, Noakhali, Lakshmipur, and Cox's Bazar) were in coastal region of the country. 66.67% of all highly vulnerable districts, (8 districts, namely: Panchagarh, Lalmonirhat,Nilphamari, Thakurgaon, Dinajpur, Kurigram, Mymensingh, and Sunamganj) belong to the inland region (northern and north-western area) of the country (Fig. 4). Only 33.33% (4 districts) of vulnerable districts were in the coastal region of Bangladesh. Three districts,Dhaka, Chittagong, and Bandarban have the lowest vulnerability in aquaculture,with Chittagong located in the coastal and other two in the inland region.
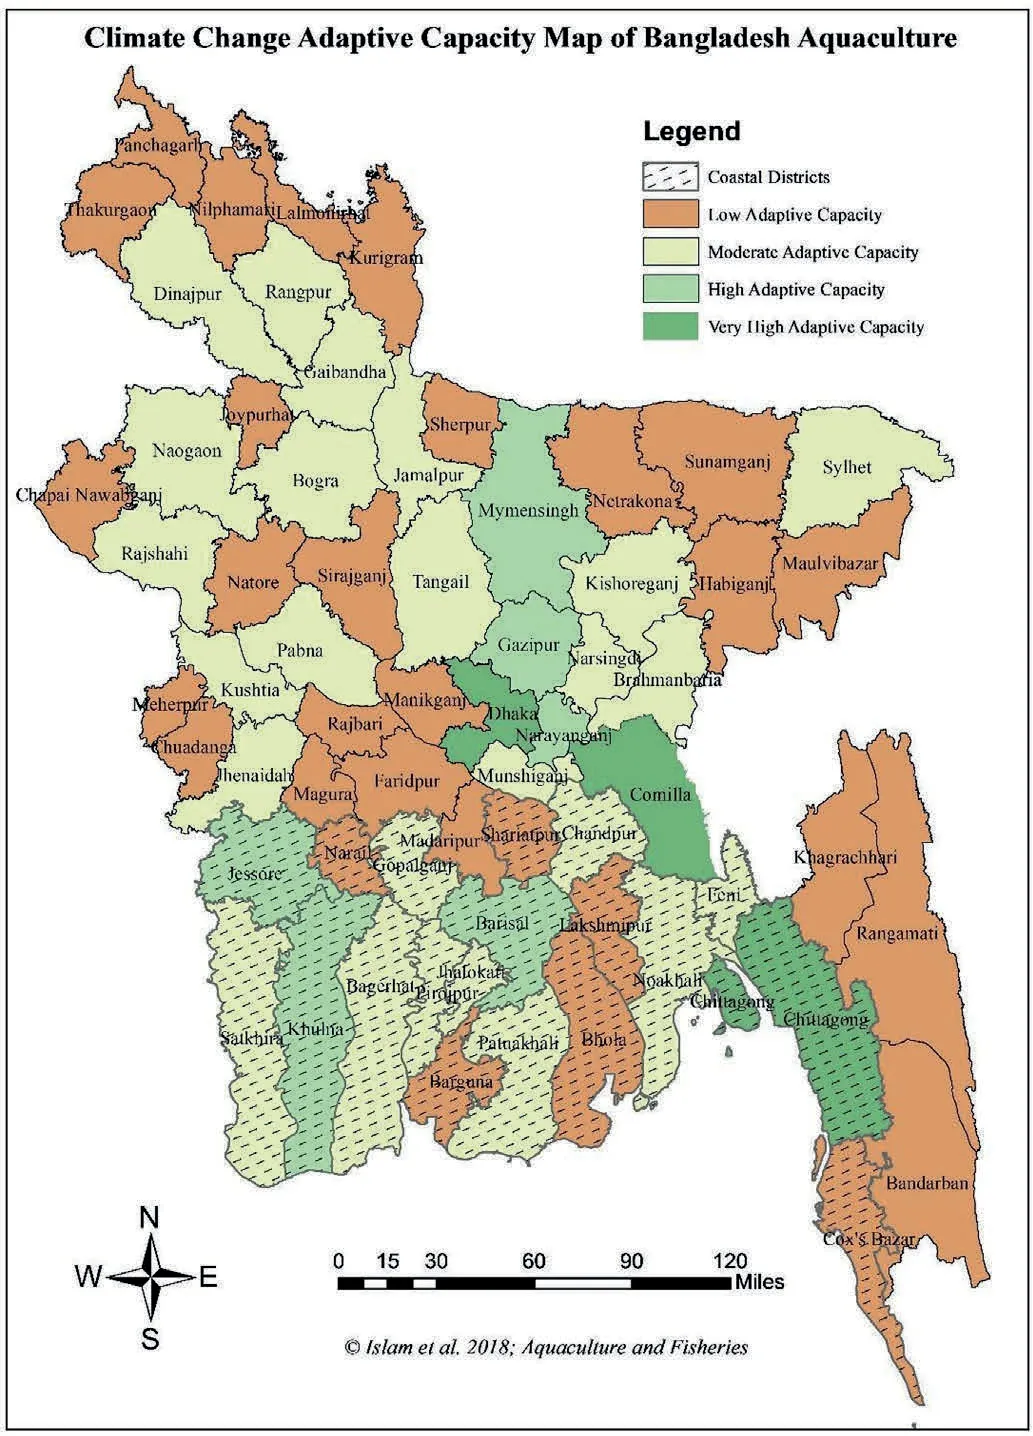
Fig.3. Map of aquaculture adaptive capacity to climate variability and change in the districts of Bangladesh.
As stated above, coastal areas have been considered more vulnerable than inland areas (Zsamboky et al., 2011) and most of the funding agencies and government interventions concentrate towards coastal areas,but the findings of the study reveal that inland areas with aquaculture are not less vulnerable than coastal areas. Out of 12 districts, 8 with a very high vulnerability fall within the inland (northern and north-western sides) region of the country. Several studies have shown that north and northwestern districts of Bangladesh are suffering from extreme temperatures and high rainfall variability, resulting in highest risk to drought/water stress (Huq & Ayers, 2008; Ramamasy &Baas, 2007; Shahid & Behrawan, 2008; Shahid & Hazarika, 2010).Groundwater becomes the only source of water during the dry period in this region and most groundwater is used for irrigation purposes,so fish farmers have access to insufficient water. In recent decades, the hydroclimatic environment of northwestern districts of Bangladesh has been aggravated by cross-country anthropogenic interventions, such as construction of a barrage in the upstream of Ganges River and diversion of water by India, which reduced the water discharge of the Ganges River in Bangladesh from 3700 m3/s in 1962 to 364 m3/s in 2006(Shahid & Hazarika, 2010). This has significantly reduced the water availability in the dry season for aquaculture, agriculture, and other uses. Moreover, fish farmers of both the northern and north-western parts of the inland region are comparatively illiterate and very poor.This is probably due to geographic location, as these districts are located far from the capital, Dhaka (Sperling, 2003) and are less able to adapt to the adverse impacts of climate change.
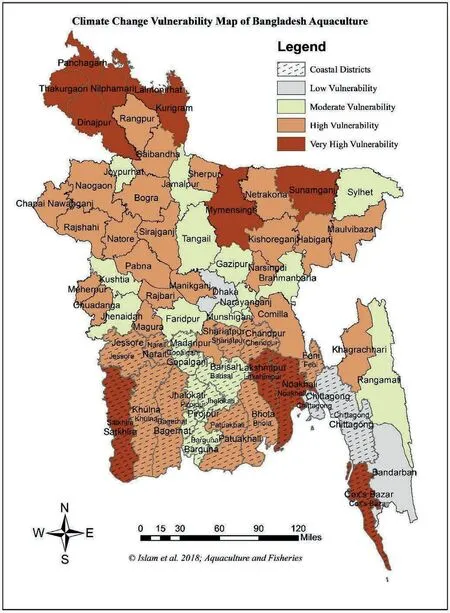
Fig. 4. Vulnerability to climate change of aquaculture in the districts of Bangladesh.
The very high vulnerability of a few coastal districts was due to the fact that they are very highly exposed to climatic hazards such as cyclones, floods, riverbank erosion, and salinity problems (Met Office,2011; Minar, Hossain, & Shamsuddin, 2013). Most of the least vulnerable districts (e.g. Dhaka, Chittagong) were big cities with high adaptive capacity and comparatively low levels of climatic exposure and sensitivity. Fish farmers in these districts are more socio-economically developed than other parts of the country and more capable to adapt with adverse climatic events.
This study is not a critique. It has identified the districts that have very high, high, moderate, and low vulnerability to climate change regarding aquaculture using district-level secondary data, yet more specific data on indicators like expenditure and poverty collected exclusively from the aquaculture-dependent people would give a more precise result. The indicators used in this study were weighted equally and, therefore, limiting. Moreover, this study considered the district aquaculture sector as a single unit,but the value of different indicators may vary across different culture habitat and species, which might make one district more or less vulnerable to climate change impacts.
4. Conclusions
The findings of the study have indicated that the vulnerability of aquaculture varies between region to region based on different climatic exposures, sensitivity of the system, and adaptive capacity different districts in Bangladesh. Both inland and coastal regions have different levels of vulnerability, with more inland districts found to be very highly vulnerable compared to the coastal ones.Inland water bodies are huge in number compared to coastal water habitat for aquaculture in Bangladesh with 80% fish farmers practicing aquaculture in inland areas. Therefore, there is an urgent need to respond to climate change impacts by increasing the adaptive capacity of inland fish farmers.Most of the organizations in Bangladesh produce national-level data and this study provides an important starting point for directing future research into the vulnerability of aquaculture to climate change at the local level. This study recommends future research on the vulnerability of various subsectors of aquaculture, such as mariculture, case culture,aquatic weeds culture, flood-plain aquaculture, and pond aquaculture.
Acknowledgments
We are grateful to the organizations and individuals that provided the data for this study. We would also like to thank the anonymous reviewers for their useful comments.
 Aquaculture and Fisheries2019年5期
- Aquaculture and Fisheries的其它文章
- Management of China's capture fisheries: Review and prospect
- Biological manipulation of eutrophication in West Yangchen Lake
- Changes in the phytoplankton community structure of the Backshore Wetland of Expo Garden, Shanghai from 2009 to 2010
- Community structure of benthic macroinvertebrates in reclaimed and natural tidal flats of the Yangtze River estuary
- Tilapia processing waste silage (TPWS): An alternative ingredient for Litopenaeus vannamei(Boone,1931)diets in biofloc and clear-water systems