
Chemometric identification of canonical metabolites linking critical process parameters to monoclonal antibody production during bioprocess development☆
2019-08-07 07:54LijuanShenXuYanLeiNieWenyanXuShiweiMiaoHaibinWangFaiPoonHaibinQu
Lijuan Shen,Xu Yan,Lei Nie,,Wenyan Xu,Shiwei Miao,Haibin Wang,H.Fai Poon,Haibin Qu,*
1 Pharmaceutical Informatics Institute,College of Pharmaceutical Science,Zhejiang University,Hangzhou 310058,China
2 Zhejiang Hisun Pharmaceutical Co.,Ltd.,Fuyang,Hangzhou 311404,China
Keywords:Canonical metabolites Chemometrics Critical process parameters Metabolomics Protein titer
ABSTRACT A deeper understanding of the biological events occurring when bioprocess parameters changed will be of great value in improving the monoclonal antibodies(mAbs)production.Design of experiment(DoE)was applied to investigate the effect of process parameters(pH,temperature shift and dissolve oxygen(DO))on protein titer.The key metabolites connecting the critical process parameters(CPPs)with monoclonal antibody production were identified by different chemometrics tools.Finally,the biological events of marker metabolites relating with titer improvement were concluded.pH and temperature shift were identified as CPPs that affect the target protein titer. A series of metabolites influenced by the altered CPPs and correlated with protein titer were screened by principal component analysis(PCA)and Pearson’correlation test. The marker metabolites and their pathways linking CPPs to target protein titer in different culture phases were summarized.Metabolomics and chemometrics are promising data-driven tools to shine light into the biological black box between the bioprocess parameters and process performance.
1.Introduction
Chinese hamster ovary(CHO)cells are frequently preferred hosts for industrial production of recombinant therapeutic proteins[1].Ensuring the consistency of target protein production and critical quality attributes(CQAs)on batch-to-batch is a key issue for bio-manufacturers.As is known,cell line[2],condition of bioreactor(pH[3],temperature[4], dissolved oxygen (DO) [5], sparging rate [6,7], agitation [6]),medium[8],additives[9]and by-products[10]had impact on the cell growth and protein production during cell culture. To obtain higher productivity,the optimal process parameters need to be determined by experiments in laboratory-scale.
In the past few years, Quality by design (QbD) is advocated to be implemented in biopharmaceutical for manufacturing process understanding and process control [11]. Although many studies have focused the impact of process parameters on the bioprocess outcomes,such as viable cell density(VCD),protein productivity and glycosylation[12-14],the connections between them have not been wildly investigated[15].
Advance of system biology (genomics [16], transcriptomics [17],proteomics and metabolomics[18])enables data-driven studies of the biological events in a complex system[19].Among them,metabolomics is a common omics method to profile essential nutrients and byproducts produced in cell culture [20-22]. Then, chemometrics is suggested to extract characteristic metabolites associated with dynamic bioprocess.
Based on our previous studies,we found that pH,DO and temperature shift most frequently affect the target protein titer in CHO cell culture.In order to improve the understanding of bioprocess,metabolomics and different chemometrics tools were utilized to establish the metabolic connection between critical process parameters(CPPs)and CQA in the current study.
2.Material and Methods
2.1.Cell culture
MAbs producing CHO cell line was inoculated in 2 L bioreactors.Different levels of bioprocess parameters,pH,temperature shift and DO content were listed in Table S1. Samples for metabolic studies were collected on the 3rd,6th,9th and 12th days of the culture to ensure the entire spectrum of growth profile. 50 ml of cell culture was centrifuged at 10000g for 5 min and the supernatants were stored at-80°C prior to analysis.The titers were measured by an Agilent 1260 HPLC system(Agilent Technologies,Santa Clara,CA,USA).
2.2.Sample preparation
Samples were thawed at room temperature.600 μl of acetonitrile,and 20 μl of internal standard(IS,digoxin,0.02 mmol·L-1)were added into 200 μl of the samples to precipitate the proteins in the samples.The supernatant of vortexed mixture was transferred to a clean Eppendorf tube and evaporated at 35 °C for 3 h using a vacuum concentrator (SPD 121P,Thermo Electron Corporation, Asheville, NC, USA). The residue was reconstituted using deionized water.After centrifugation at 12000g for 5 min,5 μl aliquot of the supernatant was injected for analysis.All samples were pooled into a master mix solution for identification of all detectable metabolites as well as for validation of quantitative method.
2.3.Metabolic analysis
The qualitative analysis of metabolites was performed by a Waters ACQUITY UPLC(Waters Corp.,Milford MA,USA)equipped with an AB Triple TOF 5600plusSystem (AB SCIEX, Framingham, MA, USA). An HPLC-MS/MS system was used for semi-quantitative analysis.Mobile phase A was deionized water with 0.1% formic acid (v/v). Mobile phase B contained acetonitrile and 0.1% (v/v) formic acid. The chromatographic and MS conditions were described in supplementary material.PeakView 1.2.0.3 workstation(AB SCIEX,Framingham,MS,USA) and Analyst TF (version 1.6, AB SCIEX, Foster City, CA, USA)software were applied to analyze the data.The instrument precision,repeatability and stability of HPLC-MS/MS method were investigated in positive and negative modes.
3.Data Analysis
Log-transformation was applied before scaled to unit variance.The data was used to develop PLS and PCA model by SIMCA-P software(version 13.0.0.0,Umetrics AB,Umeå,Sweden).Pearson’s correlation test was performed between the metabolites and quality attribute(monoclonal antibody titer)in different culture phases using Matlab(version R2012b,MathWorks,Cambridge,MA,USA).
4.Results and Discussion
4.1.Metabolic analysis
The parameters of 76 metabolites and the result of methodology by HPLC-MS/MS analysis were listed in Table S2.The analyzed metabolites were mainly amino acids,intermediate products of tricarboxylic acid cycle(TCA),nucleosides and carbon source.
4.2.Identification of CPPs associated with mAbs production
The different process parameters(pH,DO and temperature shift)as X and titer as Y,were modeled by PLS to identify CPPs(Supplementary Fig.1).The value R2Y was 0.898,which represented that the extracted principal component could sufficiently explain the alteration in Y.The coefficients of process parameters,pH,DO and temperature shift were 0.656, 0.219 and -0.569 respectively. pH and temperature shift showed statistically significant impact on titer(the error bars did not cross the 0 line).DO showed little impact on titer(absolute value of coefficient <0.5).Therefore,pH and temperature shift were identified as CPPs for titer.The similar result has been reported the cell growth rates under oxygen levels of 10%to 100%had no significant difference compared with that under 50%[14].
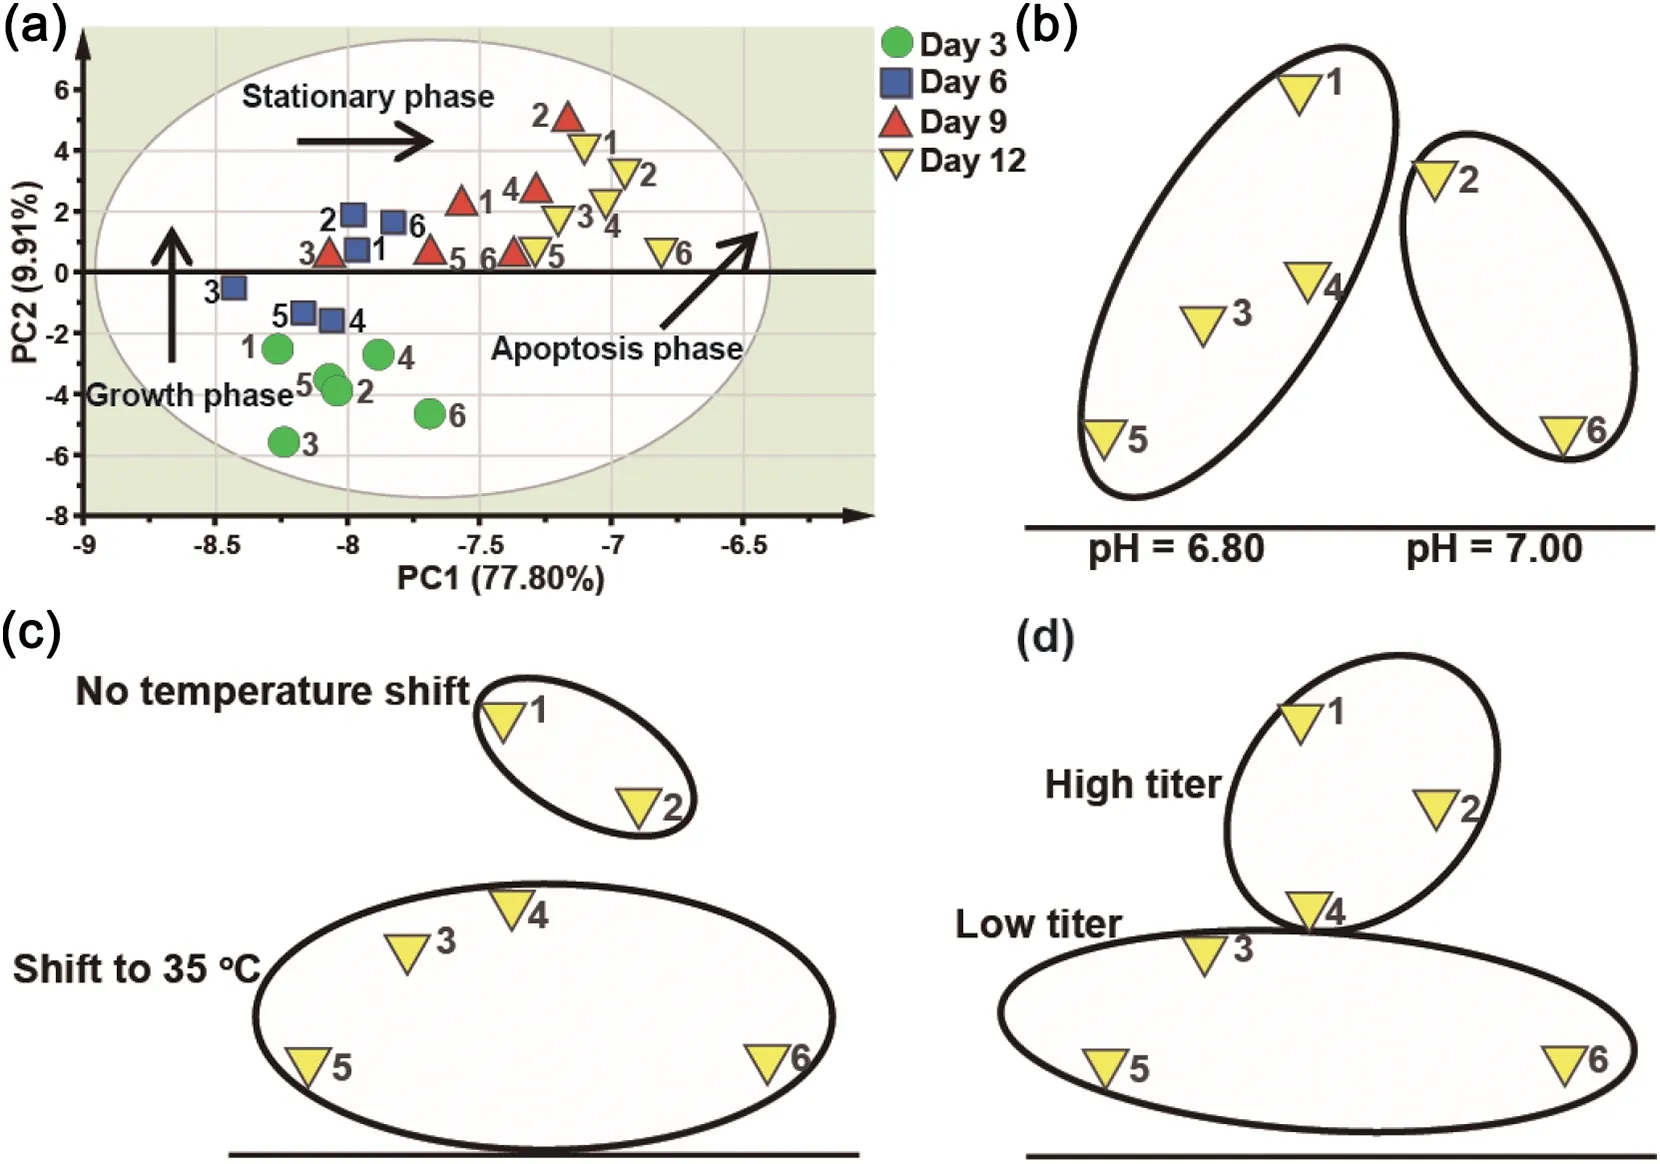
Fig.1.Score plot of first two principal components.The labeled numbers represent the batch no(Table S1).(a)DoE experiments labeled with batch numbers.Arrows indicated the change of metabolic profile during growth phase,stationary phase and apoptotic phase.(b)Representative pH subpopulations of Day 12 data when pH was changed.(c) Representative temperature shift subpopulations of Day 12 data when temperature shifts were performed.(d)Representative subpopulation of Day 12 data with high and low titer subpopulation when CPPs were changed.
4.3.Metabolic changes during different culture phases
PCA model was developed with the metabolic data of all samples on Day 3,6,9 and 12.The first two principal components explained 87.71%of the total variability(Fig.1(a)).In the score plot,Day 3 data were located in the bottom-left of the score plot,and then shifted to the center of the score plot as the cell culture progressed from Day 3 to Day 6.A small shift was then observed from Day 6 to Day 9.And the data points were eventually shifted to the top-right of the score plot at Day 12.The distribution shift in score plots clearly reflected the radical metabolic change from the exponential phase (Day 3-6) to stationary phase(Day 6-9),and eventually to apoptotic phase(Day 9-12).Within the population of each time point,we also found that there were subpopulations.For example,the Day 12 samples in the score plot were grouped into subpopulations by their pH set values(Fig.1(b)).Similar pH subpopulation was observed in Day 9. The representative temperature shift subpopulation was more obvious in Day 12 (Fig. 1(c)). The subpopulations of samples with different levels of monoclonal antibody titer also appeared in Day 9 and 12(Fig.1(d)).
4.4.Metabolic change due to pH changes in bioprocess
The samples of bioreactor run with pH at 6.80 were located on the left of those with pH at 7.00 in the score plot.Separation of subpopulations was particularly distinct in the stationary phase.The score contribution plot,showing which metabolites were influential for the change of CPP,was created to identify the metabolites markedly impacted by different levels of pH in different culture phases(Fig.2).The following metabolites significantly impacted by the change of pH from 7.00 to 6.80 were seen in Fig.2,such as aspartate(16),glutamate(19),histidine(21),homoserine(22),4-aminobenzoate(45)and α-ketoglutarate(50).The marker components influenced by pH change were mostly amino acids,intermediate products of the TCA cycle and nucleosides.It seemed that the consumption of acidic components was higher at pH 7.00 than that at 6.80.The increased consumption of amino acids, such as arginine, aspartate,glutamate, histidine and threonine, was coincident with the result in the prior work[23].Here we provided a more comprehensive profile of metabolic alteration when pH was changed for bioprocess optimization.
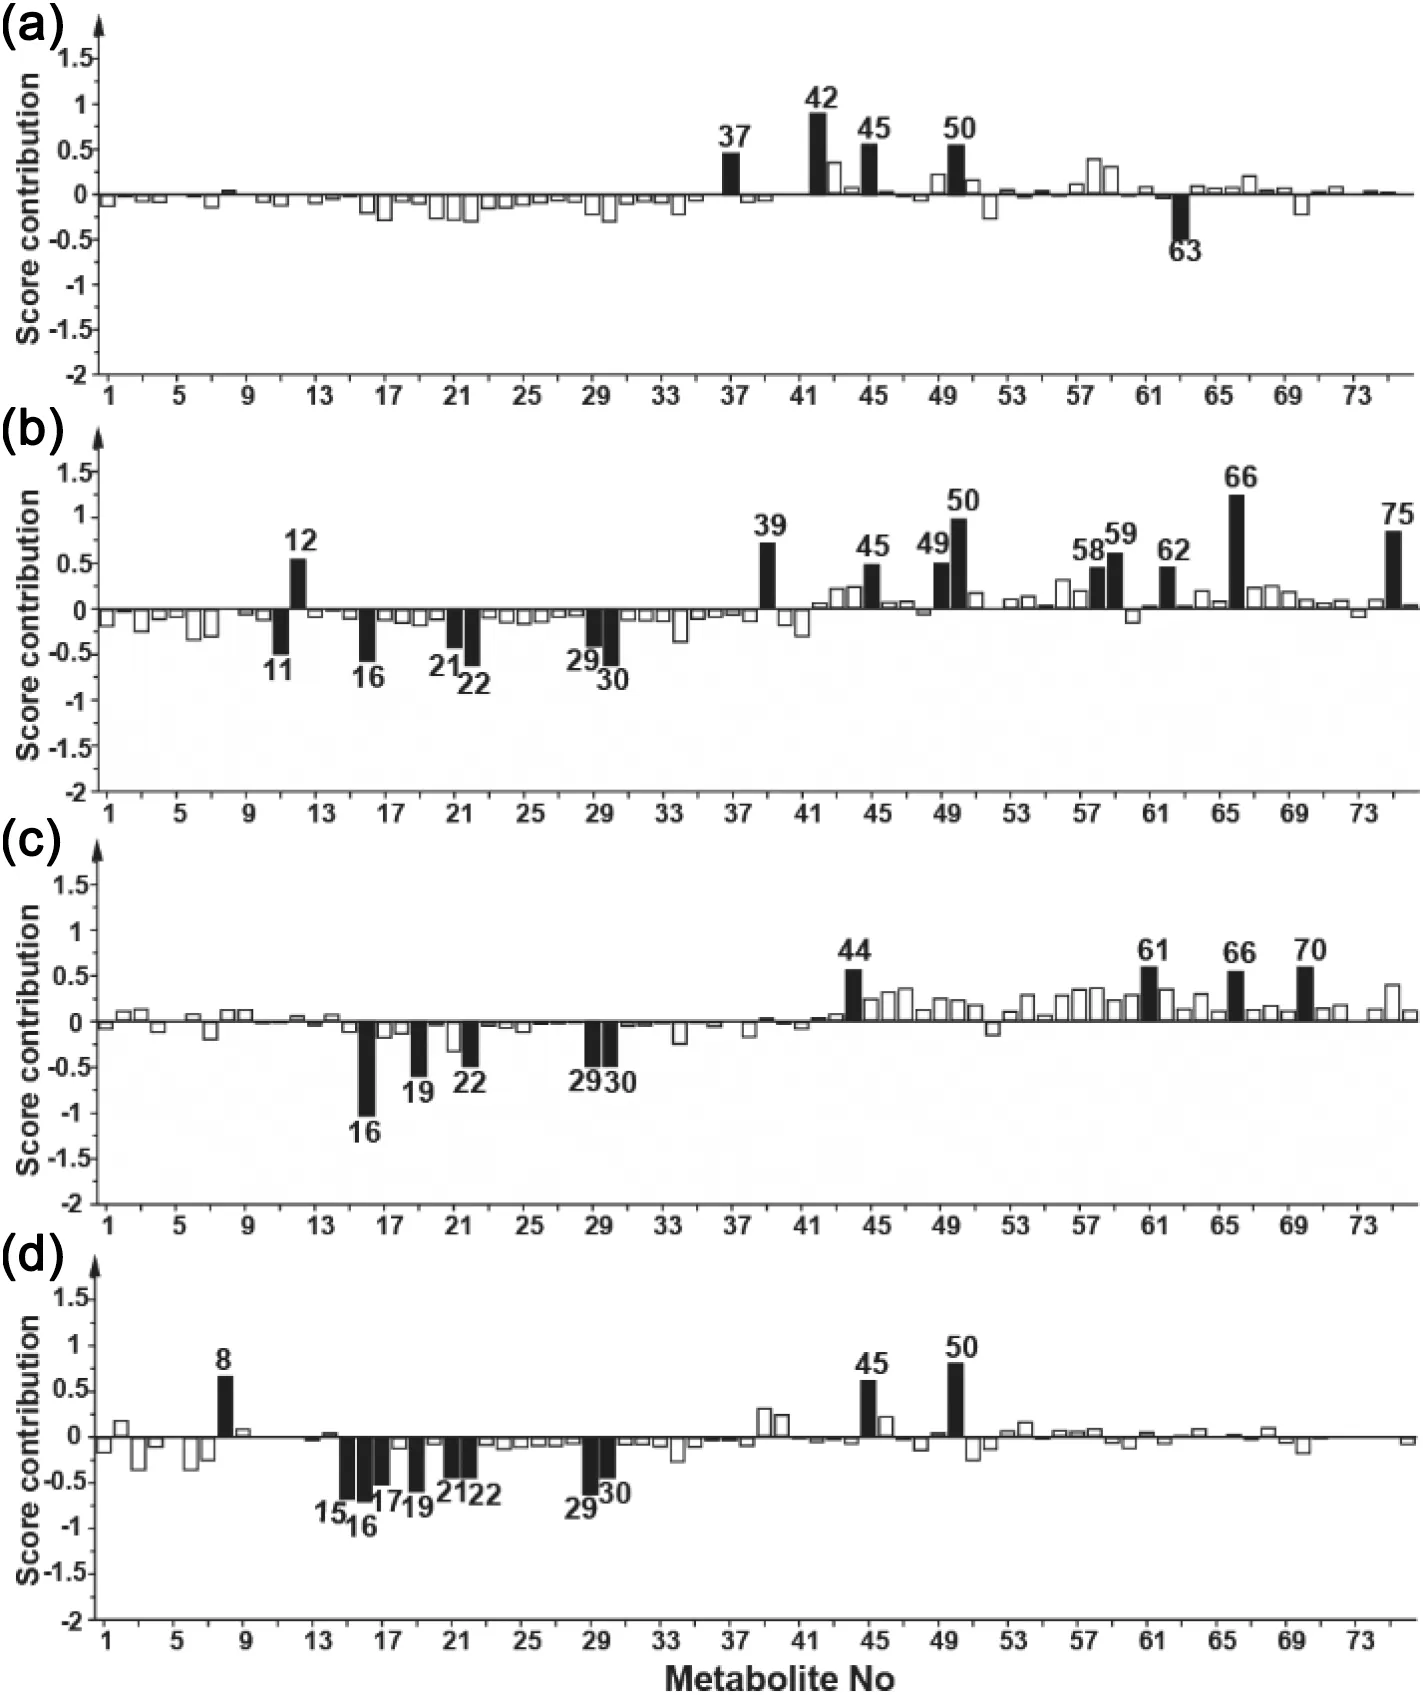
Fig.2.Score contribution plots comparing samples of pH 7.00 to those of pH 6.80 on Days 3(a),6(b),9(c)and 12(d).The metabolites whose concentration varied significantly during different culture phases were marked as black columns,while those varied slightly were marked as white columns.
4.5.Metabolic change due to temperature shift in bioprocess
In this study,temperature shift from 37°C to 35°C was more beneficial for monoclonal antibody production.This result was consistent with a previous report by Bollati-Fogolín that a temperature shift from 37°C to 35°C during stationary phase could increase titer while maintaining high cell density[24].It was well documented that the temperature shift was routinely used to alter the output of CHO cells cultivated in bioreactors.However,few researches have been done to investigate the biological events when a temperature shift occurred.Here,a number of potential metabolites altered by the 35°C temperature shift were presented to gain insight into the dynamic process. The score contribution plot of batches cultured with 35 °C shift compared with 37 °C in different cell culture phases was shown in Fig.3.It showed that 2-oxobutyrate(43),adenosine monophosphate(AMP)(49),fumarate(58),glucose 6-phosphate(60),itaconic acid(62),oxaloacetate(70),trehalose(75),and uridine monophosphate(UMP)(76)significantly changed when the temperature shift occurred.The intermediate products of the TCA cycle,such as fumarate(58)and oxaloacetate(70),were also impacted by culture temperature. Moreover, different culture temperatures did not have obvious influence on the metabolism of amino acids excepting citrulline (17). As a previous report described [25], low culture temperature improved CHO cell viability for a longer period. The difference of viability caused by temperature shift appeared on Day 12.In the culture supernatant of 35°C,the content of 3-indoleacetate(44),4-hydroxybenzoate(46)and α-ketoglutarate(50)decreased,while the content of hypoxanthine increased from Day 9 to 12.It was speculated that hypoxanthine(61),that could promote the cell growth[26],accumulated more in bioreactors with lower temperature.
4.6.Metabolic change associated with titer by Pearson’correlation test
In this part,the metabolites,statistically significant correlating with protein titer, were screened by Pearson’ correlation test in different cell phases(Table 1).The correlation with P <0.05 was considered as statistically significant.

Fig.3.Score contribution plots comparing samples of temperature shift to 35°C with those of no temperature shift on Days 3(a),6(b),9(c)and 12(d).The metabolites whose concentration varied significantly when culture temperature changed were marked as black columns,while those varied slightly were marked as white columns.

Table 1 Identified metabolites associated with monoclonal antibody yields using Pearson’s correlation test
The association between aspartate(16)and protein titer was consistent with a previous report that high concentration of aspartate in medium would inhibit the expression of protein[27].Nucleosides(cytidine(8),cytosine(9),guanosine(12)and uracil(39))are the main materials for cellular gene expression.It has been indicated that gene expression might have been involved in the titer improvement during temperature shift[28].Similar to nucleosides,amino acids(cysteine(7),cystine(18),isoleucine(23),serine(29),hydroxyproline(34)and trans-4-hydroxy-L-proline(38)),as the material for protein synthesis,were also identified to have a statistical significant correlation with protein titer value.The function of cysteine and cysteine for protein production was mainly due to their protective mechanism against the oxidative stress during culture[29].Ley and Tobey[30]found that the addition of appropriate amounts of isoleucine and glutamine could induce reinitiate DNA synthesis,which might be the reason for the negative correlation between these two components with protein production during cell growth phase.The negative correlation of glutamine attributed to the rapid consumption on Day 3,which was also supported by Hong's work[31].Malate was involved in the TCA cycle for supplying energy during cell culture process.Chong et al.also found that malate accumulated throughout the culture process [32]. Lactate was one of the main waste products during cell culture[33].Thus it was comprehensible that lactate possessed a positive relationship with protein titer on Day 9.Metabolites(5-Hydroxyindole-3-acetate(5-HIAA),arabino-1,4-lactone,maltose,itaconic acid and sialic acid)involved in the upstream of TCA cycles(glycolysis)and mitochondria metabolism were identified as marker metabolites playing key roles in titer change.
Finally,combining the results of PCA with Pearson’correlation test,the metabolites linking pH change and temperature shift to target protein titer were indicated in Fig.4.Cytidine(8),aspartate(16),glutamate(19),serine(29)and uracil(39)only linked pH value with the target protein productivity.Sialic acid(73)was the marker compound correlating culture temperature with titer. Among them, guanosine (12)and itaconic acid (62) were the common marker compounds. The corresponding metabolic pathways of these metabolites were summarized in Table 2.The biological events linking the CPPs to protein titer were identified using Reactome Pathway 3.1 software(Fig.S2).
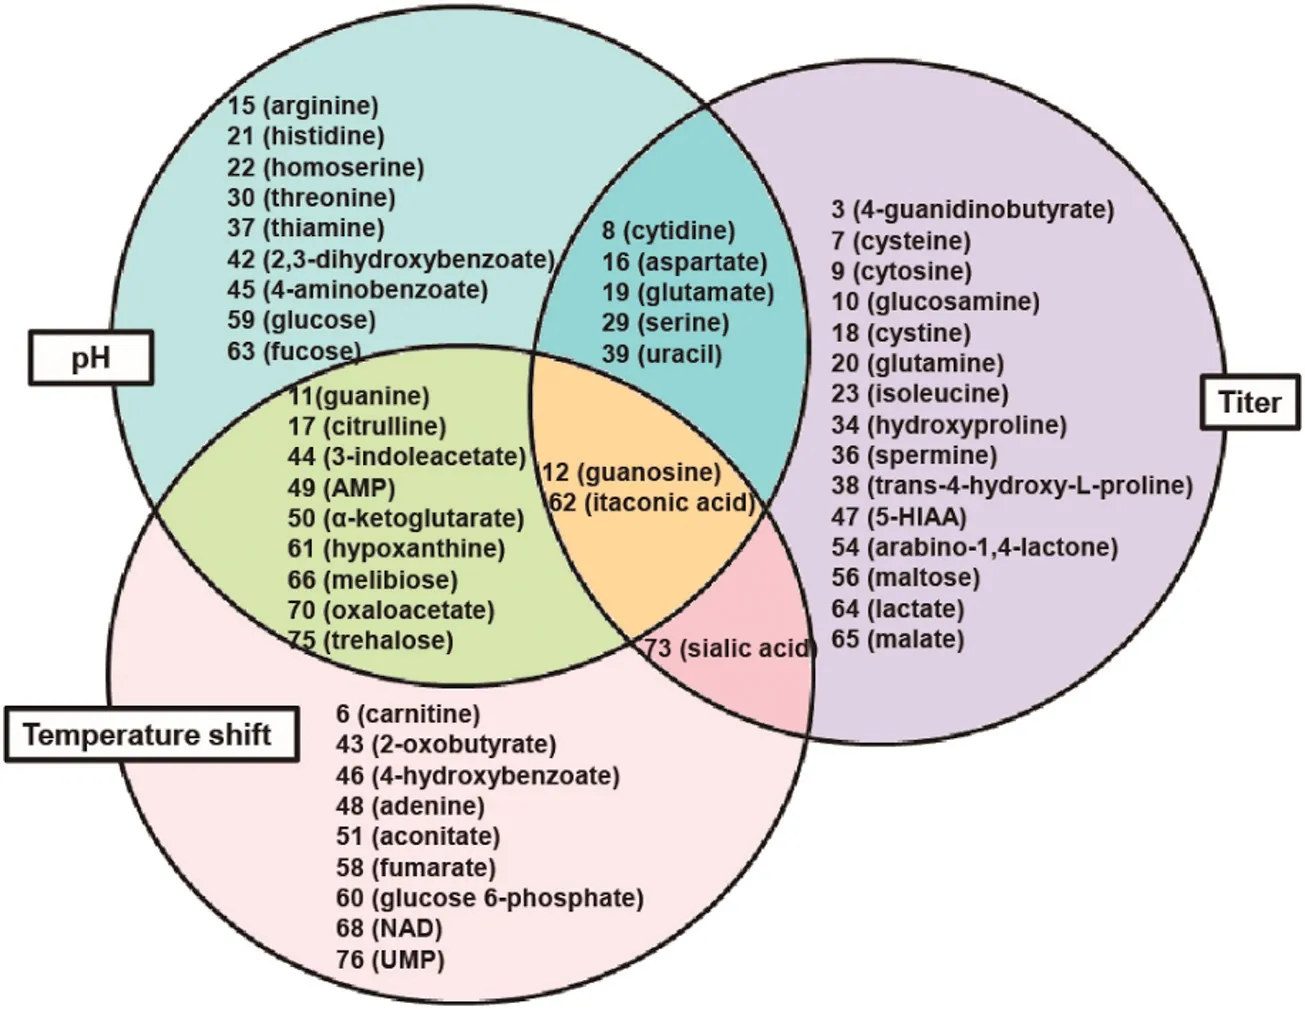
Fig.4.The metabolites associated with CPPs mediated titer improvement.Metabolite 12(guanosine)and 62(itaconic acid)were found to be commonly associated with pH change,temperature shift and titer improvement.
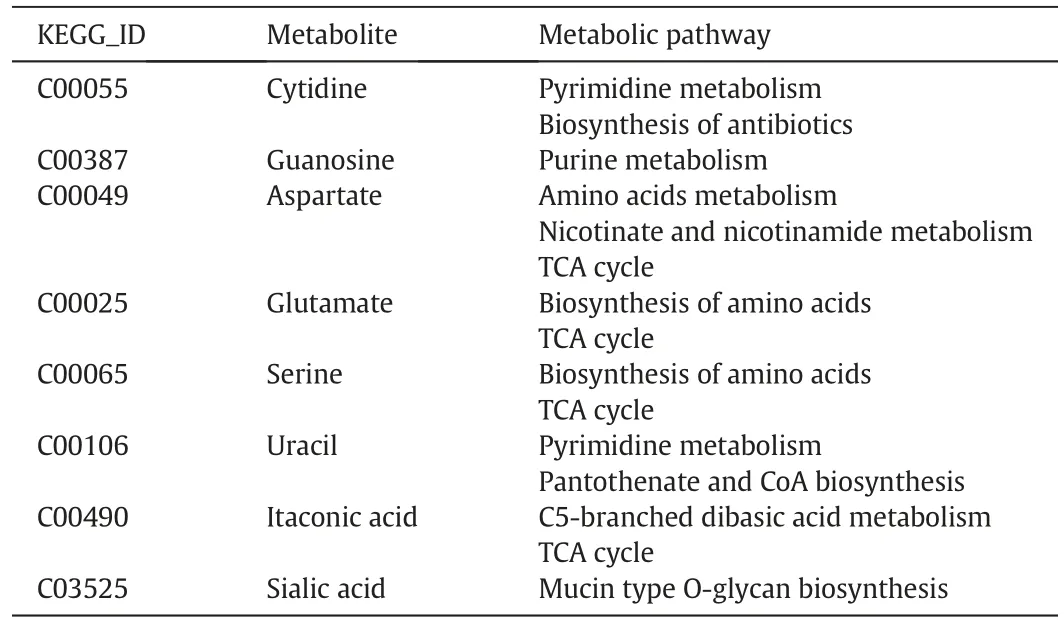
Table 2 Summary of shortlisted metabolites closely associated with protein titer and the respective pathways they were involved in
5.Conclusions
This work utilizing DoE and MVDA facilitated the understanding of the biological events when bioprocess parameters changed and the increasing of cell culture knowledge base.This in silico analysis confirmed that the metabolic pathways of immune system,DNA replication,cell cycle,transmembrane transport of small molecules,gene expression and metabolism of proteins were sensitive to pH changes.Temperature changes significantly altered the responses of immune system, transmembrane transport of small molecules and gene expression. These changes lead to variation in target protein titer.In conclusion,chemometric methods could be effective tools for exploring the black-box during cell culture.The validation of the hypothesis is in progress.
Supplementary Material
Supplementary data to this article can be found online at https://doi.org/10.1016/j.cjche.2018.10.009.
 Chinese Journal of Chemical Engineering2019年5期
- Chinese Journal of Chemical Engineering的其它文章
- Assessment of the TFM in predicting the onset of turbulent fluidization☆
- CFD study on double-to single-loop flow pattern transition and its influence on macro mixing efficiency in fully baffled tank stirred by a Rushton turbine☆
- Simulation of drop breakage in liquid-liquid system by coupling of CFD and PBM:Comparison of breakage kernels and effects of agitator configurations☆
- Heat transfer characteristics of molten plastics in a vertical falling film reactor☆
- Stabilizing silica nanoparticles in high saline water by using polyvinylpyrrolidone for reduction of asphaltene precipitation damage under dynamic condition
- Numerical simulation and experimental study on dissolving characteristics of layered salt rocks