
Simulation of drop breakage in liquid-liquid system by coupling of CFD and PBM:Comparison of breakage kernels and effects of agitator configurations☆
2019-08-07 07:53RuiXieJunLiYangJinDaZouMingChen
Rui Xie,Jun Li*,Yang Jin,Da Zou,Ming Chen
Department of Chemical Engineering,Sichuan University,Chengdu 610065,China
Keywords:Stirred vessel Liquid-liquid system Computational fluid dynamics Population balance model Breakage kernel Agitator configuration
ABSTRACT This work focuses on drop breakage for liquid-liquid system with an adoption of numerical simulation by using computational fluid dynamics and population balance model(PBM)coupled with two-fluid model(TFM).Two different breakage kernels based on identical breakage mechanism but different descriptions of breaking time are taken into account in this work.Eight cases corresponding to distinct configurations of agitator are carried out to validate numerical predictions,namely agitators with different porosity and hole diameters,respectively implemented in Cases 1 to 5 and Cases 6 to 8.The results are compared with experimental data for testing the applicability of both kernels.Simulations are implemented,in this work,with an approach of class method for the solution of population balance model by the special-purpose computational fluid dynamics solver Fluent 16.1 based on finite volume method,and the grids used for meshing the solution domain are accomplished in a commercial software Gambit 2.4.6. The effects of configurations of agitator corresponding to different parameters mentioned above on final Sauter mean diameter are equally concentrated in this work.Analysis of both kernels and comparisons with experimental results reveal that, the second kernel has more decent agreement with experiments,and the results of investigations on effects of agitator configurations show that the influences of these parameters on Sauter mean diameter are marginal,but appropriate porosity and hole diameter are actually able to decrease Sauter mean diameter. These outcomes allow us to draw general conclusions and help investigate performances of liquid-liquid system.
1.Introduction
The operation of stirred vessel is commonly used in many chemical processes including liquid-liquid extraction to obtain full dispersion of the system.There are many factors that affect the level of dispersion.Of these,agitator is verified to be reverent for its non-negligible impacts on flow condition as well as liquid-liquid behaviour.Many different types of agitators, such as blade agitator, turbine agitator etc., have been studied and documented.But the dispersion of dispersed phase adopting mentioned agitators was undesirable.For improving dispersion of dispersed phase,Chen et al.[1]proposed to drill a series of circular holes on the blades which enabled fluid to pass through,with the thought that the fluid backside the hole might form a jet,subsequently contributing to higher velocity magnitude of this area which would resulted in the formations of greater shear forces, more frequent breakage of drops would be realized and accordingly,the dispersion of dispersed phase is improved.Another relevant study showed that the shape of triangle of blade presented better shear efficiency than that of square [2], especially for the fragmentation of drops. This specific shape of agitator is also proved to be capable of promoting dispersion.Accordingly,in this paper,a novel and unique agitator were developed by combining the thoughts mentioned above to solve our recent problem in dispersion of phosphoric acid and tri-n-butyl phosphate(TBP)system for controlling drop size distribution(DSD)as well as Sauter mean diameter. And the influences of configuration of agitator on Sauter mean diameter were concentrated in this work.
However,the complexities and difficulties of measurements make the determination of DSD by experiments impractical,reversely raising the interests of utilizing computational fluid dynamics(CFD)coupled with population balance model(PBM) to predict the DSD which influences its stability,rheological features and mass(and momentum and energy) transfer [3]. More detailed knowledge about DSD is presented by Maaß et al.[4],Lane et al.[5]and drum et al.[6].Among numerous essential models, the two-fluid model (TFM) [7,8] is relatively important and widely applied to a number of cases as it is assuming one phase is continuous,while another phase is dispersed in a two-phase system[9-11].Another model needs to be emphasized is PBM,according to previous literature,there are a lot of approaches to solve population balance equation(PBE)including class method(CM)[12], method of moments(MOM) [13] and Monte Carlo method(MCM)[14,15].Among these methods presented above,class method which is able to calculate drop size distribution directly and proved to possess relative good agreement with experimental results has received great appreciations in many documents.
Another major challenge arises while determining several requisite sub-models in the PBE,notably the breakage and coalescence models(also can be called kernels)for describing the breakage and coalescence of drops.Over past few decades, substantial efforts for breakage and coalescence kernels basing on different theories had been made.An overview of these kernels can be seen in Liao and Lucas [16].Generally,as for breakage,there are four main mechanism categories expressing the breakage of drops:(1)turbulence collision and fluctuation;(2)shearing-off process;(3)viscous shear stress;(4)interfacial instability.Of these,the first one is most authoritative and enormously utilized when developing a novel kernel or fitting relative parameters.A pioneering investigation of momentous kernel in this field was carried out by Coulaloglou and Tavlarides[17](CT)on the foundation of first criterion,presenting how to wield Kolmogorov turbulence theory to derive kernels. However, due to absence of universality for the prediction of breaking possibility in CT kernel,Narsimhan and Gupta[18] proposed an idea that oscillation and breakage of drops should take velocity fluctuations on the drop surfaces into account when estimating the breaking probability distribution.In more recent years,Alopaeus modified Narsimhan's model, accounting for the viscous force of fluid inside the drops which was also proved to be reverent to breakage of drops[19] (Alopaeus,AP). This kernel,accordingly, was widely applied in many documents.But some tremendous discrepancies between breaking time predicted by this kernel and experimental data had been found by single drop experiments implemented by Maaß and Kraume(MK) [20],and the viscosity of continuous phase which were scarcely reflected in available kernels including AP kernel was also found to have equally significant impacts on drop fragmentation in their experiments.In addition,they also observed that the two dimensional elongation of drops before breakage in vicinity of agitator was reverent to determination of final DSDs which was often neglected in most works. Therefore, basing on these findings and hypothesis above, they developed a novel breakage kernel by modifying the breaking time involved in AP kernel and meanwhile,took the viscosity of continuous phase into account.
This work concentrates on the mechanism of drop breakage and aims at the comparisons of predictions of Sauter mean diameter obtained with kernels respectively proposed by Alopaeus(AP kernel)and Maaß(MK kernel),associating with approaches of class method[21]. Experiments are carried out to test the applicability of both kernels and the influences of configurations of agitator on Sauter mean diameter are also focused in this work.The adoption of MK kernel for investigating the dispersion behaviour and the studies of influences of configurations of agitator are the main novelties of this work.Eight different cases corresponding to different aspects of configuration are conducted and the results of which are compared with experimental data.Case 1 to Case 5 mainly focus the practicalities of different porosity,Case 6 to Case 8 chiefly study the effects of different hole diameters.Finally, the results of this work give us an alternative way to study liquid-liquid dispersion system.
2.Governing Equations
2.1.Two-fluid model
It is generally believed that no matter how complex the turbulence is, the transient continuity equation and the Navier-Stokes equation are still applicable.The continuity equation for describing the flow characteristics of dispersed phase in two phase system reads as follows:

The continuity equation of continuous phase is consistent with dispersed phase,only the parameters need to be replaced by that of continuous phase(αc,ρc,Uc).
The average velocity, Ucand Ud, could be determined by solving corresponding Navier-Stokes equations:

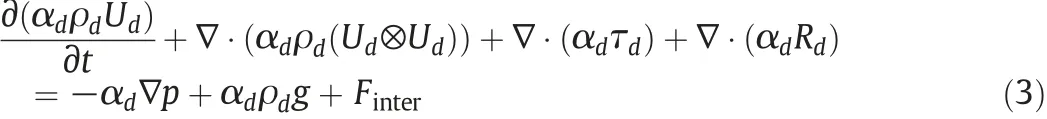
The general way to decide viscous-stress tensors (τc,τd) and Reynolds-stress tensors(Rc,Rd)is Boussinesq approximation[22-24]which needs to utilize k - ε model to compute turbulent viscosity.The most popular k - ε model is standard model and it was also adopted in this work [25,26]. The interfacial force term Finter, at the right hand of Eqs.(2)and(3),that describes the momentum exchanges between continuous and dispersed phases deserve more detailed analysis. Three phase-weight forces ought to have been concerned:drag,virtual mass and lift[25].But,in virtue of the intense influence of turbulence conducted by turbine rotation, the latter two forces could be reasonably ignored,thus,only drag forces acting on two phases need to be concentrated in this work.The computation of drag forces can be seen as follows[27]:

The drag coefficient CDis an empirical value and could be correlated by Schiller and Naumann[28]:

This correlation is recognized as acceptable in solving most liquidliquid multiphase systems in particular dilute system.
It is found that drop diameter reporting the level of dispersion and transmission efficiency between phases plays a reverent role to estimate correlation(5),indicating the significance of approximation for drop diameter in local regions.For non-spherical drops that often appear in numerous cases,Buffo and Marchisio[29]proposed a method of using Sauter mean diameter d=d32to predict the diameter,that is,the diameter of a sphere possessing the same volume as the drops.In addition, the determination of DSD which is capable of assessing dispersion intuitively and widely adopted in literature relating to PBM meanwhile provides another practical approach to derive Sauter mean diameter,depicted as the ratio between the moments of order three and two of the DSD.Therefore,DSD was particularly wanted in this simulation.
2.2.Population balance model
The primary method to obtain evolution of the DSD varying with the occurrence of reaction and transfer phenomena in multiphase system is to solve population balance model(PBM).The foundation of this model is mainly to combine the microcosmic behaviors(fragmentation and coalescence,etc.)with macroscopic attributes(drop size and area)by tracking the number of entities such as particles,drops and bubbles,etc.,making it become a valid implement for studying discrete system.The main partial differential equation only considering a single variable involved in PBM presents as follows:
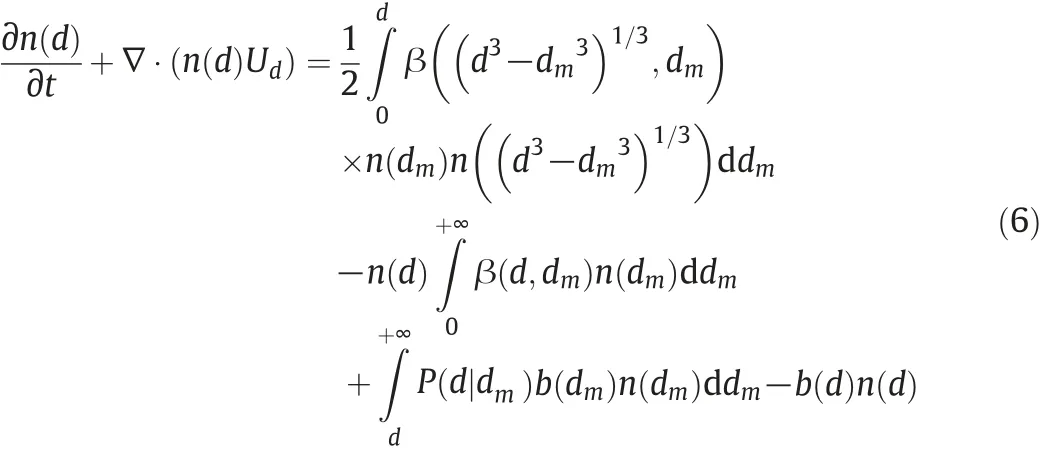
The four sub-terms at the right hand of Eq.(6)stand for respectively birth and death due to aggregation,birth and death due to breakage.More specific information can be seen in the book of Ramkrishna[30].It is worth mentioned that the growth term which should be a part of original equation has been neglected due to non-existent particle growth.What especially needs to be explained is that this formulation assumes that some of the related properties(except turbulent dissipation rate)are independent of the spatial distribution,namely,in the specific system,the properties of each volume are identical[31].
The discrete method(also called the class or section method)is a basic way to deal with PBE and was developed by Hounslow,Litster and Ramkrishna[30,32,33].The foundation of this method is to present the drop size distribution(DSD)in terms of a series of discrete size classes or bins.Since it has superiority of robust numeric and is capable of presenting the DSD directly,this method was accordingly applied in this work.The variation of PBE written in terms of volume fraction of drops in the size class i is showed by Kumar and Ramkrishna[12]:

where Bag,iand Bbr,iare birth of drops respectively due to aggregation and fragmentation,while Dag,iand Dbr,iare drop death respectively due to aggregation and fragmentation,the drop birth and death due to fragmentation and aggregation at the right hand of Eq.(7)are described as follows:
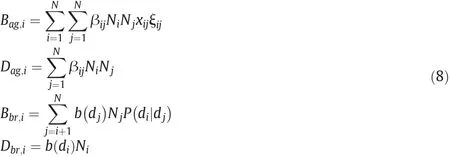
where βijis coalescence frequency between drops in size class i and drops in size class j, b(di) and P(di|dj) are breakage frequency and daughter distribution function respectively.ξijand xijin first equation can be obtained in the book of FLUENT User's Guide[22].In addition,the velocity Uiat the left hand of Eq.(7)is another underlying assumption which indicates that the drops in the system share the same velocity.It is reasonable to make such a hypothesis since the DSD is generally narrow and the densities of two phases are close.
By solving the discrete equations above, local discrete number density can be eventually obtained and meanwhile,the Sauter mean diameter d32which has extensive popularity is also able to be derived by solving the follow correlation:

2.3.Breakage kernels
There are a huge number of breakage kernels that can be found in numerous documents. Of these, one of most well-known kernels originating from the idea of turbulence collision and fluctuation was proposed by Alopaeus et al. [19] which stuck to the dominance of velocity fluctuations on drop surfaces and the influences of viscous forces inside the drops during the breakage of drops.The expression of this kernel abbreviated as AP kernel is described as:

The function (erfc) used in Eq. (10) is the complementary of the error function.c1,c2and c3are dimensionless constants.In principle,the universality of flow heterogeneity at different locations in a vessel usually makes the constants uncertain[16],taking the stirred vessel for example,the fluid in vicinity of impeller normally possesses higher turbulence which results in strong fragmentation of drops, whereas the fluid during circulation usually makes drops collide and aggregate,thus, the parameters should not be identical and need to be fitted corresponding to different locations in the vessel.However,because of the lack of measurements and consideration of time cost,in this work,the values of dimensionless constants in Eq.(10)were selected based on literature[20]and could be seen in Table 1.
This kernel has received a great reputation in numerous works on liquid-liquid simulation to predict the fragmentation of drops for a comparatively good agreement with experimental results.In recent years, however, Maaß and Kraume [20] carried out a set of experiments to make thorough analysis of this kernel and found that the magnitude of the values of the breaking time for this kernel was much higher than experimental results, showing relatively large errors in prediction of breakage. Moreover, it was also found that the viscosity of continuous phase and surface tension which were scarcely reflected in available kernels had equally significant impacts on drop fragmentation.Therefore,Maaß and Kraume[20] made a deep investigation on mechanisms of breakage, and ultimately developed a new approach to describe the breaking time with the consideration of viscosity and surface tension by conducting single drop experiments.The results of this investigation were also used in this work to examine whether it is more applicable to determine DSD compared with the kernel proposed by Alopaeus et al.[19]in the system with a huge number of drops,rather than a single drop.
In the newly correlation of the breaking time, different breakage mechanisms as well as turbulent pressure fluctuations induced by two-dimensional elongational flow approaching to the agitator blade are taken into account.It should be noted that all the mechanisms are only concerned under instantaneous condition and the elongations of drops in front of the rotating blade are neglected [34]. A breakage process of a single drop starts with the entry of a drop into the turbulent region behind the blade,then,the macroscopic acceleration caused by high-speed rotation elongates and deforms the drop,making it become long and thin, when the maximal diameter of the drop exceeds the critical diameter, the drop will break. With regard to description of breakage process,Janssen and Meijer[35]investigated and illustrated a 3D-elongation process at a constant stretching rate with the assumption that the orientation of drop elongation is permanently parallel to the direction of strain.They expressed ˙ε as the classic rate of elongation and proposed dm(t),the diameter of drop at time t,as an exponentialfunction of time t:

Table 1 Used parameters for both kernels from Eqs.(10)and(20)

For more convenience,this equation can be transformed into another mathematical form which inversely describes time t as the function of diameter of drop.Correspondingly,the physic roots in Eq.(11)also need to be changed(t is substituted by elongation time teand dmis substituted by dm,e)for an elongation process.This formulation ultimately becomes:
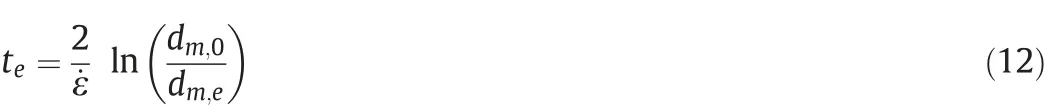
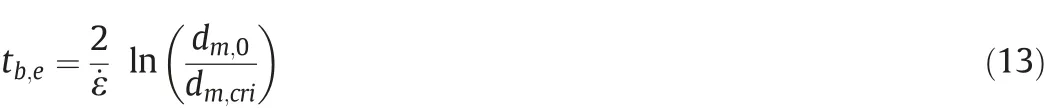
It is known that when the maximal diameter of a drop is larger than the critical diameter,the drop will break into smaller drops.Thus,there comes to a point that when the diameter of a drop reaches the critical diameter dm,cri, the corresponding elongation time tewill become breaking time tb,e.Therefore,the breaking time described as the function of classic rate ˙ε and critical diameter dm,criis shown as follows:
Capillary number repeatedly mentioned in many former similar documents is a well-known approach to assess the stability of a drop by comparing the values of practical Capillary number Ca and critical Capillary number Cacri.The critical Capillary number can be roughly determined by adopting the plots of Capillary number against the ratio of the viscosities of dispersed and continuous phases. The breakage of the drop will occur when Ca >Cacri[36].The interrelation of drop Capillary number involving fluid dynamic viscosity and interfacial tension for elongation can be seen:

The characteristic velocity ˙U in Eq. (14) can be correlated with elongation rate: ˙U = ˙εdm,cri.
Then,the critical diameter of the drop under elongation is accordingly described as the function of critical Capillary number and elongation rate:

Combining Eqs. (13) and (15), the novel description of breaking time tb,einduced by elongation becomes:
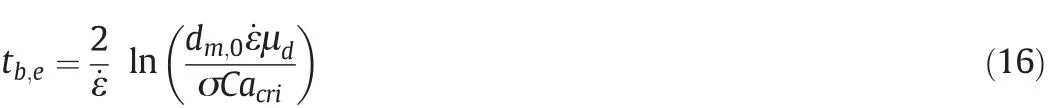
The values of two unknown parameters:critical Capillary number and elongation rate in Eq.(16)need to be clearly defined.The determination of elongation rate is able to be obtained by work of Stoots and Calabrese [34] who acquired the values in a Rushton-turbine vessel,and the value for critical Capillary number can be determined by Kumar et al.[37]which conducts experiments in 2D elongation flows.It deserves attentions here that the assumption of substituting 2D elongation flows with 3D elongation flows is essential since the derivation of critical Capillary number accounting for 3D flows has not been reported yet due to irregular and complex characteristics of flows.In addition,it has been proved that the elongational flow has great efficiency during the process of breakage,especially for the system with relative high viscosity ratio, but this efficiency exists constantly only in the case of persistent velocity gradient which is not always available in most situations for transient phenomena[38].Therefore,the breaking time tb,einvolved in Eq.(16) needs to be modified by introducing a new parameter called residence time tresthat indicates the time of fluid in the region with strong elongation.The revised correlation combined with the turbulent breaking time tb,tur,is shown as follows:

The description of turbulent breaking time tb,turin Eq.(17)is the same as the description proposed by Alopaeus et al.[19]
The residence time treswhich is inversely proportional to rotating speed was shown by Kumar et al.[37]:

By analysis of Eq.(17),it can be informed that the revised breaking time has a close connection with elongation-induced breaking time and residence time. More to be known that larger residence time compared with elongation-induced breaking time implies the fragmentation of drops occurs before they outflow the strong elongation region,which indicates the decrease of breaking time,whereas smaller residence time signifying the fragmentation happens outside the region inversely shows the increase of breaking time.Therefore,the introduction of this idea into original correlation theoretically makes the expression of breaking time more convincing.
In conclusion, the new formulation for breaking time tb,reis presented as follows:

Putting the new description for breaking time into breaking frequency,as well as the breaking probability suggested by Alopaeus et al. [19], an improved formulation of breaking rate(MK kernel) is eventually derived:
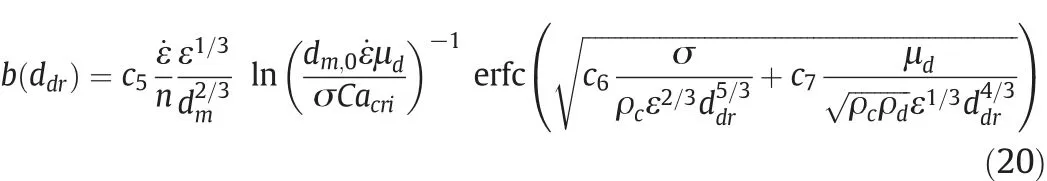
Numerous previous similar works on determination of parameters contained in various breakage kernels have been devoted to realizing the generalizations of these dependent parameters for any circumstances for a long time,but the relevant investigation outcomes have not been reported yet.Traditionally,an approach basing on trial-anderror attempts is wildly utilized by many authors to estimate the parameter values which are mostly only applicable to specific systems.Other investigators, whereas, have proposed other approaches for their own determination[39].In this paper,the derivation of three unknown parameters c5,c6and c7is obtained by means of the Levenberg-Marquardt method which is implemented by a MS Visual Basic personal computer[40].This method can be used for parameter optimization and is characterized by a special window interface for data input.More detailed information about this method was presented by Ribeiro et al.[40]. Generally, these initial values are previously guessed values which are skillfully assigned by the values derived by Alopaeus [19]for this case.The parameter values for Eqs.(10)and(20)including c5,c6and c7are shown in Table 1.
2.4.Daughter distribution function
By analysis of PBE,the daughter distribution function which can be seen as P(d|dm) involved in the third sub-term at the right hand of Eq. (6), is extensively desired to be figured out when pursuing DSD during the breakage process.There are several models for describing distribution function which can be classified as:(1)empirical models,(2)statistical models,and(3)phenomenological models.The summary of different distribution models is shown by Liao and Lucas[16].In this paper,the daughter distribution function proposed by Laakkonen et al.[41]is adopted:

This function is proved practical with the assumption that the equalsized breakage is the dominant event during a breakage process.As it is mentioned that daughter distribution function is a key way to determine DSD,it can present a specific shape of distribution,for daughter drops which are infinitely small or equal to the size of mother drop,it can produce zero probability and the maximum probability appears between the two limited daughter drops.In addition,this distribution function provides a relative narrow and dense DSD which satisfies the assumption of uniform drop velocity.
2.5.Coalescence kernel
In this work,turbulent aggregation model was adopted to predict the coalescence of drops due to that turbulence which has great influences on the properties of two-phase system is the main phenomenon in a high-speed stirred vessel.When stirring,the larger eddies transfer energy to smaller eddies, and the size of the smallest eddies is the Kolmogorov microscale,η,which is described as:

For drops smaller than or larger than Kolmogorov microscale,the aggregation rate can be presented on the basis of the work by Saffman and Turner[42]as well as Abrahamson[43]:
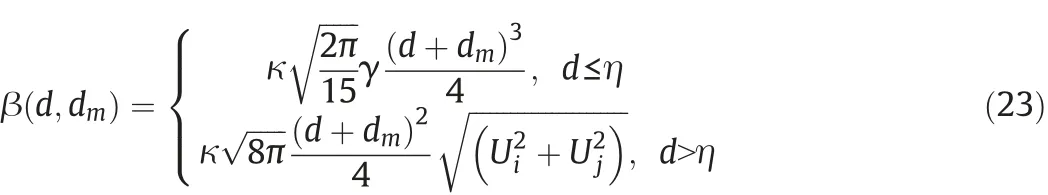
where κ is a pre-factor that considers the capture efficiency coefficient of turbulent collision.γ is the shear rate calculated as:γ=ε0.5/ν.The empirical correlation of capture efficiency coefficient which indicates the hydrodynamic and attractive interaction between colliding drops can be found in the work of Higashitani et al.[44].
Above all,the breakage kernel developed by Alopaeus[19]shown in Eq.(10)and the revise breakage kernel developed by Maaß and Kraume[20] shown in Eq. (20), together with turbulent aggregation kernel shown in Eq.(23)are focused in this work to study the performances of both breakage kernels in liquid-liquid system compared with experimental results.
3.CFD Simulation
In this paper, the commercial solver Fluent 16.1 together with the pre-processor Gambit 2.4.6 used for meshing were adopted to simulate the performances of liquid-liquid system.The discretization and iterative calculation of involved equations were implemented in Fluent 16.1. Another commercial tool CAD 2012 (Computer Aided Design(2012)) was also used in this work for constructions of geometric models of stirred vessels.
As already mentioned above, three main governing equations including conservation equation,Navier-Stokes equation and population balance equation were taken into account in this case,the method to solve the integral appearing in Eq.(20)was Gauss Legendre numerical method[45]which employed 100 Gauss-Legendre nodes to calculate the integral in this work.The involved two-fluid model could be explained by Eulerian-Eulerian model which considers dispersed phase as continuum as the same as continuous phase.It is proved acceptable to utilize Eulerian-Eulerian model since it is more applicable to the system where the volume fraction of dispersed phase is more than 12%[46]and just satisfied this work for an appropriate volume fraction of 20%that was experimentally set.
In general,the previous step for numeration is to mesh the geometric models which was completed by Gambit 2.4.6 in this work. As a carrier of simulation and analysis, the mesh quality plays a reverent role in the accuracy and efficiency of CFD computation, therefore, it should be greatly focused and hard studied. In order to improve the mesh quality of different regions in the stirred vessel for this work,both structured and unstructured grids were utilized to mesh the model in which the unstructured grids were used for meshing the region closed to agitator due to geometric complexity,while the structured grids were used for meshing the rest.
The standard k-ε model was adopted in this work to calculate the turbulent kinetic energy and turbulent energy dissipation which were essential to the determination of breakage and coalescence kernels as well as Reynolds-stress tensors.Discretization is one of the most common methods to solve governing equations,which is able to establish a set of algebraic equations by scattering the continuous variables into a series of finite nodes.There are three different discretization methods as well as several discretization schemes,in this work,the finite element volume method was taken into account and the discretization schemes used for different parameters could be seen in Table 2.
As it is already known that CM method was chose to solve PBM in this work.In order to get relative decent DSD,10 drop size bins were deliberately set on the basis of experimental results,with the definition of geometric ratio. The ratio exponent was 2 [32] and the particle volume coefficient KVwas 0.524, it deserves notice that both values were default.The min diameter defines the minimum bin size:d0=(V0/KV)1/3and was set to 0.04 mm on the foundation of the experimental results and the max diameter could be calculated basing on min diameter.Hagesather method was used in this work for the discrete method in which the breakage sources were distributed to the respective size bins,preserving mass and number density.The Sauter mean diameter could be determined byin this method.
In this work, the solution domain was separated into two parts:movable zone, representing the region approaching to agitator, and static zone,including all of the rest regions.The stirred vessel wall was assumed to unroughness wall and the upper fluid surface which directly contacted with atmosphere was set to pressure outlet.Multiple reference frame(MRF) approach was adopted in this work to define the motion of movable zone,and the rotational velocity speed was set to 400 rpm which was able to realize full mixing of the system. To getmore precise results for incompressible fluid which could be treated in this work,the pressure-based solver together with transient process were elected.Given the computation consumption and relative high mesh skewness,standard SIMPLE which was proved to be a satisfying solution method to maintain computational stability was applied to solve discrete equations in this work.Moreover,for better prediction of breakage process as well as the consideration of time consumption,the time scale was eventually set to 0.1 s [3] that was verified to be valid for experimental results.
Table 2 Numerical schemes adopted in eight cases
The coupling of CFD and PBM and the detailed process about this coupling could be seen in Fig.1.It could be found from Fig.1 that the breakage and coalescence of drops not only have remarkable impacts on DSD but also enormously influence the velocity field,indicating the significance of derivation of suitable breakage and coalescence models.Besides, other factors like the determination of solution methods or initialization were also authenticated to have great influences on the final accuracy of the simulation,therefore,it still required a large amount of hard studies to improve the simulation accuracy for a single specific case.
4.Experimental Cases and Simulation Details
4.1.Cases descriptions
In order to investigate the capabilities of newly developed agitators based on the geometry of triangle for phosphoric acid and TBP system which we need to solve the dispersion problem in our recent research,different porosity and hole sizes as well as blade configurations,associated with two specified breakage kernels reported in Eqs.(10)and(20)were emphasized. The results could be used to demonstrate the performances of both kernels. Eight cases were set up for this work,respectively five cases for porosity, three cases for hole diameter.The experimental cases adopted could be seen in Tables 3 and 4 and Figs.2 and 3.

Fig.1.The CFD-PBM coupled chart.
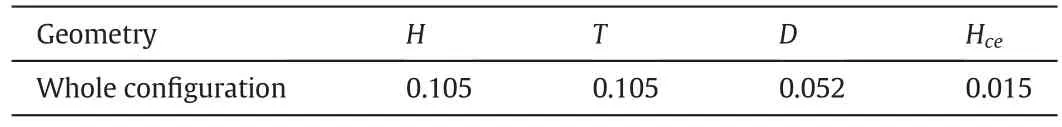
Table 3 Geometry characteristics of the whole vessel
All of the experiments were conducted in an unbaffled flat-bottom cylindrical vessel with a bottom diameter of 105 mm and the agitators utilized had two identical blades. Among eight experimental cases,Case 1 to Case 5 mainly focused the practicalities of different porosity,Case 6 to Case 8 chiefly studied the effects of different hole diameters.Table 3 and Fig.2 illustrated the dimensions of whole structure of stirred vessel in which all of the cases were carried out equally.A relative larger agitator diameter to tank diameter ratio estimated to be 0.5 was set due to weak flow circulation under the distinctive agitator was found for a smaller ratio.
In addition,the geometric shapes of two symmetrical blades were fabricated to equilateral triangles for trading off between sufficient overall flow and strong shear efficiency,either too large or small angle of blade tip was inadequate. Meanwhile, equilateral triangles could facilitate processing so that the manufacturing time cost was able to be reduced. As for holes drilled on blades,they were equally, in this work,interlaced arranged according to an angle of 60°for the convenience of calculation.It is required to take notice that Case 2 to Case 5 possessed different number of holes with identical radius which was 1 mm, roughly same porosity with approximate value of 22.1% was shared by Case 6 to Case 8.
As known that this paper mainly developed a novel agitator to solve our recent dispersion problem of phosphoric acid and TBP system,therefore, this system was chose to investigate the performances of liquid-liquid system.Due to the indispensability for numeration,the physical properties of both materials must be defined. According to former investigations on phosphoric acid and TBP system,the optimal extraction efficiency for acid was normally achieved when the volume fraction of dispersed phase was 0.2, under this condition, the phase composed of phosphoric acid and water(also called aqueous phase)was scattered into oil phase and accordingly,the aqueous phase became dispersed phase while the oil phase became continuous phase.For availability of decent experimental results,the phosphoric acid was diluted to 30% calculated on the basis of the mass fraction of phosphorus pentoxide,and the oil phase was the mixture of tri-n-butyl phosphate and kerosene,the mass proportion was 4:1.All of the physical properties regarding to both phases could be found in Table 5. It deserves note that the properties related were measured at 50 degree Celsius.
4.2.Experimental details
All of the experiments were carried out at 50 degree Celsius which was required for the acquisition of content extraction efficiency.The dispersion samples were withdrawn from the stirred vessel at a preset time, and stabilized with sodium dodecyl sulfate for prevention of drop aggregations. An inverted bio-microscope with long distance working convergent lens, equipped with achromatic objective lens was used to observe the behaviors of drops and capture images meanwhile.A series of clear images could allow automatic drop size analysis using Image-Pro Plus 6.0.But note that the images needed to be splicedbeforehand for collecting enough number of drops to determine the DSD.In order to prevent drop aggregation more effectively during sampling and observation, a fine enough,anti-corrosive and translucent sucker was used to carry samples which was experimentally proved to be more stable compared to samples on glass slides. Both phases were respectively added into the stirred tank according to the volume ratio of 4:1, an invariable stirring speed of 400 r·min-1which was elected on the basis of former experiments was set for all experiments,and other conditions of which were also identical.

Table 5 Properties of both phases investigated in this work
4.3.Grid independence

Fig.4.Sauter mean diameter versus grid number for Case 1 at 60 s.
The errors commonly exist when comparing the numerical outcomes with the experimental results. Among different errors that might be exist,discrete errors are essentially linked to the quality of grids,it is learned errors distinctly decrease with the meshes thinning,but,as the meshes become thinner,round-off errors increase owing to the augment of discrete nodes.Besides,the over-huge number of grids can vastly increase the computational cost. Therefore, the determination of grid number assuredly counts.Grid independence test is proved to be indispensable for helping quest adequate grid number for numeration and also conducted in this work.There were five different grid numbers taken into account respectively:50 k,150 k,250 k,350 k,450 k(1 k=1000).All of the grid cells used for discretization composed of tetrahedral cells and hexahedral cells. The assumption which treated the agitator as zero-thickness objects was virtually reasonable since the computational cost would enormously increase as considering the thickness of these objects.Case 1,the configuration of which was the foundation of the rest cases,was used for grid independence test.This paper mainly focused the trend of Sauter mean diameter,therefore,the comparison of five different grid numbers plotted as the variation of Sauter mean diameter was ultimately made and the results were reported in Fig.4.

Fig.5.Final computational grids used for Case 1.Viewed respectively from the front side(top left),left side(top right)and top side(bottom).

Fig.6.Time evolution of Sauter mean diameter predicted by AP kernel for Case 1 starting from an initial Sauter mean diameter of 1610 μm(blue solid line)and 750 μm(red dashed line).
It was needed to explain that different initial Sauter mean diameters or DSDs to start calculation were feasible since the eventual state of agitation process was presumably steady even though an non-steady process existed at the beginning period. The detailed explanation would be shown in Section 5.For persuasiveness of grid independence test,the same initial Sauter mean diameter which were set to 0.75 mm as well as other conditions were assumed.This test was conduced at the time of 60 s.By the grid independence analysis,It was obviously found that Sauter mean diameter dramatically decreased as the meshes thinning,visually showing the increase of grid number.But,since the domain was meshed into about 350 k grids, relatively gentle curve drop in Fig.4 had been found simultaneously,indicating the increase of grid number after 350 k had marginal impact on numerical results and therefore, roughly 350 k grids were ultimately determined to mesh all cases and they were also found to be sufficiently fine to characterize the liquid-liquid dispersion.
The sketch of the final grids used for meshing Case 1 were displayed in Fig.5.The three figures were respectively viewed from the front side,the left side and the top side.All grids were smoothed previously to reduce errors.
5.Results and Discussions

Fig.7.Time evolution of Sauter mean diameter predicted by AP kernel for Case 2 starting from an initial Sauter mean diameter of 1020 μm(blue solid line)and 750 μm(red dashed line).
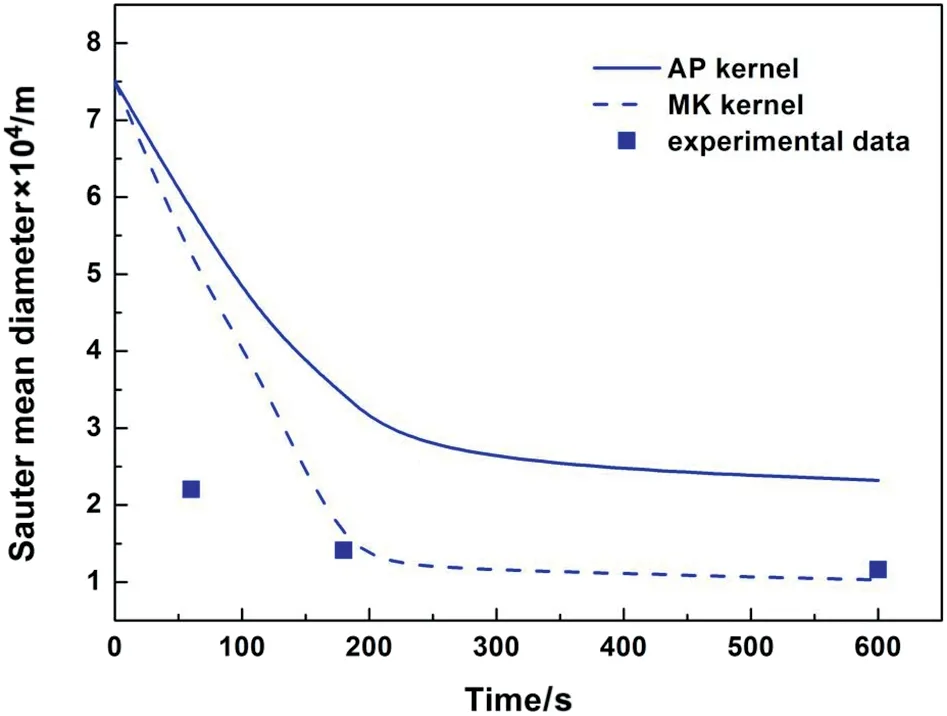
Fig.8.Comparison of time evolution of Sauter mean diameter predicted by AP kernel(solid line) and MK kernel (dashed line) for Case 1 with experimental values (blue square).
By analyzing the comparison between breakage frequency predicted by AP kernel and MK kernel,the main difference originates from the expression of breaking time, whereas the breaking probabilities are identical.Same parameters are found in both expressions except for elongation rate ˙ε,rotating speed n and critical Capillary number Cacri.Compared with AP kernel, MK kernel takes viscosity of continuous phase which is demanded when determining Cacriinto account.Since fluid shear stress and viscosity of continuous phase have nonignorable influences on velocity field and DSDs in turbulent flow,MK kernel,in terms of numerous systems with different physical properties,due to considering more parameters,theoretically have better applicability as well as more precise numerical results which will be proved by following presentation.
As is mentioned in Section 4.3,initial Sauter mean diameter or DSDs are supposed to be previously set to give initial values for iterative calculation.Generally,different initializations are believed to contribute to the same numerical results for a steady state process which were also assumed in this work to explain the eventual state,but only stand on the premise of identical power input.Nevertheless,distinct initializations unquestionably effect the convergence of calculation.In order to realize faster convergence,independence of initializations is demanded to verify practicability of adjustments for initial values,thus,several numerations with dissimilar initializations were carried out for determining the optimal initial values.In this work,different initial Sauter mean diameters were considered only.Results,corresponding to Case 1 and Case 2,are reported in Figs.6 and 7 for initial Sauter mean diameters of 1610 μm,1020 μm and 750 μm and for AP kernel.It can be seen that both curves in Fig. 6 drop dramatically as time goes on and reach a plateau after 200 s for 750 μm and 250 s for 1610 μm, roughly identical results at 600 s are found.Similar trends of curves are also shown in Fig.7 except that the plateau for 750 μm appears after 225 s and no obvious plateau is found for 1020 μm.But the Sauter mean diameters,at 600 s,are very similar for both initializations.These results reported in two figures indicate that the effect of initial Sauter mean diameters on final numerical results is marginal for a steady process.Moreover,calculation starting with 750 μm is found to converge slightly more quickly than the other two and therefore, 750 μm is ultimately elected as the initial Sauter mean diameter for all cases.
Next,the time evolutions for Sauter mean diameter predicted by AP kernel and MK kernel for Case 1 are compared with experimental results in Fig.8.As it mentioned above,the initial diameter was set to 750 μm.It can be seen from the figures that the predictions of eventual Sauter mean diameter predicted by AP kernel and MK kernel show distinct difference and the results with MK kernel present decent agreement with experimental data, whereas the AP kernel does not. This might be because MK kernel especially considers the elongation of drops in vicinity of agitator which is neglected in AP kernel.From the contour plots of velocity magnitude for dispersed phase reported in Fig.9,which are obtained by cutting respectively along bottom surface diameter and along the vertical height of 28 mm,an obvious velocity peak can be found at the area around the blade tips whereas the velocities of areas not far away are much smaller,signifying a significant velocity gradient exists at a relatively close distance.As is already known that the fluid shears which play considerable role in elongation of drops are mainly conduced by the velocity gradient,therefore,for this system possessing strong velocity gradient at the area approaching to agitator, elongation of drops caused by fluid shears should not be neglected,and accordingly,indicating MK kernel which accounts for drop elongation before breakage,compared with AP kernel,has better agreement with experimental results. In addition, it is necessary to stress here that the first experimental value shows discrepancy with numeration results,this is due to that the initialization of numeration is not same as the initial state of experiment(this is considered reasonable since the eventual state of agitation process is stable),therefore,it is normal to show dissimilarity before the system reaches stability.
It is necessary now here to display the contour plots of Sauter mean diameter predicted respectively by AP kernel and MK kernel and are reported in Fig.10.The figures are obtained by the same method used above.As it is seen for AP kernel that the Sauter mean diameter shows general homogeneity in the roughly whole region of stirred vessel and only slightly discrepancy appears at the fluid surface near shaft.This can be confirmed by our simulations for volume fraction of dispersed phase for AP kernel which is also reported in Fig.10.From the contour plots of volume fraction,the whole vessel is practically characterized by the similar volume fraction except for locally some differences that appear at the regions near the bottom of vessel.This shows that under these conditions,mixing,in terms of the whole vessel,is sufficient and capable of distributing drops around,making the liquid-liquid dispersion homogeneous.Similarly,the breakage process involved is verified to be still quite strong around the whole vessel which accordingly exhibits the general homogeneity of Sauter mean diameter in the stirred vessel.However,it presents inhomogeneity of Sauter mean diameter and volume fraction of dispersed phase at some areas when investigating MK kernel.It can be seen that the contour plot of volume fraction for MK kernel is quite different from AP kernel,inversely,showing heterogeneity at most of the regions especially the region approaching to agitator shaft.This accordingly indicates heterogeneity of Sauter mean diameter which equally appears at the area closing to agitator shaft.It is also interesting to observe that the Sauter mean diameter at this area is conspicuously larger than other areas,this might be in virtue of the poor turbulent flow signifying relatively low velocity magnitude which can be also seen in Fig.9.With regard to MK kernel considering elongation of drops, obviously, gentle velocity gradient, at this area,lacks capability to elongate drops, then to break drops, and instead,the aggregations of drops occupy dominance.This accordingly explains comparatively larger Sauter mean diameters at this area.
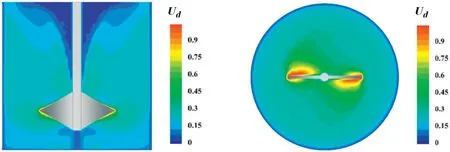
Fig.9.Contour plots of velocity magnitude of dispersed phase(Ud, m ⋅s-1)for Case 1 at 200 s viewed from the cross sections cut respectively along the diameter of the bottom face and the height of 28 mm.
The comparison of DSD predicted by AP kernel and MK kernel for Case 1 with experimental data can be seen in Fig. 11. It is informed that the majority of drops,for AP kernel,possess the diameter between 200 μm and 400 μm,whereas the drop diameter predicted by MK kernel numerously locates in the range of 80 μm and 200 μm,just more closer to experimental data.This equally indicates that,for DSD,the results obtained by MK kernel also present more decent agreements with experimental data and it is more suitable to adopt MK kernel to study the liquid-liquid behaviour in a stirred vessel.
For the purpose of investigating the impacts of configurations of newly developed agitators on Sauter mean diameter, Case 2 to 5 in terms of different porosity and Case 6 to 8 focusing on hole diameters were experimented and simulated,the results of numerations for Case 2 to 5 predicted by AP kernel and MK kernel as well as the comparisons with experimental data can be found in Figs.12 and 13.As expected,conspicuous discrepancies for results with both kernels is observed and the results with MK kernel have better agreement with experimental data.This strengthens the thoughts that MK kernel indeed receives better satisfactory than AP kernel.Moreover,it needs to be noted that the curve in Fig.13 for presenting the trend of Sauter mean diameter predicted by AP kernel for porosity of 37.8%is not always declining to be steady just like other curves.This might be caused by the selection of initialization.Although,for stirred process, the influences on final Sauter mean diameter of different initializations are insignificant,but initialization indeed has effects on results of initial process.

Fig.11.Comparison of DSD predicted by AP kernel(blue line)and MK kernel(red line)for Case 1 with experimental values(black line)for Case 1.
Following,the numerical results of Case 6 to 8 and the comparisons with corresponding experimental results are displayed in Figs. 14 and 15.As the same as the results of porosity,The Sauter mean diameters with MK kernel for these three cases are more consistent with experimental data, whereas predictions with AP kernel significantly overestimate the Sauter mean diameter.As mentioned above, this is due to that MK kernel accounts for the elongations of drops caused by velocity gradient approaching to agitator,which are proved to be reverent in fragmentation of drops.

Fig.10.Contour plots of Sauter mean diameter(d32, m)by AP kernel(top left)and by MK kernel(top right)at 200 s,and the volume fraction of dispersed phase by AP kernel(bottom left)and by MK kernel(bottom right).

Fig.12.Comparison of the time evolution of Sauter mean diameter predicted by AP kernel(solid line) and MK kernel (dashed line) for Case 2 (red line) and Case 3 (blue line)with experimental values for Case 2(red square)and Case 3(blue triangle).
Now,the detailed analysis of influences of porosity and hole diameter on Sauter mean diameter is carried out.By experiments for porosity and hole diameter and corresponding numerations,the results showing the relationships between Sauter mean diameter and each parameter as well as the predictions by AP kernel and MK kernel at 600 s can be seen in Fig.16.From(a)in Fig.16,the Sauter mean diameters predicted by both kernels equally present a rising tendency as the values of porosity increase.This can be explained by displaying the contour plots of velocity magnitude for dispersed phase at the height of 28 mm,just the cross section at the blade tips,which are reported in Fig.17.It is obviously seen that the velocity of the fluid passing through the holes is not as high as expected,on the contrary,the existence of holes decreases the velocity of fluid at the blade tips.This shows that the enhancement of eddy effect caused by holes cannot offset the loss of turbulent level due to the decrease of the blade surface which is able to prompt fluid movement.Therefore,smaller velocity gradient is obtained so that the eventual Sauter mean diameters increase when the values of porosity rise. However, the outcomes of experiments show that the Sauter mean diameter first decreases and then rises with the increase of porosity, and the minimum value is obtained when porosity of 6.3%is selected. This indicates that even though constantly increased Sauter mean diameters are predicted by numeration as the porosity rises due to the decrease of velocity gradient,the existence of appropriate holes,in fact by experiments,acts on the breakage of drops with the thought that the boundaries of holes are capable of lacerating the drop surface.The distinction between numerations and experiments might be owing to disability of simulation for tearing forces caused by agitator,and the numeration for breakage events mainly concentrates on the shear stresses caused by velocity gradient of fluid or collisions between eddies and drops.
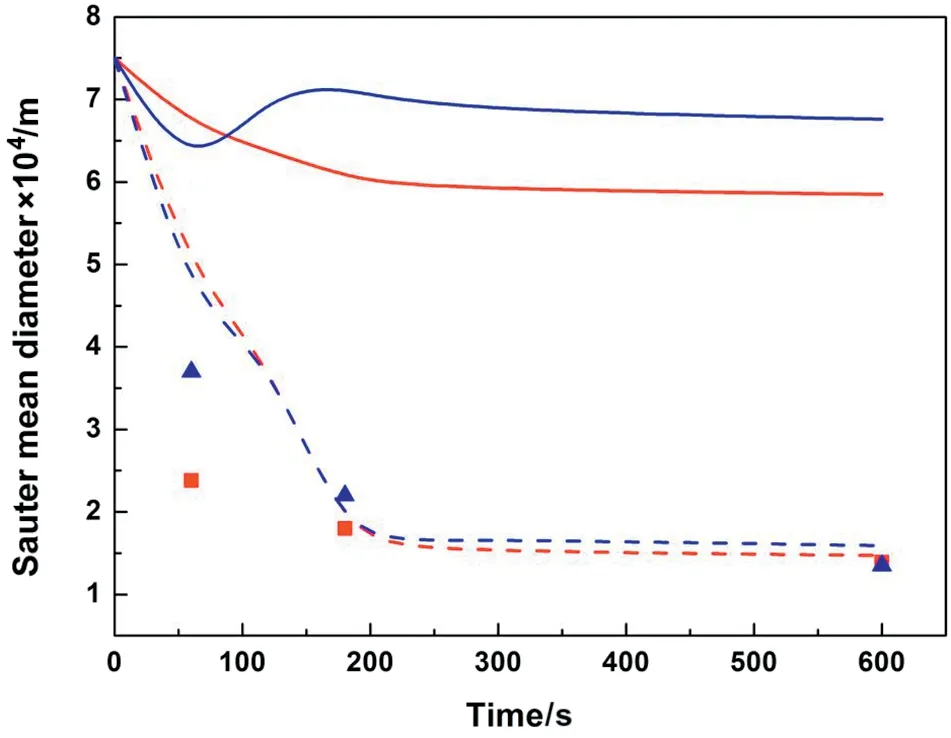
Fig.13.Comparison of the time evolution of Sauter mean diameter predicted by AP kernel(solid line)and MK kernel(dashed line)for Case 4(red line)and Case 5(blue line)with experimental values for Case 4(red square)and Case 5(blue triangle).

Fig.14.Comparison of the time evolution of Sauter mean diameter predicted by AP kernel(solid line)and MK kernel(dashed line)for Case 4(blue line)and Case 6(red line)with experimental values for Case 4(blue square)and Case 6(red triangle).
Next,the relationship between Sauter mean diameter and hole diameter as well as results of numerations at 600 s are presented in(b),same porosity is assumed.It is found that the curves of results obtained by both kernels decease at first and then rise as the hole diameter increases, roughly same tendency(although inconspicuous) can be found when analyzing the results obtained by experiments,the only difference is the hole diameter contributing to minimum Sauter mean diameter. But, the final Sauter mean diameters under different hole diameters with MK kernel and experiments practically show similarity.These results indicate that appropriate hole diameter can promote drop breakage, but in general,the effect of this parameter on Sauter mean diameter is insignificant.At end but not least,these results also authenticate that the Sauter mean diameter predicted by MK kernel,compared with AP kernel, is much closer to the experimental data,showing MK kernel is more applicable.
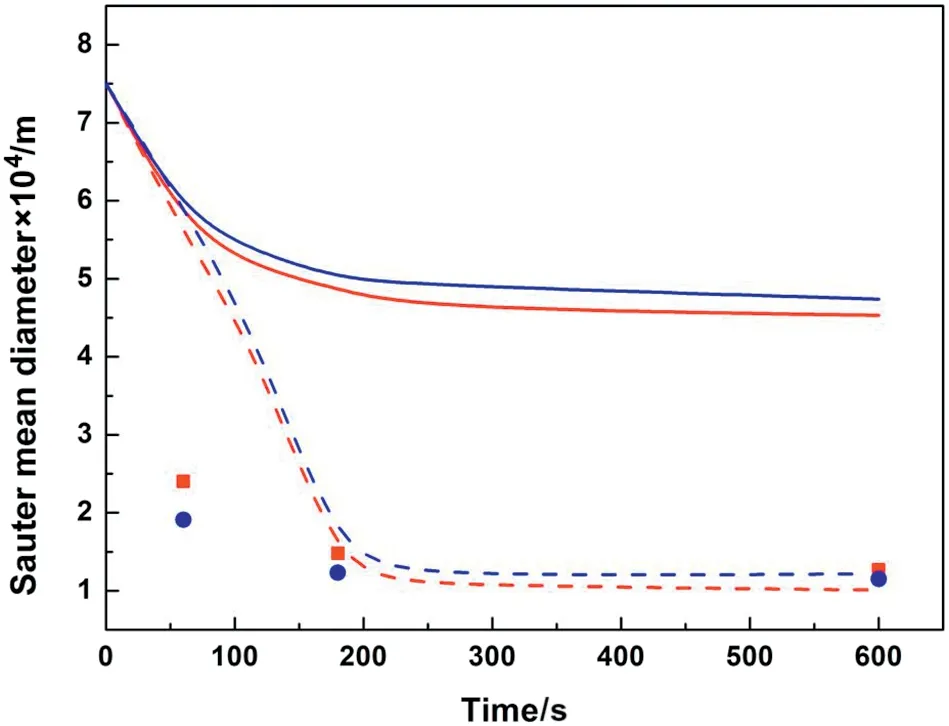
Fig.15.Comparison of the time evolution of Sauter mean diameter predicted by AP kernel(solid line)and MK kernel(dashed line)for Case 7(red line)and Case 8(blue line)with experimental values for Case 7(red square)and Case 8(blue circle).

Fig.16.Sauter mean diameter versus different configurations of agitator at 600 s:(a)porosity,(b)hole diameter.
6.Conclusions
In this work,the simulations of phosphoric acid and TBP system for investigating liquid-liquid dispersion behaviour were carried out by coupling TFM with PBM solved by class method.All of the experiments were conducted in an unbaffled flat-bottom cylindrical vessel with a bottom diameter of 105 mm.Eight cases aiming to the influences of porosity and hole diameter on final Sauter mean diameter were focused and two different kernels (AP kernel and MK kernel which was developed on the basis of AP kernel) were adopted for studying the applicability for such specified system by comparing numerical outcomes with experimental results. Turbulent aggregation model was adopted to predict the coalescence of drops involved. All of the cases were performed with the commercial solver Fluent 16.1 associating with Gambit 2.4.6 and the corresponding experiments were implemented under the same temperature,same rotational speed and the same volume fraction of dispersed phase.The independence of grids and initializations were also carried out in this work.Eventually,the comparisons of Sauter mean diameter predicted by AP kernel and MK kernel and experimental data as well as the influences of configurations of agitator on final Sauter mean diameter were discussed,providing an advisable option for study of liquid-liquid system.
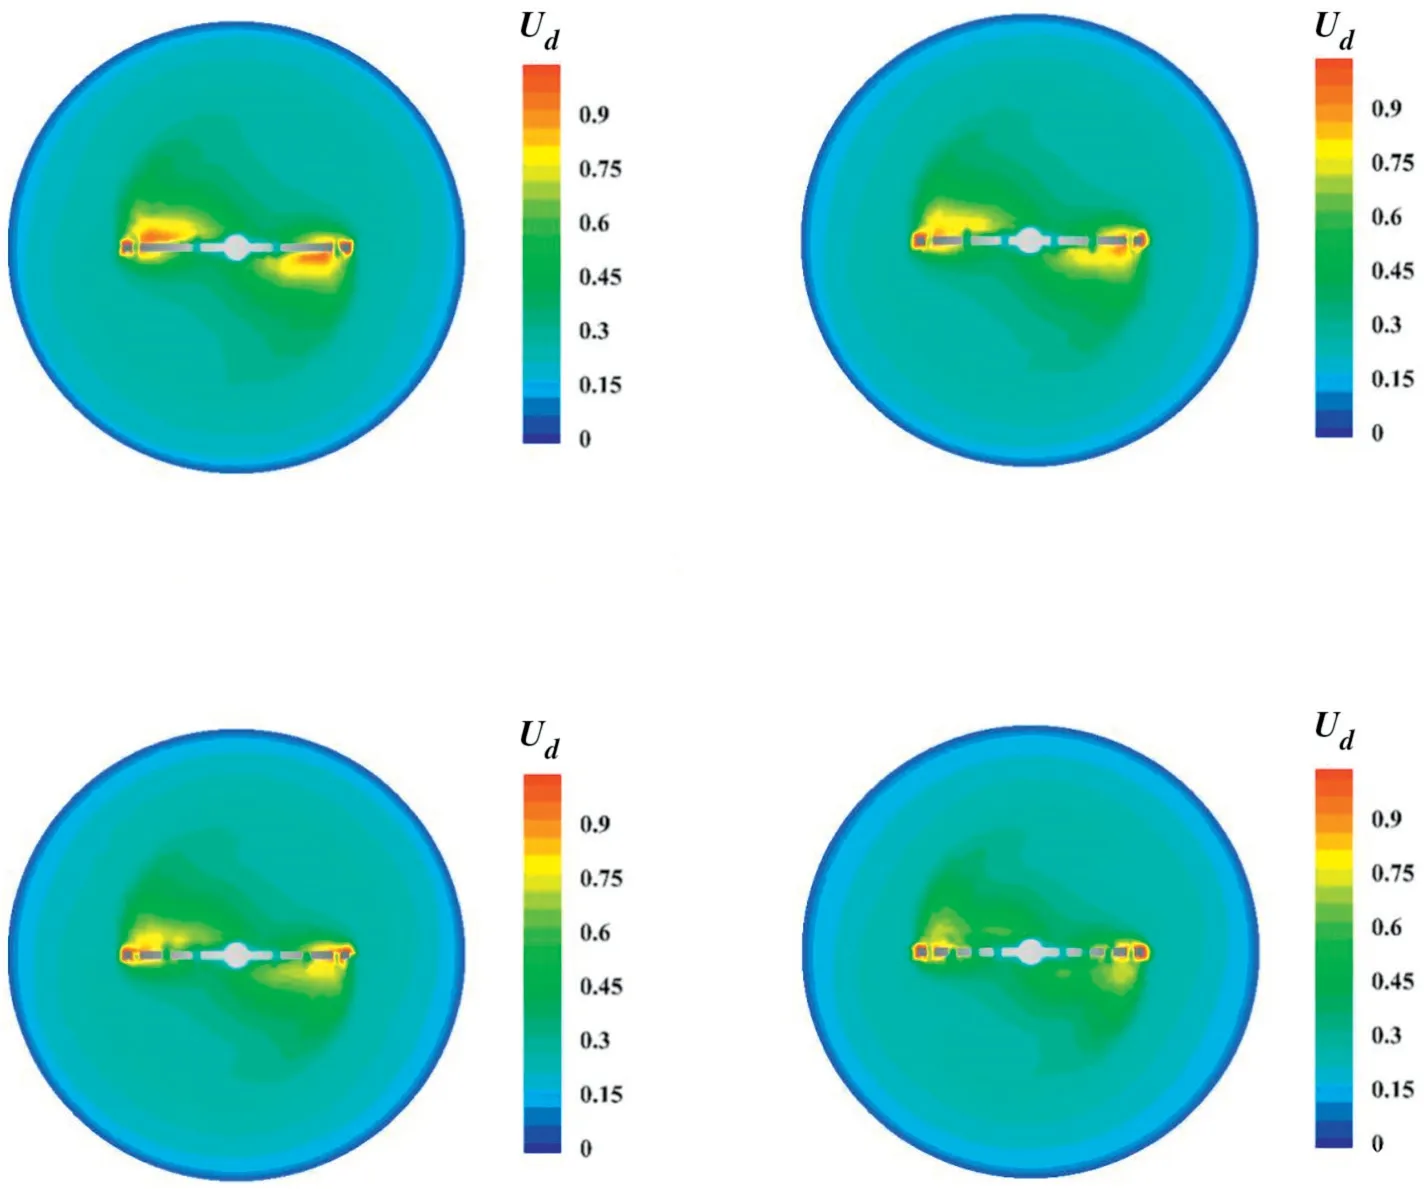
Fig.17.Contour plots of velocity magnitude of dispersed phase(Ud, m ⋅s-1)at the height of 28 mm with different porosity:6.3%(top left),15.8%(top right),22.1%(bottom left)and 37.8%(bottom right).
The results of simulations show that the Sauter mean diameters predicted by MK kernel, compared with AP kernel, have more decent agreement with experimental data,whether it is for different porosity,or for hole diameter,indicating the effect of drop elongations occurring at the regions approaching to agitator should not be neglected and meanwhile,give a valid approach to study liquid-liquid system.The contour plots of Sauter mean diameter with AP kernel show general homogeneity in the whole stirred vessel whereas the MK kernel does not for some different values exist at the regions nearby top shaft.It has been proved that the final Sauter mean diameters of different porosity and hole diameter are similar,showing that the influences of these parameters on final Sauter mean diameter are marginal, but adequate porosity and hole diameter are actually conducive to breakage of drops.
Nomenclature
b(d) breaking frequency,s-1
Ca Capillary number
Cacricritical Capillary number
CDdrag coefficient
c constant
D diameter of agitator,m
Dhdiameter of hole,m
d,dmdrop diameter and mother drop diameter,m
di,djthe diameter of drop i and drop j,m
ddrdiameter of daughter drop,m
dm,0primary diameter of a single drop,m
d32Sauter mean diameter,m
dm,eelongational drop diameter,m
dm,cricritical diameter of a drop,m
d0min diameter of drop,m
Finterinterfacial force,N
g gravitational acceleration,m ⋅s-2
H height of vessel,m
Hceclearance of agitator and bottom of the vessel,m
KVparticle volume coefficient
k turbulence kinetic energy,N ⋅m-1
Ni,Njnumber of drop i and drop j
n(d) drop size distribution
n rotating speed,r ⋅min-1
P(d|dm) daughter distribution function
p pressure,Pa
Re drop Reynolds number
Rc,RdReynolds-stress tensor of dispersed and continuous phase,N ⋅m-2
T bottom diameter of the vessel,m
t time,s
teelongation time,s
tb,ebreaking time,s
tresresidence time,s
tb,rrevised breaking time,s
tb,turturbulent breaking time,s
Ud,Ucaverage velocity of dispersed and continuous phase,m ⋅s-1
Ui,Ujvelocity of drop i and drop j,m ⋅s-1
Urrelative velocity,m ⋅s-1
˙U characteristic velocity,m ⋅s-1
V0min drop volume,m3
W width of blade tip,m
xijdimensionless correlation
αd,αcvolume fraction of dispersed and continuous phase
β(d,dm) coalescence frequency,s-1
γ shear rate,s-1
ε turbulent energy dissipation rate,m-2⋅s-3
˙ε elongation rate,s-1
η Kolmogorov microscale,m
θ porosity
κ pre-factor
μc,μdviscosity of continuous and dispersed phase,mPa ⋅s
ν dynamic viscosity,Pa ⋅s
ξijspecific function
π Circumference rate
ρd,ρcdensity of dispersed and continuous phase,kg ⋅m-3
σ interfacial tension,mN ⋅m-1
τc,τdviscous-stress tensor of dispersed and continuous phase,
N ⋅m-2
Subscripts
ag aggregation
b,br breakage
c continuous
cri critical
ce clearance
D drop
d dispersed
dr daughter
e elongation
h hole
inter interfacial
m mother
r relative
re revised
res residence
tur turbulent
V volume
 Chinese Journal of Chemical Engineering2019年5期
- Chinese Journal of Chemical Engineering的其它文章
- Assessment of the TFM in predicting the onset of turbulent fluidization☆
- CFD study on double-to single-loop flow pattern transition and its influence on macro mixing efficiency in fully baffled tank stirred by a Rushton turbine☆
- Heat transfer characteristics of molten plastics in a vertical falling film reactor☆
- Stabilizing silica nanoparticles in high saline water by using polyvinylpyrrolidone for reduction of asphaltene precipitation damage under dynamic condition
- Numerical simulation and experimental study on dissolving characteristics of layered salt rocks
- Removal of chloride from simulated acidic wastewater in the zinc production☆