
Soft-sensing modeling and intelligent optimal control strategy for distillation yield rate of atmospheric distillation oil refining process☆
2019-08-07 07:54ZhengWangChengShaoLiZhu
Zheng Wang,Cheng Shao*,Li Zhu
Institute of Advanced Control Technology,Dalian University of Technology,Dalian 116024,China
Keywords:Energy efficiency optimization Crude oil distillation Particle warm optimization Fuzzy C-means algorithm Working condition
ABSTRACT It is a challenge to conserve energy for the large-scale petrochemical enterprises due to complex production process and energy diversification.As critical energy consumption equipment of atmospheric distillation oil refining process,the atmospheric distillation column is paid more attention to save energy.In this paper,the optimal problem of energy utilization efficiency of the atmospheric distillation column is solved by defining a new energy efficiency indicator—the distillation yield rate of unit energy consumption from the perspective of material flow and energy flow,and a soft-sensing model for this new energy efficiency indicator with respect to the multiple working conditions and intelligent optimizing control strategy are suggested for both increasing distillation yield and decreasing energy consumption in oil refining process.It is found that the energy utilization efficiency level of the atmospheric distillation column depends closely on the typical working conditions of the oil refining process,which result by changing the outlet temperature,the overhead temperature,and the bottom liquid level of the atmospheric pressure tower.The fuzzy C-means algorithm is used to classify the typical operation conditions of atmospheric distillation in oil refining process.Furthermore,the LSSVM method optimized with the improved particle swarm optimization is used to model the distillation rate of unit energy consumption.Then online optimization of oil refining process is realized by optimizing the outlet temperature,the overhead temperature with IPSO again.Simulation comparative analyses are made by empirical data to verify the effectiveness of the proposed solution.
1.Introduction
In the 21st century,we meet with the challenges of energy shortages and environmental pollution.On the basis of the domestic data[1],the comprehensive energy consumption in the oil refining industry accounts for about one third of the total industrial energy consumption in China.According to a foreign research data[2],the average energy efficiency level of global refinery enterprises based on low calorific value calculation is about 94%,while that of European developed countries has reached more than 95%.The energy efficiency of China's refinery enterprises is lower(0.3%-0.5%)than the global average value.So accurate monitoring and real-time optimization of refinery production process for improving energy utilization efficiency and saving energy are becoming the focus of petrochemical enterprises increasingly.
On one hand,the industrial chromatograph is used to monitor the distillation yield online in the oil refining industry,of which the investment and the regular maintenance cost are high.With the continuous development of soft sensing technology, the intelligent prediction model based on data has gradually become the major modeling method for the oil refining process,and has made many achievements in theory and production practice. Atmospheric pressure refining process is a complex nonlinear process with a large number of variables,so it is difficult to build mechanism model.Soft sensing based on artificial neural network has developed rapidly in recent years,and has been applied in soft sensing model of oil refining atmospheric pressure process[3-6].However, artificial neural network leads to slow learning and overfitting of predictive models.Support Vector Machine(SVM)is based on modern statistical theory[7-9],which has the advantages of modeling non-linear high dimensional plant and small sample learning so as to overcome the shortcomings of long training time and over-learning.But SVM has the problems of optimizing and determining uncertain parameters(kernel parameters,insensitive parameters). Least squares support vector machine (LSSVM) is an improvement on the basis of support vector machines,and transforms the inequality constraints of the original method into equality constraints and greatly facilitates the solution of Lagrange multiplier alpha so as to improve the solution speed.Therefore,LSSVM method optimized with the improved particle swarm optimization improves the speed of algorithm and is more suitable for indicator prediction model in this paper. In order to solve modeling problems caused by the change of actual working conditions commonly happening in industrial process,Fuzzy C-means clustering algorithm is used to cluster samples into different typical working conditions and IPSO-LSSVM is used to construct the sub-models for each sub-class.
On the other hand,the optimization of the oil refining production process is considered from design optimization and operation optimization.Design optimization focuses on improving the function of the device. For example, the energy utilization efficiency of the distillation system was improved through the use of new tower elements and intermediate re-boilers[10,11].Recovering heat with heat exchanger networks or tower heat recovery reduced energy consumption and increased energy efficiency in refinery crude distillation units[12,13].The operation optimization is made on the basis of the existing equipment conditions, where some control parameters such as the feed temperature,feed flow rate,tower bottom temperature and reflux ratio,are changed for optimizing process operating conditions to reduce energy consumption. For example,optimizing crude distillation systems and heat exchanger network systems could reduce energy consumption[14-17].Optimizing the operation conditions of distillation tower with various algorithms could improve the overall economic benefits[18-20].Some studies improved production plans into multiobjective optimization problems to increase profit and reduce energy consumption[21,22].
The actual oil refining process in chemical industry is characterized by long production process,diversified forms of energy,large-scale enterprises and waste of resources. The energy consumption of atmospheric and vacuum distillation unit accounts for 25%-40%of the total energy consumption [23], which is the largest energy consumption device in refineries.According to the data analysis in Table 1[24],the distillation tower,as the critical equipment in the distillation process,has a huge energy-saving space with the highest energy-saving rate.Therefore,our purpose in this paper is that a new method from the perspective of optimizing energy utilization efficiency is suggested to save energy and improve economic benefit.
A new energy efficiency indicator—the distillation yield rate of unit energy consumption from the perspective of material flow and energy flow is defined. It is observed that the typical working conditions of the oil refining process are determined by considering the outlet temperature,the overhead temperature,and the bottom liquid level of the atmospheric pressure tower,and are classified on the basis of production data by the fuzzy c-means algorithm (FCM).The empirical data are dimensionality reduced through the mechanism analysis and PCA algorithm,and the input variables are selected including outlet temperature,overhead temperature,bottom liquid level of the atmospheric pressure tower, liquid control of constant top reflux tank, boundary control of constant top reflux tank,first atmospheric distillation temperature,second atmospheric distillation temperature,third atmospheric distillation temperature,feed temperature,bottom temperature of the atmospheric pressure tower,feed volume of raw materials and high pressure gas flow.The distillation yield rate of unit energy consumption is modeled by the LSSVM method optimized with the improved particle swarm optimization algorithm.The simulation results show that the multiple prediction models are more accurate than single model.Based on above prediction models,the online optimization of oil refining process is realized through optimizing the outlet temperature and the overhead temperature with IPSO. This method has strong realtime performance and obvious optimization effects, which have improved energy utilization efficiency and brought huge benefits to enterprises.
The remainder of this paper is organized as follows.The process flow of the oil refining process is analyzed in Section 2 for the optimization issues of the oil refining system,and a new indicator for energy efficiency evaluation of refining process is established.The fuzzy c-means algorithm(FCM)is employed to classify the typical working conditions related to energy efficiency changing on the basis of production monitoring data.Furthermore,the distillation yield rate of unit energy consumption is modeled by the IPSO-optimized LSSVM method,and the online balance control of oil refining process is discussed in Sections 3 and 4 respectively.Finally,some conclusions are summarized in Section 5.
2.Oil Refining Process Analysis
2.1.Flow of the oil refining process
The atmospheric distillation process refers to the production of side line products by fractionating the initial oil under normal pressure[25].Firstly,the initial base oil is heated by an atmospheric heating furnace and enters the atmospheric distillation column at atmospheric temperature after reaching the suitable temperature. Therefore, the atmospheric column is the core fractionator of the whole atmospheric pressure unit.The initial bottom oil entering the normal pressure bottom vaporizes first,and the initial oil component becomes lighter and the constant top oil and gas vaporizes from the top of the tower by the various tower plates and the related devices in the tower. Then the constant top oil and gas enter the atmospheric reflux tank at the top of the atmospheric tower and are separated into water, oil and gas. Part of the oil is distilled to the top of the atmospheric tower,while the other side products are slipped out in the liquid form.The heavy oil component at the bottom of the atmospheric tower is pumped from the pump to the vacuum furnace for heating.
2.2.Introduction of energy efficiency indicators for refining atmospheric pressure process
The consumption of the oil refining process mainly consists of applied energy mediums,fuel oil,fuel gas,steam,water and electricity.The consumption of fuel mainly takes place in the atmospheric furnace.Steam consumption is mainly used to produce system atomization steam and stripping steam.Electrical energy is mainly consumed by pumps,blowers and draught fans on various pipelines.The data about the above energy medium can be calculated with real-time statistics through the factory DCS.The normal side lines of product are followed by the first lines,the second lines and the third lines from top to bottom.The bottom product of the atmospheric tower is residual oil, which directly goes to the decompression system.The first line of product is generally used as kerosene distillate and refined by kerosene hydrogenation unit.The second line is used as a light diesel fuel fraction,and the third line is used as heavy diesel fractions.
At present,energy efficiency evaluation indicators for the refining and chemical industry are mainly divided into energy economicefficiency indicator and energy technology efficiency indicator.Energy economic efficiency indicators combine energy consumption with economic indicators such as GDP,industrial output and so on.For example,an integrated energy efficiency evaluation system integrates economy,environment and energy consumption.Energy technology efficiency is an analysis of energy consumption.For example,energy balance sheet and energy network diagram were established to evaluate energy consumption by energy balance method,which was visually intuitive[26].But the indicators were difficult to monitor in real time, which need large amount of calculations.A three-level energy efficiency indicator system was established for comprehensive energy consumption by process mechanism analysis method[27],which reflected the energy efficiency of the entire atmospheric and vacuum installations completely.However, the establishment of indicator did not combine industrial data with actual operating conditions and was not suitable for realtime monitoring.The output yield of unit energy consumption and the energy consumption of unit crude oil input were established [28],which were monitored with soft measurement methods.But the indicators were not reasonable as an optimization target of the energy efficiency, which did not consider the relationship between crude material input,product output and energy consumption synthetically.For example, the amount of product output increased due to the increase of crude oil input rather than the increase of the energy efficiency.

Table 1 The energy-band width in five typical processes(1 Btu=1055.056 J)
2.2.1.The establishment of the comprehensive energy consumption
A monitoring indicator,the comprehensive energy consumption,is set up for energy consumption from the perspective of the energy flow in the oil refining process.The greater the value of the comprehensive energy consumption indicator is,the greater the process energy consumption cost.The comprehensive energy consumption indicator can only reflect the amount of energy consumption,but cannot reflect the energy utilization efficiency.The formula for the comprehensive energy consumption in the oil refining process is as follows:

where E is the comprehensive energy consumption(kgoe·t-1),Hp is the high pressure gas flow(m3·h-1),Lp is the low pressure gas flow(m3· h-1), St is the stripping steam flow (t · h-1), Sb is the steam flow at the bottom of the tower (t · h-1), As is the atomized steam flow(t·h-1),Dp is the desulphurization and purification water flow(t·h-1),Eq is the electric quantity(kW·h·h-1), Cw is the constant top water injection flow(t·h-1),Iw is the initial top water injection flow(t·h-1);Cd is the constant top drainage flow(t·h-1),Id is the initial top drainage flow (t · h-1), De is the desalting and drainage flow(t·h-1),Fciis the different energy conversion standard coefficient.The data of energy consumption is collected once every hour, and the data unit is t · h-1or m3· h-1. The energy conversion standard coefficients in the above formula are shown in Table 2[29].
2.2.2.The establishment of the distillation yield rate
The distillation yield rate indicator is set up from the view of material flow in the oil refining distillation process,which reflects the utilization efficiency of raw materials.The distillation yield rate is the ratio of the side product output to the total crude oil input. The higher thedistillation yield rate is,the higher the utilization rates of raw materials and oil processing efficiency are.The main factors affecting this indicator are the pressure and temperature of the oil refining process[32].The data of side line output products are sampled 3 times a day through the online analyzer system with a time interval of 8 h.The formula for the distillation yield rate of the oil refining process is as follows:

Table 2 The energy conversion standard coefficients

where Pr is the distillation yield rate(%),Co is the component output of overhead and lateral lines in atmospheric and vacuum distillation(t),Cot is the total crude oil input(t),Ct is the constant top oil(t),RL1is the first regular line oil(t),RL2is the second regular line oil(t),RL3is the third regular line oil(t).
2.2.3.The output yield of unit energy consumption
The indicator is the ratio of the output yield to the comprehensive energy consumption of the refining oil process,which shows the relationship between energy consumption and product output.The greater the value of the indicator is,the more the output yield will be by consuming the same amount of energy.The formula for the output yield of unit energy consumption is as follows:

where Oec is the output yield of unit energy consumption(t2·kgoe-1);Co is the component output of overhead and lateral lines in atmospheric and vacuum distillation(t);E is the comprehensive energy consumption(kgoe·t-1).
2.2.4.The energy consumption of unit crude oil input
The indicator is the ratio of the comprehensive energy consumption to the input of crude oil,which reflects the total energy consumed by processing crude oil per ton.The greater the value is,the more energy is consumed by distilling the same amount of crude oil.The formula for the energy consumption of unit crude oil input is as follows:

where Eoc is the energy consumption of unit crude oil input(kgoe · t-2); E is the comprehensive energy consumption(kgoe·t-1);Cot is the total crude oil input(t).
2.2.5.New index—the distillation yield rate of unit energy consumption
Combined with the above energy flow and material flow indicator,new monitoring indicator for energy efficiency utilization in the oil refining process is set up.The distillation yield rate of unit energy consumption is the ratio between the distillation yield rate and the comprehensive energy consumption of the atmospheric distillation oil refining process.The greater the value of the indicator is,the more the output yield is by consuming the same amount of energy and crude oil.The formula for the distillation yield rate of unit energy consumption in the atmospheric distillation oil refining process is as follows:

Among them, Yet is the distillation yield rate of unit energy consumption(t·kgoe-1);Pr is the distillation yield rate(%);E is the comprehensive energy consumption(kgoe·t-1).
According to Eqs.(2)and(5),we can draw the following formula.

where ΔRoi is the relative output increase(t),which reflects the output increase by consuming the same amount of energy and crude oil.ΔRei is the relative economic increase (CNY), which reflects the economic increase.Up is the unit price of oil(CNY·t-1).
From the Eq.(5),the new indicator describes the relationship between the product output,the input of crude oil and energy consumption, which reflects the crude oil utilization efficiency of unit energy consumption in the statistical time.If the numerical value of new indicator is high,it indicates that the product output is large by consuming the same amount of energy and crude oil. In order to choose the appropriate energy efficiency indicator as the optimization target of the optimization strategy,we compare the new indicator with the indicators in reference[27]through the data in Table 3.
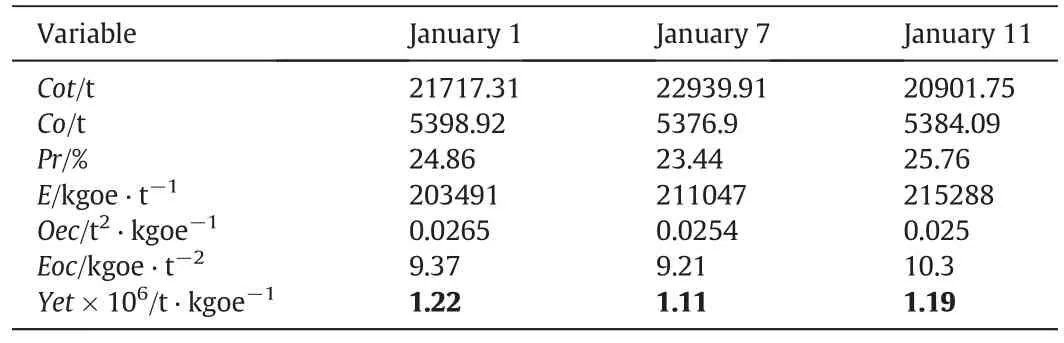
Table 3 Production data
Table 3 shows the production data of a refinery enterprise on January 1,January 7,January 11,in 2016.According to Eqs.(1)to(5),we calculate the value of indicator about energy efficiency indicator system of atmospheric process.By comparing the values of Oec for the two days of January 1 and January 7,it can be concluded that the energy efficiency on January 1 is higher than that on January 7.However,the values of Eoc are 9.39 kgoe·t-2and 9.21 kgoe·t-2,which means the energy efficiency on January 1 is lower than that on January 7.The reason is that the amount of crude oil invested on January 7th is larger rather than the increase of the energy efficiency.The distillation yield rate of unit energy consumption is 1.22 × 10⁻⁶t · kgoe-1and 1.11 × 10⁻⁶t · kgoe-1.According to Eqs.(6)and(7),we calculate ΔRoi17and ΔRei17:
which means that more than 509.083 tons of product oil are produced on January 1 than that on January 7 by consuming the same amount of energy and crude oil.The economy increases by 1 million 500 thousand CNY.Therefore,the energy efficiency is higher on January 1 than that on January 7 by comparing the values of the new indicator.
Similarly, by comparing the data for the two days of January 7 and January 11, the values of Oec are 0.0254 t2· kgoe-1and 0.025 t2· kgoe-1. The values of Eoc are 9.21 kgoe · t-2and 10.3 kgoe · t-2, which can be concluded that the energy efficiency level on January 11 is lower than that on January 7.However,the distillation yield rate on January 7 is significantly lower than that on January 11.Due to the large crude oil input,the energy efficiency level in January 7 is even higher,but the actual output yield in January 7 is relatively low.New indicator values are 1.11×10⁻⁶·t·kgoe-1and 1.19×10⁻⁶·t·kgoe-1,which illustrate that more than 373.8 tons of oil are produced on January 11 than that on January 7 by consuming the same amount of energy and crude oil.It's the conclusion that the energy efficiency on January 11 is higher than that on January 7.
Therefore, the distillation yield rate of unit energy consumption established in this paper is more reasonable as the optimization target of the optimization strategy than the indicators proposed in the Reference[27].
2.3.Analysis of the mechanism of the atmospheric pressure tower
The equilibrium-steady state model of the distillation process is a strict mathematical description of various physical and chemical properties and laws involved in the process of distillation under certain assumptions. Using the principles of material balance and energy balance,the MESH equations of block n plates can be obtained[31].
Component balance equation(M equation)

Phase equilibrium equation.(E equation)

Mole percentages return equation(S equation)

where m=1…c.
Energy balance equation(H equation)

where h is the liquid phase enthalpy;Gp is the gas phase molar flow rate,F is the feed volume of raw materials.the subscript m is the serial number of the components of the mixture, Lp is liquid phase molar flow rate,x is the molar fraction of liquid phase,y is the molar fraction of gas phase,Eq is mass transfer efficiency of trays,H is the gas phase enthalph,GC is the gas phase extraction flow rate of the tower plate side line,Qp is the heat exchange on the tray.The MESH equations composed of the above equations constitute the steady state mechanism model of the distillation column.
2.4.Select auxiliary variables with PCA
According to the above the steady state mechanism model and the actual monitoring point of the enterprise, the input variables of the prediction model can be selected as the feed volume of raw materials(F), the liquid control of constant top reflux tank (L), the boundary control of constant top reflux tank(G),the bottom liquid level of the atmospheric pressure tower(M)and the high pressure gas flow(Q).
In addition,fifty-two variables are collected through the enterprise DCS,which involve all the variables related to the atmospheric pressure tower and the atmospheric pressure furnace.The PCA algorithm is used to screen the fifty-two variables.The eigenvalues of the variables are shown in Fig.1 and Table 4,where T1is the outlet temperature,Tc is the overhead temperature, Td is the bottom temperature of the atmospheric pressure tower,Tj is the feed temperature,Oc is the oxygen content in constant pressure furnace,Pa is the pressure of atmospheric furnace.
Fig.1 shows that the sum of the eigenvalues of the first four variables has reached 95%,which meets the feature requirements.Therefore,the outlet temperature(T1),the overhead temperature (Tc),the bottom temperature of the atmospheric pressure tower(Td)and the feed temperature(Tj)are selected as auxiliary variables.According to previous studies[30],the atmospheric distillation temperature of each side line has a great influence on the distillation yield rate.Therefore,the predictive model input variables are the outlet temperature(T1),the overhead temperature(Tc),the bottom liquid level of the atmospheric pressure tower(M),the liquid control of constant top reflux tank(L),the boundary control of constant top reflux tank(G),the first atmospheric distillation temperature (TL1), the second atmospheric distillation temperature(TL2),the third atmospheric distillation temperature(TL3),the feed temperature(Tj),bottom temperature of the atmospheric pressure tower(Td),feed volume of raw materials(F)and high pressure gas flow(Q).
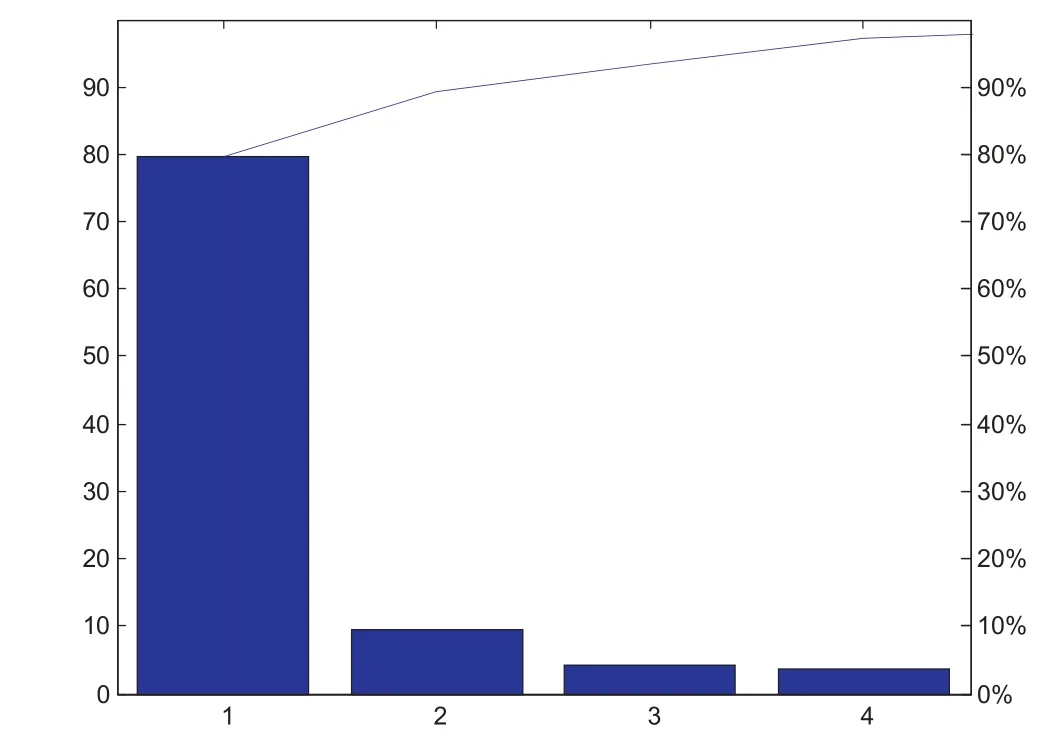
Fig.1.PCA eigenvalue.

Table 4 PCA dimensionality reduction eigenvalues
3.Multiple Prediction Model
3.1.FCM algorithm
FCM algorithm is a partition based clustering algorithm.In 1973,Bezdek proposed FCM algorithm,which was an improvement of the early hard C means clustering(HCM)method[32].Its idea was to determine the degree of each data point belonging to a certain degree of clustering by membership degree, and make the maximum similarity between the objects divided into the same cluster,while the similarity between the different clusters was the smallest.The main difference between FCM and HCM was that FCM used fuzzy partitions[33],so that the degree of membership of each given data point was determined by the membership value between 0 and 1.X=[x1,x2,……,xN]T∈ RN×r,where N is the number of samples,xi=[xi1,xi2,……,xir]is a r dimensional feature vector. c is the number of clusters (1 < c < N), dij= ‖xj- vi‖ is the Euclidean distance from the sample xjto the cluster center vi,vi∈Rr,(1 ≤ i ≤ c),uijis the membership degree of sample j to cluster i.

Fuzzy C-means clustering algorithm steps are as follows:
(1) Set the number of clusters,algorithm termination threshold,the weighted index and the maximum number of iterations allowed.
(2) Initialize each cluster center.
(3) Calculate membership function with the current clustering center.
(4) Update the cluster centers with the current membership function.
(5) Determine whether to stop operation according to the termination conditions.
When the algorithm is over,all kinds of cluster centers and membership degrees are obtained, thus the fuzzy clustering classification is completed.
3.2.LSSVM algorithm
Least squares support vector machine(LSSVM)is an improvement on the basis of support vector machines,which has significant contribution to solve the problems of non-linear,finite sample,high dimension and so on.The least squares support vector machine is solved in the original dual space, which is differ from loss function in vector machines.It uses the least-squares linear system as a loss function instead of a traditional quadratic programming method.Least squares support vector machine turn the inequality problem into a linear problem by solving the linear KKT(Karush Kuhn Tucker)system to solve the convex optimization problem,particularly in terms of quadratic optimization problem.Compared with the support vector machine,LSSVM algorithm is faster,so it is becoming more and more concerned in the field of soft measurement.In addition,compared with the standard support vector machines,the least squares support vector machine has great generalization ability,and improve speed of solving the problem and the convergence precision.The algorithm is simple and fast,and it has been used widely in process modeling[34-36].
There are training samples,where for inputs of dimensional training samples,for the outputs samples.The objective optimization problem of LS-SVM algorithm can be described as
where J is loss function,∅(xi)is the nonlinear kernel space mapping function,ω is weight vector,b is the deviation amount,eiis the error variable, γ > 0 is the regularization parameter or penalty factor.Lagrange method is used to solve this optimization problem,in order to transform the constrained optimization problem into an unconstrained quadratic programming problem,the Lagrange multiplier αiis introduced

And finally get the LS-SVM regression function model

Different kernel function types have different model accuracy.So the improved particle swarm optimization algorithm can be used to determine,and then optimal value can be obtained to improve the generalization ability of the model.
3.3.IPSO algorithm
Particle swarm optimization(PSO)algorithm is a kind of intelligent optimization algorithm for simulating the flight behavior of bird flock,which achieves the optimal goal through collective collaboration among birds.In the course of the basic PSO algorithm,an initial population is randomly generated and a random velocity is given to each particle.These particles depend on the experience of their own and the most adaptive particle experience to optimize their position in the dimensional space.The IPSO optimization algorithm[37]is put forward in order to solve the problem that the basic particle swarm optimization algorithm is easy to fall into local extremum,slow convergence rate and low precision in the later stage of evolution. Therefore, the particle iteratively updates its position and speed by Formula(16):

where ω is the inertia weight factor,generally between 0.1 and 0.9;c1and c2are the learning factors with positive values;the number of r1and r2is between 0 and 1;Pidis the optimal position of the current individual;gdis the best position of the current group;xi(t)is the current position of the particle;xi(t+1)is the location of the next particle;vi(t)is the current velocity of the particle and vi(t+1)is the velocity of the particle at the next moment.The average value of pα(t)for all particles is better than that of pi(t)and inferior to all the individual positions of all other particles;c3is a newly introduced learning factor and r3is a newly introduced random number.
3.4.Working condition classification
According to Section 2.4,the outlet temperature(T1),the overhead temperature(Tc),and the bottom liquid level of the atmospheric pressure tower(M)are selected as the clustering attributes in this paper.Then FCM clustering is used to classify the stable operation data into different working conditions,and finally models are established for each working condition. The data of June 2015 to June 2016 is collected from the enterprise,which is collected by DCS and the acquisition frequency is every hour.The output yield is sampled three times a day with the online analyzer system at an interval of 8 h.Pre-processing is used to exclude abnormal data and pathological data and 470 groups of data are selected finally.Among them,300 groups used as training data are clustered,and 170 groups are used as the test data to verify the generalizing ability of the models.The maximum number of iterations of the FCM method is set as 100,with iterative termination error ε=10-5,weighted index m=2.The number of clusters cannot be too large;otherwise it will lose the necessary clustering.The number cannot be too small so that the data can't be classified perfectly.The number of clusters is 3.Classification results are shown in Table 5.
Table 5 shows the clustering centers of the outlet temperature,the overhead temperature, the bottom liquid level of the atmospheric pressure tower and the proportion of different operating conditions.It can be seen that the ratio of working condition 1 is the largest,which is 45.67%,and its distillation yield rate of unit energy consumption is relatively low. The ratio of working condition 2 is the smallest, which is 25.66%,and its distillation yield rate of unit energy consumption is the highest.In conclusion,the overall energy efficiency level of the enterprise is low and there is a lot of space for promotion,which provides a theoretical basis for the improvement of the energy utilization efficiency by optimizing the outlet temperature and the overhead temperature.
The corresponding actual situations under different working conditions after clustering are compared to illustrate the rationality of the working conditions classification,which are shown in Fig.2.There are obvious differences in the distillation yield rate of unit energy consumption under different working conditions.The center of bottom liquid level and the outlet temperature on condition 1 are relatively low,the distillation yield rate of unit energy consumption is between 5.2×10⁻⁵t·kgoe-1and 5.8×10⁻⁵t·kgoe-1,and the average valueis low.The center of bottom liquid level and the outlet temperature on condition 2 are the highest,the distillation yield rate of unit energy consumption is between 5.9×10⁻⁵t·kgoe-1and 7×10⁻⁵t·kgoe-1,but the energy efficiency fluctuation amplitude is the largest.The center of bottom liquid level and the outlet temperature are middle,the distillation of unit energy consumption is between 5.8×10⁻⁵t·kgoe-1and 6.1×10⁻⁵t·kgoe-1,and the energy efficiency values are stable.These show that the distillation yield rate of unit energy consumption is very different under different conditions.It is difficult to describe the energy efficiency under all working conditions by a single model,so the corresponding models refer to typical working conditions are established to meet the model prediction.
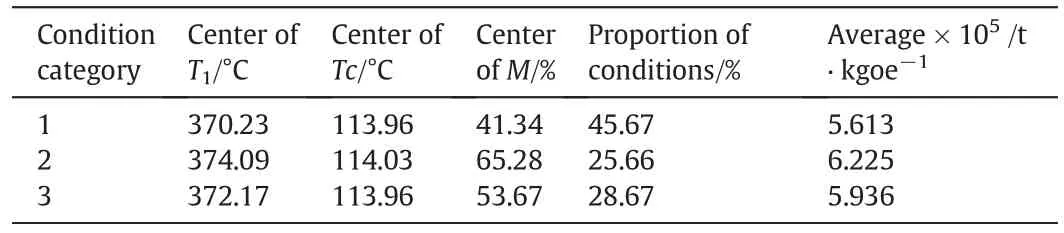
Table 5 Cluster results of FCM working condition
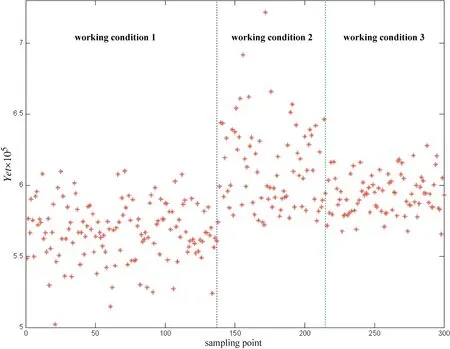
Fig.2.Classification diagram of working conditions.
3.5.Multiple LSSVM model modeling steps
1969,Bates and Granger proposed the idea of multi model modeling.The models were divided into several subsystems,and then each subsystem was modeled.Finally,the subsystems were combined effectively in a certain way.Thus,the prediction accuracy and robustness of the model were improved. Multi-mode modeling method is an effective method to solve the modeling problems of different working conditions in industrial process[38,39],which can avoid the soft measurement model deviation caused by the change of actual working conditions.The method of multiple models combines the training samples into c classes.Each class is a typical working condition.Then,the prediction model is established by using the data of each typical working condition.Therefore,multiple models modeling method is used in this paper.
Multiple LSSVM model modeling of the distillation yield of unit energy consumption,the specific process is as follows:
Step 1 Data preprocessing,normalization of unit outlet temperature,overhead temperature and bottom liquid level of atmospheric pressure tower are taken to eliminate the influence of sample dimension.Then FCM algorithm is used to classify the training data set x into c typical working condition. Cluster centers and membership matrix U of various working condition are obtained.
Step 2 The least squares support vector machine(LSSVM)is used to establish each clustering model,and the penalty factor γ and kernel parameters σ are optimized by IPSO algorithm.Thus c sub models fi(k)are obtained,i=1,2…c.
Step 3 Normalize the new samples and obtain the fuzzy membership degree uiof each working condition.
Step 4 Maximum membership principle is used to determine which working conditions the samples belonging,and the corresponding model is used to predict the final output.
3.6. Multi-model modeling of the distillation yield per unit energy consumption based on fuzzy clustering
In this paper,the outlet temperature,constant top temperature and low pressure level of the atmospheric tower are selected as clustering properties.FCM clustering is used to classify the data of the atmospheric pressure process. Models of each working condition are established after FCM clustering.Through PCA dimensionality reduction and mechanism analysis, the predictive model input variables are selected in Section 2.4.
Using the data mentioned in Section 3.4,we select 300 groups as training data,and 170 groups are used to generalize the test model.In order to validate the feasibility and effectiveness of the model, preprocessing of data is taken to eliminate the abnormal data and pathological data.The sample data is normalized as:

The LSSVM sub models are established for each working condition and the super parameters γ and σ of each sub model are determined by the IPSO algorithm.MSE is used in this paper to evaluate the models:the smaller the MSE is,the better the prediction of the model is.The formula is shown as follows

The training samples mentioned in Section 3.4 are divided into three working conditions.The prediction models of the three operating conditions are shown in Figs.3 to 5,and the parameter values of each working condition are shown in Table 6.

Fig.3.Prediction model of operating condition 1.
The super parameters of model on condition 1 are γ=30.85,σ=10.61 and MSE = 5.2955 × 10⁻⁴. Super parameters of model on condition 2 are γ = 25.35, σ = 15.28 and MSE = 7.2833 × 10⁻⁴.Super parameters of model on condition 3 are γ=35.78,σ=12.06 and MSE=4.4134×10⁻⁴.
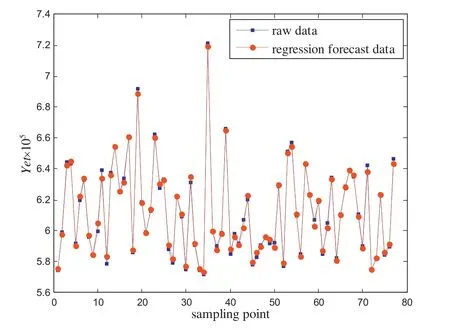
Fig.4.Prediction model of operating condition 2.
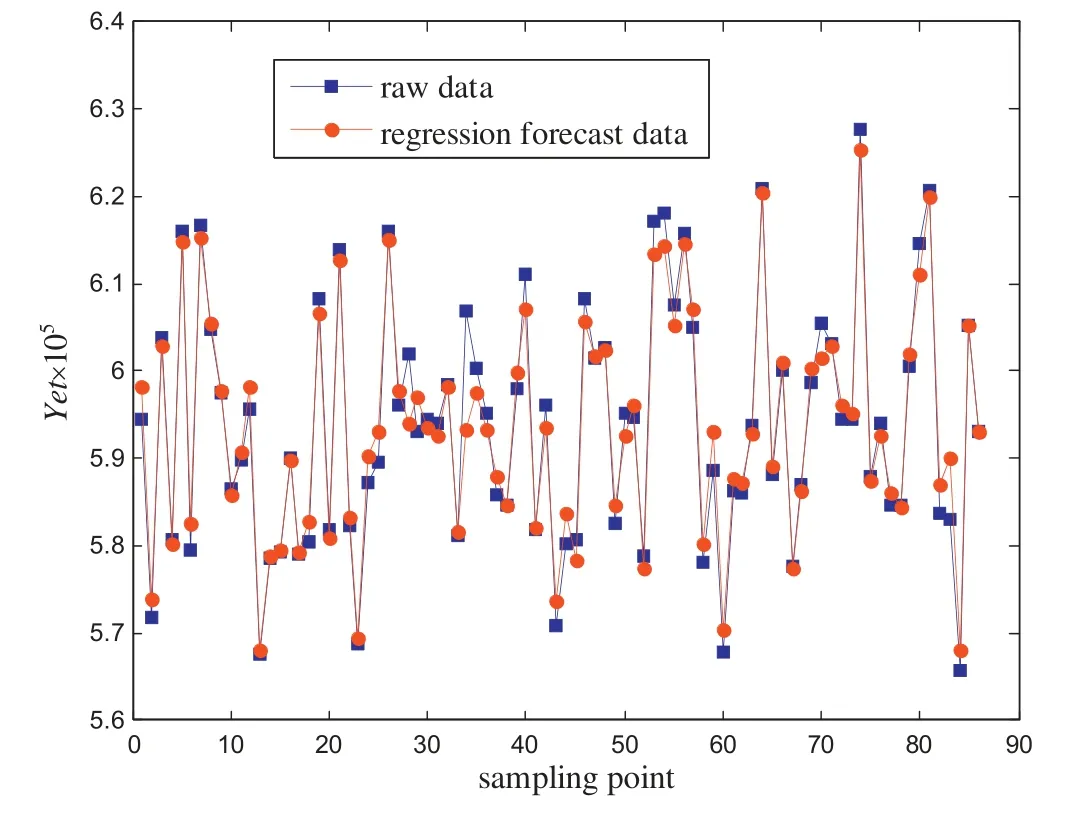
Fig.5.Prediction model of operating condition 3.

Table 6 Parameter values of each working condition
The generalization ability of the model is illustrated by test samples. First, the test sample needs to be classified. In this paper, the classification of the working condition is determined by calculating the membership degrees of new samples in each working condition to determine the category, and then the prediction model is established for sub model corresponding to the typical working conditions.According to the maximum membership criterion,the membership degree of each sample are shown in Figs.6 and 7,where the blue dots,the red dots and the green dots indicate the membership degree of working condition 1, working condition 2 and working condition 3,respectively.
After determining the typical working conditions, the sub unit model has been modeled.The models of the distillation of unit energy consumption are established and compared by using the BP neural network, the IPSO-SVM, the IPSO-LS-SVM and the FCM-IPSO-LSSVM in order to illustrate the effectiveness and superiority of the FCM-IPSO-LSSVM algorithm.The results are shown in Figs.8 to 10 and Table 7.

Fig.6.Membership degree of test sample.

Fig.7.Working condition of the test sample.

Fig.8.Comparison diagram of distillation yield rate of unit energy consumption by BP and IPSO-SVM.
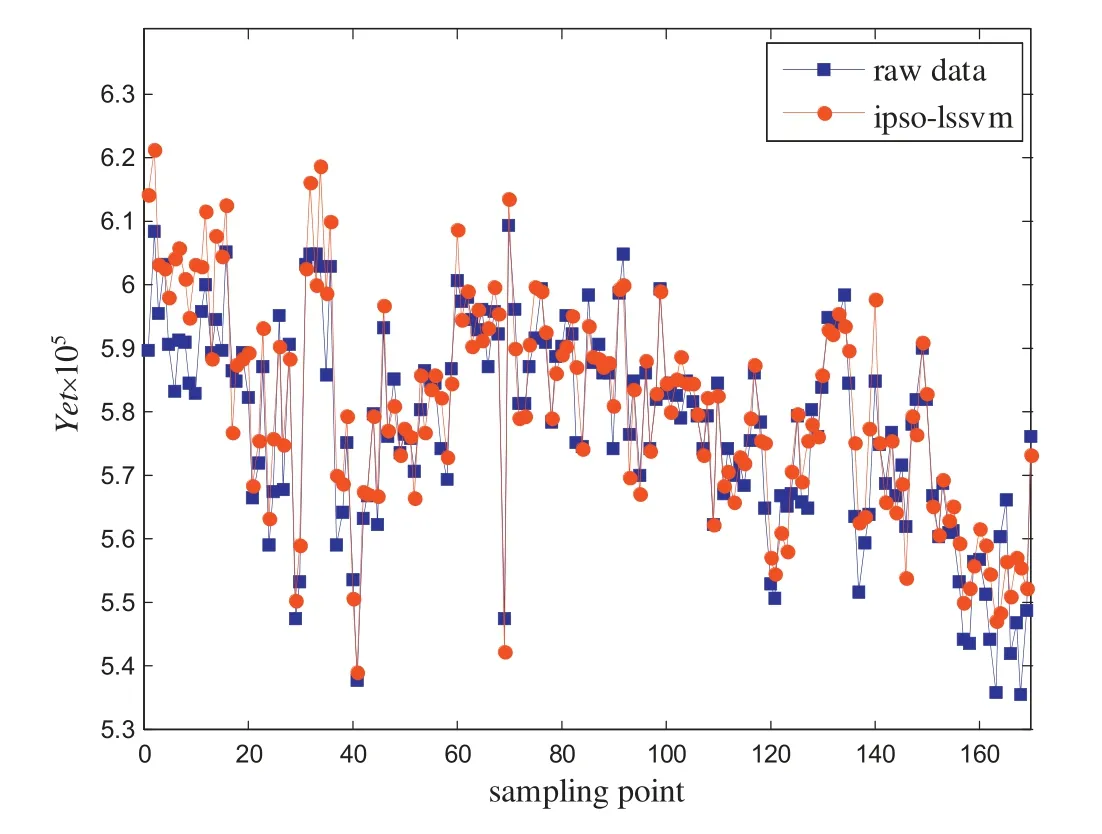
Fig.9.Comparison diagram of distillation yield rate of unit energy consumption by IPSO-LSSVM.
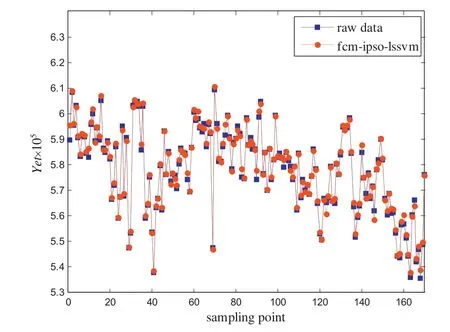
Fig.10.Comparison diagram of distillation yield rate of unit energy consumption by FCMIPSO-LSSVM.
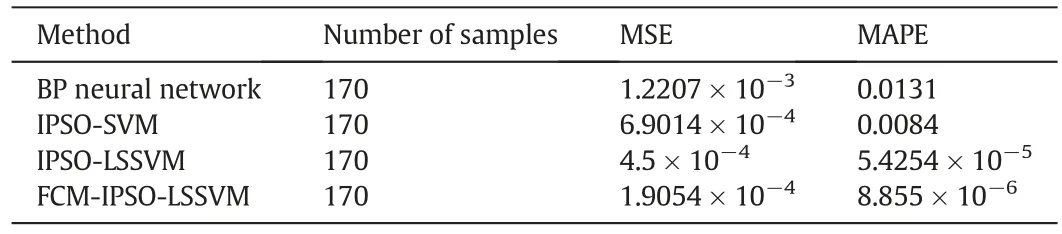
Table 7 Error comparison
From the comparison of Table 7,it can be seen that the error of the FCM-IPSO-LSSVM model is smaller,and the prediction effect is better.The effectiveness of the method is illustrated by simulation analysis.
4.Optimal Control of Energy Efficiency Based on IPSO
In the actual industry,the temperature parameters such as the boiling point and outlet temperature are fixed at a predetermined value.However,the temperature parameters change within the permissible range in the wake of different working conditions,which can improve the yield of products and reduce energy consumption.Therefore,we select the outlet temperature and the overhead temperature as the operating variables of optimization. Meanwhile, the liquid control of constant top reflux tank and the bottom temperature of atmospheric pressure tower are also considered.Based on the prediction models in Section 3,the optimization method is suggested by optimizing the temperature control parameters with IPSO algorithm.Thus the optimal outlet temperature and the optimal constant top temperature are obtained in real time,which are sent to the temperature control system to adjust the temperature parameters of the distillation refining process.
4.1.Objective function and optimization variables
To improve the product yield and reduce the energy consumption are currently common concerns in the refinery enterprise.Energy utilization efficiency can increase by increasing the product output or reducing energy consumption.Therefore,the distillation yield rate of unit energy consumption is selected as the objective target. Based on the prediction models in Section 3,the optimization problem is described as follows:

where the variables are shown in Section 2.4.
The bounds of variable values are shown in Table 8 where the optimal outlet temperature and constant top temperature range are 367°C to 385°C and 100°C to 150°C.The scope of the control variables is set according to the actual plant equipment requirements and the normal pressure process principle,which meets production process conditions.In other word,the scope of variables can be adjusted in time according to production needs.
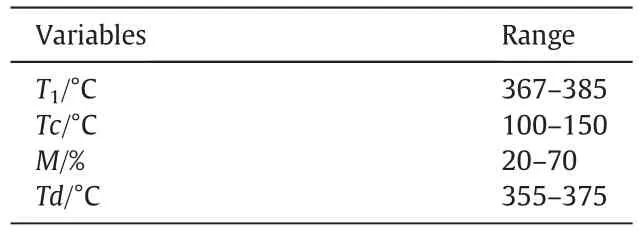
Table 8 Bounds of variable values
4.2.Optimization methodology
The specific steps of using IPSO for the distillation yield of unit energy consumption optimization control are as follows:
Step 1 Initialize the IPSO parameters,including the numbers of the population,the learning factor,the maximum iteration number,the inertia weight,the initial position and velocity of the particles.
Step 2 Carry out the prediction output in the distillation yield of the unit energy consumption model given the current set of parameters.
Step 3 In iteration,the values of the fitness functions of each particle are calculated.
Step 4 By controlling the two main parameters of outlet temperature and constant top temperature,the maximum value of the target function is determined.This is then used to find the optimal position of each particle itself,compare it with the optimal position of the population,and add the optimal position as the optimal position of the group.
Step 5 Update the location and speed of the particle constantly to determine whether the IPSO end condition is met;if the solution is satisfied,the output is optimal.Otherwise,it returns Step 3 to start a new search.
4.3.Optimization results
In order to verify the effeteness of this optimization strategy,the test data of 170 groups are simulated by IPSO algorithm,where the population size is 5,the maximum iteration number is 200,the learning factor is 1.2,and the inertial weight is 0.5.The particles'initial positions and initial velocities are randomly generated.
Figs.11 and 12 show the values of outlet temperature and constant top temperature before and after optimization.The red line is the values after optimization and the blue line is the values before optimization.The optimal temperature values are obtained within the permissible range according to the real time conditions through IPSO algorithm.
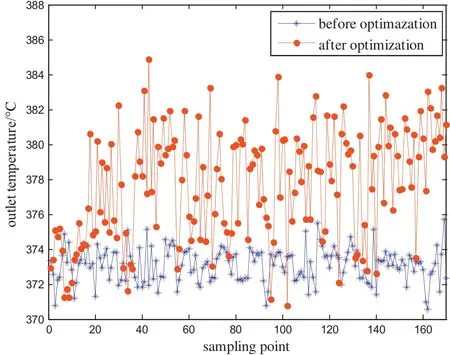
Fig.11.Values of outlet temperature before and after optimization.

Fig.12.Values of constant top temperature before and after optimization.
Fig.13 shows the distillation yield rate of unit energy consumption before and after optimization,where it is clear that energy efficiency greatly improves after optimization.Fig.14 shows the difference values of the distillation yield rate of unit energy consumption before and after optimization.
According to Eq.(5),we can draw the following formula.

where Yet is the distillation yield rate of unit energy consumption(t·kgoe-1),Pr is the distillation yield rate(%);E is the comprehensive energy consumption(kgoe·t-1).
According to Eq.(20),the values of distillation yield rate after optimization can be calculated.Through taking the maximum of distillation yield rate of unit energy consumption as the optimization objective,the comparison value of distillation yield rate is shown in Fig.15.It can be seen that the distillation yield rate has also improved after optimization.For better comparison,Fig.16 is the value of distillation yield rate by taking the maximum distillation yield rate as the optimization objective.

Fig.13.Distillation yield rate of unit energy consumption before and after optimization.
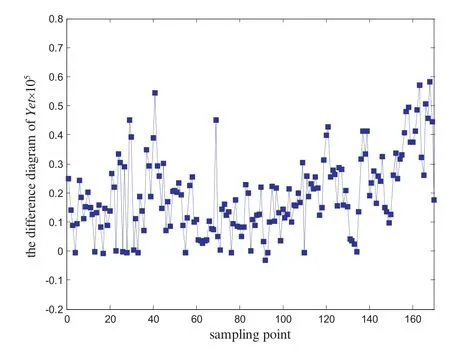
Fig.14.Difference values of the distillation yield rate of unit energy consumption.

Fig.15.The distillation yield rate before and after optimization.

Fig.16.The distillation yield rate before and after optimization by taking the maximum distillation yield rate as the optimization objective.
According to Eqs.(2)and(5),we can draw the following formula.

where Prh is the distillation yield rate after optimization,ΔFT is the relative increase yield(t·h-1),which reflects the increase in the yield by consuming the same amount of energy and crude oil after optimization,ΔET is the relative economic increase(CNY·h-1),which reflects the economic increase, Up is the unit price of oil (CNY · t-1), Yeth is the distillation yield rate of unit energy consumption after optimization(t·kgoe-1),Yetq is the distillation yield rate of unit energy consumption before optimization(t·kgoe-1),Cot is the total crude oil input(t·h-1),E is the comprehensive energy consumption in the atmospheric distillation oil refining process.According to Eq.(22),the relative increase yield after the optimization of each sampling point can be calculated, which is shown in Fig.17.The average relative yield is 8.498 ton per hour by calculating the 170 sampling points.In other words,the oil output yield after optimization is 8.498 ton per hour more than that before optimization by consuming the same amount of energy and crude oil.The enterprise's annual production working time is 8400 h and the oil output yield increase 71383.2 tons per year.The annual economic benefit of the enterprise will increase about 200 million.
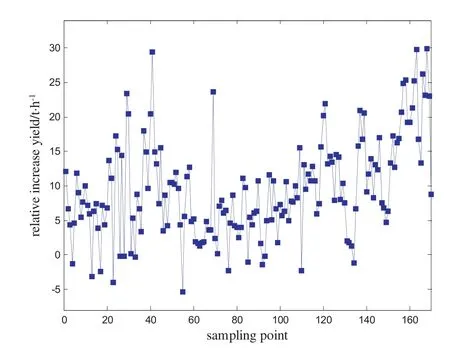
Fig.17.The relative increase yield before and after optimization.
The 163th set of data is selected from the 170 sets of data for detailed analysis to show the result of optimization more specifically.Table 9 shows the results of optimal operating parameters.Taking the maximum distillation yield rate of unit energy consumption as the target,the distillation yield rate of unit energy consumption after optimization is 5.9×10⁻⁵·t·kgoe-1,the distillation yield rate increased by 3.28%,the relative increase yield of production is 29.76 t·h-1and the relative economic increase is 89280 CNY·h-1.If we take the maximum distillation yield rate as the target,the distillation yield rate increase by 0.71%,the relative increase yield is 6.44 t·h-1and the relative economic increase is 19320 CNY·h-1.Therefore,in this paper,the control strategy with the maximum distillation yield rate of unit energy consumption as the optimal target can improve the energy utilization efficiency and bring greater economic benefit.

Table 9 Results of optimal operating parameters
The average time of optimizing the control parameters by IPSO is about 20s, and the enterprise equipment collects data every hour. In order to avoid frequent adjustments to the preset temperature values, it is recommended to optimize the temperature control parameters every two hours to provide sufficient time for the plant operator to operate,so the control strategy is feasible in practical engineering.
5.Conclusions
Accurate prediction model of energy efficiency indicator and implementation of optimal control strategies are of great significance to conserve energy,reduce emissions and improve economic benefits.A new energy efficiency index-the distillation yield rate of unit energy consumption is proposed in this paper,which is as optimization target to improve energy efficiency in refining process.The typical working conditions of the oil refining process classified on the basis of production data by the fuzzy c-means algorithm(FCM).The prediction models of the new indicator are established by IPSO-LSSVM algorithm based on each working conditions and the online real-time optimization of refining process is realized with the IPSO algorithm to optimize outlet temperature and tower top temperature.Through simulation and analysis,energy efficiency prediction and online real-time optimization respect to operation classification can monitor the energy efficiency level of enterprises more accurately,improve the operation of existing refining oil processes,find the optimal process conditions,increase the energy efficiency of enterprises and bring more economic benefits.Future work will research coordinated optimal control strategy which combines maximization of economic efficiency with maximization of energy efficiency to bring economic growth,and focus on the study of temperature control systems.
 Chinese Journal of Chemical Engineering2019年5期
- Chinese Journal of Chemical Engineering的其它文章
- Assessment of the TFM in predicting the onset of turbulent fluidization☆
- CFD study on double-to single-loop flow pattern transition and its influence on macro mixing efficiency in fully baffled tank stirred by a Rushton turbine☆
- Simulation of drop breakage in liquid-liquid system by coupling of CFD and PBM:Comparison of breakage kernels and effects of agitator configurations☆
- Heat transfer characteristics of molten plastics in a vertical falling film reactor☆
- Stabilizing silica nanoparticles in high saline water by using polyvinylpyrrolidone for reduction of asphaltene precipitation damage under dynamic condition
- Numerical simulation and experimental study on dissolving characteristics of layered salt rocks