
Effect of ethylene vinyl acetate content on the performance of VMD using HDPE co-blending membrane☆
2019-08-07 07:53NaTangXinxinHuaZhaoLiLeiZhangJiatingWangJunXiangPenggaoChengXuekuiWang
Na Tang,Xinxin Hua,Zhao Li,Lei Zhang,*,Jiating Wang,Jun Xiang,Penggao Cheng,Xuekui Wang
1 College of Chemical Engineering and Materials Science,Tianjin University of Science&Technology,Tianjin 300457,China
2 Tianjin Key Laboratory of Marine Resources and Chemistry,Tianjin University of Science&Technology,Tianjin 300457,China
Keywords:Thermally induced phase separation High-density polyethylene Ethylene vinyl acetate Membrane Separation Microstructure
ABSTRACT Membranes were fabricated with high-density polyethylene(HDPE)and ethylene vinyl acetate(EVA)blend through thermally induced phase separation and were then used for vacuum membrane distillation(VMD).The membranes were supported by nonwoven polyester fabric with a special cellular structure.Different membrane samples were obtained by adjusting the polymer concentration,HDPE/EVA weight ratio,and coagulation bath temperature.The membranes were characterized by scanning electron microscopy(SEM)analysis,contact angle test,and evaluation of porosity and pore size distribution.A series of VMD tests were conducted using aqueous NaCl solution(0.5 mol·L-1)at a feed temperature of 65°C and permeate side absolute pressure of 3 kPa.The membranes showed excellent performance in water permeation flux,salt rejection,and long-term stability.The HDPE/EVA co-blending membranes exhibited the largest permeation flux of 23.87 kg·m-2·h-1 and benign salt rejection of ≥99.9%.
1.Introduction
High-density polyethylene(HDPE)is a thermoplastic polymer that is widely used in industrial production because of its outstanding properties,such as nontoxicity,chemical stability,excellent plasticity,electrical insulation,and low cost[1].HDPE membranes exhibit potential for a wide range of applications,including battery separator[2,3],seawater desalination[4],drug extraction,and other separation processes[5].PE microporous membranes are generally prepared through two methods: thermally induced phase separation (TIPS) and meltspinning and cold-stretching (MSCS) [4,6,7]. It is difficult to control the membrane structure and obtain perfect pore size by melt-spinning and cold-stretching(MSCS),and the prepared membranes show low porosity,which would affect the permeation property[8,9].Compared to those formed by the MSCS method, polyethylene membrane prepared by TIPS shows higher porosity,diverse pore structure,and excellent mechanical property[10-12].
Many studies have focused on preparing HDPE hydrophilic microporous membranes,in particular,hydrophilic modification of HDPE has been a research hotspot to enhance pure water permeation flux and protein solution permeability[13-15].However,there are limited literatures studying the hydrophobic polyethylene membrane to apply in membrane distillation.
Membrane distillation(MD),a non-isothermal separation process,is used to transport vapor molecules through porous and hydrophobic membranes[16-20].HDPE,which exhibits natural hydrophobicity,is used in MD to prevent membrane wetting,improve the working life of membranes,and increase the rejection rate[21,22].Scholars have investigated membrane fouling and wetting[23,24]to promote the industrial application of MD.However,neat PE membranes cannot keep longterm stability because of its weak durability and neat PE membranes exhibit cracking and then leakage when applied in VMD.
Shokri et al.[25]investigated the effect of a compatibilizer on HDPE/EVA hydrophilic membranes by using mineral oil as diluent.Chen et al.[26]performed a thermodynamic study and reported the favorable compatibility of the HDPE/EVA system.Tang et al.[27]prepared PP/EVA coblending membranes for vacuum membrane distillation and showed excellent separation effect.Dong et al.[28]prepared a superhydrophobic PVDF-PTFE nanofibrous membrane and tested its desalination for 15 h by VMD,yielding a stable flux of 18.5 kg·(m2·h)-1and salt rejection that exceeds 99.9%.So blend modification is a highly effectively way toimprove the properties of membrane,especially in hydrophobicity,tenacity and membrane structure.

Table 1 The physical properties of HDPE and EVA
In this work,HDPE/EVA-diphenyl ether flat sheet membranes were prepared through thermally induced phase separation (TIPS). The membranes were then supported by nonwoven fabrics.A series of vacuum membrane distillation(VMD)tests indicated that adding EVA improved the structure and durability of membrane and enhanced water permeation flux.
2.Experimental
2.1.Materials
Commercial high density polyethylene (HDPE) was provided by Panjin chemical Liability Co.Ltd.,China.EVA grade Elvax®3120 with vinyl acetate (VA) contents of 8 wt% was purchased from DuPont China Group Co.Ltd.The physical properties of HDPE and EVA are listed in Table 1.Diphenyl ether as diluent was purchased from Tianjin Development Zone Le Tai Chemical Co.Ltd.Dibenzylidene sorbitol was used as nucleating agent supplied by Shanghai Hanhong Chemical Technology Co. Ltd.Absolute ethanol and NaCl were purchased from Tianjin North Link Fine Chemicals Development Co. Ltd. All chemicals were used without further purification.
2.2.Preparation of HDPE/EVA blend samples
HDPE/EVA blends of known concentration were prepared in a 50 ml glass flask.The mixing condition is as follows:melting temperature is 180 °C, stirring speed is 200 r·min-1, and heating time is 2 h. Then the sample of casting solution was poured out on a steel plate and collected after cooling.The samples were saved in the seal sample bags to use for thermodynamic test.
2.3.Thermodynamic phase diagram
A phase diagram is a valuable tool used to determine the effect of solution polymer concentration and quench temperature on membrane morphology[29].Cloud point(Tcloud)and crystallization temperature(Tc)were measured according to the method reported by Matsuyama et al.[11].Briefly,10 mg of the sample was placed between a pair of microscope cover slips, heated in a hot stage(KER 3100-08S,Shanghai Guangmi Instrument Co.,Ltd.,China)at 180°C,and cooled to 20°C at 10°C·min-1.Cloud points were visually determined by observing turbidity under an optical microscope(GMP 213P,Shanghai Guangmi Instrument Co.,Ltd.,China).
The crystallization temperature of HDPE/EVA was determined by differential scanning calorimetry(DSC 200F3,Netzsch Thermal Analysis,Germany)under N2protection.Briefly,5 mg of the solid polymer/diluent sample was sealed in an aluminum DSC pan,melted to 180°C at 10°C·min-1,and cooled to 25°C at 10°C·min-1.
2.4.Preparation of HDPE/EVA-blend membranes
HDPE/EVA co-blended flat sheet hydrophobic microporous membranes were prepared through TIPS.The HDPE/EVA blends with certain polymer concentrations (20 wt%-30 wt%) were mixed with diphenyl ether(diluent)and dibenzylidene sorbitol(DBS,nucleating agent) in a 1000 ml glass flask and stirred at 180 °C. Nitrogen was guided into the flask to build an oxygen-free environment for preparing casting solution. A homogeneous HDPE/EVA-diphenyl ether blend solution was formed after 4 h of stirring and another 4 h of vacuum deformation.
The homogeneous blend solution was covered on a nonwoven fabric membrane supporting layer through a preheated steel plate.The membrane was immersed into a water coagulation bath(25°C)for 10 min.Absolute ethanol was used to extract diphenyl ether for 24 h.The membranes were dried naturally at room temperature prior to testing.
2.5.Membrane characterization
2.5.1.Scanning electron microscopy
All the micrographs of the top surface and cross-section of the prepared flat membranes were acquired using a scanning electron microscope(Hitachi SU1510,Japan)with an accelerating voltage of 40 kV.The membrane samples were fractured in liquid nitrogen to obtain the cross-section.All samples were coated with platinum by using a sputter coater(Hitachi E1020,Japan).
2.5.2.Porosity,pore size distribution and LEPw
Membrane porosity was estimated gravimetrically[30].Oven-dried membrane sample was weighed and submerged in a 50 ml container contained 2-propanol.The membrane was stored for more than 24 h to ensure that the membrane pores were filled with 2-propanol.Filter paper was used to remove excess 2-propanol from the membrane surface,and the wet sample was weighed.Membrane porosity was calculated using Eq.(1)[31-34]:

where P is the porosity of the membrane,Wwis the wet sample mass(g), Wdis the dry sample mass (g), ρ0is the density of 2-propanol,and ρpis the density of polymer.Each membrane was measured for a minimum of five times,and the average was obtained.
Pore size distribution was determined using a pore-size analyzer(Porometer 3G,Quantachrome Ltd.,USA).The membranes were cut to pieces with 25 mm diameter and thoroughly wetted with a wetting liquid(Porefil,Surface tension=16 dyn·cm-2)to fill the pores prior to analysis.Control software(Porometer 3G win V2)was used to calculate the pore size of the samples.
LEPwis a critical hydrophobic membrane characteristic of wetting resistance.It was measured by the same equipment using water rather than Porefil filled in the lumen side of membranes and all LEPwpoints were reported for the average value in three times.
2.5.3.Contact angle measurement
The water-contact angles for the top side of the membranes were measured using an optical contact angle measuring instrument(KRUSS DSA100,Kruss New Materials Co.,Ltd.,Germany)at room temperature.The sample was fixed in a glass slide,added with 3 μl of ultrapure water droplet,and recorded using a digital camera.The contact angles were determined from digital images with specific software.Each data point was measured at five different locations,and the results were averaged to reduce deviations.
2.5.4.Mechanical analysis
The tensile strength and elongation of the membranes were measured according to the Chinese national standard(GB/T1040.3-2006)by using a tensile testing instrument(CMT-4503,Shenzhen Sansy Co.,Ltd.,China).The membranes were cut into dumbbell-like standard samples(Fig.A1).The thicknesses of the membrane samples were measured by a thickness gauge(TT130,Beijing Times Co.,Ltd.,China).The sample was extended at a constant elongation rate of 50 mm·min-1until it was broken.
Tensile strength was calculated according to Eq.(2):

where σ is the tensile strength(MPa),F is the stress(N),and A is the cross-sectional area of the membrane sample(m2).
Elongation was calculated using Eq.(3):

where ε is the elongation(%),Lendis the distance of the gauge length after stretching(mm),and L0is the initial gauge length(mm).
The average of the measurement results of five membrane samples was obtained as the mean tensile strength and elongation.
2.6.VMD performance tests
The schematic diagram of VMD set-up is shown in Fig.1.Testing was performed using 0.5 mol·L-1aqueous NaCl solution as feed at 65°C and a flow rate of 30 L·h-1.A waterpower vacuum pump with 3 kPa pressure was used on the permeate side to transfer vapor through the membrane pores to the side. Vapor was condensed and collected by a distillate collector.
The experimental facility and schematic of VMD were introduced in detail in previous research[27].Permeation flux and rejection coefficient are two key indicators used to evaluate the VMD performance of membranes[35].
Permeation flux was calculated using Eq.(4):

where J is the permeation flux(kg·m-2·h-1),M is the mass of the permeate(kg),A is the effective surface area of membranes(0.0028 m2),and Δt is the time interval(h).
The rejection coefficient(R)of the flat sheet membranes was calculated using Eq.(5):

where σfis the electrical conductivity of the feed,and σpis the electrical conductivity of the permeate water.Electrical conductivity was determined using a conductivity meter(SevenCompact S200,Mettler Toledo International Inc.,USA).
3.Results and Discussion
3.1.Phase diagram
Fig.2 shows the phase diagram of the HDPE/EVA-diphenyl ether system at a cooling rate of 10°C·min-1.The co-blending system possesses liquid-liquid(L-L)and solid-liquid(S-L)regions for phase separation.Monotectic points were estimated using 40 wt%polymer and are defined as the cross point of the cloud point curve and the dynamic crystallization curve.
The crystallization temperature of the polymer blend decreased with increasing EVA content.In general,the higher degree of crystallinity has higher melting point for same materials,which could be explained by the fact that the molecular chains arranged more regular need higher temperature to break and melt.So addition of EVA with low degree of crystallinity broke the regular arrangement of HDPE molecular chains and reduced the crystallinity of the co-blending system.Based on the phase diagram,HDPE/EVA-diphenyl ether solutions are homogenous when the temperature is higher than the cloud point temperature.When the polymer concentration is lower than the monotectic point and within a certain range,the system underwent L-L phase separation to reduce the two liquid phases.Subsequently,the S-L phase separation occurred,and the membrane pore morphology was eventually formed.In addition,the L-L phase separation region grew larger with the increase of EVA concentration from 7:1 to 1:1 of HDPE/EVA weight ratio.According to previous experiments, it was hard to form an effective separation layer while the polymer concentration was under 20 wt%,because the viscosity of casting solution was so low that the nonwoven fabrics were permeated in the beginning. Otherwise, higher polymer concentration would result in smaller pore size and dead hole formed due to limited area of L-L phase separation.Hence,the polymer concentrations of 20 wt%, 23 wt%,25 wt%, 27 wt%, and 30 wt% were determined to ensure that the general regulation of experiment could be investigated.

Fig.1.Schematic diagram of VMD.(1.Temperature controller,2.feed tank,3.pump,4.rotameter,5.valve,6.P-28 flat sheet membrane module,7.pressure gauge,8.chiller,9.condenser,10.distillate collector,11.electronic balance,12.buffer bottle,13.vacuum pump.)

Fig.2.Thermodynamic non-equilibrium phase diagram of HDPE/EVA-phenyl ether coblending system (HDPE/EVA mass ratios of a, b, c and d are 7:1, 5:1, 3:1 and 1:1,respectively).
3.2.Membrane structure
3.2.1. Effect of polymer concentration on membrane microporous morphology
As shown in Fig. 3, the membrane morphology shows a highly dense spherulitic structure,indicating that phase inversion primarily occurred through L-L phase separation, as predicted. On the one hand, the S-L phase separation region widened with increasing polymer concentration (<40 wt%, Fig. 2). For instance, the coating of the homogenous HDPE/EVA-diphenyl ether casting solution with 30 wt%polymer on the surface of non-woven fabrics underwent narrow L-L phase separation and rapidly entered into the S-L phase separation region as the temperature changed from the experimental temperature(180°C)to the water bath temperature(25°C).On the other hand, higher polymer concentration increased the viscosity of the casting solution. And then,the droplets underwent slow growth rate during crystallization until the formation of a small and dense microporous structure.
3.2.2. Effect of HDPE/EVA mass ratio on membrane microporous morphology
Polymer concentration of 30 wt% was used to prepare the coblended membranes. The cross-sectional SEM images of the membranes with different HDPE/EVA mass ratios are shown in Fig. 4.With increasing EVA content in the co-blending system,the microporous structure of the membrane became looser and the pore size increased. Moreover, the microporous morphology of the membrane changed from a dendritic structure to a cellular structure.The addition of EVA promoted the formation of crystal nuclei and crystallization.EVA, which possesses a low-heat conductivity coefficient during cooling,induced the system to undergo a wide L-L phase separation region and form a larger pore size.This finding is consistent with the results of the phase diagram(Fig.4).
3.3.Membrane properties
3.3.1.Membrane contact angles
Hydrophobicity is an important feature considered for VMD applications.In general,contact angles exceeding 90°can be called a hydrophobic membrane.Membranes with 20 wt%,23 wt%,25 wt%,27 wt%,and 30 wt%polymers were tested for contact angle experiments.The results are shown in Table 2.
Table 2 shows that the prepared membranes with different HDPE/EVA co-blending ratios exhibited favorable surface hydrophobic properties as the contact angle reached 110°-130°.When the polymer concentration increased and the HDPE/EVA ratio changed,no obvious trend was deduced from the results.In addition,the polymer concentration and co-blending ratio did not significantly influence the hydrophobic property of the membranes possibly because of the natural hydrophobicity of HDPE and EVA.
3.3.2.Mechanical properties
The mechanical properties of a membrane are an important consideration in VMD.Tensile stress and elongation at break of the blended membranes prepared with different HDPE/EVA mass ratios were measured to investigate the mechanical properties of the HDPE/EVA-blend flat-sheet membranes(Fig.5).With increasing EVA content,the tensile strength of the HDPE/EVA co-blending membranes decreased from 30 MPa to 18 MPa and the elongation at break slightly increased from 44%to 54%for a polymer concentration of 20 wt%.And the same variation trend of other polymer concentrations(25 wt%and 30 wt%)was observed in Fig.5.
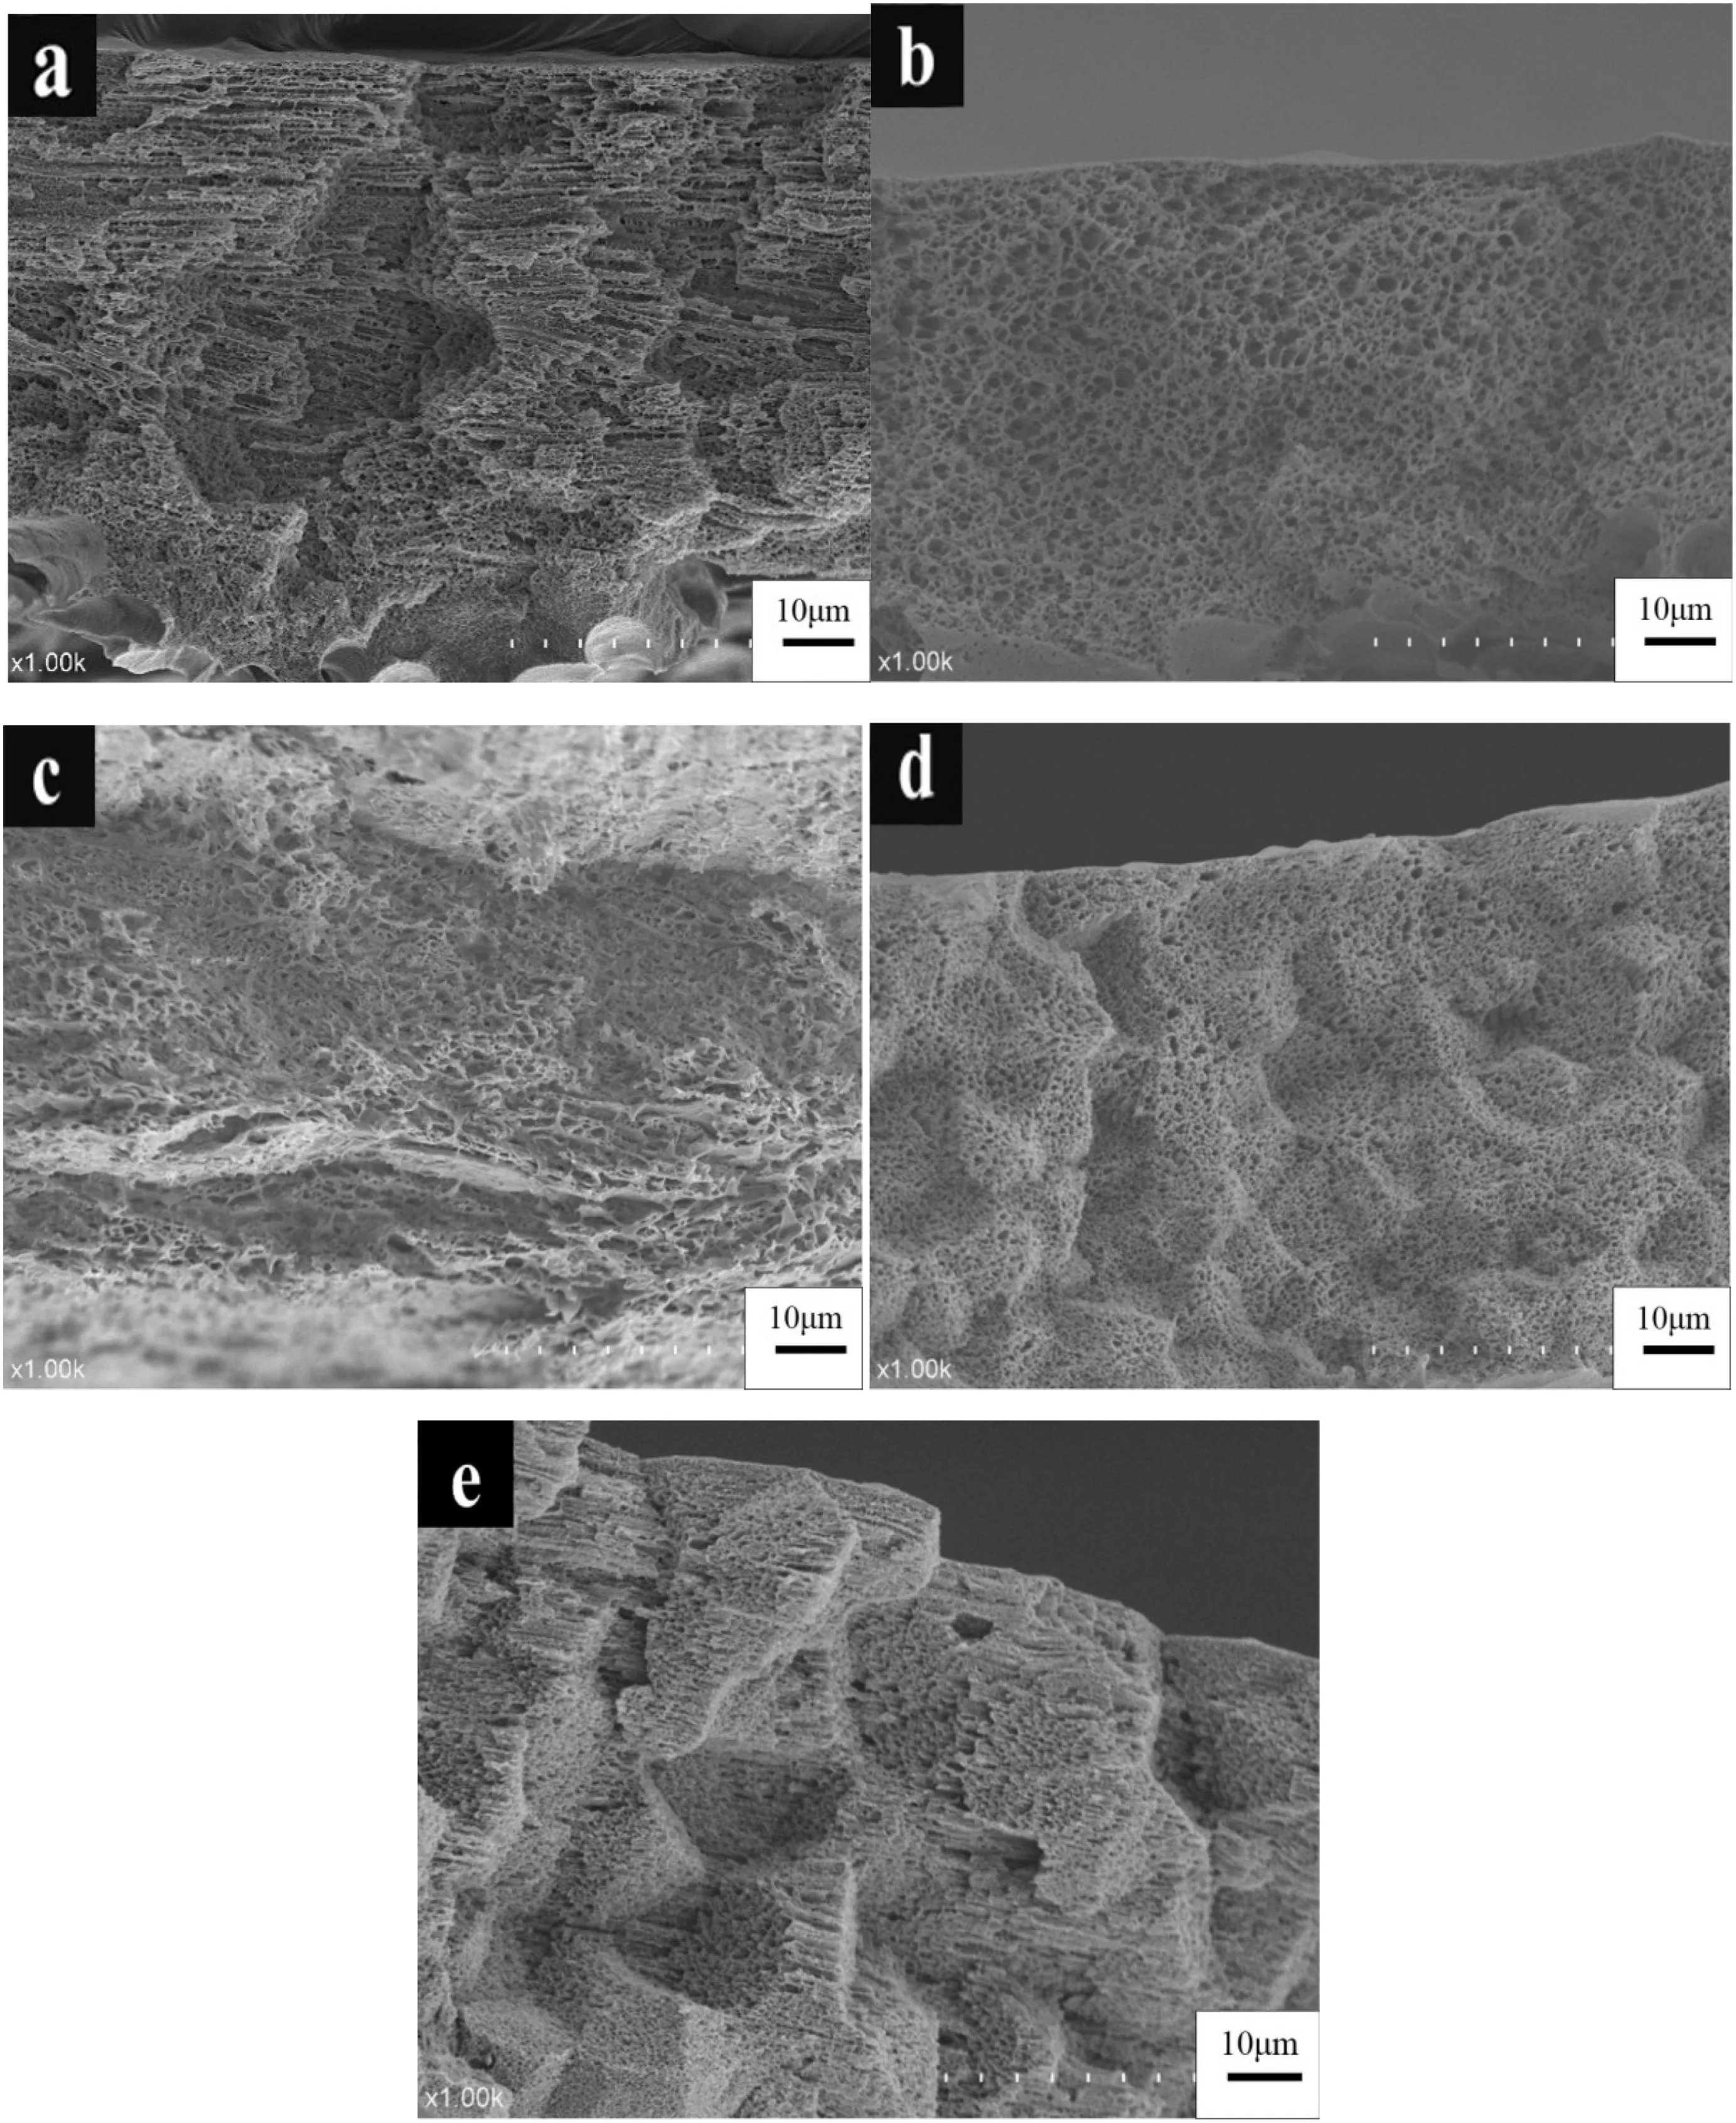
Fig.3.Effect of polymer concentration on the morphological structure of HDPE/EVA co-blending hydrophobic-microporous membranes(cross-section).(Polymer concentrations of a,b,c,d,and e are 20 wt%,23 wt%,25 wt%,27 wt%,and 30 wt%,respectively.)
In this research,all of the prepared membranes were reinforced with nonwoven fabrics to obtain good tensile strength. Excellent mechanical properties combined with hydrophobicity render the HDPE/EVA co-blending membranes as a good candidate for VMD.
3.3.3.Porosity,pore size distribution and LEPw
The porosity and membrane thickness of HDPE/EVA co-blending membranes are presented in Fig.6.With increasing polymer concentration from 20 wt% to 30 wt%, the HDPE/EVA co-blending membrane porosity decreased from 70.68% to 64.55% and membrane thickness increased from 167.43 μm to 190.82 μm. The variation tendency of porosity is obviously observed from Fig. 3 that membrane of high polymer concentration has a dense pore structure.But polymer concentration makes a small contribution to improving toughness compared to addition of EVA(Fig.5(b)).High porosity is favorable for membrane separation.And the porosity of membrane depended on polymer concentration in a physical mixture,so there was little impact on the porosity of membrane with the change of the EVA content. Moreover, excessive concentration of polymer does not promote to the formation of micropores in phase separation process,high polymer concentration would shorten the distance of L-L phase separation which resulted in more pores with small pore diameter formed eventually in Fig. 2. The result that thickness of membranes increased with increasing polymer concentration can be attributed to the sharp increase enhancement in casting solution viscosity.The effect of membrane thickness on VMD desalination is resistance to the transport and heat losses by conduction [36].
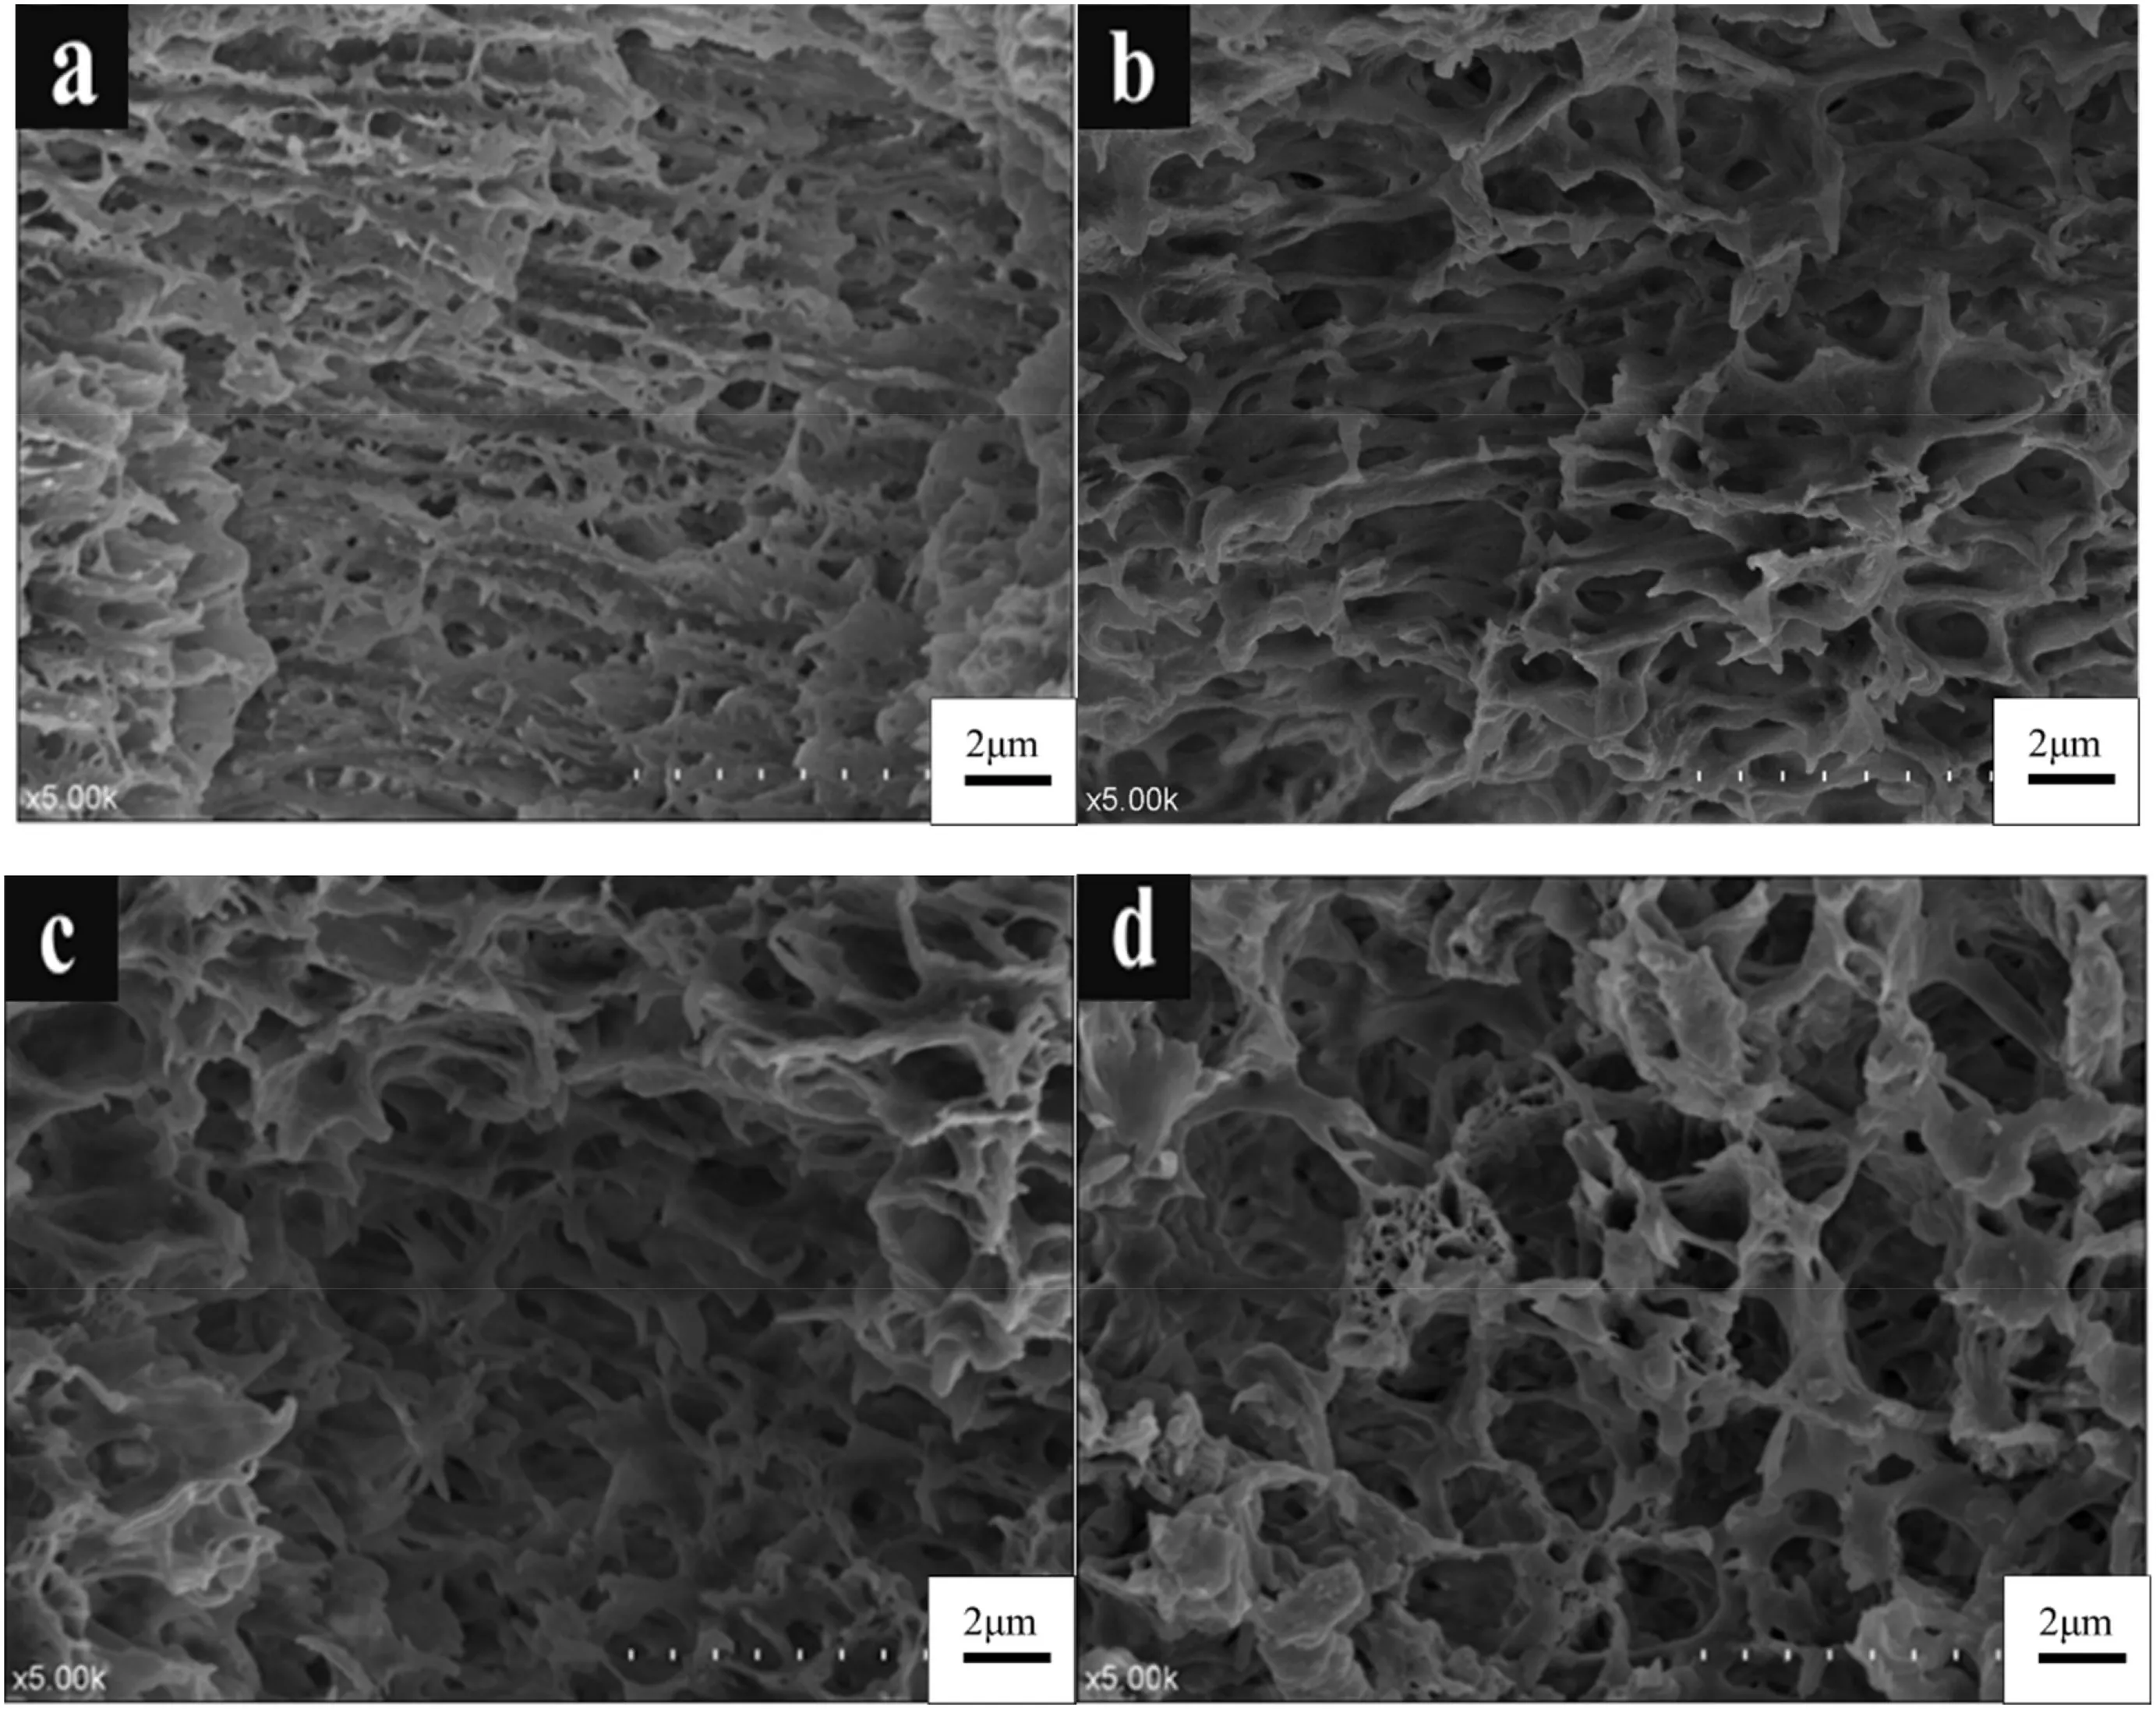
Fig.4.Effect of HDPE/EVA mass ratio on the morphological structure of HDPE/EVA co-blending hydrophobic microporous membranes(cross-section).(HDPE/EVA weight ratios of a,b,c,and d are 5:1,4:1,3:1,and 2:1,respectively.)
Thinner membranes ensure high flux.The thickness of co-blending membranes was also supported by polyester nonwoven, whose thickness is 120 μm. So, the actual thickness of blend membrane ranged from 40 μm to 70 μm.
The pore size distributions in the HDPE/EVA co-blending membranes are shown in Fig.7.The mean pore size increased with increasing EVA content.In general,a pore size of 0.1-0.8 μm is suitable for VMD.At a HDPE/EVA mass ratio of 5:1,the mean pore size was found to be 0.18 μm.The mean pore size reached 0.6 μm at a HDPE/EVA mass ratio of 2:1. Fig. 7 also demonstrates that the membrane of a HDPE/EVA mass ratio of 2:1 has a larger pore diameter than other membrane samples,this can be observed in Fig.4(b).And increase of EVA content enlarges the region of L-L phase separation in thermodynamic diagram(Fig.2),which helps the membrane pores to grow larger.These results verify that higher EVA content contributed to the development of pore size on the side. Table 3 showed the average pore size of different membrane samples. The average pore size of membrane had slightly decreased with increased polymer concentration. This could be explained by the finding that the casting solutions with high polymer concentration have a higher viscosity preventing rapid phase separation.However,addition of EVA could improve theaverage pore size; this was due to the physical property of EVA and interaction of polymers.
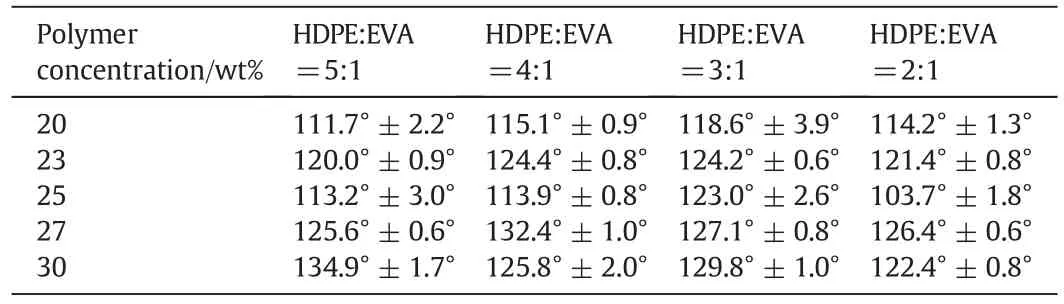
Table 2 Contact angles of HDPE/EVA co-blending membranes of different ratios

Fig.5.Strength tensile and elongation of membranes at different HDPE/EVA mass ratios.(a.Strength tensile and b.elongation.)

Fig.6.Effect of HDPE/EVA co-blending hydrophobic microporous membranes on porosity and thickness with different polymer concentration systems.

Fig.7. Pore size distribution in microporous membranes of different HDPE/EVA mass ratios.
LEPwrepresents the pressure at which liquid water will penetrate into the pores of the hydrophobic membranes.Membranes prepared at a high polymer concentration had smaller pore size leading to higher LEPw(Fig.8),which may be due to the fact that dense cellular layer had higher wetting resistance of water rather than the loose cellular layer.All values of LEPware higher than the operation pressure(0.1 MPa)during VMD experiments.Compared to other membranes,the HDPE/EVA membrane with 3:1 mass ratio showed higher LEPw, which is critical for getting a high rejection and long-term operation in experiments.
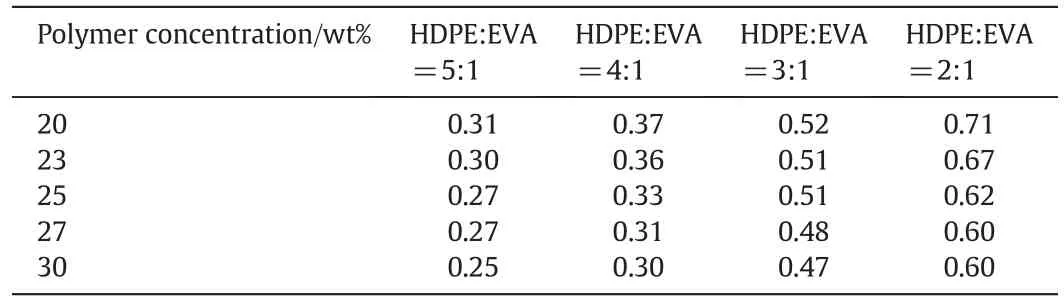
Table 3 Average pore size(μm)of different membrane samples
Fig.8.LEPw of membranes prepared with different polymer concentrations.
3.4.VMD performance

Fig. 9. VMD performance of different membrane samples. (a. Effect of polymer concentration on water permeation flux with HDPE/EVA mass ratio of 3:1, b.effect of various HDPE/EVA mass ratio on water permeation flux with polymer concentration of 23 wt%.)

Fig.10.Effect of HDPE/EVA mass ratio on continuous VMD tests at polymer concentration of 23 wt%.(a.Permeation flux,b.electric conductivity,and 1,2,3,4,are the HDPE/EVA mass ratios of 2:1,3:1,4:1,5:1 respectively.)
Fig.9(a)shows the VMD performance of hydrophobic microporous membranes of different polymer concentration blends with a HDPE/EVA mass ratio of 3:1.Aqueous NaCl solution(65°C,0.5 mol·L-1)was used as feed.At the polymer concentration of 20 wt%,the HDPE/EVA co-blending hydrophobic microporous membrane exhibited the largest VMD permeation flux of 23.87 kg·m-2·h-1.Increasing the polymer concentration decreased the VMD permeation flux.Permeation conductivity remained constant at approximately 9.95-11.10 μS·cm-1,and salt rejection exceeded 99.9%.These results can be attributed to the membrane pore structure,including pore size distribution and porosity.
The effects of the mass ratio of different HDPE/EVA co-blending membranes on VMD performance were evaluated. Fig. 9(b) shows that at a polymer concentration of 23 wt%,increasing the EVA content enhanced the water permeation flux.The HDPE/EVA membrane with 3:1 mass ratio produced a high water permeation flux of 20.49 kg·m-2·h-1.
3.5.Long-term stability of HDPE/EVA membranes
Membranes of two different HDPE/EVA weight ratios were tested in VMD equipment respectively.The stability of the VMD membrane was determined during the long-term operation. The conditions of the experiment are consistent with those previously discussed in Section 3.4. The experimental results are shown in Fig. 10(a)and(b).
The water permeation flux continuously decreased after 10 h of stable operation,the value of electric conductivity was below 30 μs·cm-1,and salt rejection exceeded 99.9%.After operating for a long time,the concentration polarization occurred on the membrane surface in a circulatory NaCl aqueous solution system,which resulted in the continuous decline of permeation flux.Furthermore,Fig.10(a)and(b)demonstrates the permeation flux and electric conductivity increased rapidly after running for some time.This phenomenon could be explained by membrane wetting that membranes were permeated with NaCl aqueous solution after being strongly affected by LEPw,the average LEPwvalues of HDPE/EVA mass ratio of 2:1, 3:1, 4:1, and 5:1 are 0.196, 0.225, 0.183 and 0.168 MPa at a polymer concentration of 23 wt%(Fig.8).Comparison of different HDPE/EVA mass ratios showed that membrane with 3:1 ratio exhibited enhanced stability,this benefited from addition of appropriate EVA content.
4.Conclusions
HDPE/EVA hydrophobic microporous membranes were prepared with diphenyl ether used as diluent through TIPS.Adding EVA led to favorable mechanical properties and improved the membrane pore structure. The fabricated HDPE/EVA co-blending membranes showed favorable hydrophobicity based on the VMD performance test and water contact angle measurement at approximately 120°.The morphology of the blend membranes was characterized by a thin dense cellular surface layer,which mainly comprised 0.4 to 0.6 μm pores.The HDPE/EVA membrane with 3:1 mass ratio and 20 wt%polymer concentration exhibited the largest permeation flux (23.87 kg·m-2·h-1) and salt rejection(≥99.9%).
Appendix A

Fig.A1.Standard sample for testing the mechanical properties of the membranes.b1,width of the narrow parallel parts:6 mm±0.4 mm;b2,width of the ends:25 mm±1 mm;h,thickness:≤1 mm;L0,gauge length:25 mm±0.25 mm;L1,length of the narrow parallel parts:33 mm±2 mm;L,the initial distance between the clamp:80 mm±5 mm;L2,overall length:≥115 mm;r1,minor radius:14 mm±1 mm;r2,smooth radius:25 mm±2 mm. A pair of fixtures was placed at line “m” and “n” to ensure that the long axis of the sample formed a straight line with the axis of the tensile testing instrument. A pair of calibrated distance sensors was placed at line “x” and “y”.
 Chinese Journal of Chemical Engineering2019年5期
- Chinese Journal of Chemical Engineering的其它文章
- Assessment of the TFM in predicting the onset of turbulent fluidization☆
- CFD study on double-to single-loop flow pattern transition and its influence on macro mixing efficiency in fully baffled tank stirred by a Rushton turbine☆
- Simulation of drop breakage in liquid-liquid system by coupling of CFD and PBM:Comparison of breakage kernels and effects of agitator configurations☆
- Heat transfer characteristics of molten plastics in a vertical falling film reactor☆
- Stabilizing silica nanoparticles in high saline water by using polyvinylpyrrolidone for reduction of asphaltene precipitation damage under dynamic condition
- Numerical simulation and experimental study on dissolving characteristics of layered salt rocks