
Emergency department patient experience: Same location, same provider, different scores by different survey methods
2019-06-17 12:33:30WirachinHoonpongsimanontPreetKaurSahotaYanjunChenMariaNguyenChristineLouisJonathanPenaAndrewWongMaxwellJen
Wirachin Hoonpongsimanont, Preet Kaur Sahota, Yanjun Chen, Maria Nguyen, Christine Louis, Jonathan Pena, Andrew Wong, Maxwell Jen
1 Department of Emergency Medicine, University of California, Orange, CA, USA
2 Institute for Clinical and Translational Sciences, University of California, Irvine, CA, USA
KEY WORDS: Patient experience; Emergency department; Patient satisfaction; Press Ganey;Survey methodology
INTRODUCTION
The Centers for Medicare and Medicaid Services(CMS) developed the Hospital Consumer Assessment of Healthcare Providers and Systems (HCAHPS) survey to quantify patients’ experiences, with an ultimate goal of improving the patient-physician relationship and overall healthcare delivery.[1]Many process improvements in the ED, including the Rapid Assessment and Fast Track,have developed from the survey results to improve ED patient experiences. Studies show that process improvement positively impacts patient satisfaction scores and ED performance in the CMS benchmarks.[2,3]
While we observe many benefits, we also witness the negative impacts on physicians’ work ethic and team morale as a result of the HCAHPS reports. ED physicians reported that survey results moderately or severely affected job satisfaction to where some considered leaving the medical field.[4]Because HCAHPS scores can influence physician income in some institutions,physicians might change their practice to avoid negative scores, but not in the best interests of patients.[5,6]Because the implications of patient satisfaction reports are significant to the healthcare system, accurate, wellrepresented and reproducible survey results are essential.
Press Ganey Associates, Incorporated (PGA) is a major vendor in HCAHPS survey distribution. However, prior research has shown little evidence on how accurate the PGA survey results are in representing the opinions of the ED patient population. Despite the lack of statistical calculations and response rates of survey data, PGA asserts that their data is relevant, though may not be statistically significant, and primarily for the survey participants and patients’ usage.[7]PGA states that about 30-50 survey responses per physician can provide appropriate data for comparisons.[7]This number may vary depending on the size of the ED. A study in the orthopedic clinic setting reported a response rate of 16.5% for PGA surveys. Moreover, the study found that age, gender and insurance type do impact the response rate.[8]
Our primary aim was to assess the consistency of the ED patient experience survey report distributed by PGA, compared to a shortened-version, institutional survey. The secondary aim was to identify the inf luence of patient demographic factors on patient experiences.
METHODS
Study design and setting
We conducted a prospective, cross-sectional, survey study at an urban, tertiary care, university-based ED. We collected survey responses, using our institutional survey(IS) from a convenience sample, and obtained the PGA report from July to December 2017. We obtained both reports from a sample of the same ED patient population.The Institutional Review Board (IRB) reviewed and approved this study.
Study protocol Institutional survey report
We developed a shortened, institutional version(IS) of the Emergency Department Patient Experience of Care (EDPEC) survey, which contained only 22 questions, with the intent of increasing the response rate.[9]We included only four questions on doctorspecific categories from EDPEC to ensure that the responses were not inf luenced by other factors i.e. nurse performance or the ED environment. The patients were asked to rate their ED experience using a scale of 1-5(1 - worst possible; 5 - best possible) on the following doctor-specif ic patient satisfaction categories: “Courtesy of the doctor”; “Degree to which the doctor took the time to listen to you”; “Doctor's concern to keep you informed about your treatment”; and “Doctor's concern for your comfort while treating you”. The IS also asked patients if they would recommend this ED to others, their overall satisfaction with the care they received in the ED and how well their pain was controlled during their ED visit.
Research associates (RAs) approached all adult(18 years and older), English-speaking ED patients for participation in this study. We excluded incarcerated patients and patients who were on psychiatric hold or unable to provide consent. RAs screened the ED patients every day from 8 a.m. to midnight during the study period.
RAs provided the IS to patients at the time of discharge from the ED. Patients completed the IS electronically on a tablet. If the patient was unable to complete the survey by themselves, the RAs assisted with the survey process.Patients were asked to complete the IS on paper if the online survey link was unavailable on the tablet. Patients took approximately 10 minutes to complete the IS. We only surveyed patients who were discharged from the ED to decrease any recall biases that admitted patients could form by mistaking inpatient care for the care they received from ED providers.
RAs extracted demographic variables including race, gender, insurance status, homelessness status, age,religious preference and employment status from patient medical charts. All responses were recorded and stored in a secure, online database: the Research Electronic Data Capture (REDCap).
Press Ganey Associates report
PGA distributed a 40-question survey to all discharged, adult ED patients who stayed at least one night in the ED. Patients who are under 18, patients who died in the hospital, patients discharged to hospice,patients who received psychiatric or rehabilitative services,prisoners and patients with international addresses were excluded. The vendor distributed the survey by two-wave mail (self-administered), five-attempts via phone call interview or used a combined mail (self-administered)/phone interview method, and only included the surveys that were distributed between 48 hours and 6 weeks postdischarge.
For the IS, we screened and recruited patients who stayed in the ED for less than 24 hours as well as patients who stayed in the ED for over 24 hours. PGA only distributed the survey to patients who stayed at least one night in the ED. We chose to screen and recruit patients with different lengths of stay to obtain a more accurate representation of our ED population in comparison to the PGA results.
Outcomes
The primary outcome was the comparison between the top box (ratings of 4 and 5 on the 1-5 scoring scale)ED patient experience scores from both reports. The secondary outcome was to identify the associations between the scores and patient demographic variables to determine any explanatory factors that may inf luence ED patient experiences in this particular ED population.
Statistical analysis
Limited access to PGA results affected the analysis.Only mean, standard deviation and frequency of top box scores were available from the PGA summaries.Demographic information from PGA was not available for analysis. As a consequence, we examined the difference between IS and PGA scores using mean scores and frequencies of top box scores. Due to the skewness in the satisfactory score distribution, frequency analysis of top box scores was used as the primary inference to compare the two surveys. The chi-square test was used to compare the frequency of top box scores between IS and PGA responses. Additionally, the multivariable logistic regression model was used to assess the associations between IS top box scores and patient demographic variables. All statistical analyses were performed using SAS version 9.4 [SAS Institute Inc 2013. SAS/ACCESS® 9.4 Cary, NC]. P-values of 0.05 or less were considered statistically signif icant.
RESULTS
We obtained 289 responses from the PGA database. According to the American College of Emergency Physicians (ACEP), Press Ganey states that about 30-50 survey responses can provide appropriate data for comparisons per physician and“results are tabulated, returned and compared when greater than 7 surveys are returned.” This number may vary depending on the size of the ED population.Although Press Ganey does not release the statistical calculations and goals of their survey instruments, the organization does assert that the data is relevant, yet may not be statistically significant, and primarily for the survey participants and patients’ usage.[7]For the IS, we approached 384 ED patients, and surveyed a total of 234 ED patients about their ED experiences(response rate of 60.93%), provided by 31 ED physicians. The average age of participants was 46 years and 53% of participants were female. The majority of the participants identified as White and Christian, and 54%of participants were unemployed (Table 1).
Primary outcomes
The IS reported higher mean average scores in all four categories of doctor-specific patient satisfaction behaviors compared to the PGA survey. The average scores in IS surveys were higher than 90 (out of 100),while the average scores in PGA surveys were between 80-90. Patients also reported higher overall ratings for ED care and likelihood of recommending in the IS compared to the PGA survey (Table 2).
When evaluating the top box scores, we found significantly higher top box scores in the IS, in all four doctor-specific categories (P-values < 0.01). The likelihood of recommending top box score remainshigher in the IS compared to the PGA survey results(P-value < 0.01) (Table 3).
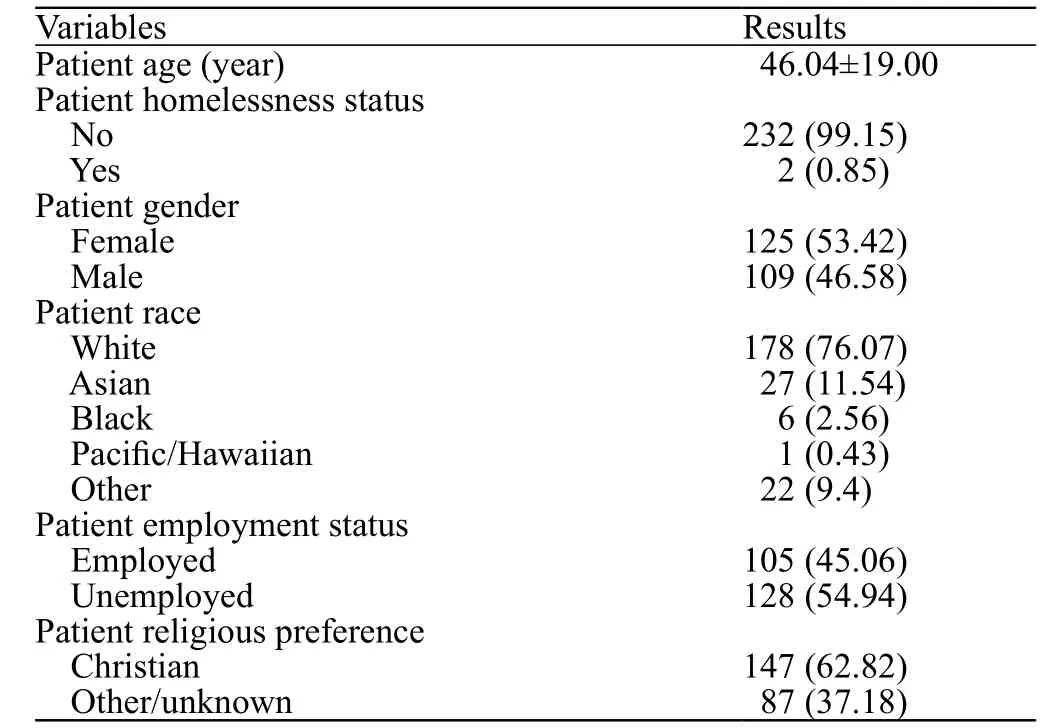
Table 1. Institutional survey-patient demographics, cases (%)
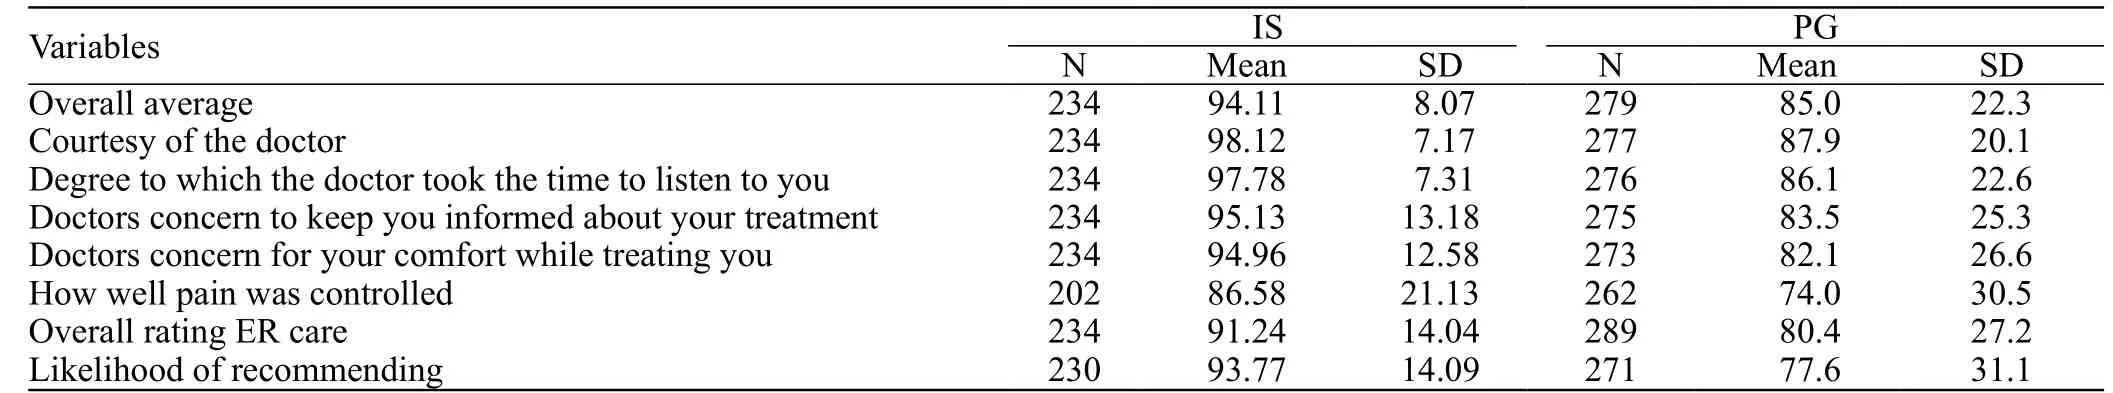
Table 2. Mean average scores for all physicians in each survey [Overall]
Secondary outcomes
We evaluated the associations between the IS top box scores and patient demographic variables. We found that female patients have a three times higher chance, in odds, of reporting top box scores for the “courtesy of the doctor” behavior compared to their male counterparts(OR 3.07, P-value=0.04). Christian patients were likely to report higher top box scores in the overall rating of Emergency Room (ER) care (OR 2.22, P-value=0.01)and in likelihood of recommending this ER (OR 2.57,P-value=0.01) variables. White patients were also more likely to report top box scores in overall rating of ER care, when compared to other races (OR 2.41,P-value=0.01) (Table 4).
DISCUSSION
The implementation of patient experience surveys is a controversial topic in the ED setting. There are numerous aspects of the ED environment that can negatively inf luence patient satisfaction exclusive of thehealthcare delivery itself. A retrospective, cohort study,using the HCAHPS instrument for patient satisfaction measurement, found that increased ED patient crowding was significantly associated with decreased patient satisfaction.[10]Another study reported differences in patient satisfaction scores from three different locations,despite that all locations were staffed by the same physicians.[11]Evidently, patient satisfaction scores are not solely affected by physician performance and behavior.
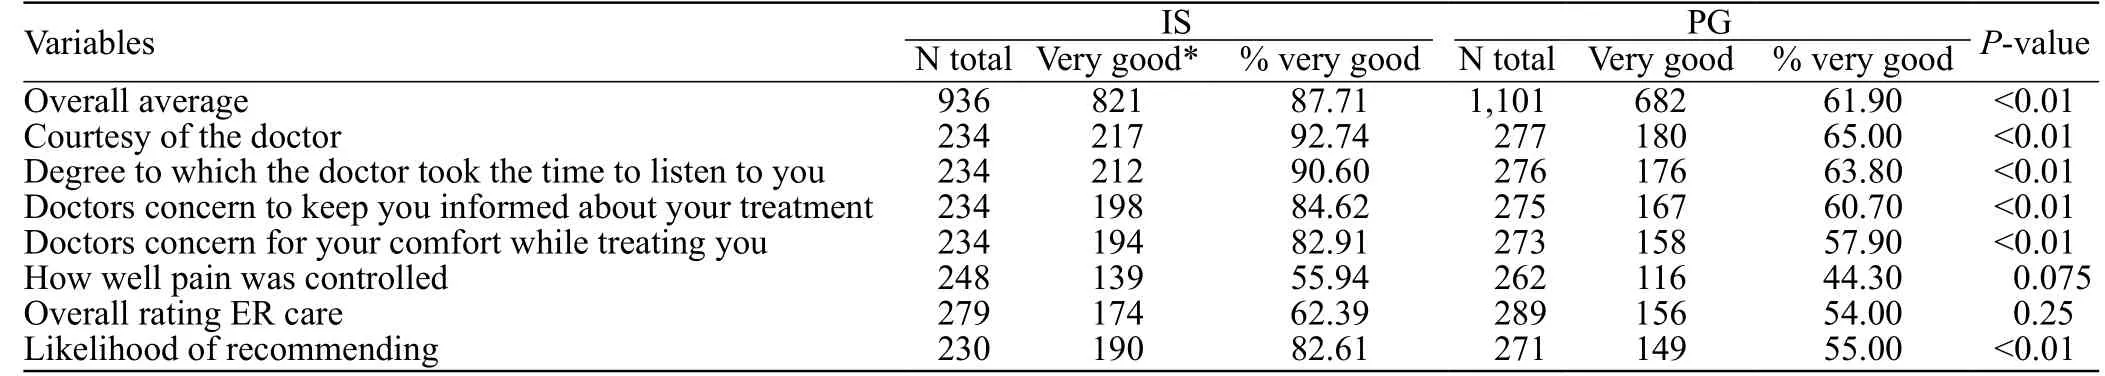
Table 3. Frequency analysis of top box scores for all physicians [Overall]
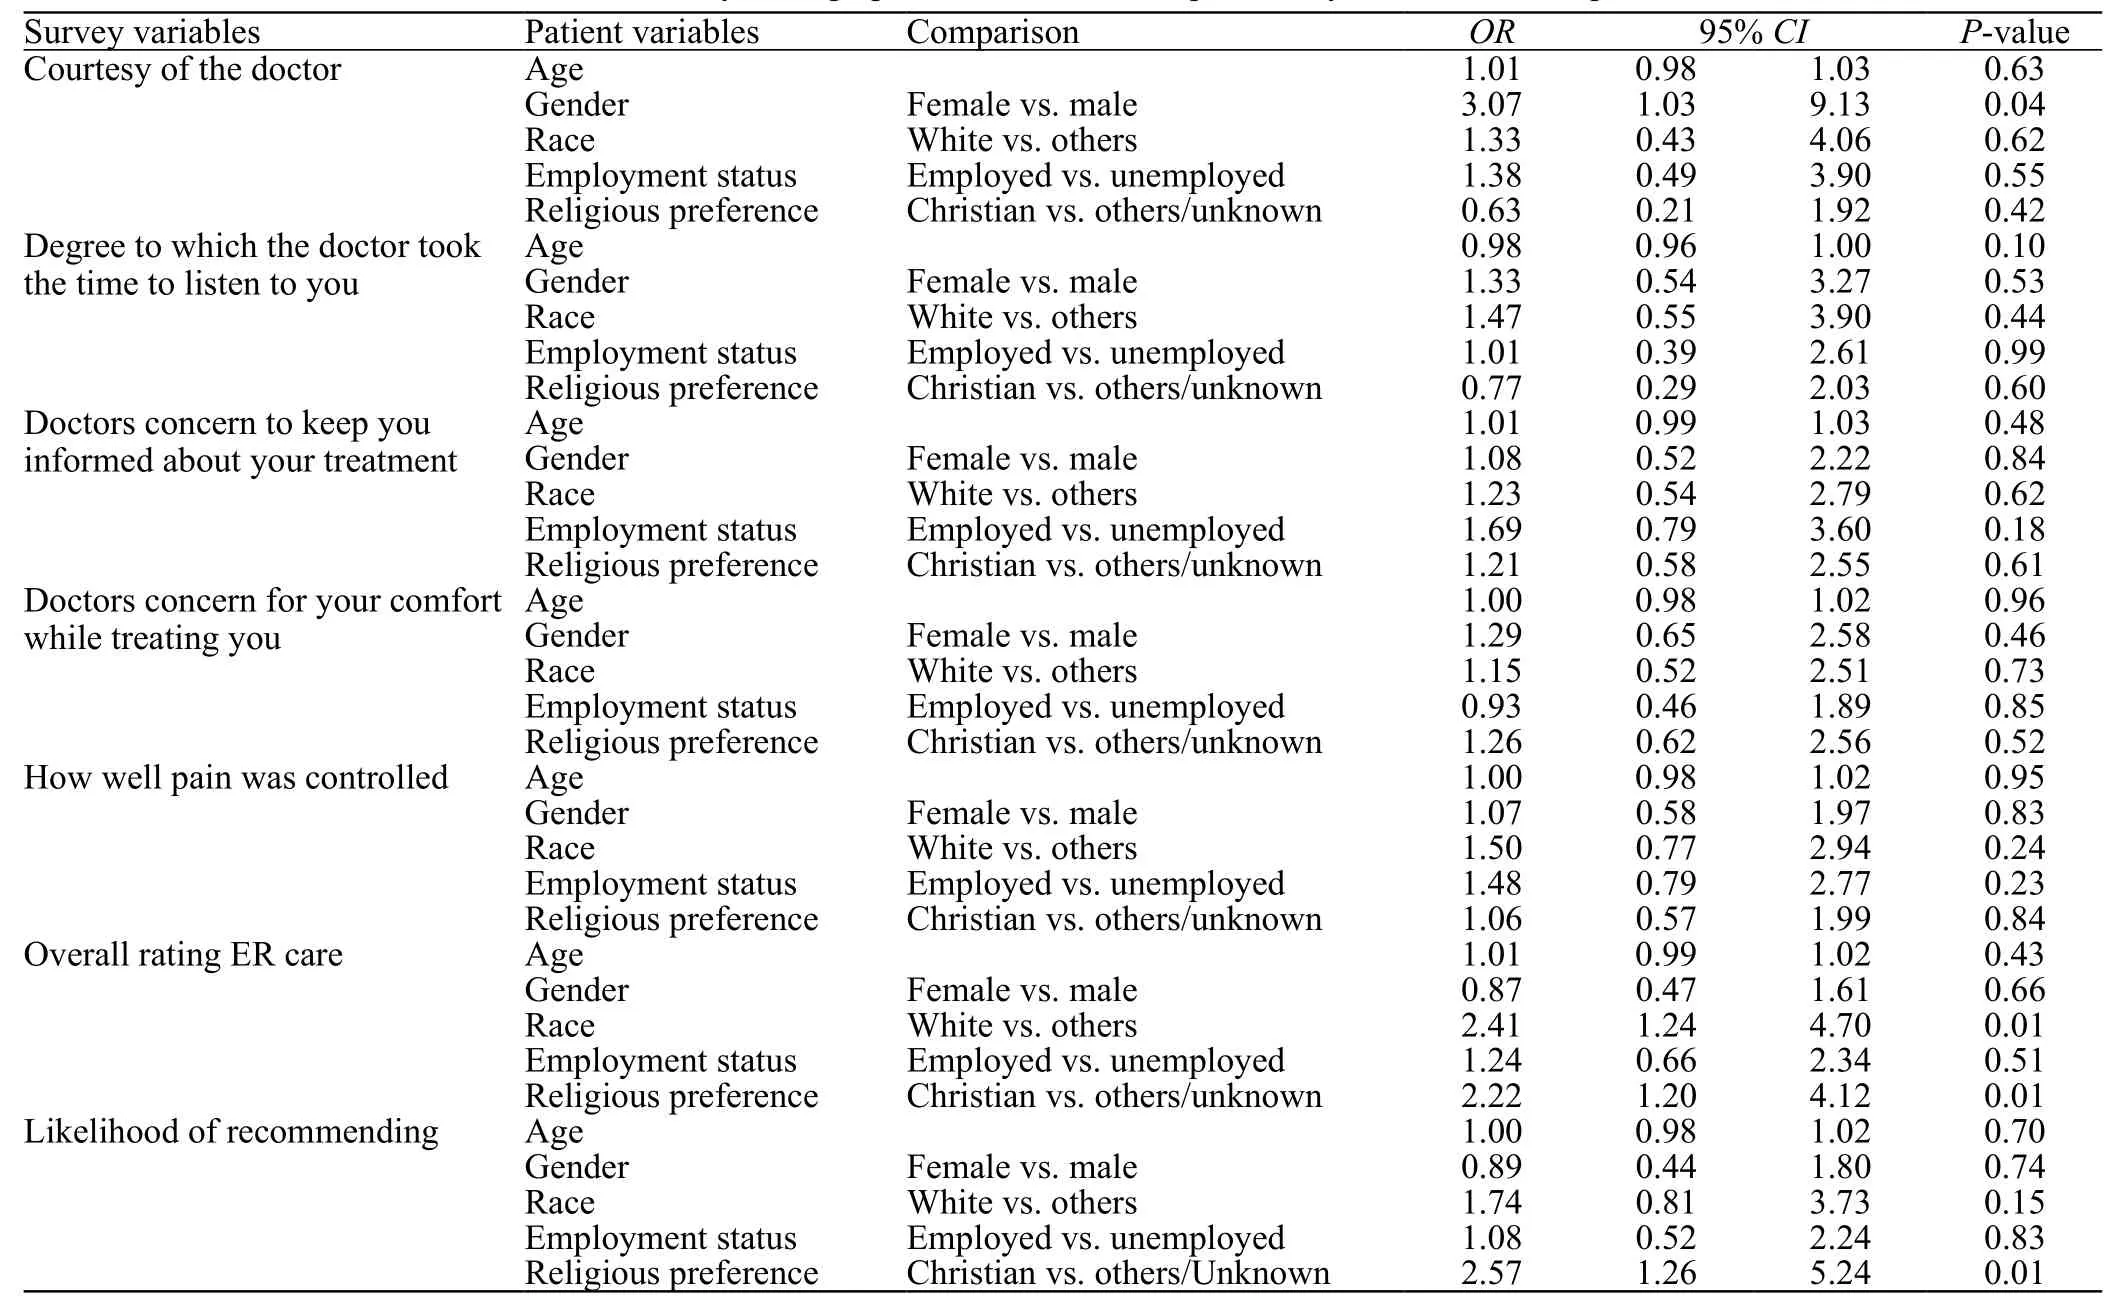
Table 4. Associations between institutional survey demographic variables and the probability of satisfaction top box scores
Apart from the ED environment, the distribution methods and survey administration techniques also affect patient experience scores. Our study reported signif icantly different patient experience scores between the PGA survey and IS for the same physicians, at the same ED. PGA distributes their surveys by two-wave mail, phone or combined mail/phone between 48 hours and 6 weeks post-discharge. The survey is paper-based,with over 40 questions concerning patient ED experience in various fields including the behaviors of doctors,nurses, receptionists, and facility conditions. Although PGA’s survey distribution method ensures patient anonymity and privacy, it is subjected to recall bias and possibly omits patients who do not have established addresses or contact information. With direct delivery of the IS to patients in the ED, we were able to include this population and achieve a holistic ED patient population response. The IS was delivered via tablet by RAs who had no involvement in patient care. Patients completed the electronic form anonymously in a private area. The survey was delivered at the time of discharge to reduce recall bias and to assure no impacts on patient care, given that the care was already rendered.
The length of the survey also dictates the response rate. The IS is shorter, yet contains the same key questions when compared to the PGA survey. Initially,we expected a higher number of completed IS responses;however, we did not find a substantial difference in the number of completed surveys between the PGA survey and the IS (289 vs. 234). Scantron Corporation suggests four tactics to increase survey participation.[12]These tactics include: administering surveys that take no longer than 15 minutes to complete, ensuring that the survey is easy to take and return, sending multiple requests to complete the survey and proper formatting of the survey questions.[12]The IS is a shortened version of the PGA survey that patients can complete conveniently,without any hassle in returning the completed survey to the administrator. The PGA survey does employ the multiple reminder technique to increase survey participation. Perhaps, the answer to capture accurate ED patient experiences is to administer an on-site satisfaction survey, and then send a follow-up survey and reminders.
We also observed that White, Christian and female patients were more likely to be satisfied with their ED experience in the IS report. Although we cannot extrapolate these observations to match the PGA results,perspectives regarding these research outcomes are scattered. One study reported higher satisfaction in non-Hispanic Black and Hispanic patients whereas another study reported education and White ethnicity as the most important factors in predicting higher scores.[13,14]Another study reported that White, older patients with low door-to-room time had higher patient satisfaction scores.[15]The absolute effect of patient demographic data on their ED experience and satisfaction remains unknown; however, patient race/ethnicity, education,language, age and gender do affect satisfaction scores.CMS is already aware of this phenomenon and applies patient-mix adjustments to hospital results before publishing their report to the public. But the PGA reports sent to the hospital are not adjusted for patient demographics; therefore, hospital leaders and individual healthcare providers will need to consider demographics,by location, when interpreting satisfaction reports and implementing changes in medical practice.
In regards to patient demographics between daytime versus nighttime ED visits, previous literature suggests that patient demographic variables do not differ significantly between these time periods. Specifically, a study conducted in an ED setting found no significant demographic characteristics between nighttime groups and other-time groups who presented with asthma symptomatology.[16]A study conducted with stroke patients found that patients with daytime and nighttime strokes had similar demographics; and another study found that appendicitis patients’ clinical, demographic and socioeconomic statuses did not differ between different times-of-presentation.[17,18]Finally, a study conducted in an accident and emergency department found no gender variations in temporal attendance patterns.[19]These f indings suggest that demographics are typically similar regardless of when a patient presents to the ED within a 24-hour time period.
Limitations
Our study has limitations due to the infrastructure of research at our institution and the study design. We only enrolled patients from 8 a.m. to midnight, when the RAs were available. Therefore, our results do not include patients who were discharged from the ED between midnight and 8 a.m.. This introduces convenience sampling biases in the IS data. This project was a principal investigator-initiated project; therefore, we do not have funding to hire research associates to assist with the project. Our research associates, who enrolled participants, were volunteer undergraduate students.They were only available during the hours of 8 a.m. to midnight. We chose to conduct a convenience sampling study, because our goal was to compare the PGA survey results with the IS results from our specif ic academic ED.We have access to the PGA results from our institution only; however, the structure of our ED is largely representative of other ED models. This is why we believe that our results can be useful to other emergency medicine settings that hope to assess patient satisfaction in their respective patient populations. Additionally, the PGA sampling method was not available to us; therefore,we chose this method to increase our enrollment rate.
In addition, despite that the responses of the IS and PGA were from the same ED, it is important to note that the participants were unmatched between the two groups. We planned to enroll all ED visits during a sixmonth period, which would total to approximately 18,000 surveys; however we ended the study earlier than anticipated, with 234 enrollments obtained during a five-month period, because we observed a significant difference in patient satisfaction scores between the IS and PGA survey data. Given that we studied the IS and PGA scores from the same period, we did not expect any monthly variation to alter our results.
We obtained ED visit data from November to December 2017. Although there are statistically significant differences in age, gender and race between the patients who presented to the ED from 8 a.m.to midnight (enrollment period) and midnight to 8 a.m. (non-enrollment period), the differences were not clinically significant. Additionally, this data was collected and reported during the time when patients f irst registered to the ED, while the RAs enrolled patients for our study during their ED stay and/or when patients were being discharged from the ED, which indicates time discrepancies.
It is possible that the differences in methodology may be explained by the differences in timing of the surveys. Patients may not assess their ED visit immediately in the department and may provide more complete responses at a later day/time, especially after full recovery. Additionally, the administration of a survey in the department during time of discharge can pressurize patients to complete the survey and inflate the scores.This is especially true when the RAs assist patients with completing the survey and collecting the patients’responses.
The higher scores obtained from the IS data may be a result of selection bias, where only patients who wished to report a positive experience agreed to complete the survey whereas those patients who had a negative ED experience refused to take the survey or vice versa.However, this bias may exist in the PGA data as well.Additionally, patients may have felt obligated to report positive scores when the RAs conducted the survey and recorded their responses (in an interview-like format)compared to patients who completed the survey by themselves using the tablet. Because the RAs, not family members, assisted patients who could not read or were unable to f ill out the survey by themselves due to various reasons, this response bias may exist in the IS data.Although, the RAs explicitly stated to patients that they are research personnel and had no involvement in patient care.
CONCLUSIONS
We found significant differences in patient satisfaction scores between the IS and PGA surveys.Our hypothesis was supported; this finding affirms that satisfaction scores are affected by additional factors irrespective of healthcare provider behaviors. We recommend considering patient demographic variables when interpreting and utilizing ED experience score reports. Multiple survey techniques and distribution methods may be employed to best capture accurate ED patient experience responses.
Funding:This work was supported by the Undergraduate Research Opportunities Program Faculty Advisory Board at the University of California, Irvine; and partially by the National Center for Advancing Translational Sciences, National Institutes of Health(NIH), through the Biostatistics, Epidemiology and Research Design Unit [grant number: UL1 TR001414].
Ethical approval:The Institutional Review Board (IRB) at the University of California, Irvine reviewed and approved this study.
Conflicts of interest:The authors declare no financial or other conf licts of interest.
Contributors:WH determined the concept of the study and was a major contributor to the study design, data collection, data analysis and manuscript preparation. PS, MN, CL, JP, AW and MJ contributed to the study design, data collection, data analysis and manuscript preparation processes. YC assisted in statistical analysis, in writing the manuscript and revising the article. All authors read and approved the f inal manuscript draft.
 World journal of emergency medicine2019年3期
- World journal of emergency medicine的其它文章
- Instructions for Authors
- Retroperitoneal hematoma following common iliac artery injury in a child
- Benef its of using an endotracheal tube introducer as an adjunct to a Macintosh laryngoscope for endotracheal intubation performed by inexperienced doctors during mechanical CPR: A randomized prospective crossover study
- Are radiological modalities really necessary for the long-term follow-up of patients having blunt solid organ injuries? A single center study
- A comparison of simulation versus didactics for teaching ultrasound to Swiss medical students
- Prioritization of factors related to mental health of women during an earthquake: A qualitative study