
Evaluation of the Forecast Performance for North Atlantic Oscillation Onset
2019-06-14 12:58:26GuokunDAIMuMUandZhinaJIANG
Advances in Atmospheric Sciences 2019年7期
Guokun DAI,Mu MU and Zhina JIANG
1Department of Atmospheric and Oceanic Sciences&Institute of Atmospheric Sciences,Fudan University,Shanghai200438,China
2State Key Laboratory of Severe Weather,Chinese Academy of Meteorological Sciences,Beijing 100081,China
ABSTRACT By utilizing operational forecast productsfrom TIGGE(The International Grand Global Ensemble)during 2006 to 2015,theforecasting performances of the European Centre for Medium-Range Weather Forecasts(ECMWF),National Centers for Environmental Prediction(NCEP),Japan Meteorology Agency(JMA)and China Meteorological Administration(CMA)for the onset of North Atlantic Oscillation(NAO)events are assessed against daily NCEP–NCAR reanalysis data.Twenty-two positive NAO(NAO+)and nine negative NAO(NAO−)events are identif ied during this time period.For these NAO events,control forecasts,one member of the ensemble that utilizes the currently most proper estimate of the analysis f ield and the best description of the model physics,are able to predict their onsets three to f ive days in advance.Moreover,the failure proportion for the prediction of NAO−onset is higher than that for NAO+onset,which indicates that NAO−onset is harder to forecast.Among these four operational centers,ECMWFhas performs best in predicting NAO onset,followed by NCEP,JMA,and then CMA.
Key words:NAOonset,operational forecast,TIGGEdataset
1.Introduction
The North Atlantic Oscillation(NAO)is a dominant atmospheric dipole mode in the Northern Hemisphere during wintertime,which is expressed as a seesaw sea level pressure(SLP)between the Icelandic low and the Azores high(Walker and Bliss,1932;Feldstein,2000;Woollings et al.,2008).Weather and climate in North America and Eurasiais greatly inf luenced by the NAO(Hurrell,1995;Diao et al.,2015).During the positive phase of the NAO(NAO+),both the Icelandic low and the Azores high strengthen,which induceswarming in North Americaand Europe.However,during the negative phase of the NAO(NAO−),both of these atmospheric centers weaken,which often causes cooling in North Americaand Europe(Marshall et al.,2001).
Many studies have investigated the NAO and its climatic e f f ects from a monthly mean or seasonal mean perspective(Thompson and Wallace,2000;Thompson et al.,2000;Zuo et al.,2016;Whan and Zwiers,2017).They have found that extremeclimatic eventsareusually associated with the NAO(Yiou and Nogaj,2004;Scaife et al.,2008;Seager et al.,2010).Furthermore,Feldstein(2003)showed that the intrinsic time scale of the NAOisapproximately two weeks.That is,the NAOcan beinvestigated from asynoptic view.On this basis,wecan investigatethedi f f erentstagesduringitslifecycle,such as its onset,development,and decay stages.From the perspective of its daily variability,many extreme cold events are related to NAO events.For example,Europe suffered from extremecold during thewinter of 2011/12,which wasmainly caused by an atmospheric circulationtransformation from NAO+to eastern NAO−(Luo et al.,2014).In December 2013,ablizzard attacked the Middle East,which was due to the atmospheric circulation associated with an NAO+decay stage(Luo et al.,2015).Therefore,skillful forecastsof NAOeventsmay prevent agreat amount of social loss.
Utilizing daily forecast products,Johansson(2007)compared the forecast skill of the NAO from the European Centrefor Medium-Range Weather Forecasts(ECMWF)and National Centers for Environmental Prediction(NCEP).Not only did this study calculate the anomaly correlation coeff icient(ACC;Murphy and Epstein,1989)of the 500 hPa geopotential f ield over theextratropical Northern Hemisphere(20◦–80◦N),but it also calculated thecorrelation of the NAO index(NAOI)between forecast products and observations.From their results,ECMWF o f f ered improved skill for the NAO forecast compared to that of NCEP,regardless of the ACC or the correlation between the NAOI.Furthermore,Vitart(2014)assessed the NAO forecast skill of ECMWFfrom 2002 to 2011,again investigating it from the perspective of the NAOIcorrelation.The results showed that if a threshold of 0.60 was applied,the skillful forecast time of the NAO extended to 11 days in 2011(Fig.7 in his paper).However,both the correlation of the NAOI and the ACC for the geopotential f ield are descriptors of the NAO mode,and they cannot ref lect the NAOintensity,let alone NAOevents.In other words,previous studies have evaluated the forecast skill of the NAO mode rather than NAO events.Fortunately,Scaife et al.(2014)evaluated the seasonal forecast skill of NAOevents,but without distinguishing between positiveand negative phases.As we know,the features and mechanisms for the onset and development of NAO+and NAO−events are quite di f f erent(Benedict et al.,2004;Luo et al.,2007;Barnes and Hartmann,2010;Jiang et al.,2015).Benedict et al.(2004)pointed out that the formation of NAO+is accompanied by anticyclonic wavebreaking,and viceversafor NAO−events.Luo et al.(2007)used atheoretical model and found that NAO−events could be excited repeatedly,while downstream isolated dipole blockings could be triggered after NAO+events decayed.All the above work inspired us to explore theforecasting performance of NAO+and NAO−eventsseparately.
Since atmospheric circulation is a complicated and chaotic system,a deterministic forecast is an estimation of thefutureatmosphere,which haslargeuncertainties(Lorenz,1963).To improve the forecast skill,ensemble forecasts,which perturb initial conditions and model systems are applied.Theensemblemean of theperturbed forecastsmay f ilter out the unpredictable part of the ensemble members and preserve the predictable part.Therefore,the ensemble mean is often more skillful than a deterministic forecast(Leith,1974;Leutbecher and Palmer,2008).Buizzaand Leutbecher(2015)evaluated the ECMWFforecasting skill for theinstantaneous grid-point 500 hPa geopotential height f ield in the Northern Hemisphere from 2012 to 2013.Based on their result,thedeterministic forecast timewas17.0 daysin advance for the Northern Hemisphere500 hPageopotential height,by utilizing the RMSE measurement.However,for the ensemble forecast,the forecast time was improved to 22.0 daysby the measurement of the continuous ranked probability score.This inspired us to speculate that a longer skillful forecast time in advance might be achievable for NAO events if ensembleforecastsareapplied.
Because NAOeventsareoften related to extremeweather in the Northern Hemisphere during wintertime,it is necessary to investigate the forecasting performance for the onset of NAO events.Specif ically:(1)How far in advance can NAO onset be predicted by di f f erent forecast centers?(2)Is there any di f f erence in forecasting performance between the onset of positive and negative NAO events?(3)Can the ensemble mean forecast for the onset of NAO events achieve a better performance compared to the control forecast?The present paper seeks to answer these questions.In section 2,the data and methods used in the paper are described.The forecasting performances for the onset of NAO events based on control forecasts and ensemble mean forecasts are investigated in sections 3 and 4,respectively.Section 5 provides somediscussion,and conclusionsaredrawn in section 6.
2.Data and methods
2.1.Data
The reanalysis data used in this paper are the daily SLP from the National Centers for Environmental Prediction and National Center for Atmosphere Research(NCEP–NCAR).The spatial resolution is 2.5◦×2.5◦and the time period is from 1 January 1958 to 31 December 2015(Kalnay et al.,1996;Kistler et al.,2001).
The International Grand Global Ensemble(TIGGE)data are used to investigate operational weather forecasts from di f f erent centers.The program started in October 2006,which aimed to improve the forecasting skill for high impact weather events on a time scale from one day to two weeks.TIGGE data include daily weather forecasting products from 10 global centers(Park et al.,2008;Swinbank et al.,2016).In this paper,the daily operational forecasts of SLPfrom ECMWF,NCEP,the Japan Meteorology Agency(JMA)and the China Meteorological Administration(CMA)areused.The SLPf ieldswereinterpolated to aspatial resolution of 2.5◦×2.5◦beforecomparison.NCEPissuesfour forecasts daily,which start at 0000 UTC,0600 UTC,1200 UTC and 1800 UTC.Both ECMWFand CMA issuetwo forecasts,whichstartat0000UTCand 1200UTCdaily.However,JMA only issues one forecast,which starts at 1200 UTC.To obtain a fair comparison,a daily forecast starting from 1200 UTC is chosen.Moreover,the length of model integrations in ECMWF,NCEP,JMA and CMA are 15 days,16 days,9 days(11 days after 2013)and 10 days,respectively.For each operational center,thereisacontrol forecast,which utilizes the currently most proper estimate of the analysis f ield and best description of themodel physics,along with several ensemble perturbed members,which have perturbations on initial conditions and model systems(Park et al.,2008).The time period for comparison covers 1 November to 31 March from 2006 to 2015.
2.2.NAOI and NAOevents
To identify an NAOevent,the NAOIproposed by Liand Wang(2003)isused,which isdef ined asthedi f f erencein regionally normalized SLPzonally averaged over the Atlantic sector(i.e.,longitudes from 80◦W to 30◦E between a line of midlatitude(35◦N)and high latitude(65◦N)].This can be formulated as

whereˆP representsthenormalized SLPaveraged from 80◦W to 30◦E.This index focuses on circulation in the North Atlantic sector,which provides a more faithful representation of the spatiotemporal variability of the NAO.Moreover,this index has the ability to recognize eastern NAOevents,which performsbetter than the NAOIfrom the NOAA Climate Prediction Center(Luo et al.,2014).
Utilizing the method described in Li and Wang(2003)and thedaily NCEP–NCARreanalysisdata,daily NAOIvalues from 1 January 1958 to 31 March 2015 are calculated.The climatic reference state is obtained by averaging daily SLP from 1958 to 2000,which is consistent with previous work(Li and Wang,2003).To include more NAO cases,a time period from November to the following March is def ined aswintertime.
According to thedef inition of an NAOevent,if the NAOI is greater than 1.0 standard deviation for three or more consecutive days,an NAO event is identif ied.The period over which the NAOIis greater than 1.0 standard deviation is def ined as the persistent episode and the f irst day of the persistent episode isconsidered astheonset day,whilethelast day of theeventiscalled thedecay day(Fig.1).It isdef ined asan NAO+(NAO−)event when the NAOIis positive(negative)during the persistent episode.This def inition of NAO events iswidely used in NAO-related studies(Luoetal.,2016;Song,2016;Yao etal.,2016).Considering thattheremay beseveral intervals during NAO events,some rules should be made for selecting events.For two consecutive NAO events with the samephase,thesecond onewill beomitted if theinterval betweenthef irstdecay and second onset islessthanseven days.With these criteria,22 NAO+events and 9 NAO−events are selected for evaluation during thewintertimefrom 2006/07 to 2014/15(Table1).Theduration isdef ined asthetimeintervalbetween theonsetday and decay day.For theseselected NAO events,their durationsvary from 3 to 33 days.Although some events have durations as short as 3 days,others could be as long as nearly one month,they could all have impact on adjacent weather.
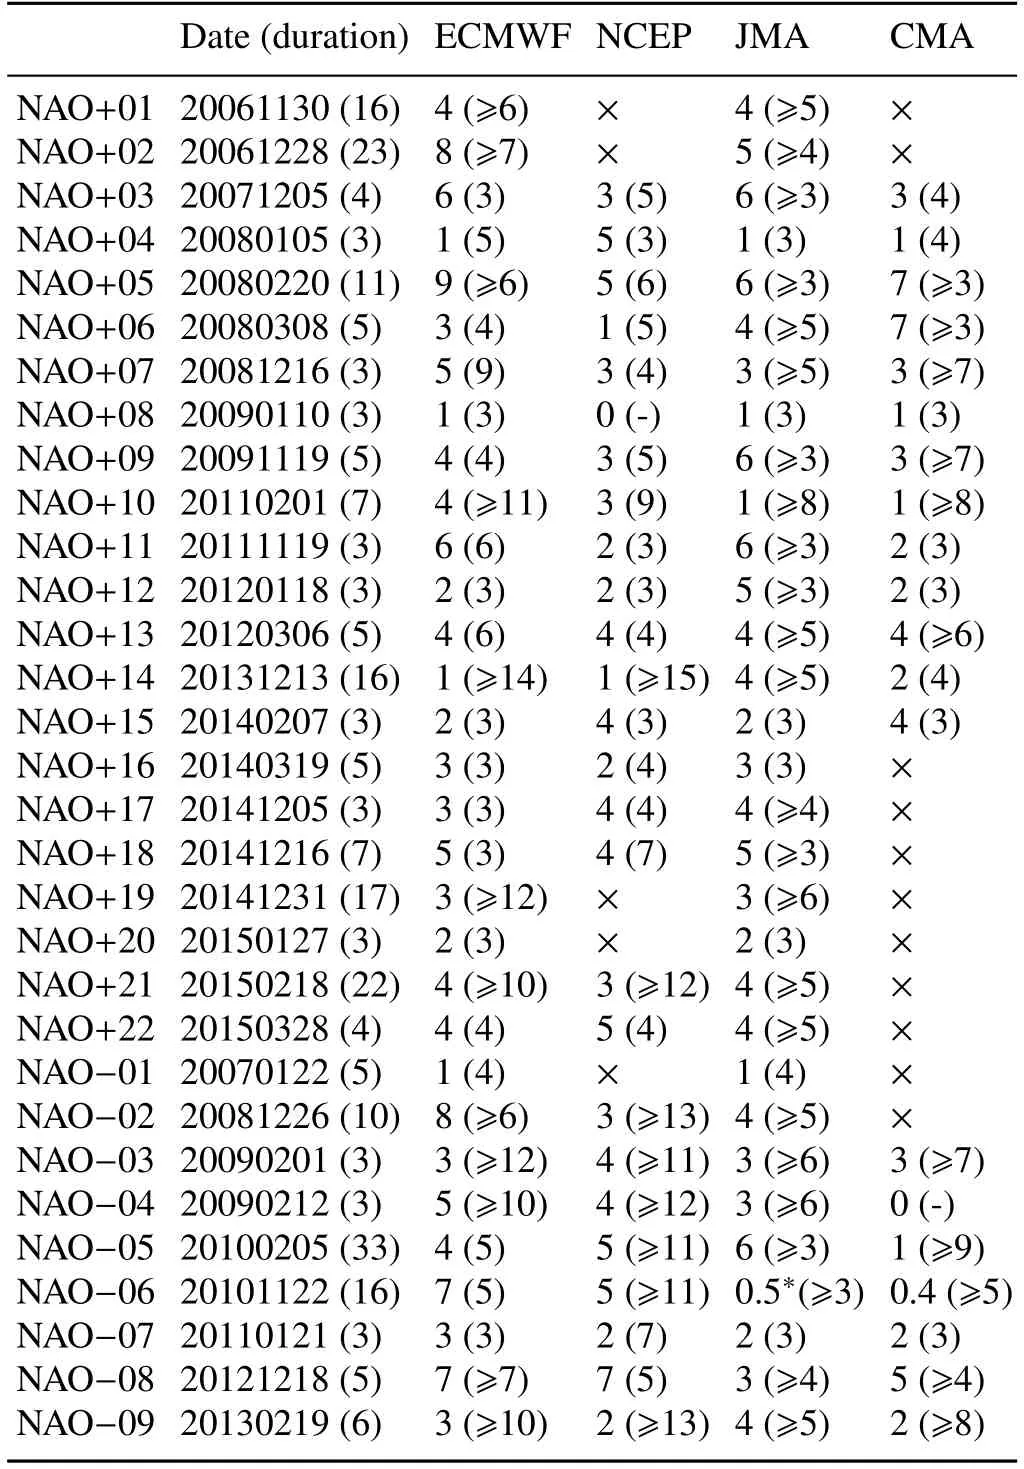
Table1.Theskillful forecast timesand their corresponding forecast durations(numbersin brackets)of thecontrol forecastsfor the NAO eventsfrom 2006 to 2015.
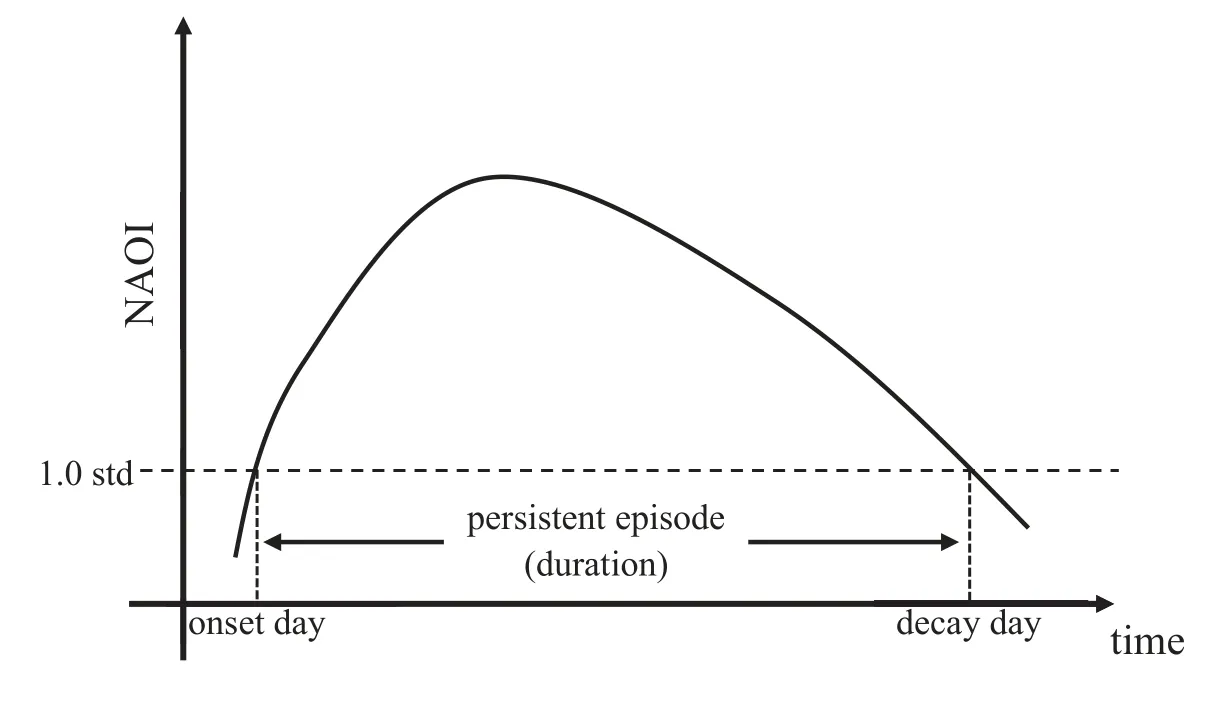
Fig.1.Schematic diagram of an NAO+event.An episode that has an NAOI larger than 1.0 standard deviation for at least three consecutive days is def ined as a persistent episode or duration.The f irst(last)day on which the NAOI is larger than 1.0 standard deviation is called the onset(decay)day.
2.3. Skillful forecast time
The skillful forecast time is def ined as the longest day thatthe NAOonsetcould beforecasted.Specif ically,theforecast products from one day in advance are used to identify whether or not an NAO event occurs.The criterion for determination is whether the NAOI derived from the operational centersexceeds1.0standard deviationand persistsfor atleast threeconsecutivedays.The NAOonset canbeforecasted one day in advance if the criterion is met,and the forecast made two daysin advance is tested in the same way.Products with di f f erent forecast times are tested and the longest day that is able to meet the condition is def ined as the skillful forecast time.
3.Evaluation of the control forecast performance
As already mentioned,the starting forecast time of 1200 UTC was chosen for these four operational centers because JMA only issues forecasts from 1200 UTCevery day.However,the outputs from all operational centers are instantaneousf ieldsat 0000,0600,1200 and 1800 UTC.Considering that the daily mean reanalysis SLPf ield isused in the def inition of NAOeventsand our evaluation ismadefor daily mean SLPf ields,operational forecast productsat 0000 UTC,0600 UTC,1200 UTC and 1800 UTC are averaged as the daily mean SLPf ield.
3.1.Evaluation of NAO+onset
In this subsection,we take the third case in Table 1(an NAO+event that occurred on 5 December 2007)asan example to illustrate how to def ine the skillful forecast time.The casewaschosen because NCEPand CMA joined the TIGGE project in March 2007 and May 2007,respectively.
Figure2 showsthe SLPanomaly evolution during theonset of NAO+.We f ind that,before the onset of NAO+,there are several negative SLPanomaliesat high latitudes(approximately 60◦N)in the North Atlantic sector and the negative anomalies deepen with time.Moreover,positive anomalies move towards lower latitudes(approximately 30◦N)in the North Atlantic sector and intensify after lag-4 day(Fig.2d).Then,the negative-over-positive dipole SLPanomaliesin the North Atlantic sector trigger the onset of NAO+.
Figure 3 illustrates the specif ic method for def ining the forecasttimefor theonsetof NAO+events.Fromthe NCEP–NCAR reanalysis data,the onset day for the event is 5 December 2007.From Fig.3 it is apparent that,for the onset of NAO+,ECMWF can predict six days in advance.However,for NCEP,JMA and CMA,the skillful predictions of NAO+onset arethree,six and threedaysin advance,respectively.
Utilizing the same method,the skillful forecast time for 22 NAO+eventsfrom 2006/07 to 2014/15 areidentif ied with forecast products from the four centers(Table 1).It can be seen that,for the 22 NAO+event onsets,almost all of them can bepredicted in advance,except for onecasefrom NCEP,which occurred on 10 January 2009.The skillful forecast time has a large range,from one to nine days.For the pre-diction of NAO+onset,the mean skillful forecast time of ECMWF is 3.82 days,which is the longest among the four centers.The mean skillful forecast time is 3.18 days for NCEP,3.77 daysfor JMA and 3.08 days for CMA.From the above results,we can conclude that the mean skillful forecast timefor theonset of NAO+onset isapproximately three to four days,which is much less than the eleven days derived from NAOIcorrelationby Vitart(2014).Thisdi f f erence may be caused by two main reasons.On the one hand,Vitart(2014)focused on the relationships of the NAOI annually,whilst our investigations focus only on NAO events during wintertime.On theother hand,whether or not the NAOIforecast exceeds1.0 standard deviation on aparticular day iscrucial in our assessment.However,Vitart(2014)paid more attention to the NAOIcorrelation between forecasts and observations.Moreover,the skillful forecast time from ECMWF is longer than that from NCEP,which is consistent with the resultsof Johansson(2007).However,in most cases,thepredicted NAOIis smaller than that derived from the reanalysis data,though both haveclosevalues.
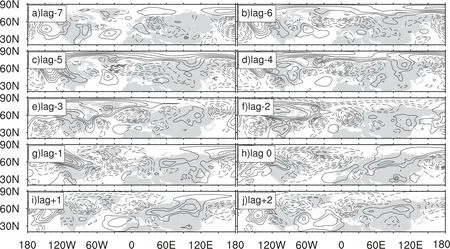
Fig.2.SLPanomaly evolution for an NAO+event.Lag 0 corresponds to the onset day of the NAO+event,which is 5 December 2007.The contour interval is 5 hPa.Solid and dashed lines represent positive and negative values,respectively.
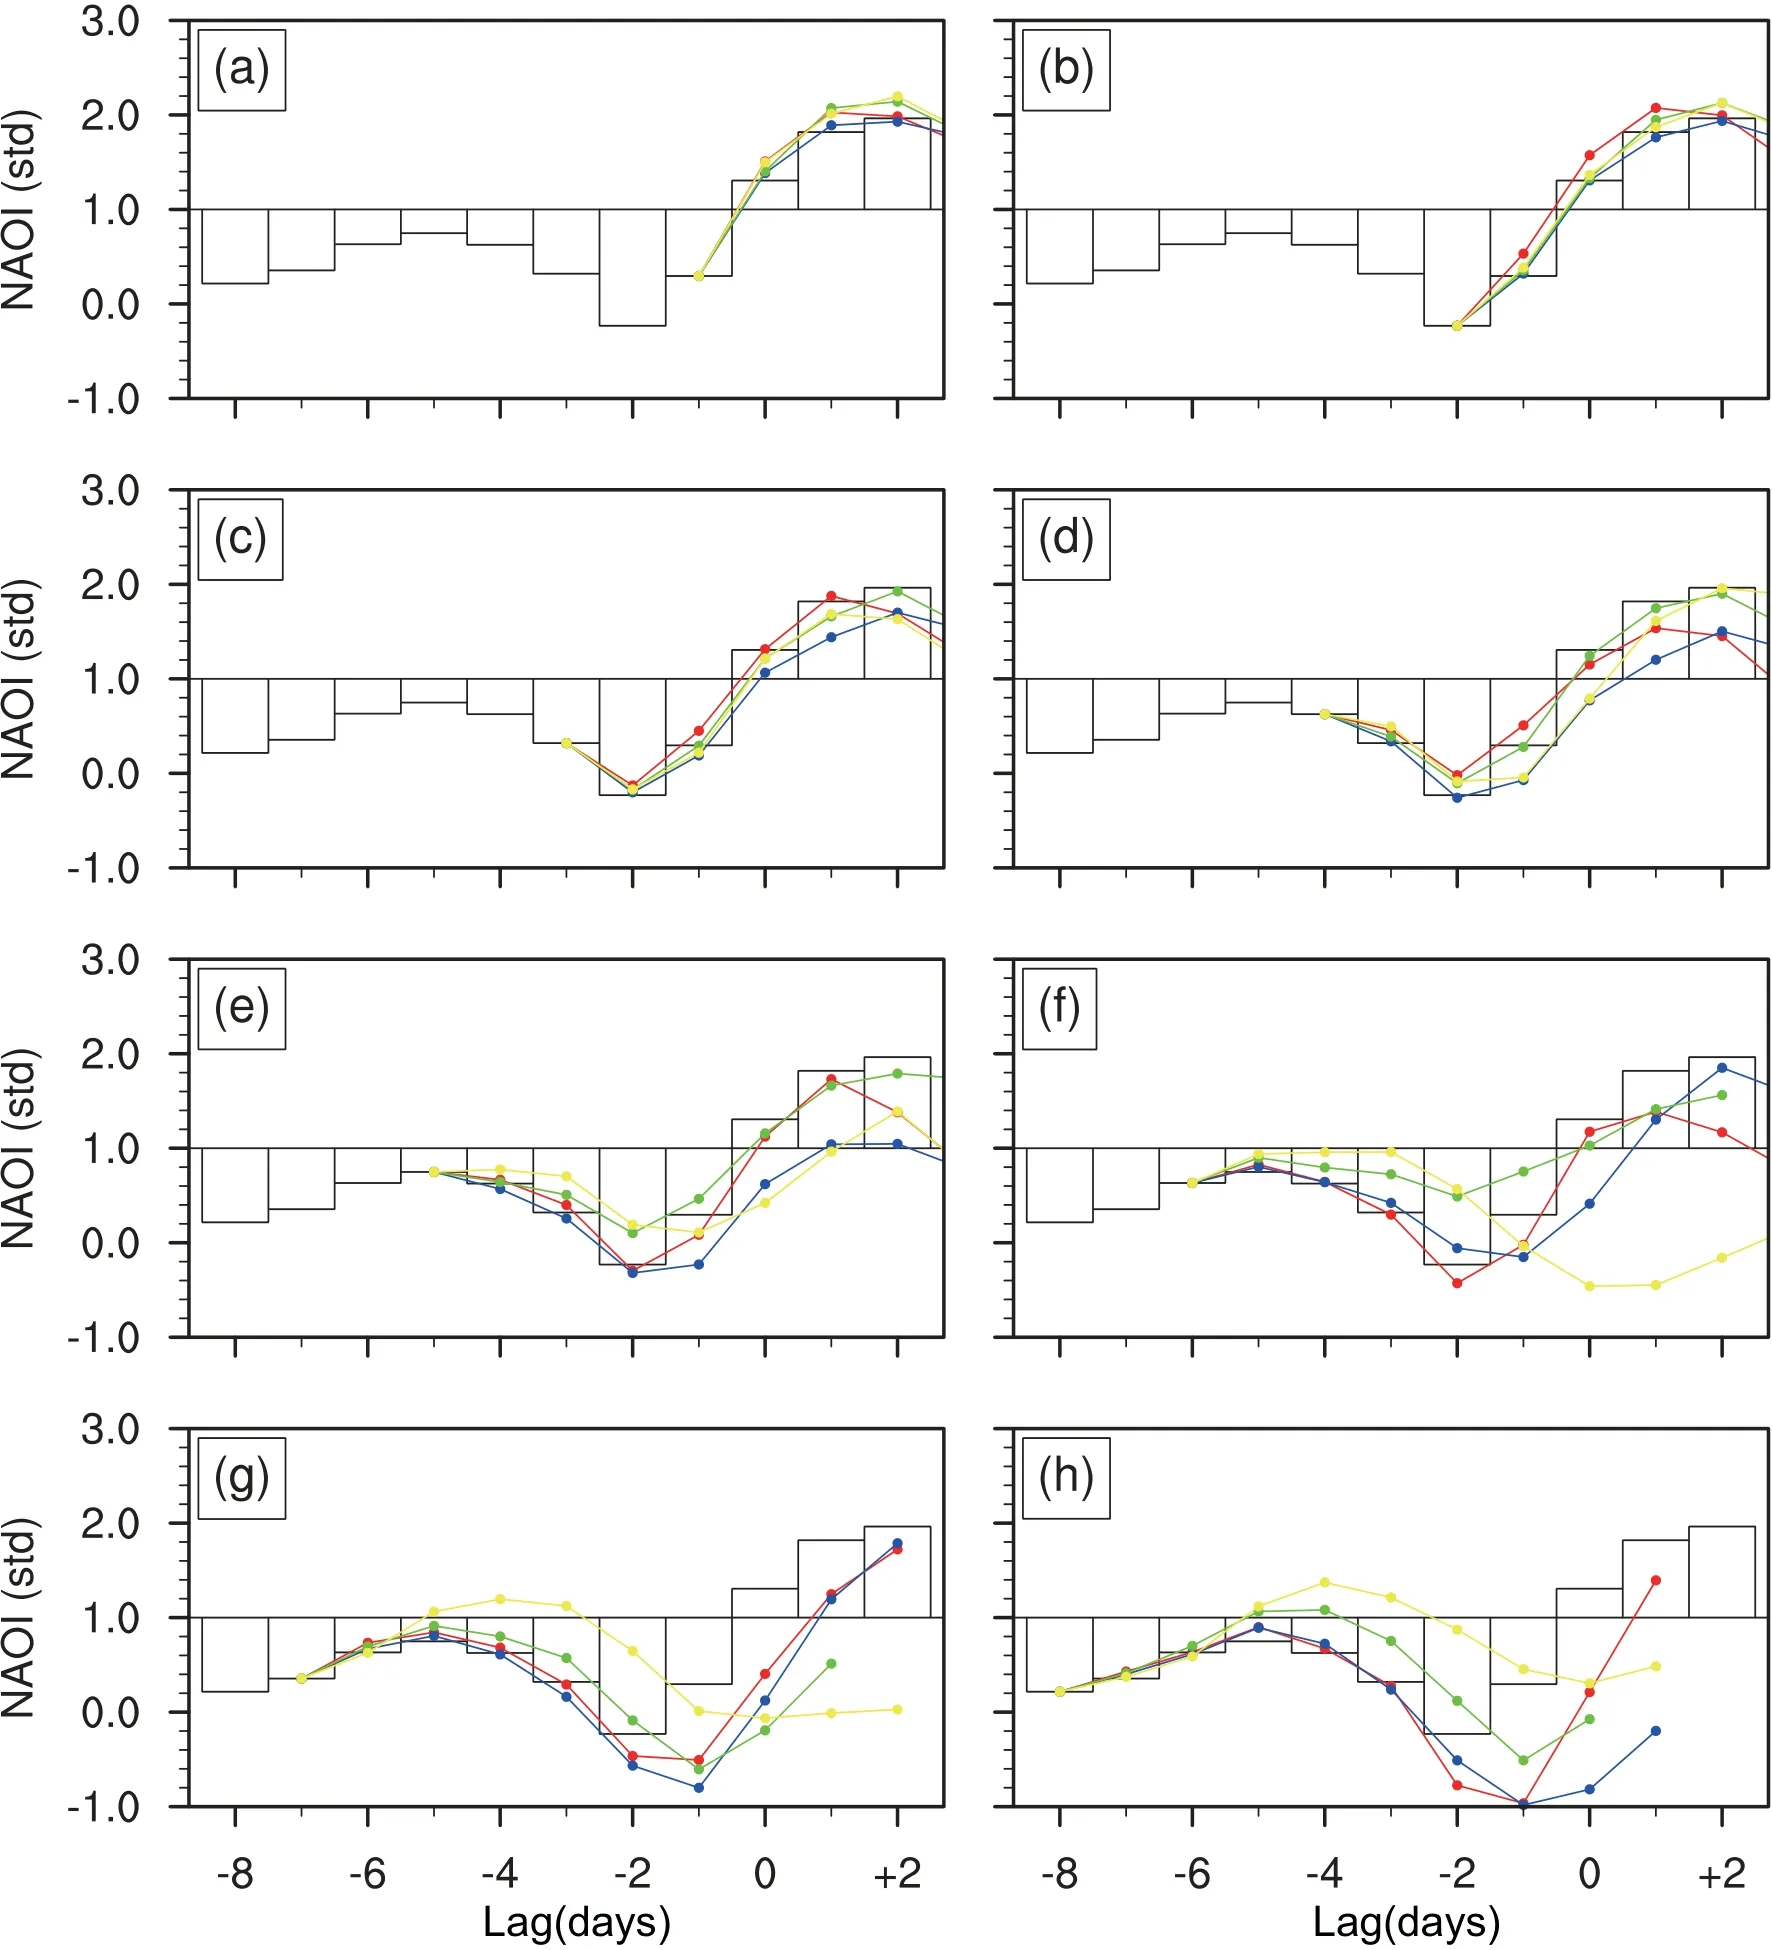
Fig.3.Schematic illustrations of the NAO+event onset forecast times,with the panels(a)to(h)representing forecast times of one to eight days in advance,respectively.The vertical axis is the normalized NAOI,and the histogram representsthereanalysisindex.Red,blue,green and yellow linesrepresent theforecast indexesfrom ECMWF,NCEP,JMA and CMA,respectively.Lag 0 corresponds to the onset of the NAO+event onset on 5 December 2007.
We focus mainly on the relationship between the NAOI derived from the reanalysis data and the forecast products in previousworks.However,the NAOIcannot represent all circulation features in the North Atlantic sector,although the index can be used to measure the phase and intensity of the NAO.To what extent,then,can circulation in the North Atlantic sector be predicted?To answer this,the predicted SLP anomalies for the onset of the NAO+event on 5 December 2007 from the four centers are given in Fig.4,with their own respectiveforecast times.Theforecasted SLPanomalies show a multicenter structure of negative anomalies,which has close similarity with that of the reanalysis(Fig.2).To quantify thissimilarity,the ACCof the SLPanomalies in the North Atlantic sector between the forecast and the reanalysis data is calculated.The ACC is 0.852 for ECMWFwith a skillful lead time of six days,0.954 for NCEPwith askillful lead time of three days,0.780 for JMA with a skillful lead timeof six days,and 0.931 for CMA with askillful lead time of three days,all of which are much larger than 0.60.This indicatesthat the evaluation of NAOonset with the NAOIin our work ismorerigorous.
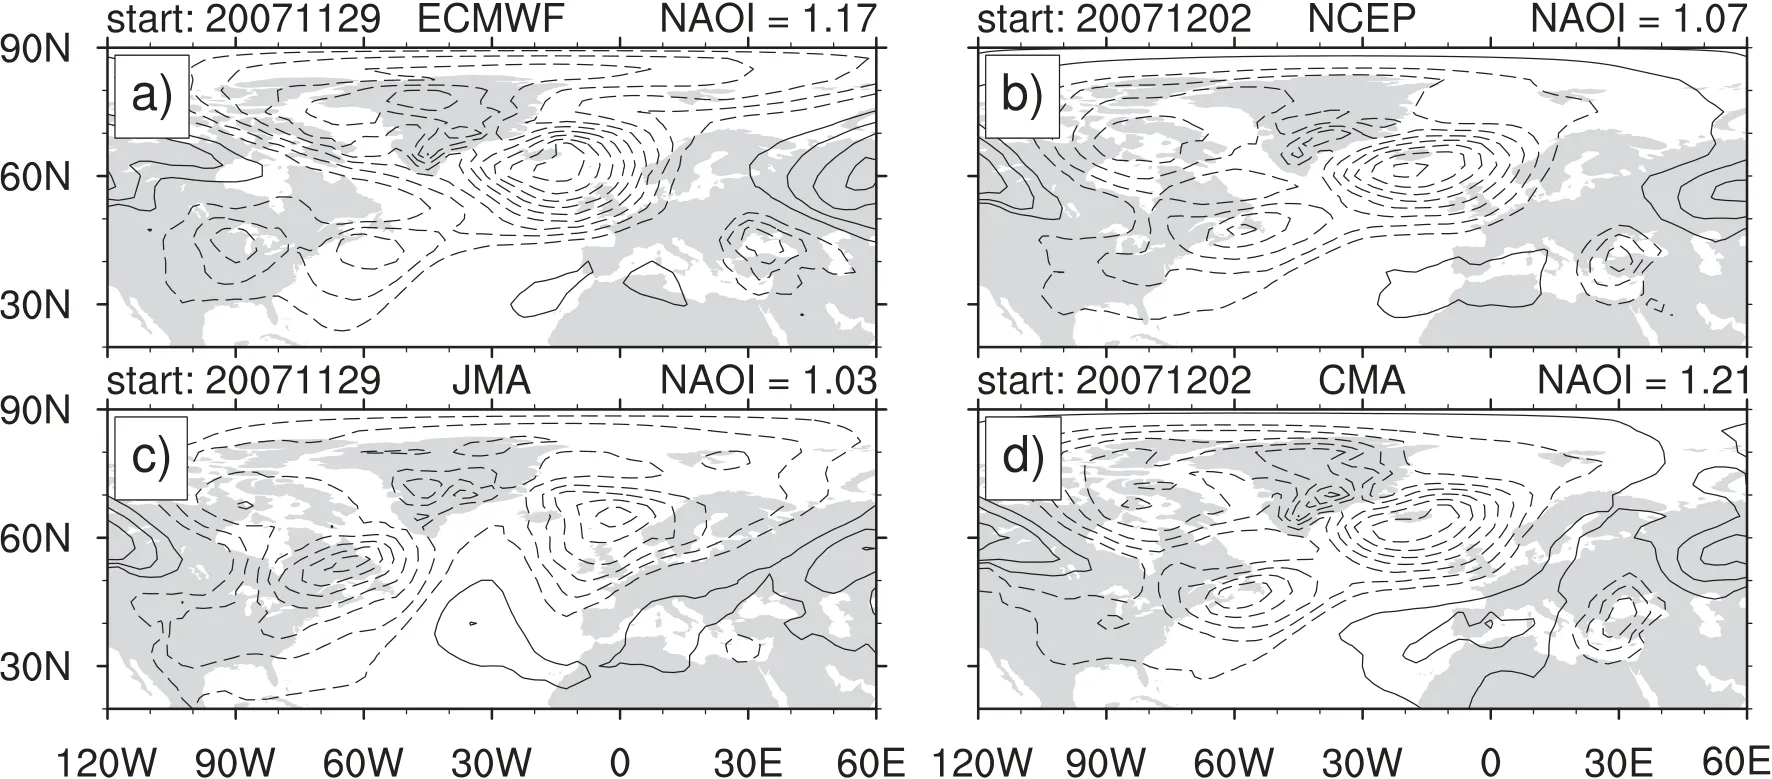
Fig.4.SLPanomalies for the NAO+event that occurred on 5 December 2007,as forecast by the di f f erent centers at their respective skillful forecast times:(a)ECMWFon 29 November 2007;(b)NCEPon 2 December 2007;(c)JMA on 29 November 2007;(d)CMA on 2 December 2007.Contour interval:5 hPa.
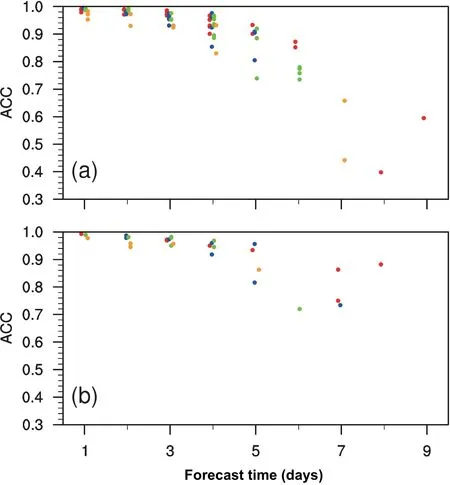
Fig.5.The ACC of the SLP anomalies in the North Atlantic sector between the reanalysis and the products from four centerswith their respectiveforecast timesfor(a)22 NAO+events and(b)9 NAO−events.Red,blue,green and yellow dots represent the forecasts from ECMWF,NCEP,JMA and CMA,respectively.
Similar work was carried out for the onset of 22 NAO+events(Fig.5a).For most cases,the ACC exceeds 0.60,which can be viewed as skillful forecasts(Hollingsworth et al.,1980).However,there are two caseswith low ACCs.We f ind that the ACC hasa low value of 0.398 in ECMWFwith a lead time of eight days for the second NAO+case(onset on 28 December 2006,Fig.6),and the ACC is 0.442 from CMA with a lead time of seven days for the sixth NAO+case(onset on 8 March 2008,Fig.7).For the second NAO+case,thereisanegative SLPanomaly mainly located over the mid to high latitudes between 70◦W and 20◦W.A positive SLPanomaly occupies western Europe and exhibits a westnegativeand east-positivepattern in the North Atlantic sector(Fig.6i).With one to six days in advance,the ECMWFcan predict SLPanomalies with west-negative and east-positive patterns.Furthermore,not only does the ACC between the forecast productsand the reanalysisdata exceed 0.80,but the predicted NAOI also has a close value with that of the reanalysisdata(Figs.6a–f).However,with alead timeof seven to eight days,theforecasted negative SLPanomaly in southern Greenland is more intensive,and the forecasted positive anomaly ismorenorthward than theobserved one.Moreover,the negative and positive SLP anomalies from the forecast show a northwest–southeast tilt rather than the zonal tilt that is observed from the reanalysis(Figs.6g and h).As a consequence of this pattern,the ACC has a low value of 0.64 for seven days(0.40 for eight days),and theforecasted NAOI hasamuch larger valuethan thatof thereanalysisaswell.Although theforecasted NAOIcan tracetheonset of the NAO+event,the forecasted SLPanomaly is dissimilar from that of the reanalysis.
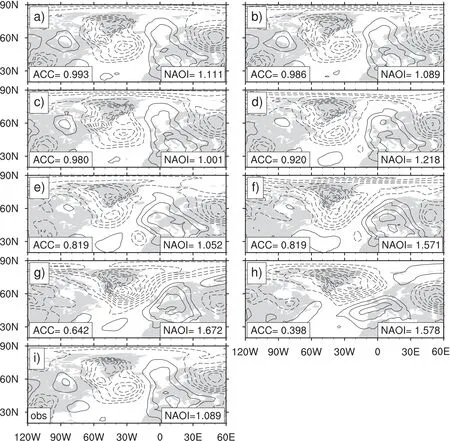
Fig.6.The forecasted and observed SLPanomalies in the North Atlantic sector on 28 December 2006.Panels(a)to(h)represent the ECMWF forecast one to eight days in advance,respectively.Panel(i)represents the SLPanomaly derived from the reanalysis(contour interval:5 hPa).Solid and dashed lines represent positive and negative values,respectively.Thezero line is omitted.
As for the sixth NAO+case,the reanalysis shows a negative-over-positive SLP anomaly,with a northeast–southwest tilt in the North Atlantic sector(Fig.7i).With a lead time shorter than six days,the SLP anomaly forecasted by CMA shows a northeast–southwest tilted dipole,which is similar to that in the reanalysis,and the ACC between the forecast and the reanalysis exceeds0.85(Figs.7a–f).When thelead timeapproachesseven days,theforecasted SLPanomalies exhibit a meridional dipole with no tilt(Fig.7g).As a result,the forecasted ACC is as low as 0.44,and the NAOIhasavalueof 1.574,which ismuch larger than the value of 1.036 derived from the reanalysis.That is,although the forecasted NAOI can trace the NAO+onset with a lead time of seven or eight days,the predicted circulation pattern isdissimilar to that of the reanalysis.Thisconf irmsthe conclusion that,for NAO+onset,skillful forecasts can only be made several days(approximately three to four days,on average)in advance.
3.2.Evaluation of NAO−onset
Similar to the evaluation for NAO+events,we perform an assessment on the nine NAO−event onsets as well.The forecast times for the onset of these NAO−eventsare shown in Table 1.Among thecases,most of theonsetscan beforecast several daysin advance,ranging from oneto eight days.However,for the 33 forecasts in total,three of them failed.The proportion of NAO−event onset forecasting failures is much higher than that of NAO+events,which only has one failure among the 75 forecasts.This may indicate that forecasting NAO−onset ismore di f fi cult than forecasting NAO+onset.On average,the skillful forecast time for NAO−onset is 4.56 days for ECMWF.ECMWF has the longest forecast time among the four centers,which is the same result as for NAO+onset.Themeanskillful forecasttimefor these NAO−events is 4.00 days,3.25 daysand 2.60 days for NCEP,JMA and CMA,respectively.
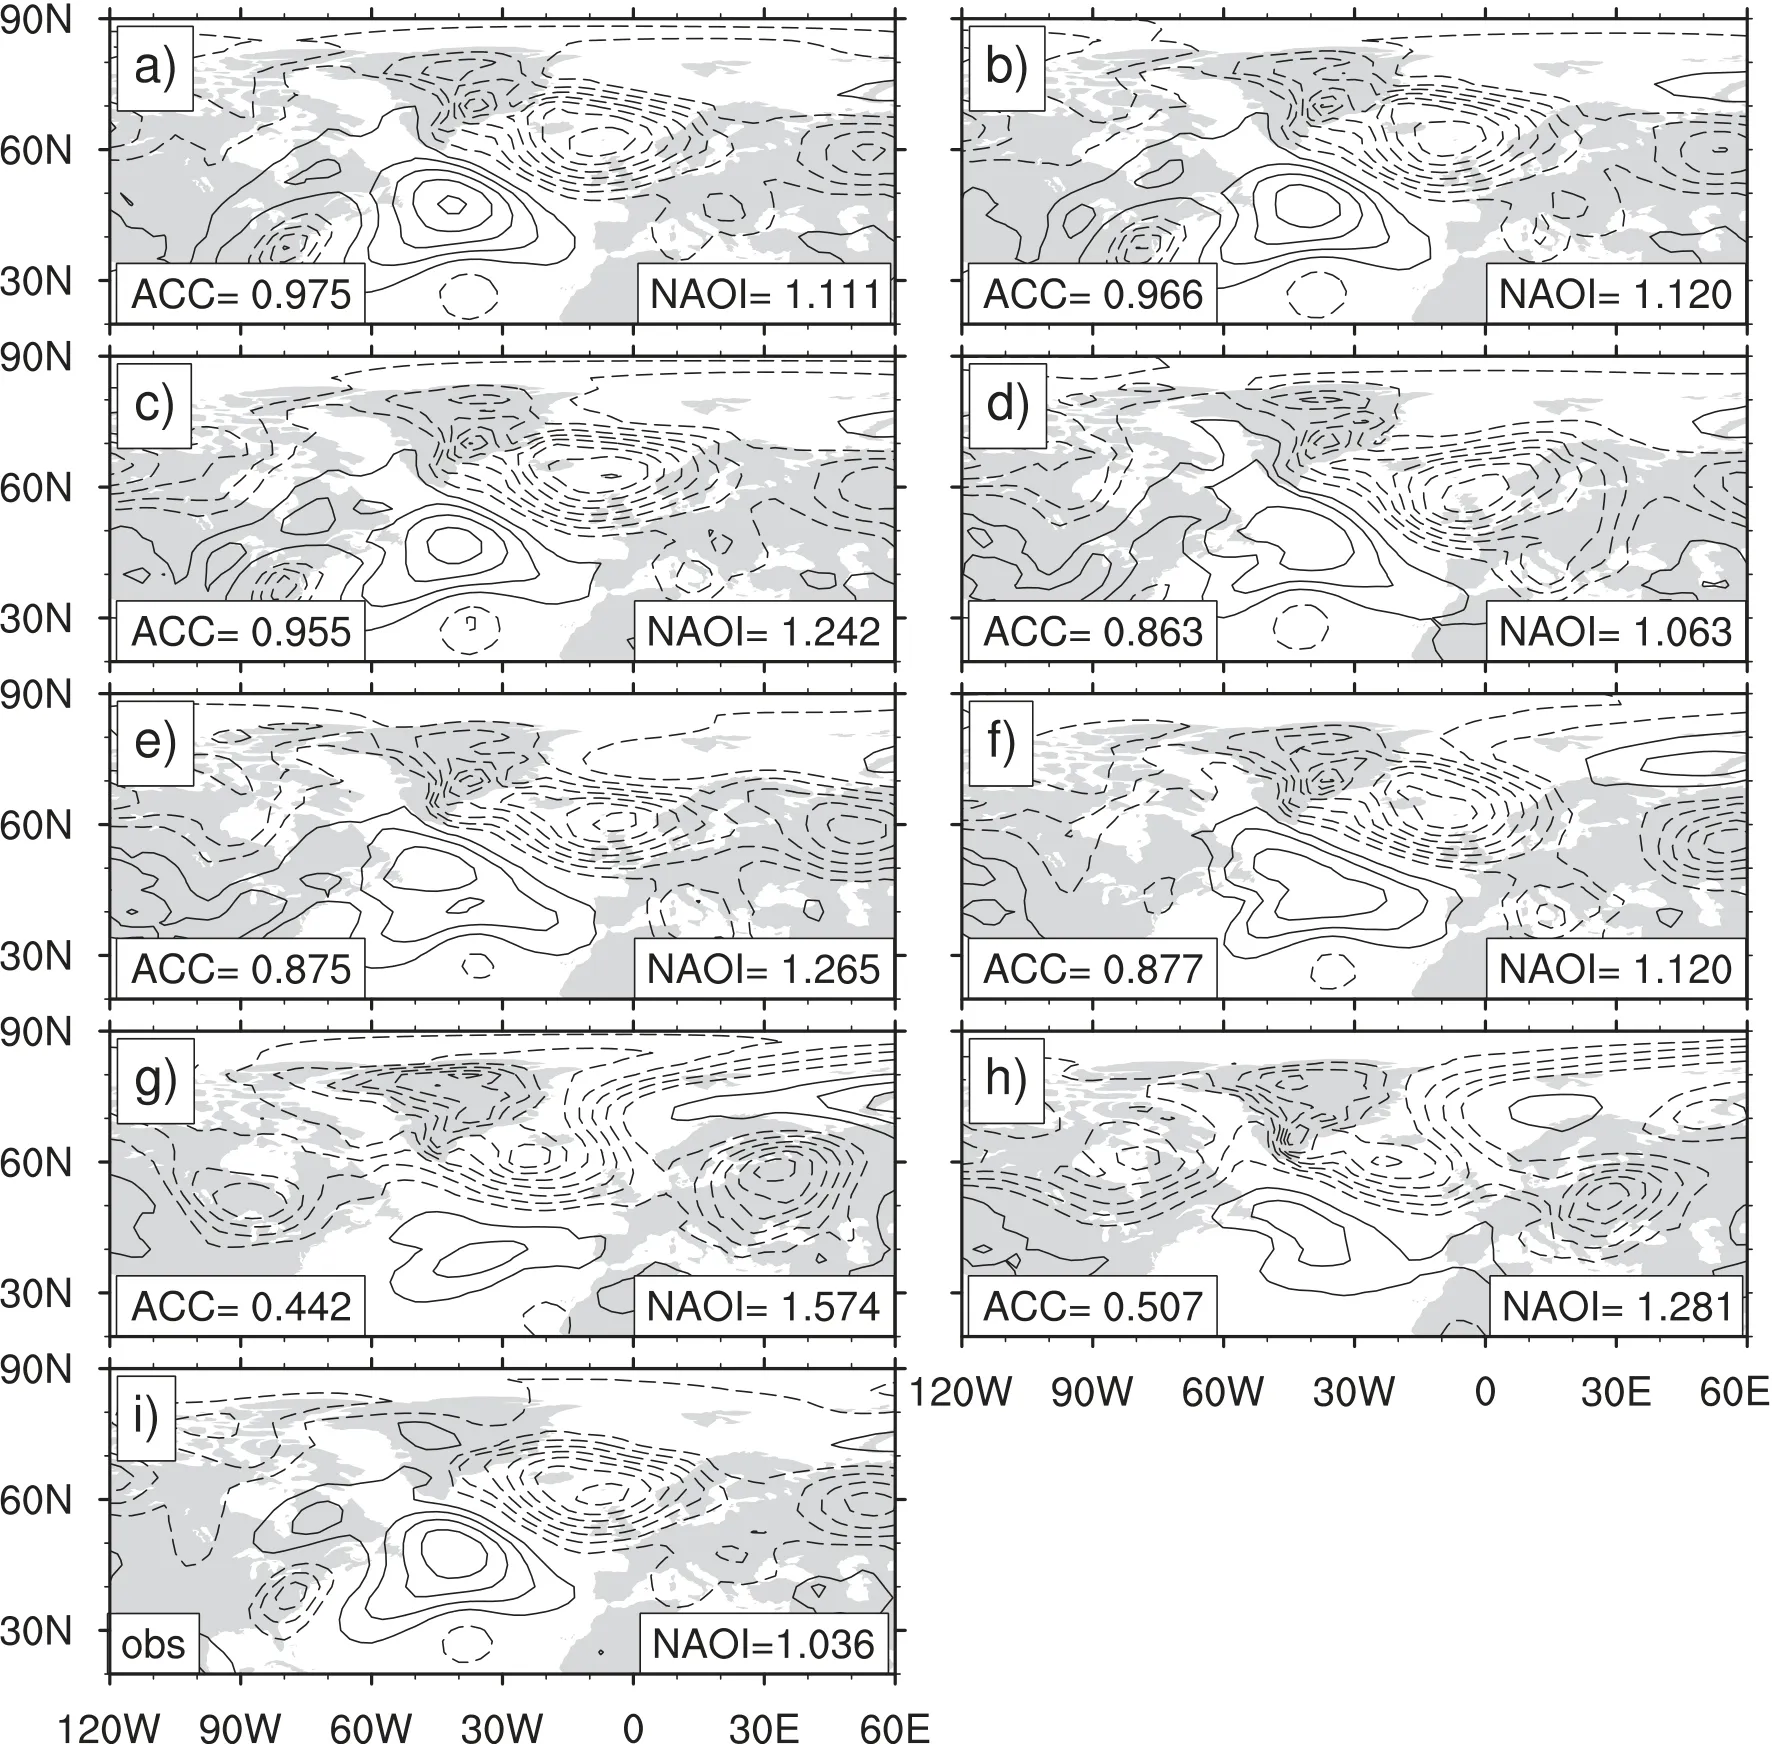
Fig.7.As in Fig.6 but for thecase on 8 March 2008 from CMA.
Similar to the NAO+onset forecasts,most NAO−forecasts underestimate the intensity of the SLPfe ild in meeting thecriterion of NAOonset.However,by calculating the ACC of the SLP anomalies in the North Atlantic sector between the forecast productsand the reanalysisdata,we fn id that the ACC exceeds 0.7,even for a lead time of eight days(Fi g.5b).That is,the forecast is skillful for NAO−onset evenif thelead timeislonger than oneweek.Thismay bedueto the small number of NAO−used in the assessment.
From the above results,we can conclude that the four chosen centers have the ability to forecast NAO onset sev-
4.Ensemblemean forecast performance
eral days in advance.However,the skillful forecast time is short(three to f ive days,on average).On the other hand,the proportion of failures for NAO−onset prediction is higher than that for NAO+,which indicates that NAO−events are harder to predict.This di f f erence in forecasting performance may relate to their di f f erent physical mechanisms.Specif ically,NAO−(NAO+)events being di f fi cult(easy)to predict is likely related to the strong(weak)nonlinearity of NAO−(NAO+)events,behaving with weak(strong)energy dispersion(Luo et al.,2007).This strong(weak)nonlinearity and weak(strong)energy dispersion makes NAO−(NAO+)events di f fi cult(easy)to predict.
In the section above,we discussed the control forecast performance for the prediction of NAO onset.However,besides the control forecast,operational forecast centers also produce ensemble forecasts by perturbing initial conditions and model systems.
In operational forecasts,ECMWFand JMA both perturb initial conditionswith the singular vector method.Each center produces 25 pairs of perturbations on the initial conditions.Together with the model stochastic process,ECMWF and JMA each produce 50 perturbed forecasts(the number of initial perturbation pairs in JMA reduced to 13,and the number of perturbed ensemble forecasts decreased to 26 after 2014).NCEP produces 10 pairs of initial perturbations with ensembletransform rescaling.Together with themodel perturbations,there are 20 perturbed forecasts in the NCEP ensemble.However,for CMA,seven pairsof initial perturbationsaregenerated with thebreeding vector method.Without any perturbationsin themodel integration,CMA produces14 perturbed forecasts in its ensemble.Previous investigations have proven that the ensemble mean can achieve a higher skill in operational forecasts(Leutbecher and Palmer,2008).However,for theonsetof NAOevents,whether or notensemblemean forecastscan improvetheperformanceisunknown.
As already mentioned,there are 50 perturbed forecasts from ECMWF.Together with the control forecast,the ensemble mean is obtained by averaging 51 forecasts with the sameweight.Similarly,theensemblemean forecastsof JMA,NCEPand CMA are achieved in the same way.
Throughasimilar method asused in section3,theskillful forecast time of the ensemble mean is assessed for the onset of 22 NAO+events.From the results(Table 2),we can see that most can be predicted oneto seven daysin advance.The averageskillful forecast timefor NAO+onsetis3.86 daysfor ECMWF,3.35 days for NCEP,3.27 days for JMA,and 2.77 days for CMA.We f ind that the skillful forecast time of the ensemble mean is not signif icantly improved compared with the control forecast.Moreover,the skillful forecast times derived by the ensemble mean of the JMA and CMA are somewhat shorter than that derived by thecontrol forecast.For example(i.e.,case5 on 20 February 2008),theskillful forecast time derived by the control forecast for NAO+onset is nine days in advance for ECMWF,six days in advance for JMA,and seven daysin advance for CMA.However,from the perspective of the ensemble mean,the skillful forecast time is seven days for ECMWF,four days for JMA,and f ive days for CMA.It seems that the skillful forecast time for NAO+onset derived by the ensemble mean is shorter than that by the control forecast.For the above case,this may be due to the fact that the ensemble mean weakens the strength of the NAO mode,so that it is too weak to satisfy the NAO event criteria.The limited ensemble members and limited cases presented hereisanother possiblereason.Moreover,for case 8 of the NAO+events,which occurred on 10 January 2009,neither the control forecast nor the ensemble mean forecast from NCEPcould predict itsonset in advance.
To further verify the circulation pattern forecasted by the ensemble mean,the ACC of the SLP f ield between the reanalysis and the ensemble mean forecast in the North Atlantic sector are calculated at NAO onset.From Fig.8a,it is obviousthatensemblemean forecastshavehigher ACCsthan that of control forecasts in most cases,especially for cases when the ACC in the control forecast is less than 0.60.This illustratesthattheensemblemean could achieveamoreaccuratecirculation pattern in the North Atlantic sector,although it cannot improve the skillful forecast time of NAO+onset compared with the control forecast.
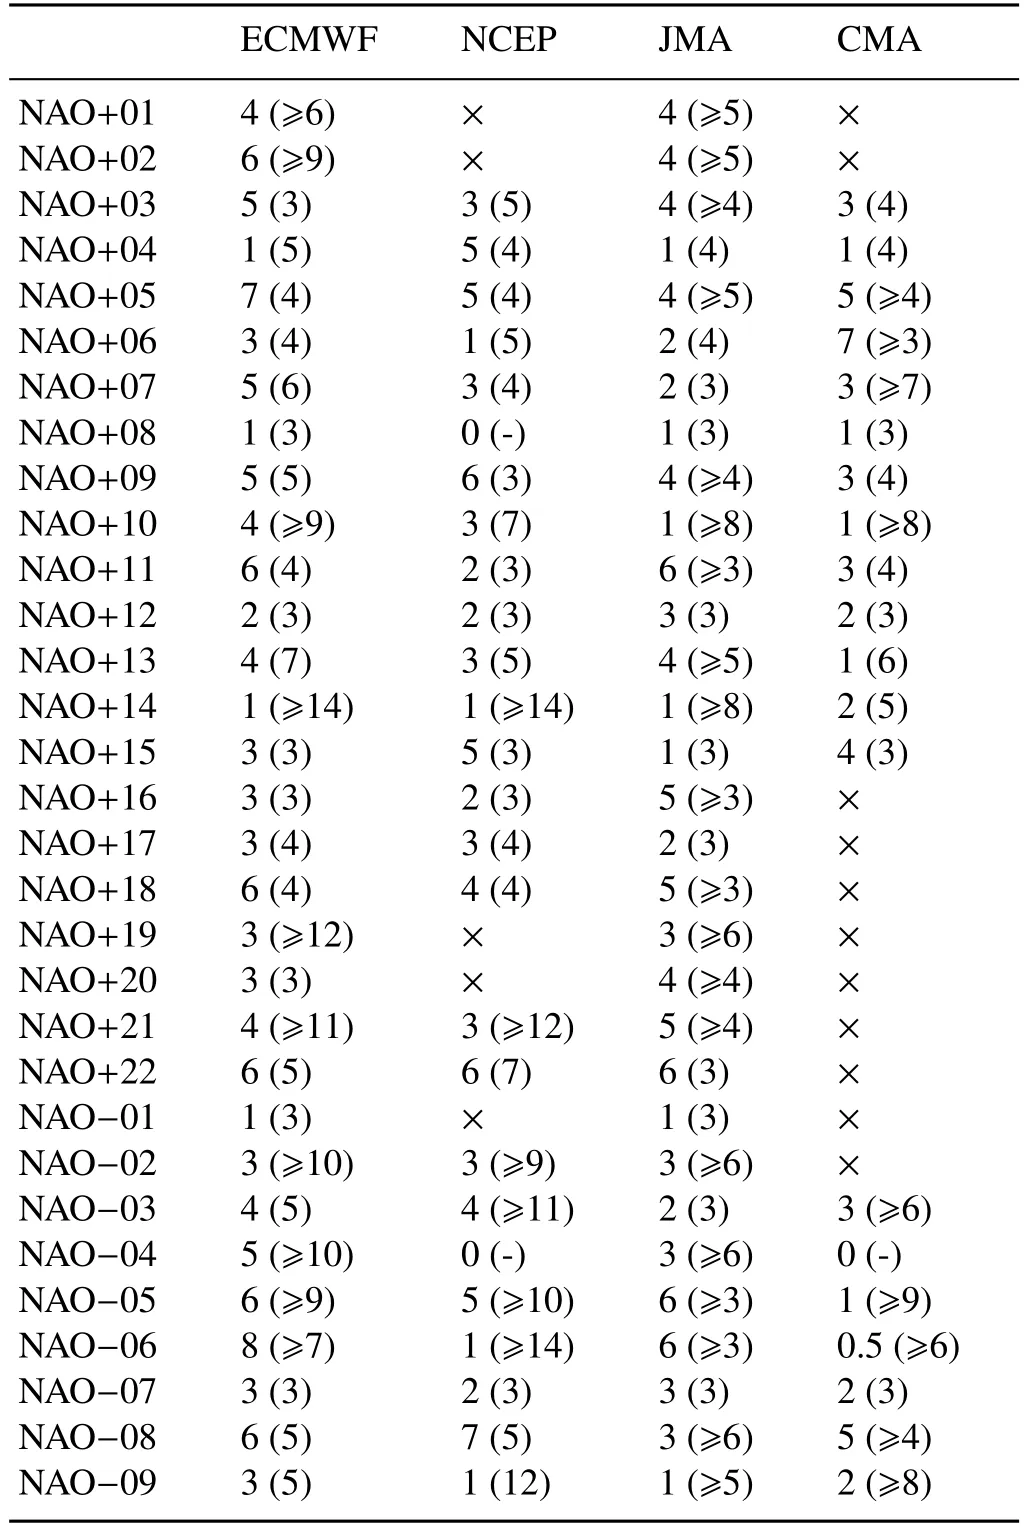
Table2.As in Table 1 but for the ensemble mean forecasts.
Similar work was carried out for the onset of nine NAO−onsets.The ensemble mean skillful forecast times from the four centers are shown in Table 2.From the results,we can see that the ensemble mean forecasts can predict NAO−onset one to eight days in advance for most cases.On average,theensemblemean skillful forecast timeis4.33 daysfor ECMWF,3.29 days for NCEP,3.11 days for JMA,and 2.60 daysfor CMA.
Similarly,the skillful forecast time for NAO−onset derived by theensemblemean doesnot o f f er any improvement.Moreover,the skillful forecast time derived by the ensemble mean is somewhat shortened compared with that of the control forecast,except for CMA.For example,the control forecast from ECMWF can predict the second NAO−onset case(which occurred on 26 December 2008)eight days in advance,but the ensemble mean skillful forecast time is only three days in advance.For the fourth NAO−onset case(which occurred on 12 February 2009),the control forecast from NCEPcan predict itsonset four daysin advance.However,the ensemble mean forecast could not recognize this NAO−event.
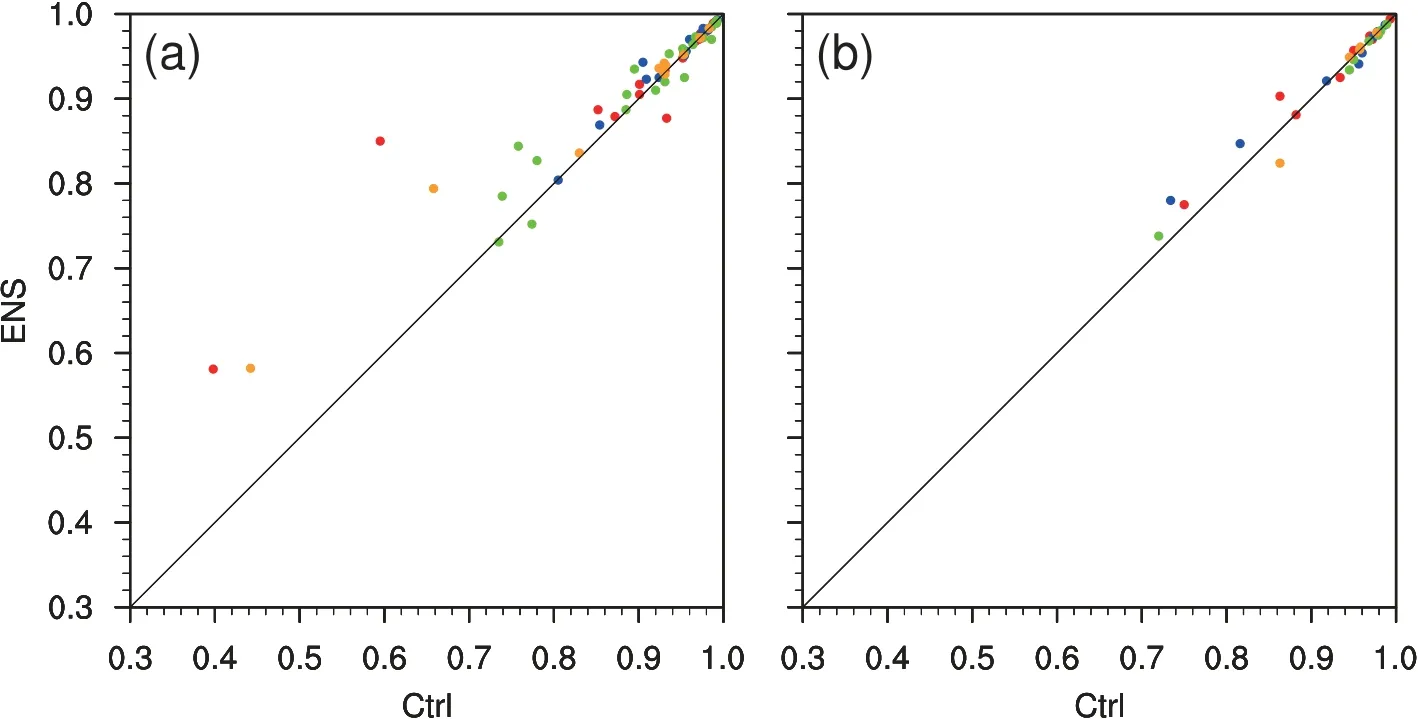
Fig.8.Comparisonof ACCvaluesderived by thecontrol forecastsand ensemblemeanforecasts for the onset of(a)NAO+events and(b)NAO−events.
However,not all of theensemblemeansshorten thevalid forecast time of NAO−onset.For example,in the control forecast,JMA could not predict the sixth NAO−onset case(which occurred on 22 November 2010),but its ensemble mean resulted in askillful forecasttimeof six daysin termsof theprediction of NAO−onset.Similarly,NCEPcould predict thiscaseeight daysin advancefrom itsensemblemean forecast,which is longer than that from its control forecast time(seven days).This may indicate that whether or not the ensemble mean forecast achievesa longer skillful forecast time for NAOonset dependson thecaseand themodel.
Inspired by theresultsfor NAO+events,wealso investigated the circulation pattern in the North Atlantic sector for NAO−events forecasted by ensemble mean at onset time.From Fig.8b,we can also see that the ensemble mean only improves the SLPforecast slightly,because the control forecast hasdoneagood job of predicting the SLP(Fig.5b).
5.Discussion
Besides the above evaluation of the operational forecast performance for NAO onset,there are still many aspects that need to be discussed.
5.1.Forecast performanceof NAOduration
It iswidely known that di f f erent durationsof NAOevents can generate di f f erent inf luences on weather over local and adjacent regions.Therefore,the forecast performance for NAO event duration should be further investigated.Similar to the def inition of NAO duration in reanalysis data,the NAO duration from the TIGGEdataset isalso def ined asthe time interval between the onset day and decay day,but with the products starting from the corresponding skillful forecast time in advance.For example,for the NAO+03 event,which occurred on 5 December 2007,ECMWFcan forecast the onset six days in advance(i.e.,the start time is 1200 UTC 29 November 2007).With the forecast starting at 1200 UTC 29 November 2007,the corresponding onset day is 5 December 2007 and thedecay day is7 December 2007.Thus,theduration of this NAOevent from ECMWFisthreedays.JMA can also forecast the NAOonset with thestart timeof 1200 UTC 29 November 2007.However,dueto itsforecast length limit,it cannot forecast the event decay with six daysin advanceof the onset.Thus,the duration is marked as3 days.But for NCEP and CMA,the onset forecast assessment shows that their skillful forecast time for this event is three days in advance,so that their duration forecasts are assessed with the products starting from 1200 UTC 2 December 2007.The corresponding forecast durations are f ive and four days for NCEPand CMA,respectively.With thismethod,NAOduration forecast assessmentsareshown in bracketsin Table1.
If the NAO event duration derived from forecast products has the same length as that derived from NCEP–NCAR reanalysis data,it is called an accurate prediction of NAO event duration.Similarly,an underestimated(overestimated)duration prediction means that the predicted duration by the model is shorter(longer)than that derived from reanalysis data.For the control forecasts,46 out of 75 NAO+forecasts have an accurate prediction of duration.However,there are 18 NAO+events whose durations are overestimated and 10 NAO+events whose are underestimated.For the 33 NAO−events,15 of them have accurate duration predictions,while there are 13 that are overestimated and four that are underestimated(Table 1).The results show that about half of the forecastsperformwell in NAOduration prediction.Asfor the NAO eventswith durationslonger than two weeks(5 NAO+eventsand 2 NAO−events),theduration forecastshavegood consistency with NCEP–NCAR reanalysis.However,the total duration cannot bepredicted in thesecasesdueto thelimit of forecast length.But,for the NAO events with durations shorter than one week,numerical models tend to overestimatetheir durations.Overall,theforecastingperformancefor NAO+duration is better than that of NAO−,which also indicates that NAO−events are harder to predict than NAO+events.Asfor theensemblemean forecastsof NAOduration,the results are similar to those of the control forecasts(Table 2).
5.2.Performancesensitivity to samplenumber
The mean skillful forecast time for the above is acquired by averaging all NAOcasesfor each operational center.However,therearesomemissing casesin NCEPand CMA.Therefore,in this subsection,only 13 NAO+events and 7 NAO−events that are in common across the four operational centers are compared.Comparing Table 4 with Table 3,it can be seen that their mean skillful forecast times have changed and the sequence for thefour centershasadjusted somewhat.For example,if all thecasesaretaken into consideration,the average skillful forecast time for NAO+onset is 3.82 days for ECMWF,which is the longest among the four centers(Table 3).If only common cases are taken into consideration,JMA performs best for forecasting NAO+onset(Table 4).However,the conclusion that the mean skillful forecast timefor NAOonset isthreeto f ivedaysisstill robust.Moreover,it can also be found that there are three failures among the 28 NAO−onset forecasts,but only one failure among the 52 NAO+predictions(Table 4).This further conf irms that NAO−onset isharder to forecast than NAO+onset.
In addition,sincethe TIGGEproject started in 2006,this study was limited by the available data length,thus possibly limiting the number of cases to establish statistical signif icance.To overcome this limitation,NAO events with a criterion of 0.6 standard deviations are also investigated.With thiscriterion,thereare33NAO+and 20NAO−eventsduring wintertime2006/07 to 2014/15.From theresults(Table5),itcan be seen that the skillful forecast time for NAO onset is three to four days on average,which is similar to the results using the criterion of 1.0 standard deviation.Furthermore,theresultsfor thesecasesalso show thatensemblemean forecasts make little contribution to improving the skillful forecast time for NAO onset.It is also found that NAO−onset is harder to forecast than NAO+onset,since there are seven failuresamong the73 NAO−forecastsand no failuresamong the109 NAO+forecasts.
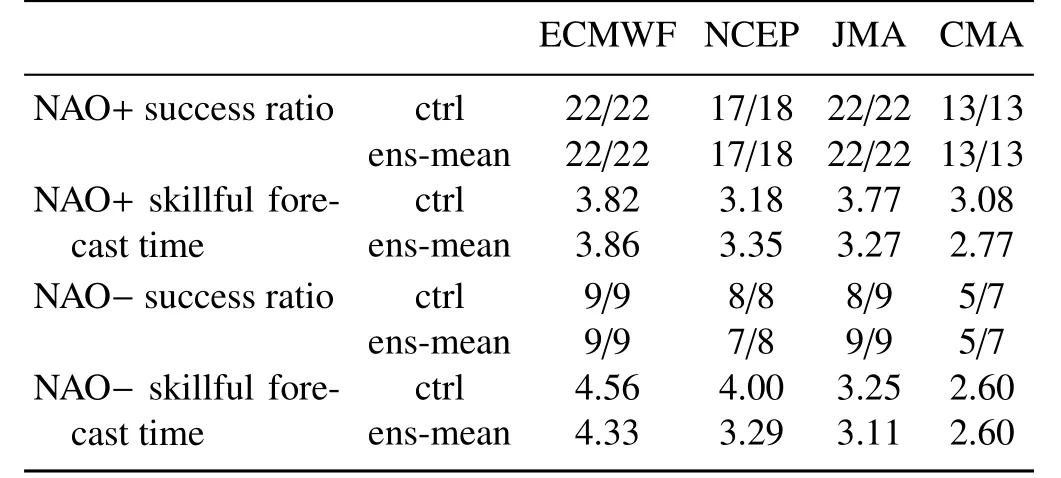
Table 3.Comparison of the NAO event onset forecasts among the four centers.
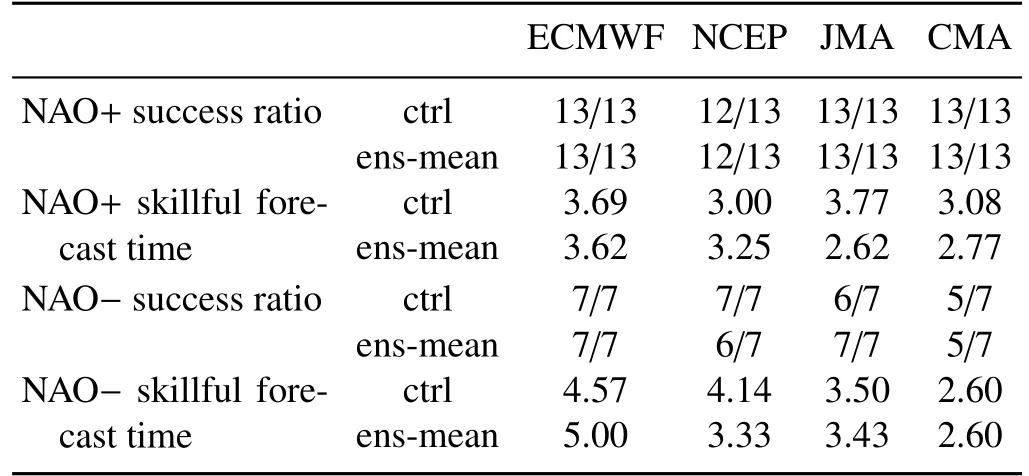
Table4.As in Table 3 but for the 13 NAO+events and 7 NAO−eventscommon across the four centers.
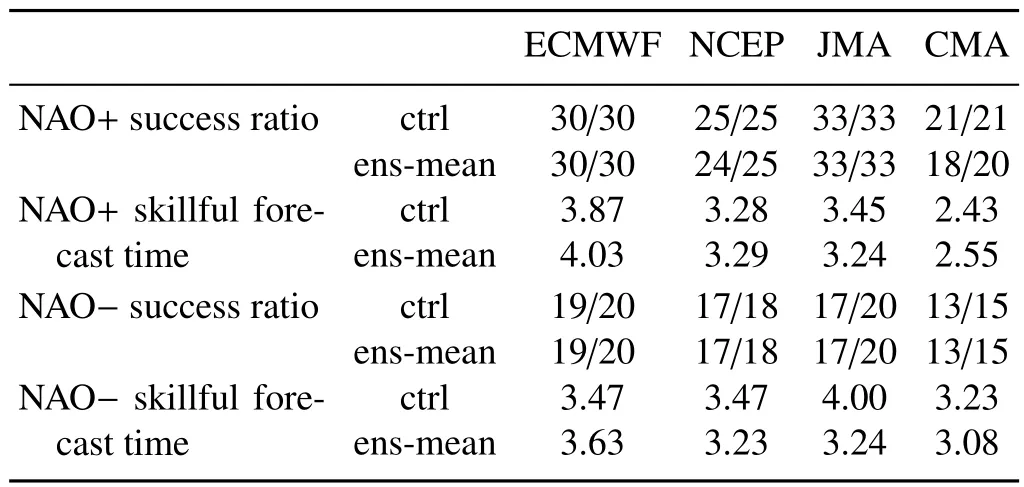
Table5.As in Table 3 but for the NAO events with a threshold of 0.6 standard deviations.
5.3.Limitation of the NAOIfor ensembleforecasting
In thisstudy,thesame NAOIwasused for thecontrol and ensemblemean forecasts,so that their forecast performances could be compared directly.However,as shown above,the NAOI derived from the ensemble mean usually has a small amplitude due to the averaging of ensemble members.This leadsto themeridional dipolemodenot being strong enough to meet the criteria of an NAO event.As a result,the skillful forecast time for NAO onset derived by the ensemble mean is usually short.It is possible that another NAOI index that considers each ensemble member might compensate for this shortcoming.However,thisneedsfurther investigation in futurework.
6.Summary
Utilizing operational forecast products from ECMWF,NCEP,JMA and CMA from 2006 to 2015,we assessed the forecast performance for NAO onset.Twenty-two NAO+events and nine NAO−events were selected during this period with daily NCEP–NCAR SLPreanalysis data based on the NAOIdef ined by Liand Wang(2003).
For theonsetof NAO+events,control forecastsfrom four centers can predict them several days in advance,ranging from oneto nine days.On average,the skillful forecast time of NAO+onset derived by the control forecast is 3.82 days for ECMWF,which isthelongestamong thefour centers,and then 3.77 days,3.18 daysand 3.08 daysfor JMA,NCEPand CMA,respectively.The NAOI derived by the control forecast isclosein valueto that derived by thereanalysisdataon NAOonset day,but with aweaker NAOmode.However,the ACC of the SLPanomalies in the North Atlantic sector between thecontrol forecast and reanalysisexceeds0.60 with a lead time of six days.
A similar evaluation was carried out for the onset of NAO−events.The four centers can predict the onset of NAO−events with a lead time of one to eight days for most cases.However,the failure proportion for NAO−onset prediction is higher than that for NAO+,which indicates that NAO−onset is harder to forecast.On average,the skillful forecast time derived by the control forecast is 4.56,4.00,3.25 and 2.60 days for ECMWF,NCEP,JMA and CMA,respectively.Similarly,the NAO mode derived by the control forecast with skillful forecast timeon NAOonset day isalso somewhat weaker than that from the reanalysis data.However,the ACC of the SLP anomalies in the North Atlantic sector between the control forecast and reanalysis exceeds 0.60,even when thelead timeextendsto eight days.
In addition,the ensemble mean forecast performance regarding NAOonset was also evaluated.The skillful forecast time derived by the ensemble mean is shorter than that derived by the control forecast,for both NAO+and NAO−onset.This is because the NAO mode derived by the ensemble mean is weaker than that derived by the control forecast,which induces the NAO mode derived by the ensemble mean to be insu f fi ciently strong to meet the criteria of an NAO event with the same lead time.However,the ensemble mean can forecast a more accurate circulation pattern in the North Atlantic sector than thecontrol forecast with the same lead time.Moreover,for ensemblemean forecasts,thefailure proportion of NAO−event forecasts is much larger than that of NAO+event forecasts,which also suggests that the onset of NAO−events is harder to forecast than NAO+events.
Inthefollowing,wetry topresentour answerstothethree questionsposed in theintroduction.
(1)For theindividual onset of an NAOevent,operational weather forecasts can predict it three to f ive days in advance.On average,ECMWFhasaskillful forecasttimeof 3.82 days for NAO+onsetand 4.56daysfor NAO−onsetderived by the control forecast,which isthelongest among thefour centers,followed by NCEP,JMA,and then CMA.
(2)From our investigation,the failure proportion for the prediction of NAO−onset ishigher than that of NAO+onset,regardless of whether the control forecast or ensemble forecast isused.Thismay indicatethattheonsetof NAO−events iscomparatively harder to forecast.
(3)When compared with thecontrol forecast,the ensemble forecasts do not improve the skillful forecast time for the onset of NAO events.However,the ensemble mean can produceamoreaccuratecirculation pattern in the North Atlantic sector compared with thecontrol forecast with thesamelead time.
In this work,we have mainly focused on evaluating the forecasting performance with respect to NAO onset,as well as discussing that of the NAO duration.However,during the decay stage of an NAO+event,a blocking in its downstream sector can be triggered(Luo et al.,2015).Moreover,an NAO−event can sometimes be transformed from an NAO+event.The above events are possible sources of extreme weather in Eurasia(Luo et al.,2014).But how far in advancecan weforecast thedecay stageof an NAOevent?Can thistransformation bepredicted in advance?Thesequestionsshould be investigated in future work.
Acknowledgements.The authors are grateful to the two anonymousreviewersfor their helpful commentson thispaper.This study wassupported by the National Natural Science Foundation of China(Grant Nos.41230420 and 41775001).
 Advances in Atmospheric Sciences2019年7期
- Advances in Atmospheric Sciences的其它文章
- Charney’s Model—the Renowned Prototype of Baroclinic Instability—Is Barotropically Unstable As Well
- An Adjoint-Free CNOP–4DVar Hybrid Method for Identifying Sensitive Areasin Targeted Observations:Method Formulation and Preliminary Evaluation
- Striping Noise Analysisand Mitigation for Microwave Temperature Sounder-2 Observations
- LASG Global AGCM with a Two-moment Cloud Microphysics Scheme:Energy Balance and Cloud Radiative Forcing Characteristics
- Climate and Vegetation Driversof Terrestrial Carbon Fluxes:A Global Data Synthesis
- Harnessing Crowdsourced Data and Prevalent Technologiesfor Atmospheric Research