
Striping Noise Analysisand Mitigation for Microwave Temperature Sounder-2 Observations
2019-06-14 12:57:04XiaoleiZOUandXiaoxuTIAN
Advances in Atmospheric Sciences 2019年7期
Xiaolei ZOUand Xiaoxu TIAN
Earth Science System Interdisciplinary Center,University of Maryland,College Park,Maryland 20742,USA
ABSTRACT The Microwave Temperature Sounder(MWTS)-2 has a total of 13 temperature-sounding channels with the capability of observing radiance emissions from near the surface to the stratosphere.Similar to the Advanced Technology Microwave Sounder(ATMS),striping pattern noise,primarily in the cross-track direction,exists in MWTS-2 radiance observations.In this study,an algorithm based on principal component analysis(PCA)combined with ensemble empirical modedecomposition(EEMD)isdescribed and applied to MWTS-2 brightnesstemperatureobservations.Itisarguably necessary to smooth the f irst three principal component(PC)coe f fi cients by removing the f irst four intrinsic mode functions(IMFs)using the EEMD method(denoted as PC3/IMF4).After the PC3/IMF4 noisemitigation,thestriping pattern noiseise f f ectively removed from thebrightnesstemperatureobservations.Thenoiselevel in MWTS-2 observationsissignif icantly higher than that detected in ATMSobservations.In May 2014,the scanning prof ile of MWTS-2 was adjusted from varying-speed scanning to constantspeed scanning.Theimpact on striping noiselevelsbrought on by thisscan prof ilechangeisalso analyzed here.Thestriping noise in brightness temperature observations worsened after the prof ile change.Regardless of the scan prof ile change,the striping noise mitigation method reported in thisstudy can more or less suppress the noise levels in MWTS-2 observations.
Key words:MWTS-2,striping noise,temperaturesounding,microwaveradiometry
1.Introduction
FengYun(FY)-3C was successfully launched into a sunsynchronous orbit on 23 September 2013.It is the third satellite in the new series of the Chinese FY polar-orbiting f leet.The FY-3 mission aimsat enhancing numerical weather prediction and climate research with observations,monitoring large-scale natural disasters,and providing meteorological information for aviation and navigation purposes.The f irst and second satellites of this series,i.e.,FY-3A and FY-3B,were launched into their orbits on 27 May 2008 and 5 November 2010,respectively.The local equator crossing times of FY-3A,-3B,and-3Care 1000,1400,and 2200,respectively.The Microwave Temperature Sounder(MWTS)-2 is one of the 11 sensors onboard FY-3C.The MWTS-2 contains 13 channels whose central frequencies range from 50.3 GHz to 57.6 GHz corresponding to the Advanced Technology Microwave Sounder(ATMS)channels 3–15.Table 1 lists the central frequencies and peak weighting function pressures of the MWTS-2 channels.As a cross-track microwave radiometer,the MWTS-2 has 90 f ields-of-view(FOVs)on each scanline,and theswath widthof the MWTS-2 is2600 km(Tian et al.,2018).
During 12–18 May 2014,the scan prof ile of the FY-3C MWTS-2 waschanged.Beforethisscan prof ilechange,each scan cycle took 2.67 seconds.The antenna of the MWTS-2 scans at cold space,a warm target,and the earth scene with the same integration time of 0.018 s and accelerates during the time in between.After the prof ile change,the MWTS-2 kept a constant speed during each entire scan cycle of 5.23 s.MWTS-2 data from 5–11 March 2014 and 29 May to 4 June2014 areused in thisstudy.Thereare14–15 swathsin a single day.Each swath contains around 2400 and 1200 scan linesbeforeand after thescan prof ilechange,respectively.
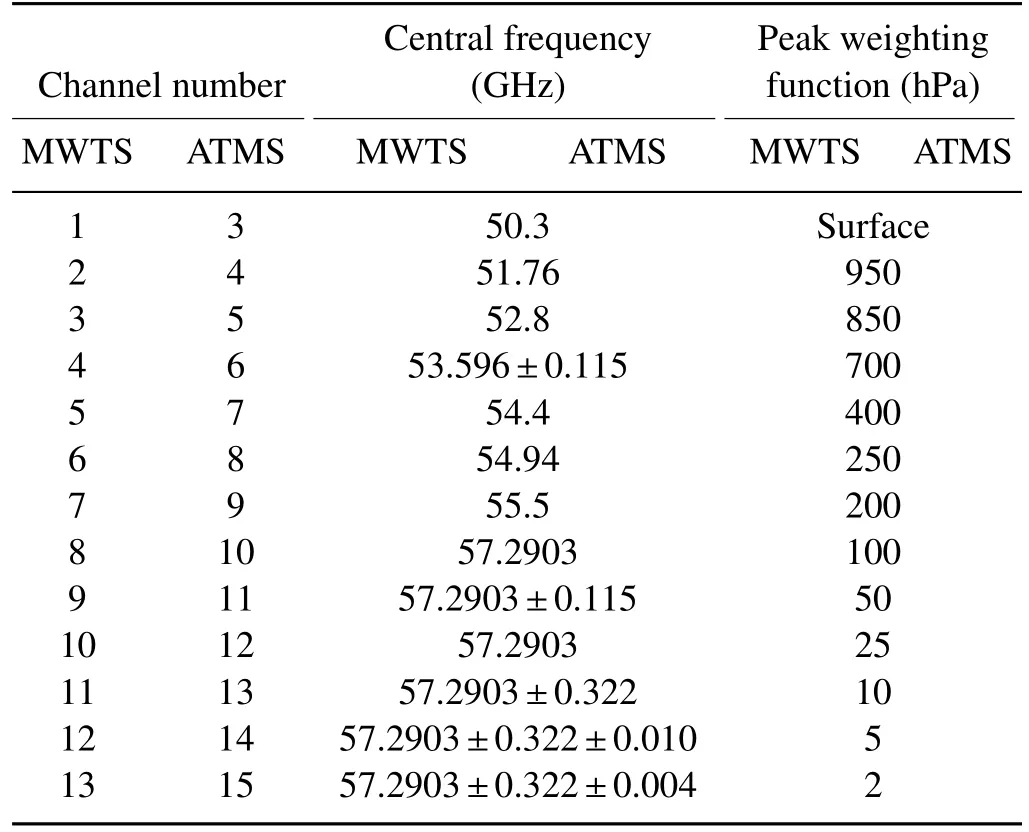
Table 1.Central frequencies of FY-3C MWTS and corresponding ATMSchannels.
Numerouspreviousstudieshavedemonstrated thesignificance of observations from temperature sounders such as the MWTS-2 and ATMS.Tian and Zou(2016)described an improved temperature retrieval algorithm for temperature sounder observations and applied the results to hurricane cases to analyze three-dimensional warm-core structures.Tian and Zou(2018)examined thetemporal evolutions of thermal structures in the 2017 Hurricanes Harvey,Irma,and Maria using retrievals from temperature sounder observations.Zou and Tian(2018)developed a global positioning system radio occultation-based temperature retrieval algorithm with limb-corrected and remapped ATMS observations.As MWTS-2 has similar channel conf igurations,these recently proposed temperature retrieval algorithms are all readily applicableto MWTS-2observations.Therewasasignif icant reduction in the random noise level in the results.Temperature sounder observations have also been shown to have positive impacts on hurricane track and intensity forecasts(Zou et al.,2013;Li et al.,2016;Li and Liu,2016)as well as on global weather forecast skills(Eyre et al.,1993;Andersson et al.,1994;Derber and Wu,1998).Tian et al.(2018)showed that MWTS-2 observations,after limb correction,could beused to monitor tropical cyclones.The nonrandom,striping pattern noise found in ATMSobservations may possibly be due to the 1/f noise in its receiver(Bormann et al.,2013;Qin et al.,2013).Liet al.(2016)reported slightly higher analysis and forecast errors when assimilating MWTS-2 observations due to the striping noise.Zou et al.(2017)described a principal component analysis(PCA)combined with Ensemble Empirical Mode Decomposition(EEMD)striping noise mitigation method for ATMSthat is applicable to all temperature-sounding channels as well as window channels.Striping issues have also been found in the predecessors of MWTS-2,the MWTS onboard FY-3B,aswell asthe ATMSonboard therecently launched National Oceanic and Atmospheric Administration(NOAA-20)satellite(Liand Zou,2015;Zou and Tian,2019).
In this study,the PCA/EEMD striping noise mitigation is adopted and applied to MWTS-2 observations before and after the scan prof ile change to analyze the MWTS-2 striping noisecharacteristics.Thesamemitigation method can be readily applicable to other instruments,including the previous MWTSon previous FY-3 satellite series.
2.Striping noise mitigation algorithm
The data matrix composed of MWTS-2 brightness temperaturescan beexpressed as
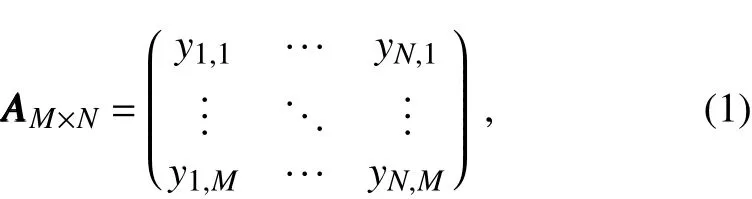
where yk,iis the brightness temperature at FOV position i of the k th scan line.In this study,each data sample consists of 200 scan lines.M denotes the total number of FOVs in one scan line.In thecaseof MWTS-2,thisisequal to 90.N isthe total number of scan linesin theanalysissample.Thematrix AAAM×Ncan bedecomposed into M=90 PC modes,

wherethe j thmodeistheproductof the PCcoe f fi cient uuujand the PC component eeej.The PC coe f fi cient describes alongtrack features while the PC component is a function of the FOV position(Qin et al.,2013;Zou et al.,2017).For each individual observation pixel,Eq.(2)can also be written as
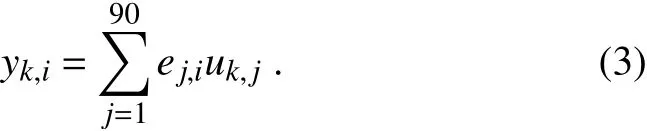
An EEMD method(Wu and Huang,2009)can then be employed to remove the striping noise in the decomposed MWTS-2 observations,i.e.,yk,i.The smoothed brightness temperature,¯yEEMD,k,i,can then be calculated by removing thef irst threeintrinsic modefunctions(IMFs)of thef irst PC,uk,1,asfollows:
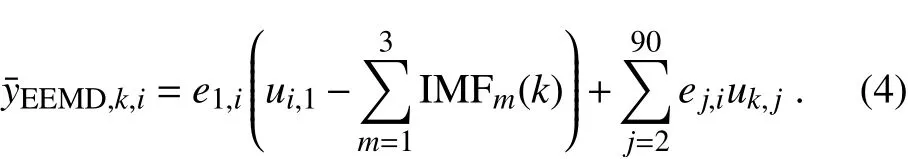
The EEMD-smoothed PC coe f fi cient can then be expressed as uEEMD,k,1=uk,1−Lm=1IMFm(k),where L denotes thenumber of IMFs to be removed.
The spectra for the f irst six IMFs of the f irst four PCcoe f fi cients at channel 8 for 1 May 2014 are shown in Fig.1.Peak magnitudes of the f irst four IMFs are at the frequencies greater than 10−2Hz.The amplitude of an individual IMF decreases with PC coe f fi cient sequence,i.e.,all IMFs havethelargestamplitudesfor thef irst PCcoe f fi cient and the smallest amplitudes for the fourth PC coe f fi cient.This is in accordancewith thefact that thef irst PCcomponent explains the majority of variances.The peak magnitudes of the IMFs of the f irst three PC coe f fi cients start to increase noticeably after thefourth IMF.For example,thepeak magnitudesof the f ifth IMFs are∼10 times greater than the peak magnitudes of the f irst four IMFs.The absolute majority of the variances in observations from signals such as weather signals,instrument scan patterns,as well as striping noise are accounted for by the f irst three principal components(Qin et al.,2013;Zou et al.,2014).For the fourth PC coe f fi cient,there is no clear di f f erence in the peak magnitudes of the six IMFs.We thus choose to remove the f irst four IMFs of the f irst three PCcoe f fi cients,denoted as PC3/IMF4 for brevity.The distribution of the f irst f ive PC modes(i.e.,eigenvectors)for the 47th MWTS-2 data sample(k=47,each sample includes 200 scan lines)on 1 May 2014 is displayed in Fig.2.Note that the eigenvectors are functions of FOV positions.All PC modes oscillate around zero,and their values are close in scale.Compared with other PC modes,the f irst PC mode changes little.This is reasonable because the f irst PC mode represents the major cross-track scan features of the MWTS-2 while the other PC modes capture weather signals.The numbersof extremafor thesecond,third,fourth,and f ifth PC modes are two,three,four,and f ive,respectively.Figure 3 shows the spatial distributions of the f irst,second,and third PC components,i.e.,the products of PC coe f fi cients and the corresponding PC modes.The magnitude of the f irst PC component is the greatest,comparable in magnitude to the brightnesstemperature.Thesecond and third PCcomponents have magnitudes of the same order.The PC components beforeand after smoothing arecalculated asthe PCcoe f fi cients with and without the f irst four IMFs removed,respectively.Beforethenoisemitigation,visiblestriping noiseexistsin all thethree PCcomponents.After smoothing,thestripingnoise is removed while large-scale features in the along-track and cross-track directions remain unchanged.
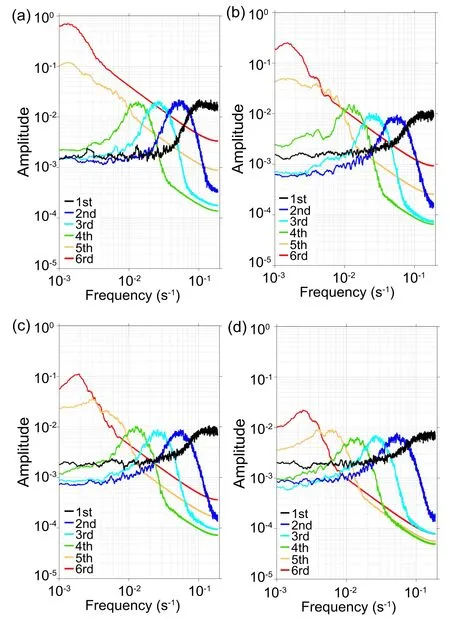
Fig.1.Fourier spectrafor thef irstsix IMFsof the(a)f irst,(b)second,(c)third,and(d)fourth PCcoe f fi cientsat channel 8 for MWTS-2 observationson 1 May 2014.
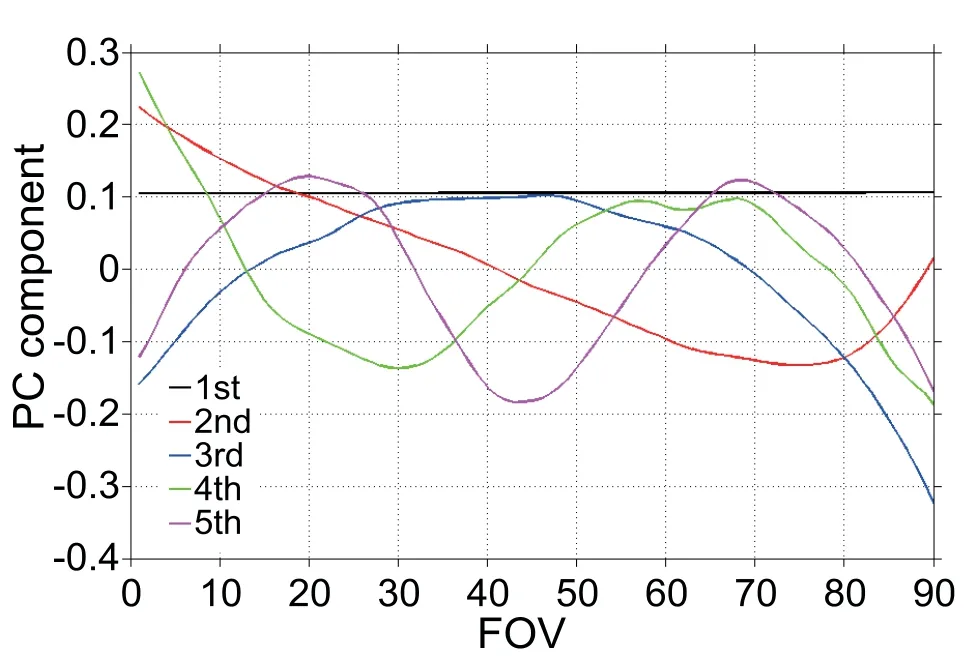
Fig.2.Spatial distributions of the f irst f ive PC modes(i.e.,eigenvectors)for the 47th MWTS-2 data sample(k=47,each sampleincludes200 scan lines)on 1 May 2014.
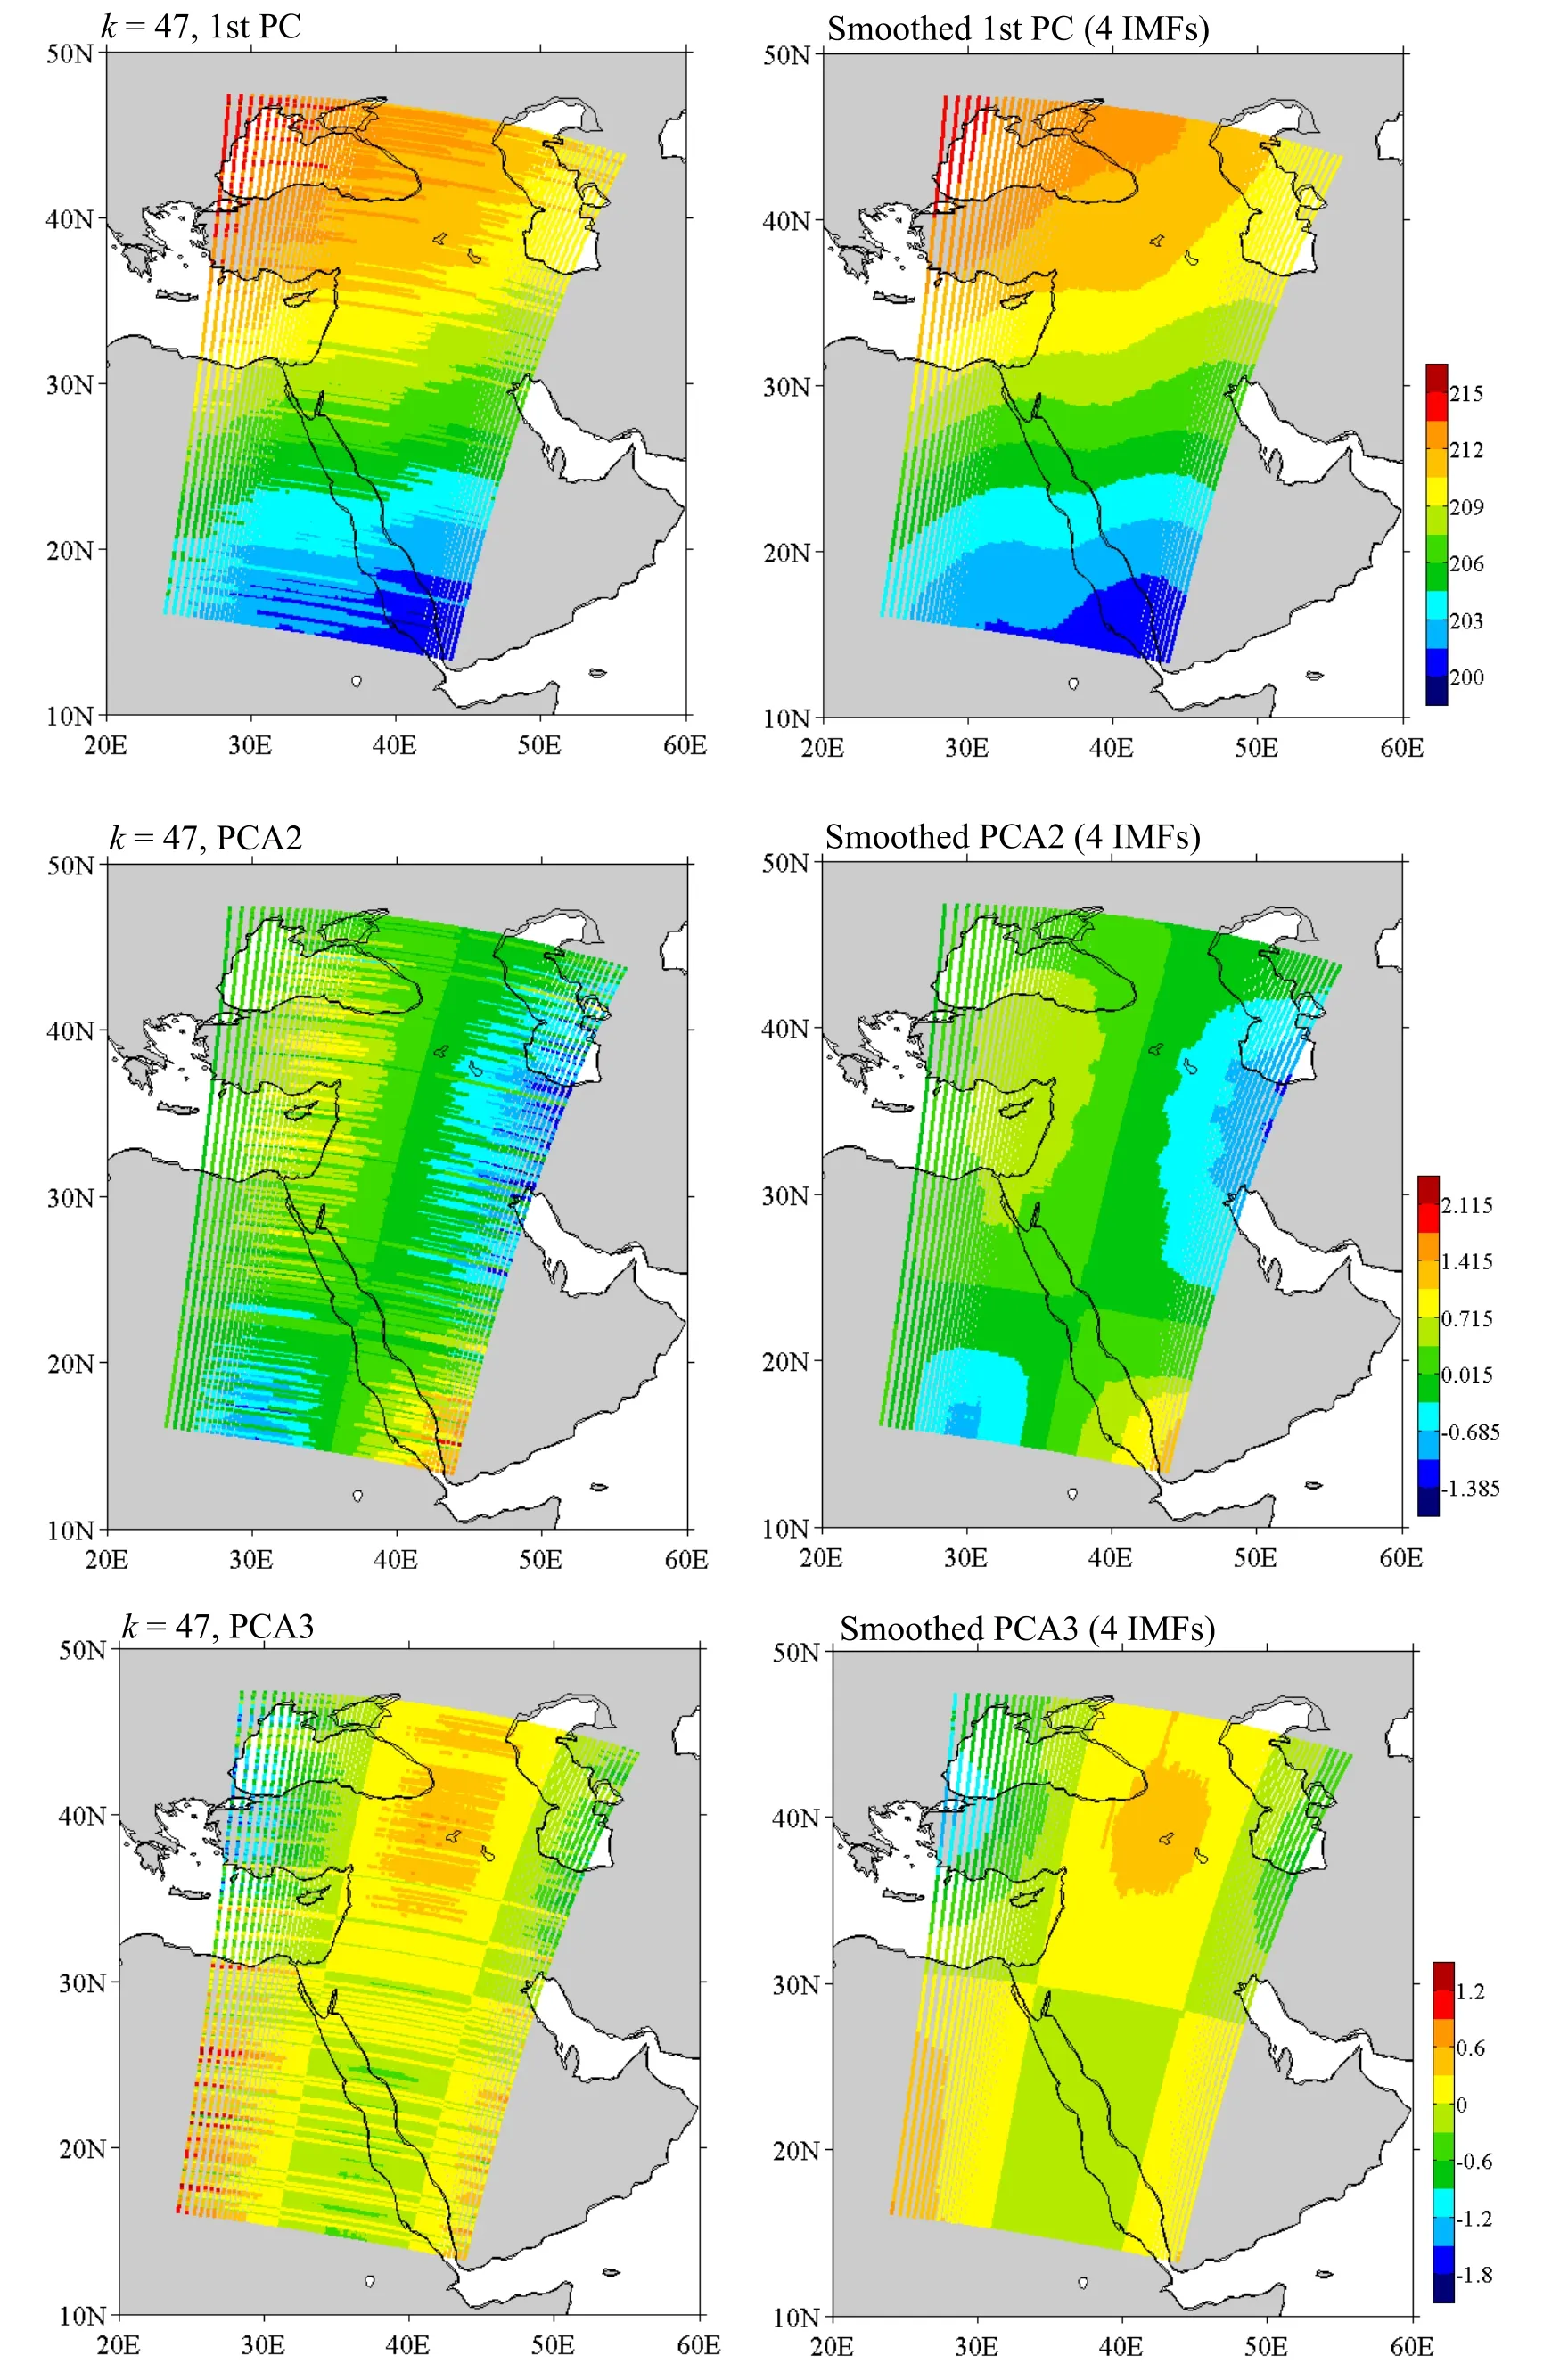
Fig.3.Spatial distributions of the f irst three PCA components(i.e.,the product of an eigenvalue and an eigenvector)before(left panels)and after(right panels)striping noise mitigation for the 47th data sample(k=47,each sampleincludes200 scan lines)on 1 May 2014.
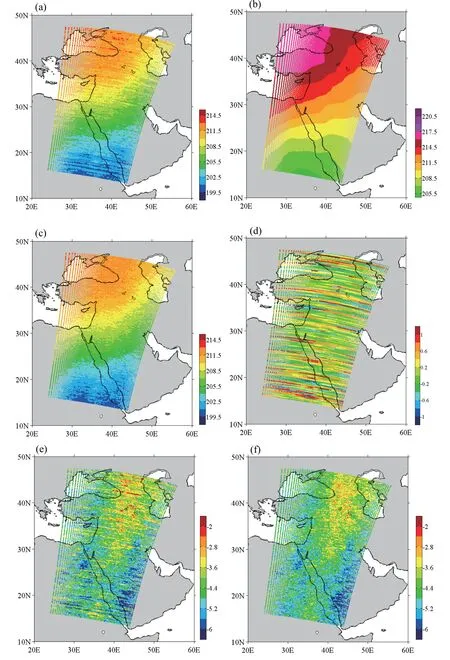
Fig.4.Spatial distributions of MWTS-2 channel 8(a)observed,(b)simulated,and(c)smoothed brightness temperatures(units:K)for the 47th data sample(k=47,each sample includes 200 scan lines)on 1 May 2014.The f irst four IMFs of thef irst three PCcoe f fi cientsare removed in(c).(d)Di f f erencesbetween(a)and(c).(e)Di f f erencesbetween(a)and(b).(f)Di f f erencesbetween(c)and(b).
The Community Radiative Transfer Model isused in this study to simulate MWTS-2 brightness temperatures using the 6-h forecast f ield generated from the National Centers for Environmental Prediction Global Forecast System as the background.This was done to bring out the striping noise in observed brightnesstemperatures.Thespatial distributionsof the observed(O)and simulated(B)brightness temperatures on 1 May 2014 are displayed in Figs.4a and b.The striping noise can be easily identif ied from the observed brightness temperature f ield.Figure 4c shows the spatial distribution after the PC3/IMF4 striping noise mitigation.Compared with Fig.4a,no striping noise is found in the distribution of PC3/IMF4-smoothed brightness temperatures.The spatial distributionsof the di f f erencesbetween observationsand simulations(O−B)beforeand after the PC3/IMF4 noisemitigation are shown in Figs.4e and f,respectively.Thestriping noise pattern clearly seen in Fig.4e is e f f ectively removed after PC3/IMF4 smoothing.Figure 5 shows the global distributions of(O−B)before and after the PC3/IMF4 striping noise mitigation on 1 May.It is clear that after smoothing,the visible striping noise is e f f ectively removed while other weather-related features are not altered.The noise removed isshown in Fig.5c.
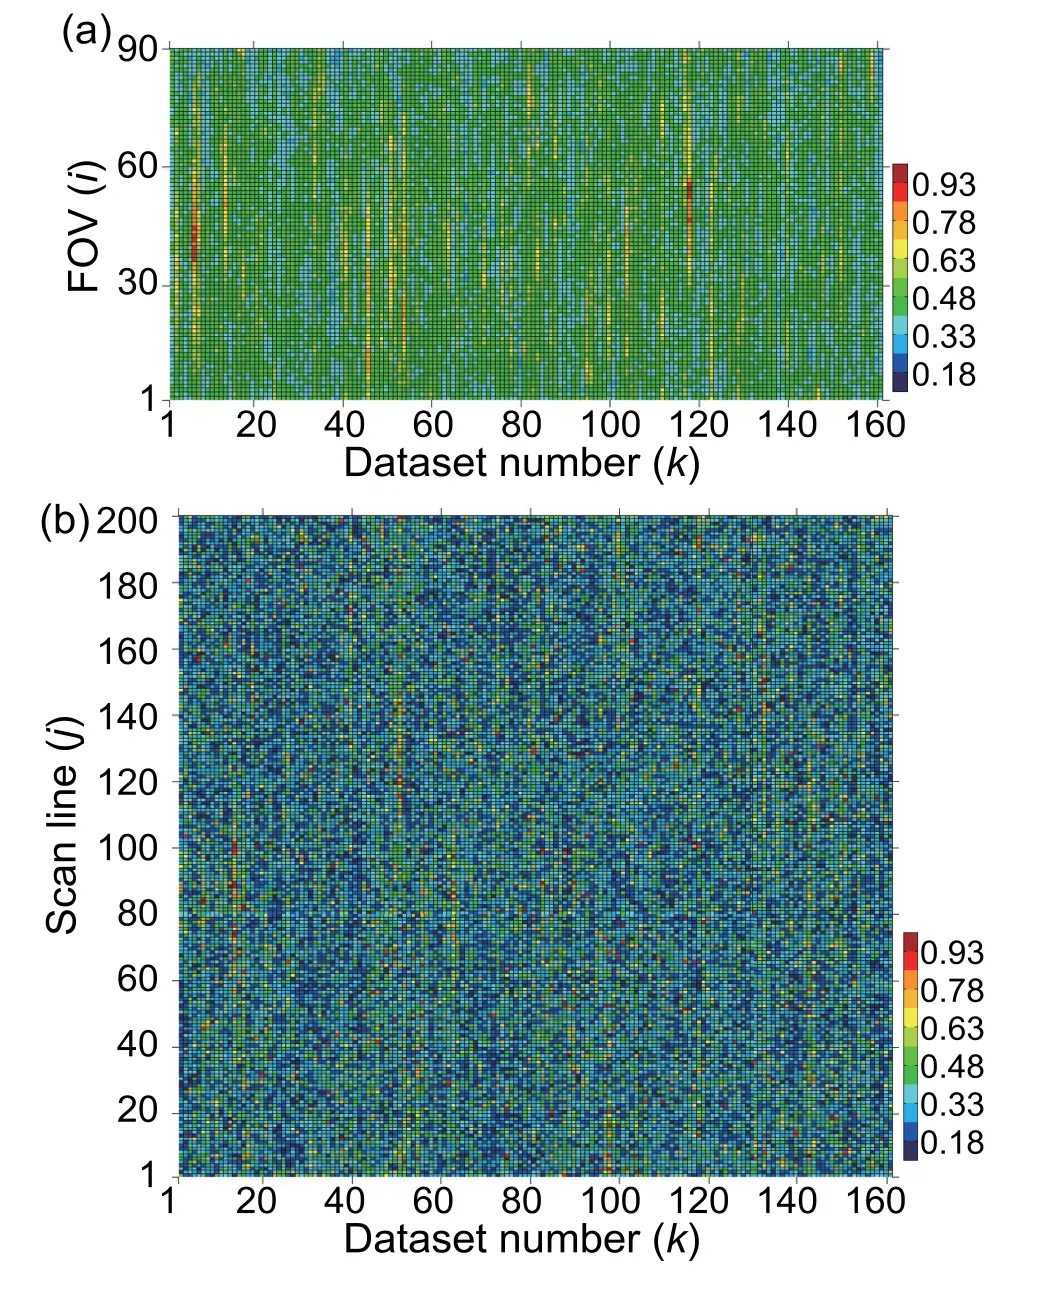
Fig.6.Variationsin(a)along-track variancesfor channel 8 asa functionof thesamplegroup number and FOV(i)and(b)crosstrack variancesasafunction of datasetnumber(k)and scan line(j)before striping noise mitigation on 1 May 2014.The total number of scan linesin each dataset is200.Thetotal number of datasets for both the ascending and descending nodeson 1 May is 162.
3.Striping index calculated for FY-3C MWTS-2 global data
To quantitatively validatethee f f ectivenessof thestriping noise mitigation on FY-3C MWTS observations,a striping index as a measure of uniform accuracy for brightness temperature is def ined here.The Striping Index(SI)for a single day at a given channel iscalculated as

whereσ2along(k,i)andσ2cross(k,j)are along-track and acrosstrack variances,respectively.The variances are calculated as follows:
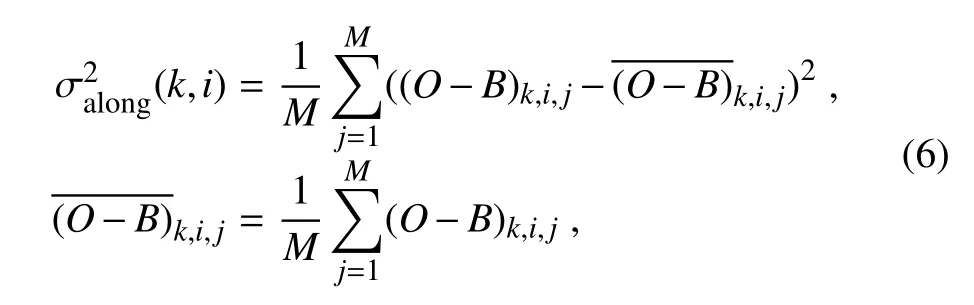
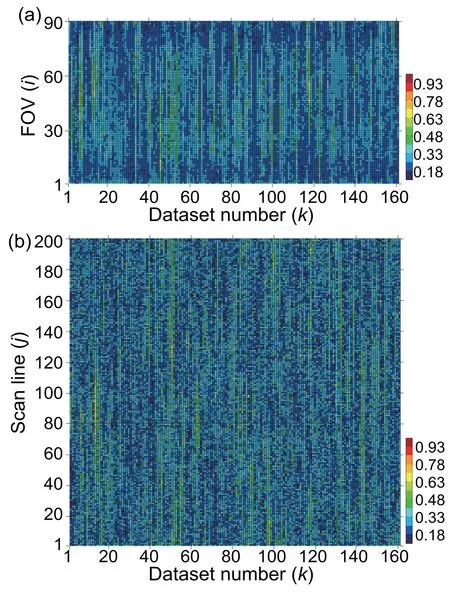
Fig.7.As in Fig.6 except for datawith striping noise mitigated(PC3/IMF4).The mean value of the striping index at channel 8 is0.975.
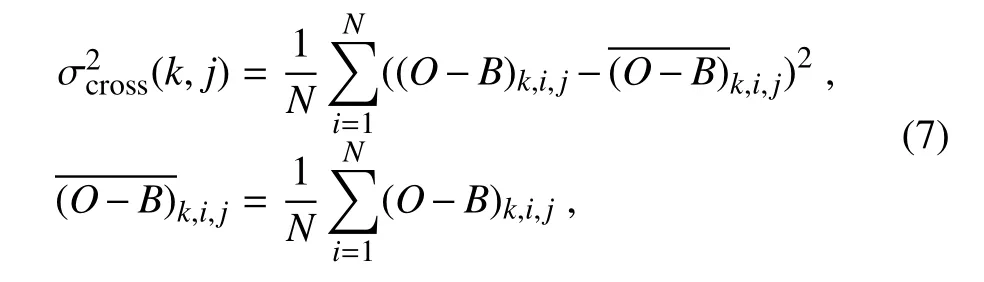
where(O−B)k,i,jstands for the(O−B)di f f erence at the i th FOV on the j th scan linewithin the k th datasample,N isthe total number of FOVs,M is the number of scan lines within each of the datasets for the variance calculation,and K is thetotal number of data samples.In the calculation,N=90,M=200,and K isaround 160.Thesmoothed brightnesstemperatures will be denoted as Osmoothfor SIs after noise mitigation.
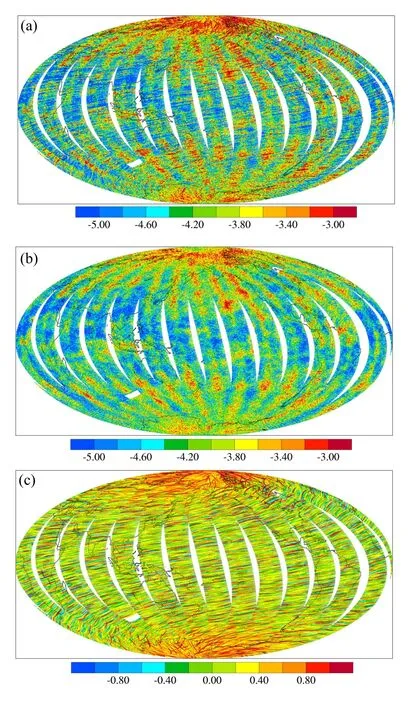
Fig.8.Global distributions of channel 8(a)O−B and(b)differences between smoothed brightness temperatures removed on 30 May 2014 on theascending node.The f irst three IMFsof thef irst three PCcoe f fi cients are removed for noise mitigation.(c)The removed striping noise.Units:K.
Figure 6 shows the variations in along-track variances(k,i)and cross-track variances(k,j)calculated using brightness temperatures before striping noise mitigation on 1 May 2014.The distribution of the along-track variance has line patterns for adjacent FOVs within some data samples due to cross-track correlations.By comparison,the distribution of the cross-track variance appears to be more random.The along-track variances generally have larger values than the cross-track variances,conf irming that striping noise adds to along-track variances.The striping index calculated using Eq.(5)for Fig.6 is 1.3513.Figure 7 shows variationsin along-track variancesσ2along(k,i)and cross-track variancesσ2cross(k,j)after stripingnoisemitigation.Themagnitudesof thealong-track variancesaresignif icantly reduced while those of the cross-track variances change very little.The striping index for Fig.7 isnow reduced to 0.975.
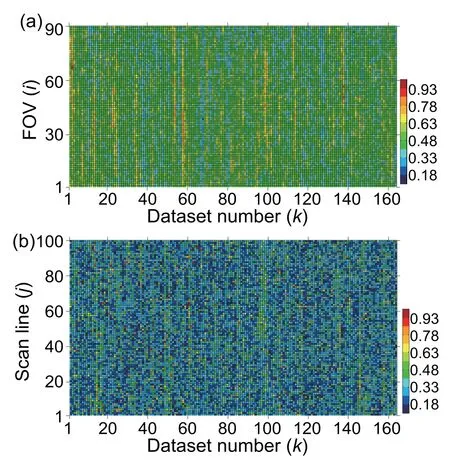
Fig.9.Variations in(a)along-track variances as a function of thesample group number and FOV(i)and(b)cross-track variancesasafunctionof datasetnumber(k)and scan line(j)before striping noise mitigation on 30 May 2014.The total number of scan lines in each dataset is 100.The total number of datasets for both the ascending and descending nodes on 30 May is164.(c)Variations in striping index as a function of dataset number(k).The dashed line shows the mean striping index(equal to 1.5146).

Fig.10.As in Fig.9 except for data with striping noise mitigated(3PC/3IMF).The mean value of the striping index is 1.013.
4.Impact of prof ile change on striping noise
During the period 12–18 May,a scan prof ile change was implemented on the MWTS-2 instrument,prior to which it took 2.67 s to f inish one scan cycle.Since the scan prof ile change,the MWTS-2 scans at a constant pace of 5.23 s per scan cycle.The striping noise resultsfrom 29 May to 4 June 2014 are shown to illustrate the inf luence of the scan prof ile change.Similar to Fig.5,Fig.8 showstheglobal distributions of(O−B)before and after striping noise mitigation on 30 May 2014.After thescan prof ilechange,thestriping noisein MWTS-2observationsissimilar inmagnitudeasthosebefore the scan prof ile change(Fig.5).The along-track and crosstrack variances of the observations on 30 May 2014 before and after destriping are shown in Figs.9 and 10,respectively.Comparing theresultsin Fig.9 with thosein Fig.6(1 May),thealong-track variancesarevisibly greater,whileno significant increase can be seen in the cross-track variances.The SIfor MWTS-2 observationsafter thescan prof ilechangeincreased from 1.35(Fig.6)to 1.51(Fig.9).After destriping,the SIin Fig.10 drops to 1.01,which is still high compared withthedestriped observationsbeforethescan prof ilechange(0.98 in Fig.7).
Figure11 showsthevariationsin SIsof MWTS-2 channel 8 with respect to date during two one-week periods.Alongtrack variances increased after the scan prof ile change while cross-track variances remained about the same,suggesting that the FY-3CMWTS-2 striping problembecameeven more severe after the scan prof ile change.The along-track variationsafter striping noise mitigation were noticeably reduced.The cross-track variations also decreased slightly due to the smoothing within the second and third PC coe f fi cients.The SIindex hovers around 1.0 after noise mitigation,indicating thee f f ectivenessof thenoisemitigationreported inthisstudy.
5.Summary and conclusions
Striping pattern noise in the along-track direction exists in MWTS-2 observations.In thisstudy,the PCA/EEMD method described by Zou et al.(2017)is applied to MWTS-2 brightness temperature observations to detect and mitigate thestriping noise.Striping noiseexistsin notonly thef irst PC coe f fi cient but also in the second and third PC coe f fi cients.
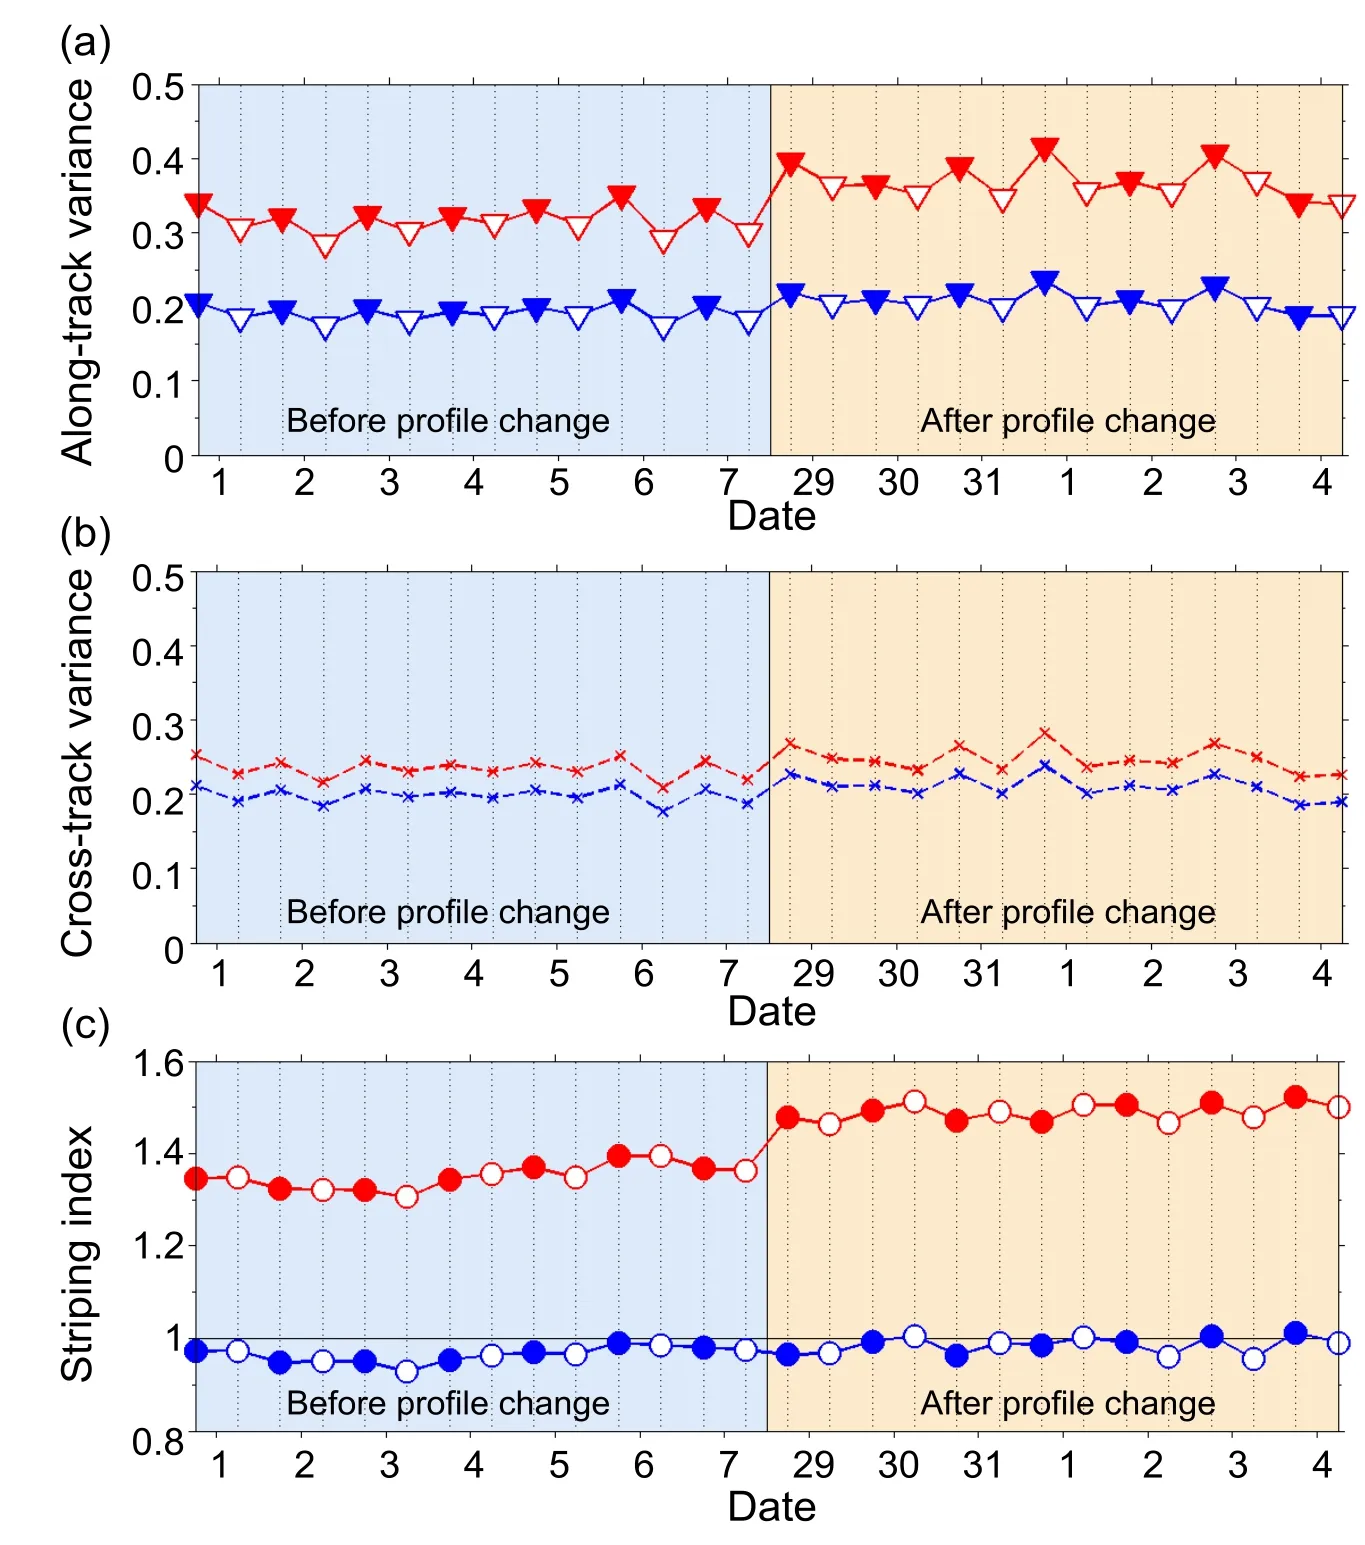
Fig.11.(a)Along-track variances,(b)cross-track variances,and(c)striping index at channel 8 during 1–7 May 2014 and 29 May to 4 June 2014 before(red)and after(blue)noise mitigation.Ascending and descending nodes are shown as open and solid markers,respectively.
The magnitude of the striping noise in the temperaturesounding channels can be as great as 1 K,which is much greater than the noise level in ATMS observations(Qin et al.,2013).For thepurposeof aquantitativeanalysis,aglobal striping index is def ined based on the variancesof brightness temperature observations in both along-track and cross-track directions.This index shows that,because of the existing striping noise,the along-track varianceissignif icantly larger than thevariancein thecross-track direction.After noisemitigation,the global striping index decreased dramatically to a value of one,suggesting the e f f ectiveness of the noise mitigation algorithm reported in this study.During 12–18 May 2014,ascan prof ilechangewasimplemented.After thescan prof ile change,the antenna on the MWTS-2 started to rotate at a constant pace.Striping noise in the observations for a two-week period after the scan prof ile change reveals that the noise level became even higher after the prof ile change.From another perspective,this suggests that the root cause of thestriping noise in microwavesensors does not liein the scanning pace.
Acknowledgements. This research was supported by the National Key R&D Program(Grant No.2018YFC1506702).The authorsthank the FengYun Satellite Data Center(http://satellite.nsmc.org.cn)for providing the MWTS-2 observations.The authors also thank Dr.Yuan MA for conducting some of this work during her Ph.D.studies and the anonymous reviewers for their time and contributions to this study.The software developed to perform the calculations in this study is available by contacting the corresponding author at xzou1@umd.edu.
 Advances in Atmospheric Sciences2019年7期
- Advances in Atmospheric Sciences的其它文章
- Evaluation of the Forecast Performance for North Atlantic Oscillation Onset
- Charney’s Model—the Renowned Prototype of Baroclinic Instability—Is Barotropically Unstable As Well
- An Adjoint-Free CNOP–4DVar Hybrid Method for Identifying Sensitive Areasin Targeted Observations:Method Formulation and Preliminary Evaluation
- LASG Global AGCM with a Two-moment Cloud Microphysics Scheme:Energy Balance and Cloud Radiative Forcing Characteristics
- Climate and Vegetation Driversof Terrestrial Carbon Fluxes:A Global Data Synthesis
- Harnessing Crowdsourced Data and Prevalent Technologiesfor Atmospheric Research