
Estimating blue marlin(Makaira nigricans)sustainable yield in the Indian Ocean using a data-poor approach
2019-05-18 08:41YuweiFanZheGengJiangfengZhuXiaojieDaiKindongRichard
Aquaculture and Fisheries 2019年3期
Yuwei Fan,Zhe Geng,Jiangfeng Zhu,Xiaojie Dai,∗,Kindong Richard
a College of Marine Sciences,Shanghai Ocean University,Shanghai,201306,China
b Key Laboratory of Oceanic Fisheries Exploration,Shanghai Ocean University,Ministry of Agriculture,Shanghai,201306,China
c National Engineering Research Center for Oceanic Fisheries,Shanghai,201306,China
d Scientif ic Observing and Experimental Station of Oceanic Fisheries Resources and Environment,Ministry of Agriculture,Shanghai,201306,China
Keywords:Blue marlin Data-poor approach Stock assessment Indian Ocean
A B S T R A C T
1.Introduction
Billf ishes,excluding swordf ish,are typically not the primary targets of large-scale f isheries,which have historically led to a lack of targeted monitoring efforts(Punt,Su,&Sun,2015).This is also true for the tuna f isheries in the Indian Ocean where the majority of billf ishes are taken as bycatch(IOTC-WPB14,2016).Estimates of catch for billf ishes are likely less reliable than those for tunas because a greater fraction of the catch is taken in recreational f isheries or as bycatch which tend to be less well sampled than commercial f isheries(Punt et al.,2015).This poses a signif icant challenge for the assessment and management of billf ishes.For example,the sailf ish and shortbill spearf ish in the Indian Ocean are seldom the primary focus for data collection efforts and it is difficult to assess them using conventional stock assessment models.Thus,the Indian Ocean Tuna Commission(IOTC)recommended that data-poor approaches be applied to billf ish species(e.g.sailf ish)in the Indian Ocean(IOTC-WPB14,2016).
Data-poor approaches have attracted worldwide attentions in the recent years.In 2006,The United States Congress introduced annual catch limits(ACLs)to limit catch and trigger measures to ensure accountability(Newman,Berkson,&Suatoni,2015).Subsequently,more than 16 methods were adopted in establishing catch limits for datalimited f isheries(Newman et al.,2015).“Data-poor Approach for Fishery”was listed as one of the four themes by World Stock Assessment Method Conference in 2013(Cadrin&Dickey-Collas,2015).The ideal approach to apply a new data poor method is to evaluate its robustness to various assumptions by simulation testing(Arnold&Heppell,2015).However,simulation testing is time consuming and in practice many stock assessments are being directly conducted without simulation testing for the assessment method,and key uncertainties are addressed by running plausible sensitivity analyses(Deroba et al.,2015).Applying a data poor method to a stock without any testing might be risky when management advices are to be developed.For example,the data poor method was recommended for Indian Ocean sailf ish(IOTC-WPB14,2016),however,there was lack of capacity and resources to conduct simulation testing within the Working Party on Billf ish(WPB).One possible solution to this is to apply data poor methods that have been approved to be reliable for another stock with similar biology and f ishery history.The Indian Ocean blue marlin(Makaira nigricans)seemed a possible stock to satisfy this exercise.
Data-poor methods include those that set acceptable biological catch(e.g.,Depletion-Based Stock Reduction Analysis or DB-SRA;Dick&MacCall,2011)and those that estimate sustainable yield(e.g.,Depletion-Corrected Average Catch or DCAC;MacCall,2009).DCAC is a common catch-based method stemming from the work of Restrepo et al.(1998)and relies on catch data to estimate sustainable yield.The uncertainty of estimates with respect to key model parameters can be quantif ied by running Monte Carlo simulation.This method wasmainly applied to some American f isheries,such as f isheries managed by the South Atlantic Fishery Management Council and the Mid-Atlantic Fishery Management Council(Carruthers et al.,2014).This method has also been used for the U.S.west coast groundf ish(Wetzel&Punt,2015).
Billf ishes(the collective name for marlins,sailf ishes,and shortbill Spearf ishes)are large,swiftly swimming,epipelagic,apex ocean predators(Habegger,2014).Their morphological taxonomy was reviewed by Nakamura(1985)and a new genetics-based taxonomy given by Collette,Mcdowell,and Graves(2006).They are surface dwellers and distribute in shallower water(near-shore)(Young et al.,2011).During the summer,they move into productive warm-temperate waters for heavy feeding,and in autumn,they move back to tropical waters for overwintering and spawning(Chiang et al.,2006).In Indian Ocean,blue marlin is a billf ish species with medium f ishery data.The blue marlin occursthroughout tropical and subtropical watersof the Pacif ic,Atlantic and Indian Ocean(Nakamura,1985).They are a bycatch species that require catch-effort statistics for stock assessments(Goodyear&Phillip,2016).The Indian Ocean blue marlin was successfully assessed by IOTCWPB using state-space Bayesian production model(BSP-SS;IOTC-WPB14,2016)and management advice was developed.Thus,our intention is to choose a candidate data poor method to Indian Ocean blue marlin and evaluate its reliability in developing management quantity.
In this study,we applied the DCAC to Indian Ocean blue marlin to estimate sustainable yield(Ysust)and compared it with maximum sustainable yield(MSY)estimated by the state-space Bayesian production model.Stock assessment methods relying on different data and assumptions often lead to differences in estimates of management quantities.However,if the estimate of Ysustby DCAC is lower than MSY by BSP-SS,the Ysustcan be regarded as precautionary management quantity and it suggests that the DCAC be a reliable data poor method in developing Ysustbased management advice.
2.Material and methods
2.1.Data resources
Blue marlin is a bycatch species of tuna longline and gillnets f leets operating in the Indian Ocean and it is largely seen as a non-target species of industrial and artisanal f isheries.The main data required for DCACmethod is total catch.In recent years,the f leet of Taiwan,China(longline)accounted for around 33%of total catches of blue marlin;and the f leet of Indonesia(fresh longline)and Pakistan(gillnet)accounted for around 28%and 14%of total catches,respectively(IOTCWPB14,2016).Longline catches account for around 74%of total catches,followed by gillnets(23%),with remaining catches recorded under troll and handline f isheries(IOTC-WPB14,2016).In this study,the combined catch data and two CPUE indexes from Japan and Taiwan,China of the blue marlin to be used by DCACwas downloaded from IOTC website(www.iotc.org)and time series of catch is 1950-2015(Fig.1).
2.2.Estimation of natural mortality
Natural mortality rate(M)was obtained by the Pauly(1980)'s formula with growth parameter k,gradual length(cm)and annual average surface temperature T,as shown below:

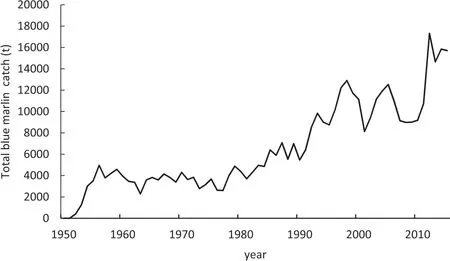
Fig.1.Combined blue marlin catches in the IOTCdatabase(1950-2015).
2.3.Estimation methods
2.3.1.Basic equation of DCAC
Normally,DCACrelied on the annual catch data,the relative decline in abundance(Δ),the natural mortality,and the ratio of FMSY(f ishing mortality rate corresponding to MSY)to M(MacCall,2009).Δcould be calculated by the relative reduction from the f irst year(FYR)to the last year(LYR)of the catch time series and its computation formula is as follows:

The DCACprovides an estimate of the yield(Ysust)that would keep the stock sustained:Where∑Cis total catches,n is the length of the time series,B0is virgin biomass,BMSYis biomass which produces MSY and BMSY/B0is the biomass of the maximum Ysustrelative to the carrying capacity.
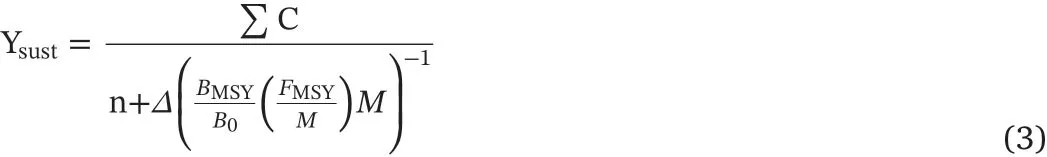
Restrepo et al.(1998)proposed the ratio of FMSYto M(c),so the Ysustis
Input information includes the sum of catches and associated number of years,the relative reduction in biomass during that period,M,and the assumed ratio of FMSYto M(MacCall,2009).With all these being set,the assessment with uncertainty was integrated by Monte Carlo simulation,and a random re-sampling was done 10,000 times in order to generate the probability distribution of Ysust.
2.3.2.Parameter setting
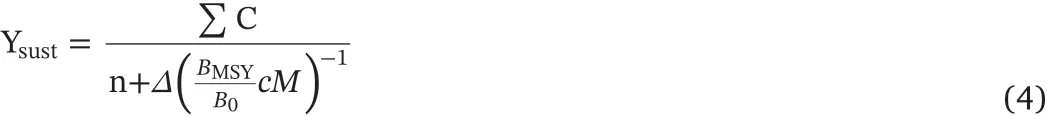
Due to lack of accurate f ishery data,Δwas unable to be precisely estimated.There is no clear value ofΔthat can serve asa default and if nothing at all is known about the value ofΔ,it may be appropriate to assume three parameters of different levels,0.3,0.5,0.7 for precautionary purpose.Most f ishery stock-recruitment relationships indicated that BMSY<0.5B0,and according to various previous researches(Clark,1991;NMFS,1998;Restrepo et al.,1998),for most teleosts including blue marlin the ratio of BMSYto B0is approximately 0.4.In thisstudy,two levelsof density dependence(0.4 and 0.6)were assumed for BMSY/B0.In some f ishery cases with limited data,Thompson(1993)and NMFS(1996)suggested the assumption of c=0.8 and c=0.75.For Indian Ocean blue marlin,three different levels of c were assumed and a total of 18 models were considered(3×2×3=18).DCAC analysis was developed as shown in Table 1.
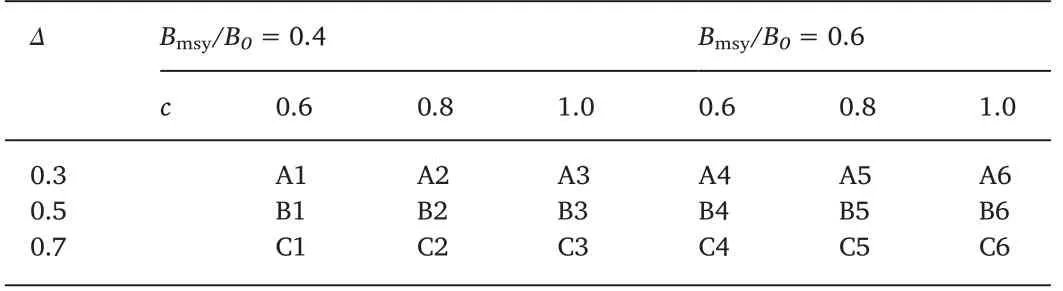
Table 1Specif ication of DCAC for Indian Ocean blue marlin.
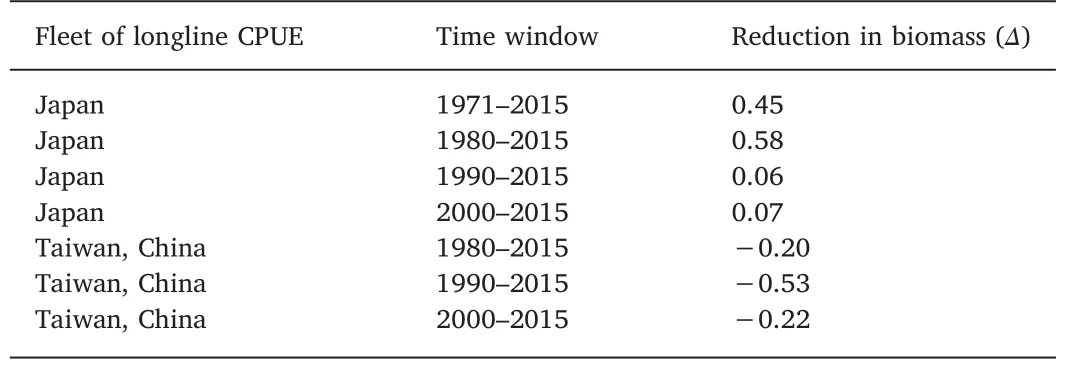
Table 2Specif ication ofΔbased on CPUE data.
MacCall(2009)suggested that in terms of natural mortality rate(M),the use of DCAC is not recommended if M is greater than~0.2 year-1,above which the depletion correction becomes small.In this paper,the M=0.41 year-1based on Equation(1),we also set a level of M=0.2 year-1to evaluate the sensitivity of estimates of Ysustto M.Ysustwas estimated based on standardized CPUE time series from Japanese longline f ishery(1971-2015)and Taiwanese longline f ishery(1980-2015),respectively.We tested different sets of the same time series by decade and the assumedΔis listed in Table 2.The time series block by decade was chosen subjectively.
3.Results
3.1.Estimation of sustainable yield based on different parameter assumptions
The probability distribution of Ysustis shown in Fig.2.The maximum median of the estimate of Ysustis 6800 t and the minimum median is 6190 t.The estimation varied as low as 10%and the parameters had little inf luence on the estimate of Ysustin accordance with results from Fig.3.The estimates for sustainable yield were not sensitive to the choices ofΔor c and the estimate of Ysustis about 6000 t to 7000 t(Fig.3).The estimate of Ysustdecreased lightly with the increase of depletion level(Δ),and increased lightly with the ratio of FMSYto M(Fig.3).
The sensitivity analysis to M showed that,M=0.2 resulted in a lower estimate of Ysustand decreased over M=0.41 by 5.05%(Fig.4).The estimate of Ysustincreased with the increase of M(Fig.4).Ysustbased on different parameter assumptions was lower than the MSY of 11,926 t by BSP-SSand the DCACmethod appeared relatively robust to the different parameters.
3.2.Theinf luenceof catch time serieson the estimation of sustainable yield
According to the catch data of the blue marlin in the Indian Ocean(1950-2015)(Fig.1),the Ysustwas estimated using different catch time series and a clearly increasing trend was observed depending on the data set.The minimum median of the estimate of Ysustis 6610 t when the 1950-2015 catch time series was selected.The median of the estimate of Ysustof about 9700 t is close to the MSY of 11,926 t by BSP-SS when catch time series for 1990-2015 and 2000-2015 were used(Fig.5).
3.3.Estimation of sustainable yield based on different CPUEseries
The probability distribution of blue marlin Ysustshown in Fig.6 is based on two different CPUE indexes.There were some differences in the results based on the different CPUE time series and the estimate of Ysustincreased when time series data was shortened.The minimum median of the estimate of Ysustwas 7550 t based on the CPUEseries of Japan(1971-2015)(Table 3).The median of the estimate of Ysustbased on the CPUE series of Taiwan,China(1990-2015,2000-2015)is over the MSY of 11,926 t by BSP-SS.
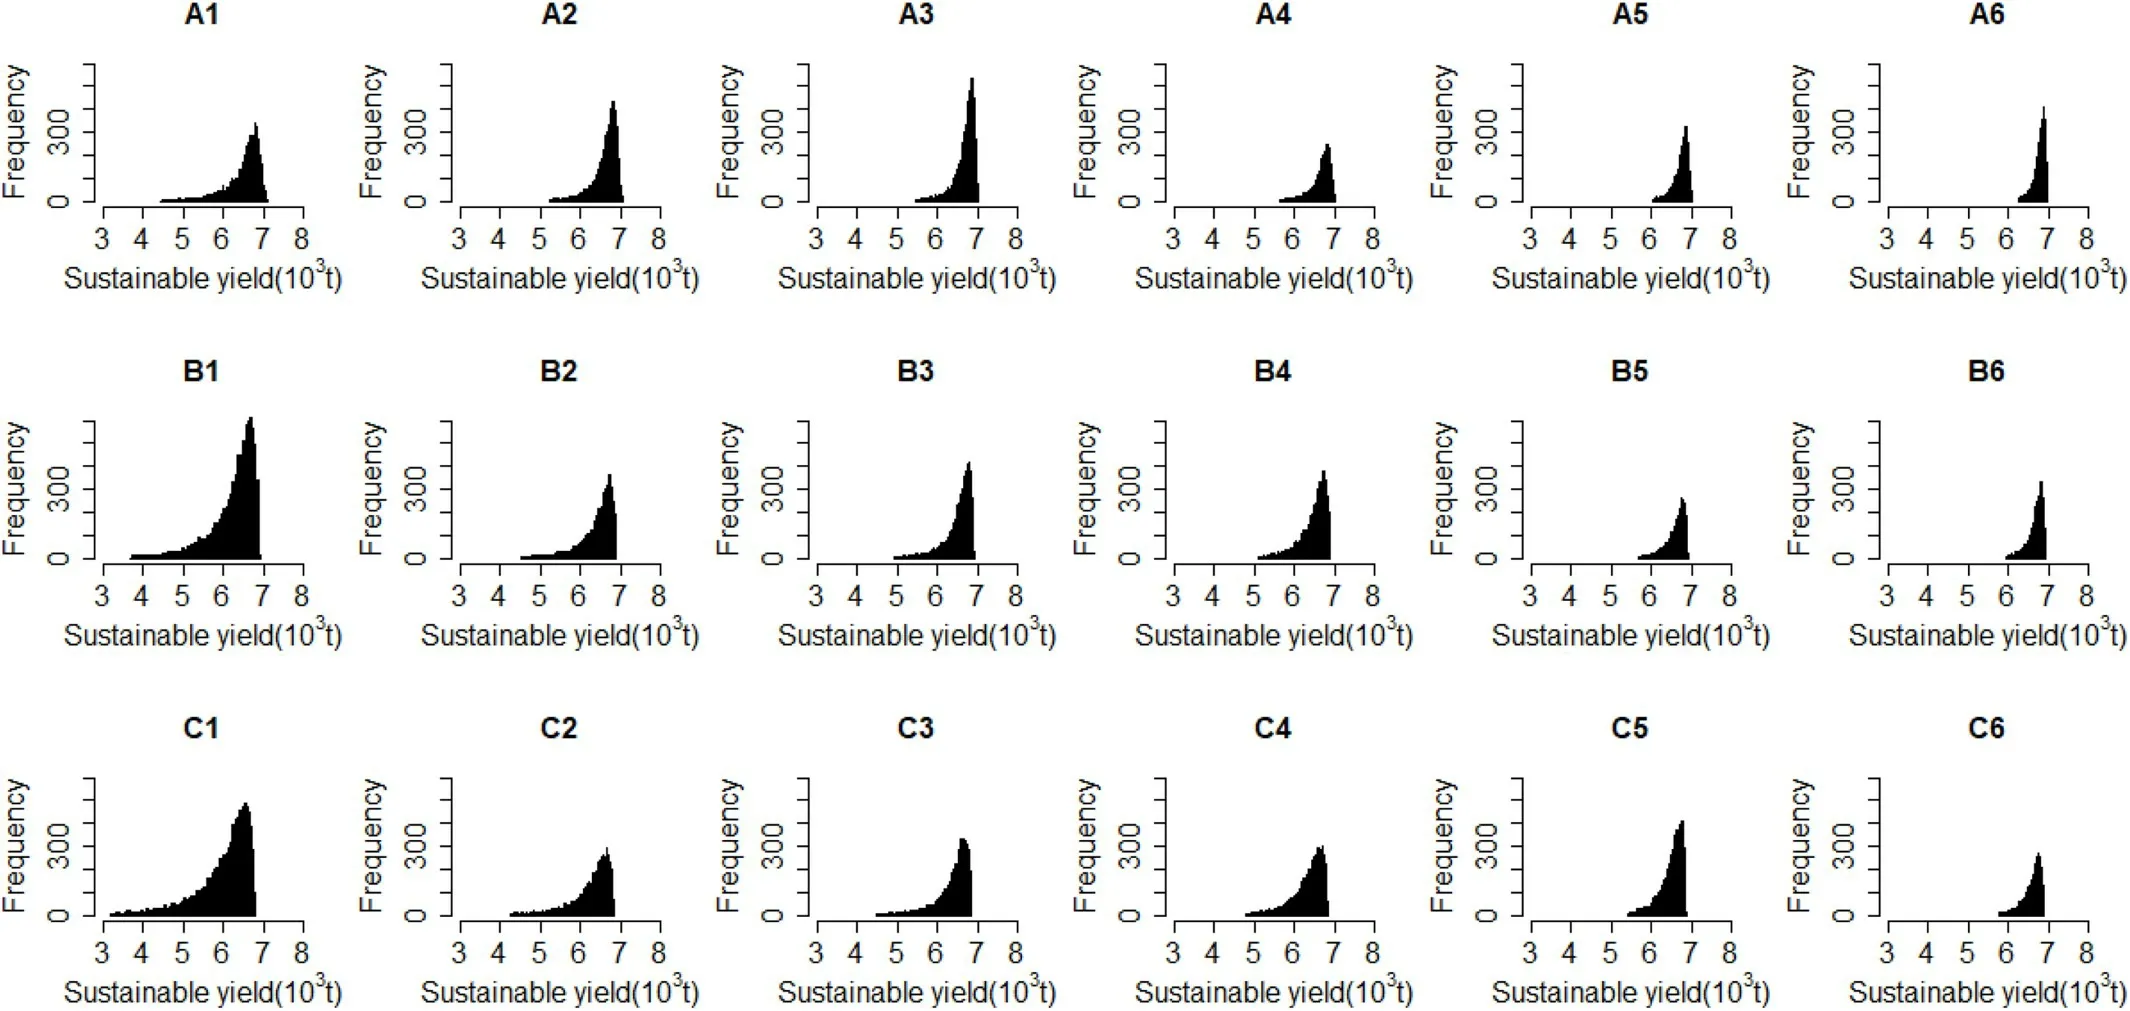
Fig.2.Frequency distribution of sustainable yield for blue marlin with Monte Carlo simulations.
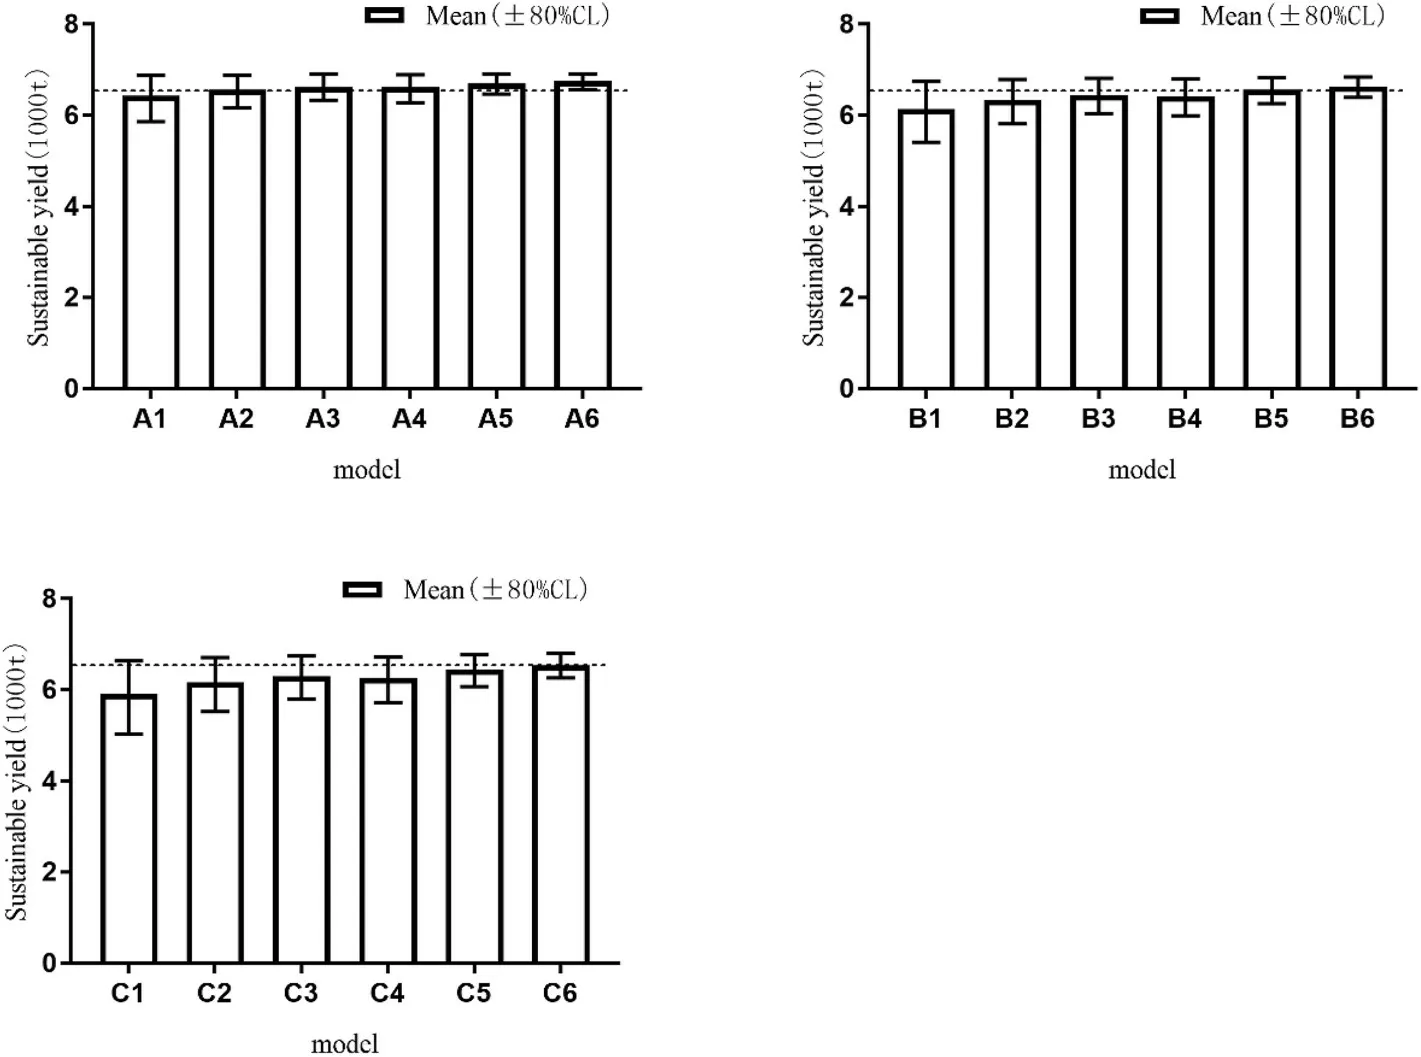
Fig.3.Estimation of sustainable yield of Indian Ocean blue marlin using DCAC.Dashed lines stand for the average catch(1950-2015).
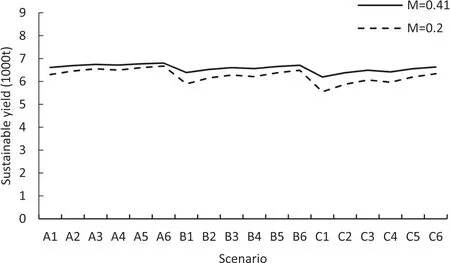
Fig.4.Sensitivity analysis for the estimate of sustainable yield and natural mortality rate used in the DCAC model.
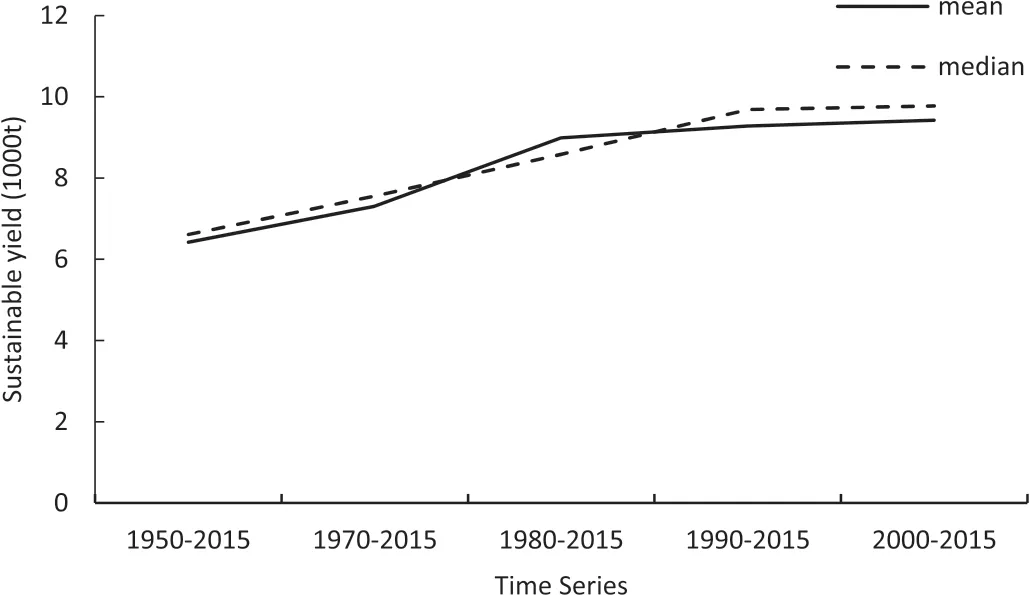
Fig.5.Sustainable yield of blue marlin estimated by DCAC based on different time series.
4.Discussion
4.1.Management implication of sustainable yield estimates
Different assessment models rely on the same or different theories,hypotheses,types of data(including biological information,f isherydependent and-independent data)and statistical methods.Indian Ocean blue marlin was assessed by the state-space Bayesian production model in the Working Party of Billf ish meeting in 2016(IOTC-WPB14,2016).The estimate of Ysustby DCACwas lower than MSY of 11,926 t by BSP-SS.This implied that the Ysustby DCAC could be regarded as precautionary management quantity and it suggeststhat the DCACbe a reliable data poor method in developing Ysustbased management advice for Indian Ocean blue marlin.
With data-rich methods(e.g.,that estimate a stock-recruitment relationship)we can derive an estimate for MSY,however data-poor methods make a lot of assumptionsand since we are not estimating any kind of stock recruitment relationship.We don't have the data to come up with an analytical“solution”for MSY so we are left with making an approximation with DCAC.
4.2.Implication of DCACto other billf ish species
The majority of billf ish stocks lack sufficient catch,survey,and other biological data to calculate current abundance and productivity using conventional stock assessment methods,requiring the use of alternative,data-limited methods(Carruthers et al.,2014).Other species such as Sailf ish and Shortbill spearf ish are considered as data-poor stocks(e.g.no reliable abundance index and size composition).Compared with other data sources,the data on catches can be considered as amongst the most reliable available for billf ishes except when catches are known to be substantially underestimated(Hinton&Maunder,2014).These billf ishes are believed to be similar to blue marlin in terms of biology,f ishery history and data pattern.Blue marlin wasused to test whether the data-poor approach can be applied in billf ishes.
Result from this study suggested that DCACcan be used to estimate Ysustfor Indian Ocean blue marlin,as shown by its conservative estimate of Ysust,compared with MSY by BSP-SS.If the reasonable time series andΔwas considered,DCAC is reliable for blue marlin in deriving precautionary management quantity,which can provide management advice in term of catch limit.Also,if the conventional stock assessments cannot be conducted,data-poor approaches such as the DCAC could be applied to other billf ishes and their uncertainty be estimated for sustainable yield.
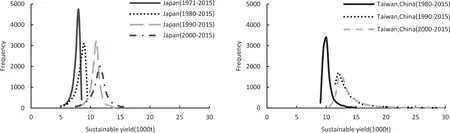
Fig.6.Distribution of sustainable yield estimated based on CPUEs from Taiwan,China,and Japan.
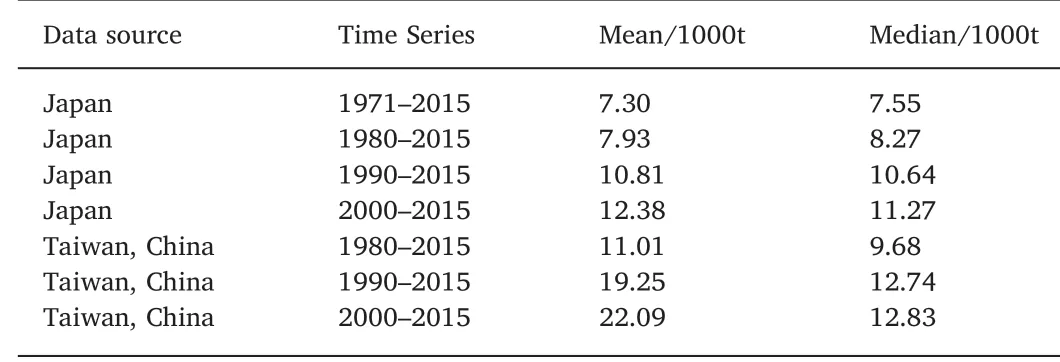
Table 3Sustainable yield of blue marlin estimated by DCACbased on different CPUEs.
4.3.Sensitivity to assumptions
In this study,the estimate of Ysustby DCAC was lower than the provisional reference point of 11,704 t by the management proposal.Thissuggested that the Ysustestimated by DCACwasmore conservative.Ysustof about 6300 t by 18 DCAC analyses(1950-2015 catch time series)is not very sensitive to the parameters and appears relatively robust to the different parameters(Fig.2).According to MacCall(2009)and Geng et al.(2017),Ysustwill increase with c,and the probability distribution can gradually reach stable with the increase of c,which is consistent with the results of this study.
The choice of time series has great inf luence on DCAC results.Considering the great changesin the catch data of the blue marlin in the Indian Ocean(1950-2015)(Fig.1),we tested different catch time series.There were signif icant differences between the estimations of Ysustbased on each of the f ive catch series.The estimate of Ysustincreased gradually with the decrease of the time series and tended to reach stable after 1980.The estimates of Ysustwere both about 9000 t for 1980-2015 and 1990-2015,which was closer to the MSY estimated by the BSP-SS.In terms of time series,we recommend the use of time series after 1980,with small sensitivity.TheΔvalues of Taiwanese f leets were negative and hence we simulated based on the standardized CPUE submitted by Japan longline f leets(1971-2015)and the standardized CPUE submitted by Taiwan, China longline f leets(1980-2015).Which the evaluation results of the Japanese group are the most optimistic,sustainable yield is evenly distributed.The relative reduction of Taiwanese group is negative(Δ≤-0.2),and susceptible to extreme value(1990-2015,2000-2015),and short time series,reduces the DCAC model fault tolerance,which is easy to produce abnormal results(Geng et al.,2017).Based on the above analysis,the estimate of Ysustbased on the CPUEof Japan(1980-2015)was reliable.Similarly,the best f it for time series would be the section where sudden change in time series after catch increases.
Common empirical methods for estimating M include formulas obtained by Pauly(1980),Hoenig(1983)and Jensen(1996)et al.Hinton(2001)calculates M values at 0.41 year-1for males by Pauly(1980)'s method.In this paper,the natural mortality(M)is calculated as 0.41 year-1by Pauly's method and it is almost similar to M=0.38 year-1(approx.95%conf idence interval 0.30-0.45 year-1)from the MULTIFAN-CL model in Kleiber,Hinton,and Uozumi(2003).The natural mortality used is quite a bit higher than that suggested by the MacCall(2009)paper and considering whether the depletion correction has an impact on the model,we compared the results of M=0.2 and M=0.41.The result shows the estimate of Ysustincreased with the increase of M(Fig.3)and variation trend of M is the same as that of parameter c,which is not sensitive to this model.The M=0.4 resulting in a slightly higher estimate of Ysustcompared with M=0.2 by 5.05%,indicating that the inf luence of M on the result is minor for blue marlin even if we assumed a doubled value of M(Fig.3).
This study showed that DCACcould be used to estimate sustainable yield for the Indian Ocean blue marlin and consequently be used to give some management advice for this data-poor f ishery.However,the results of this study should not be used directly to develop management advices,but use recent data and follow recommendations from the IOTC scientif ic commission before its practical applicability.In addition,its applicability remains to be further studied in the case of data mis-reporting and/or non-reporting.
Acknow ledgements
This study was funded by National Natural Science Foundation of China(#41676120).The catch data sets analyzed in the study were originally from f ishing f leetsof IOTC,compiled by IOTCsecretariat and further improved by the IOTC WPB.The longline CPUE indices were developed by scientists from Japan and Taiwan,China.Special thanks go to Kindong Richard for giving suggestions and revisions.Any discussion or conclusion in this study only ref lects the views of authors.
 Aquaculture and Fisheries2019年3期
- Aquaculture and Fisheries的其它文章
- Waste production in aquaculture:Sources,componentsand managements in different culture systems
- The potential of Hoplias malabaricus(Characiformes:Erythrinidae),a Neotropical carnivore,for aquaculture
- Prokaryotic expression of goldf ish Tgf2 transposase with optimal codonsand its enzyme activity
- Molecular identif ication of oomycete species affecting aquaculture in Bangladesh
- Enhancing the immune response in the sea cucumber Apostichopus japonicus by addition of Chinese herbs Houttuynia cordata Thunb as a food supplement