
The potential of Hoplias malabaricus(Characiformes:Erythrinidae),a Neotropical carnivore,for aquaculture
2019-05-18 08:41MrosDnielRenFriAerlCvlnteNetoIvnBezerrAllmnAlineDlOlioGomesRentGuimresMoreirEriHllermn
Aquaculture and Fisheries 2019年3期
Mros Dniel RenóFri,Aerl Cvlnte-Neto,Ivn Bezerr Allmn,Aline Dl’Olio Gomes,Rent Guimrães Moreir,Eri M.Hllermn,
Alexandre Wagner Silva Hilsdorfa,∗
a Unit of Biotechnology,University of Mogi das Cruzes,Mogi das Cruzes,SP,08780-970,Brazil
b Department of Exact Sciences and Technology,State University of Santa Cruz,Ilhéus,BA,45662-900,Brazil
c Department of Physiology,Bioscience Institute,University of São Paulo,São Paulo,SP,05508-020,Brazil
d Department of Fish and Wildlife Conservation,Virginia Polytechnic Institute and State University,Blacksburg,VA 23061-0321,USA∗Corresponding author.Universidade de Mogi das Cruzes,Núcleo Integrado de Biotecnologia,P.O.Box 411,Mogi das Cruzes,SP,08780-911,Brazil.E-mail address:wagner@umc.br(A.W.S.Hilsdorf).
Keywords:Farming Growth models Native species Trahira Fatty acids
A B S T R A C TWe describe key production-related traits of trahira(Hopliasmalabaricus),an aquaculture candidate species,in a semi-intensive f ish farming system.We quantif ied growth from hatch through grow-out at two stocking densities and evaluated f illet protein,lipids and fatty-acid content.We made 2430 observations of growth and morphometricson 270 juvenile f ish allocated to four f ish ponds,two at 5 f ish/m2(90 animals)and two at 10 f ish/m2(180 animals)through 11 months.The f ish reached an average length of 27.5 cm(±0.38)and 27.0 cm(±0.24),and weight of 263.0 g(±10.54)and 246.7 g(±6.89),respectively,at the low and high densities.There was no signif icant difference in weight(P>0.05)between the densities for any of the parameters assessed,and hence the same growth curve applied to both densities(A=292.9;B=28.1;and K=0.65).Standard length,however,differed signif icantly(P<0.05)between densities,with K=0.35 at the low and K=0.29 at the high density.At both stocking densities,total lipids increased throughout the trial,while protein content decreased.Oleic acid(C18:0)increased throughout the experimental period,while docosahexaenoic acid and the n3/n6 prof ile decreased,with no differences among stocking densities.Hoplias malabaricus may prove a viable aquaculture species in Neotropical regions,where development of native species may contribute to sustainable aquaculture production.
1.Introduction
Aquaculture development has driven many alien species introductions worldwide(Naylor,Williams,&Strong,2001;Pérez,Alfonsi,Nirchio,Muñoz,&Gómez,2003).Environmental risks posed by f ish introductions may threaten native f ish diversity;hence,evaluation of native aquaculture candidate species is strategic for development of sustainable f ish farming(Ross&Beveridge,1995).The Neotropical region is rich in native f ish genetic resources potentially useful for aquaculture(Hilsdorf&Hallerman,2017).Among those resources,species of the genus Hoplias(trahiras)comprise eight valid species(Oyakawa&Mattox,2009)which occur throughout drainages from Costa Rica to Argentina(Froese&Pauly,2017).The different trahiras are economically important for local artisanal f isheries in many Neotropical countries(Oliveira&Nogueira,2000;Ramsundar,2005).However,trahiras have not been farmed even at small scale in Neotropical countries.For instance,the aquaculture production of all trahiras in Brazil in 2016 was just 806,365 kg(IBGE,2016,p.44).
Hoplias malabaricus,also known as wolf f ish,tiger f ish,or trahira(Image S1),is a candidate species for aquaculture production.It is a carnivorous f ish that preferentially inhabits lotic environments,also occurring in lentic waters such as lakes and reservoirs(Azevedo&Gomes,1943).H.malabaricus is well adapted to hypoxic waters,can maintain constant oxygen uptake down to a PiO2of 20 mmHg(Rantin,Glass,Kalinin,Verzola,&Fernandes,1993),and can reproduce in these hypoxic waters(Gomes,Honji,Tolussi,Ribeiro,&Moreira,2015).Constraints to full development of aquaculture production of H.malabaricus include feeding costs,presence of intramuscular bones,and the continuing availability of market-sized f ish from capture f isheries.However,new processing techniques,yielding boneless trahira f illets,high f illet yield-around 44%,and high nutritional quality of the meat(Santos,Melo,Lopes,&Malgarim,2001)have attracted consumers to trahira as a delicacy f ish.Despite the relatively high costs of producing carnivorous f ish,high meat quality and attractive prices in local markets have made trahira a good choice for commercial f ish farming.However,technical aquaculture limitations,such as commercial availability of feed-trained f ingerlings(Bondad-Reantaso,2007),cannibalism during the f ingerling stage(Luz,Salaro,Souto,&Zaniboni-Filho,2000),lack of nutritional studies(Vieira&Lopes,2006),and lack of assessment of growth rate in farming systems hinder achievement of large-scale aquaculture production of trahira.
Characterization of the f ish growth curve supports identif ication and adoption of management practices that optimize production,providing insight into the nutritional needs of each growth phase(Tholon&Queiroz,2009).These curves can be used to determine the optimal age for slaughter(Luo et al.,2015;Mello et al.,2015).Growth models used to characterize the growth of f ishes(Enberg,Dunlop,&Jørgensen,2008,pp.1564-1572)include the von Bertalanffy(1938),logistic(Richards,1959),and Gompertz(1825)models.
Development of attractive aquaculture products also depends on their nutritional value.Consumption of f ish and f ish products is highly recommended by health authorities,not only for their protein content,but also as an important source of essential fatty acids(FAs)(Garaffo et al.,2011),mainly omega 3(n3)polyunsaturated fatty acids(PUFAs).To develop an aquaculture candidate species,it is useful to combine prof itable growth rate with high nutritional content,such as high levels of PUFAs(Ogata,Emata,Garibay.&Furuita,2004).
Assessment of trahira production under culture conditions(Luz et al.,2000;Luz,Salaro,Souto,Reis,&Sakabe,2001;Nogueira et al.,2005;Salaro,Luz,Nogueira,Sakabe,&Lambertucci,2003;Salaro,Luz,Sakabe,Kasai,&Lambertucci,2008)have mostly focused on aspects of producing the species Hopliaslacerdae.To gain insight into the potential of H.malabaricus for aquaculture in the Neotropics,we:(i)determined the best growth model for H.malabaricus through one year of semiintensive production;(ii)quantif ied the growth rate of H.malabaricus from fry through grow-out under contrasting production densities;and(iii)assessed f illet quality in terms of total protein,lipid levels and fatty acid prof ile.
2.Material and methods
2.1.Fish and rearing conditions
A total of 270 H.malabaricus juveniles were obtained from the Brumado Fish Hatchery,Ltd.in the State of São Paulo,which had produced them from wild broodstock.To assure proper taxonomic identif ication,the broodstock was assessed morphologically based on diagnostic characters set out for the species by Oyakawa and Mattox(2009).
The growth trial was carried out at the Ponte Nova Fish Farm located in Salesópolis County,State of São Paulo,Brazil(23°31′85″S,45°50′77″W,798 m elevation).The region has a subtropical climate with mean annual temperature of 19°C.Juveniles were stocked in four concrete ponds of 12.6 m3(4.5 m×2.0 m×1.4 m)in a completely randomized design.To assess the rate of growth models under contrasting stocking densities,f ish were stocked at 5 f ish/m2(90 juveniles)and 10 f ish/m2(180 juveniles).Fish were fed exclusively using an extruded commercial diet(NutriPeixe TC 40,Purina,Brazil),and the feeding regime was based on that commercially proposed for carnivorous f ishes(Tables S1 and S2).The growth trial lasted 11 months from September to August.Every 40 days through the experiment,all individuals were anesthetized with 0.01%benzocaine previously diluted in ethanol.Individuals were weighed using a balance with a 1-g precision and standard length was measured with the aid of an analog caliper.
Each day,we assessed the quality of continuously f lowing inlet water by measuring the temperature(°C)and oxygen(mg/L)using a Model 55-12 FT meter(YSI,Yellow Springs,Ohio,USA),total ammonia level using ammonia test strips(Tetra®,Blacksburg,VA,USA),and p H using colorimetric test strips(Macherey-Nagel®,Bethlehem,PA,USA).
2.2.Grow-out performance and growth model data analysis
To determine the most appropriate nonlinear model for characterization of growth of trahira at each stocking density,we tested:the Gompertz model,in which y=A exp(-B e-Kx);the logistic model,in which y=A(1+B e-Kx)-1;and the von Bertalanffy model,in which y=A(1-B e-Kx)3,where y represents the trait(weight or standard length);e is the base of natural logarithms;and x is the age in days.Generally,the f ixed effects A,B,and K represent the average values of the population parameters.These model parameters have the following biological interpretations:A is the superior asymptotic response trait,B is a constant without biological interpretation,and K is the ratio between the relative growth rate and the adult animal response traits(weight and standard length).The higher the value of K,the more precocious is the animal.
The choice of the best nonlinear model for each trait(weight and standard length)and each density(5 f ish/m2and 10 f ish/m2)wasbased on the Akaike Information Criterion(AIC)(Akaike,1974;Sakamoto,Ishiguro,&Kitagawa,1986),as suggested by Katsanevakis(2006),and the Bayes Information Criterion(BIC)(Schwarz,1978).Using this approach,the smaller the criterion value,the better-f itting the model.
After the choice of the best-f itting nonlinear model for each trait,we used a mixed-model approach to obtain accurate estimates of function parameters of animal growth(Cao&Wang,2011;Pinheiro&Bates,1995;Schinckel&Craig,2002;Sofaer,Chapman,Sillett,&Ghalambor,2013).Then the model parameters(A,B,and K)were maintained as f ixed or included as random in the most appropriate nonlinear model using the Likelihood-Ratio Test(LRT)as a criterion,and then estimated and compared among the density.A random effect was considered to have an express inf luence when its inclusion in the model caused signif icant increases in ln.To determine the most adequate model,the likelihood-ratio test(LRT)was applied in reduced sequence models(Kimura,1980;Rao,1973,pp.417-420).
The value obtained for the statistical LRT then was compared to the chi-square table(χ2tab)with the appropriate degrees of freedom:if LR>χ2tab,the effect was considered to have a signif icant inf luence.The level of signif icance used was5%.LRT wasalso applied for equality of the parameters A,B and K between the densities studied(Regazzi,2003)to assess whether a single curve would be adequate to describe the growth(weight-or length-at-age)of trahiras grown at different densities.The growth-model testing described above was performed using the packages,Stats version 3.4.1,nlme version 3.1-131,and car version 2.1-5 of R.3.4.1(R Core Team,2017).
For the traits we studied,AGR is the weight or length gain observed over a unit of time.As the age is updated,AGR represents the average growth rate of animals in the population.We calculated the absolute growth rate(AGR)at age from the f irst derivative of the adjusted growth model.
Growth parameters based on morphometric measures were calculated to assess growth performance and models,including:condition factor (K)=total weight/total length3×100; feed efficiency(FE)=biomass increment×100/food consumed;specif ic growth rate(SGR)=100×[(ln(Wf)-ln(Wi))/T],where ln(Wf)and ln(Wi)are the natural logarithms of the weight at the beginning(Wi)and end(Wf)of the experiment,and T is the time interval in days;and survival(S)=f inal number of f ish×100/initial number of f ish.The coefficient of variation for weight(CV,%)within tanks was used to assess size variation and was calculated as:weight standard deviation/mean weight×100.The coefficient of variation was used because body weight often shows a higher coefficient of variation in f ish than in terrestrial livestock(Gjedrem,1998).The length-weight relationship was estimated by logarithmic transformation of equation W=a×Lb,where W=body weight(g);L=standard body length(cm);a=the intercept;and b=the regression slope.
The growth performance metricsare expressed as mean±standard error.A one-way analysis of variance(ANOVA)was used to test the signif icance(P<0.05)of any difference in growth at the two stocking densities.All data analyses were performed using SIGMA Stat for Windows Version 2.0(Jandel Corporation®).
2.3.Lipids and protein content prof ile
Ten f ish from each experimental group(5 f ish/tank)were collected at one month of age(initial sample),after 90 days(f ive months of ageintermediate sample),and at the end of the experiment(nine monthsof age-f inal sample)to analyze body composition.These animals were sacrif iced by cervical dislocation after sedation(with benzocaine at 100 mg/L)with Institutional Animal Care and Use Ethics Committee approval(#2018/01).A sample of white epaxial muscle was collected from the anteriodorsal region and frozen at-80°Cuntil analysis.
Total proteins were extracted from muscle tissue by precipitation and solubilization according to Milligan and Girard(1993).Tissue protein content was analyzed by the colorimetric method of Lowry,Rosebrough,Farr,and Randall(1951),using bovine serum albumin to develop the standard curve(Sigma Diagnostics,St.Louis,MO,USA),and expressed as mg/g of dry mass.Total lipids were extracted from muscle and diet with chloroform:methanol:water(2:1:0.5)according to Folch,Less,and Stanley(1957),modif ied by Parrish(1999)for aquatic organisms.The total lipid content of tissues was quantif ied by the enzyme-colorimetric method described by Frings,Fendly,Dunn,and Quenn(1972)using cod liver oil(Sigma Diagnostics,Inc.,Livonia,MI)for the standard curve and expressed as mg/g of mass.
Methylation of the lipid extracts was performed with acetyl chloride(5%CH3COCl in methanol)(Christie&Han,2010,p.448),and fatty acid(FA)composition was determined as methyl esters using a gas chromatograph(GC)(Model 3900,Varian Analytical Instruments,Walnut Creek,CA,USA)coupled to f lame ionization detection(FID).FAs were identif ied by comparing retention time,using a known standard of methyl esters(FAME)(Supelco,37 components;Sigma-Aldrich;Larodan Malmö,Sweden,Mixture Me93,and Qualmix PUFA Menhaden Oil).The FAMEs were analyzed on a capillary column,CP Wax 52 CB,with 0.25μm thickness,0.25 mm inside diameter,and 30 m length.Hydrogen was used as the carrier gas at a linear velocity of 22 cm/s.The temperature program was 170°Cfor 1 min followed by a 2.5°C/min ramp up to 240°C,and a f inal hold time of 5 min.Injector and f lame ionization detector(FID)temperatures were 250 and 260°C,respectively.
The percentage of FA was used to calculate the indices of atherogenicity(AI)and thrombogenicity(TI),as proposed by Ulbritch and Southgate(1991):
Values were expressed as mean±standard error.The comparison of growth parameters and body composition between stocking densities during the experiment were performed using one-way analysis of variance(ANOVA).For all the analyses,differences were considered to be signif icant when P≤0.05.These analyses were performed using the statistical software BioStat 2009(AnalystSoft,Inc.,Walnut,CA,USA).
3.Results
3.1.Test environment
The average water temperature during the spring/summer season(September to March)was 24.3°C(±2.2)and during the autumn/winter(March to September)was 19.6°C(±2.6).The lowest temperature measured was 16.1°Cand the highest 28°C.Dissolved oxygen ranged from 5 to 9 mg/L,theammonium ion concentration ranged from 0.10 to 0.20 mg/L,and the p H ranged from 6.7 to 7.2.These water quality parameters were within the range for routine f ish farming operations in the region.
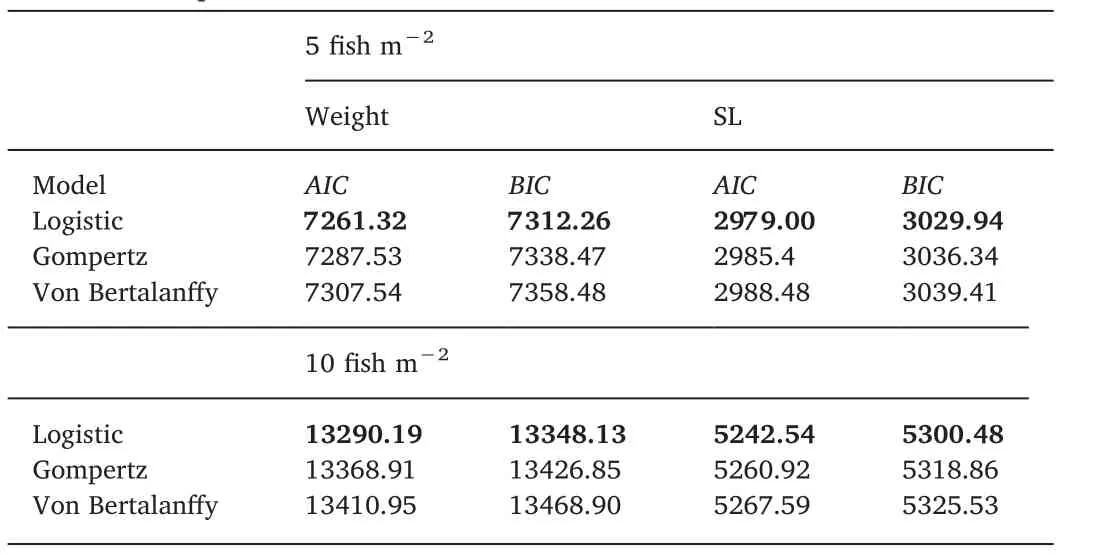
Table 1Akaike(AIC*)and Bayesian(BIC*)information criteriaa for different growth models applied to the weight and standard length(SL)traits in relation to age for trahira,Hoplias malabricus.
3.2.Growth model assessment
According to the AIC and BIC criteria(Table 1),for both weight and standard length at both stocking densities,the logistic model best f it the data for size-at-age of the animals.The likelihood ratio test for the weight trait indicated that the A and B parameters at both densities must be included as random parameters in the logistic model(P<0.05),while K must be included asa f ixed parameter(P>0.05).The same outcomes were observed for the trait standard length(Table 1).
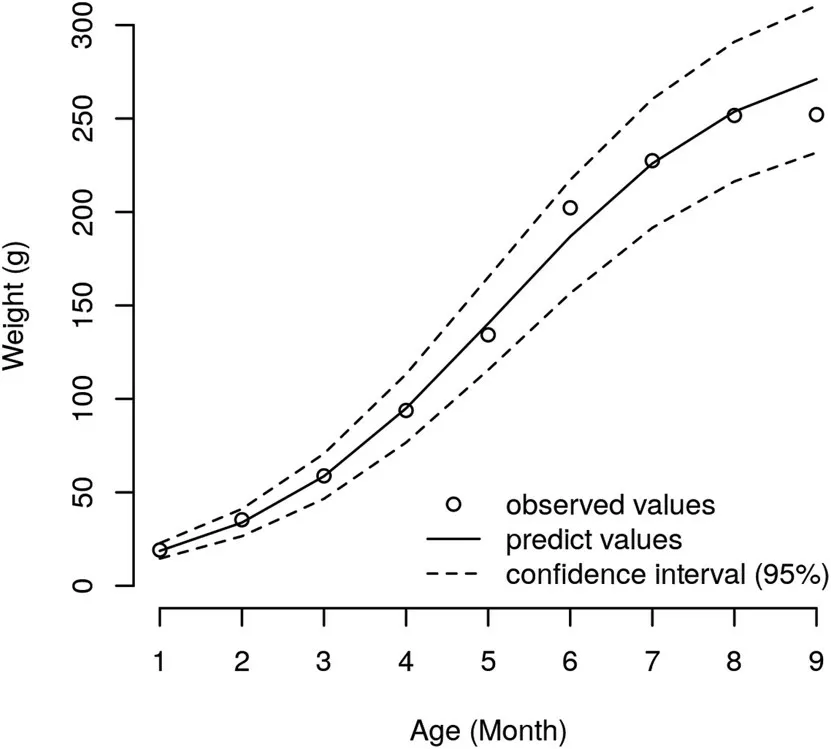
Fig.1.Growth of weight based on the values observed and predicted by the logistic model,with the 95%conf idence interval.
Comparing the growth curves for both densities,the parameterequality tests applied to the logistic model for weight showed that the hypotheses A1=A2,B1=B2and K1=K2were not rejected(Table 1);hence,a single model can be used to describe weight-at-age for H.malabaricus(Fig.1).Thus,the equation describing weight-at-age was estimated(A=292.90;B=28.14;and K=0.65).Regarding the parameters A and B,the equality hypothesis was not rejected,indicating that trahira has the same ultimate size(A)and the same constant of integration(B)at both stocking densities.Maximum increment for weight-at-age,i.e.,the highest absolute growth rate,occurred before the f ifth month of age for the lower density(5 f ish/m2)and the sixth month of age for the higher density(10 f ish m-2)(Fig.2).The lengthweight relationship,W=0.00896×b3.1074,R2=0.9785(Fig.1),showed a mean b value of 3.07,which differs slightly from the standard value of 3.0.Thus,H.malabaricus under semi-intensive farming conditions presents positive allometric growth,i.e.,individuals increase in relative body thickness,becoming heavier at a given length as the f ish grows(Tesch,1968).The b value for trahira is between 2.5 and 3.5,as is found for most f ish species(Froese,2006).Equality tests for the parameters within the Huxley model regarding the length-weight relationship at both stocking densities did not differ signif icantly(P>0.05)(see Fig.3).
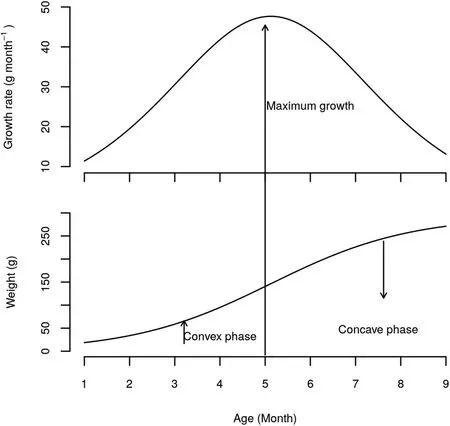
Fig.2.Absolute growth rate and logistic curve adjusted to both stocking densities.
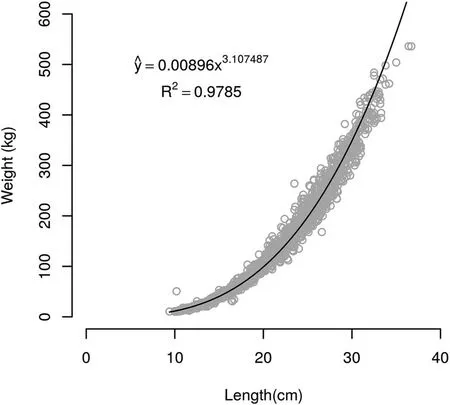
Fig.3.Length-weight relationship for H.malabaricus under intensive farming management.
3.3.Grow-out performance
Table 2 summarizes the growth performance of H.malabaricus under the two density conditions.Initial total length,f inal total length and body weight,as well as the majority of the growth parameters,were statistically equal at both stocking densities.Conversely,feed conversion rate and survival rate showed statistically signif icant differences between stocking densities by the end of the experiment.The coefficients of variation for growth traits were high and within the range found in f ish and shellf ish(CV=17%-29%,Gjedrem,1998).
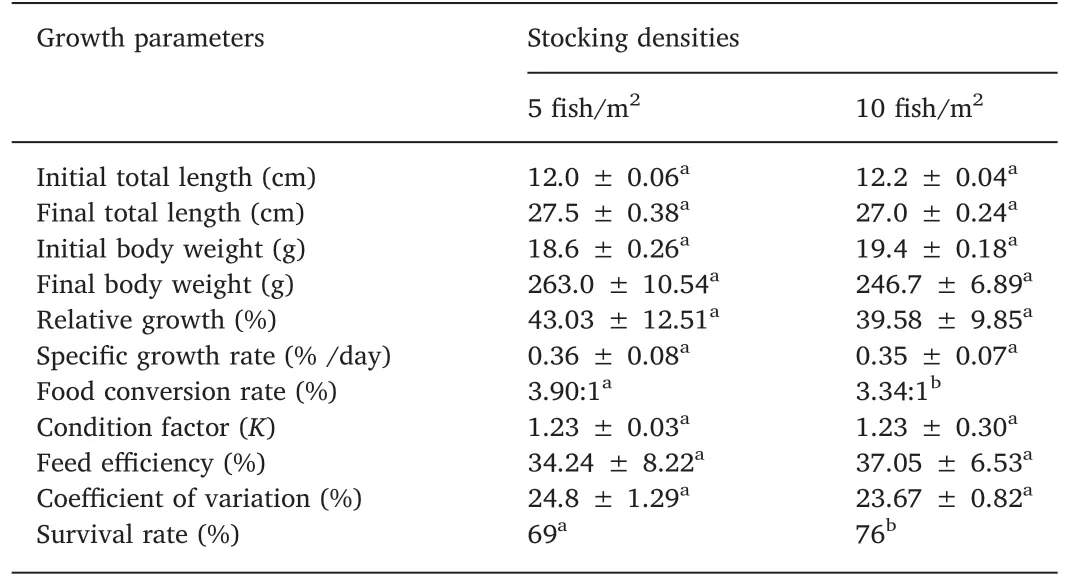
Table 2Growth rate parameters from H.malabaricus juveniles reared at two stocking densities(5 f ish/m2 and 10 f ish/m2)under on-farm grow-out conditions*.
3.4.Protein and lipid body prof ile of H.malabaricus
The total protein level of the f illet decreased between the initial sample and subsequent samples(P<0.001,Table 3),but there were no differences between the treatments(P>0.05).Conversely,the lipid concentration of f illets increased in animals at both densities by the end of the experiment(P<0.001),and were not signif icantly different between the treatments.
The f illet FA prof ile of animals from both densities showed an increase in saturated fatty acids(SFA)at the end of the experiment(P=0.002 and P<0.001,respectively,Table 3),mainly due to C18:0.n3 PUFAs decreased through the experiment in both treatments,with docosahexaenoic acid(DHA)most responsible for this decrease.The decrease in n3 PUFAs was associated with a decrease in the n3/n6 ratio at the end of the experiment at both stocking densities.No signif icant differences were found in AI and TI among stocking densities.
4.Discussion
Our results showed that stocking densities had little inf luence on growth rate,protein and lipid content,or fatty acid prof ile of f illets of
H.malabaricus.
4.1.Growth model and grow-out performance
Successful cultivation of an aquaculture candidate species depends on genetic make-up and physiological plasticity so that the species can adjust to culture conditions and show a viable growth rate for commercialization(Avault,1993).Hence,modeling f ish growth is a f irst step for assessing an aquaculture candidate species because it supports predictions of how well the f ish will grow under various production systems.
High-productivity f ish farming systems monitor physical and chemical water quality because it directly affects physiological processes of f ish.The physical and chemical water quality parameters did not change in a way that would affect growth or f illet composition,except for water temperature.Total ammonia concentration and p H remained constant and within f ish-farming standards throughout the experiment.pH values remained between 6 and 8.The saturation level of DO was about 9.0 mg/L at 20°C,and about 7.8 mg/L at 27°C.Even at higher temperatures,observed DO concentrations throughout the experiment were appropriate for production of trahira.Variations in temperature above or below the optimum of a speciescan change itsgrowth rate(El-Sayed,El-Ghobashi,&Al-Amoudi,1996;Person-Le,Mahe,Le Bayon,&Le Delliou,2004;Ribeiro,Moreira,Cantelmo,&Esposito,2014;Tolussi,Hilsdorf,Caneppele,&Moreira,2010).The temperature ranged between 16 and 28°C depending on the season.Water temperature was below the range for warm water farmed f ishes(26.06-31.97°C,Boyd&Tucker,1998,p.700),which negatively inf luenced growth performance at both stocking densities.
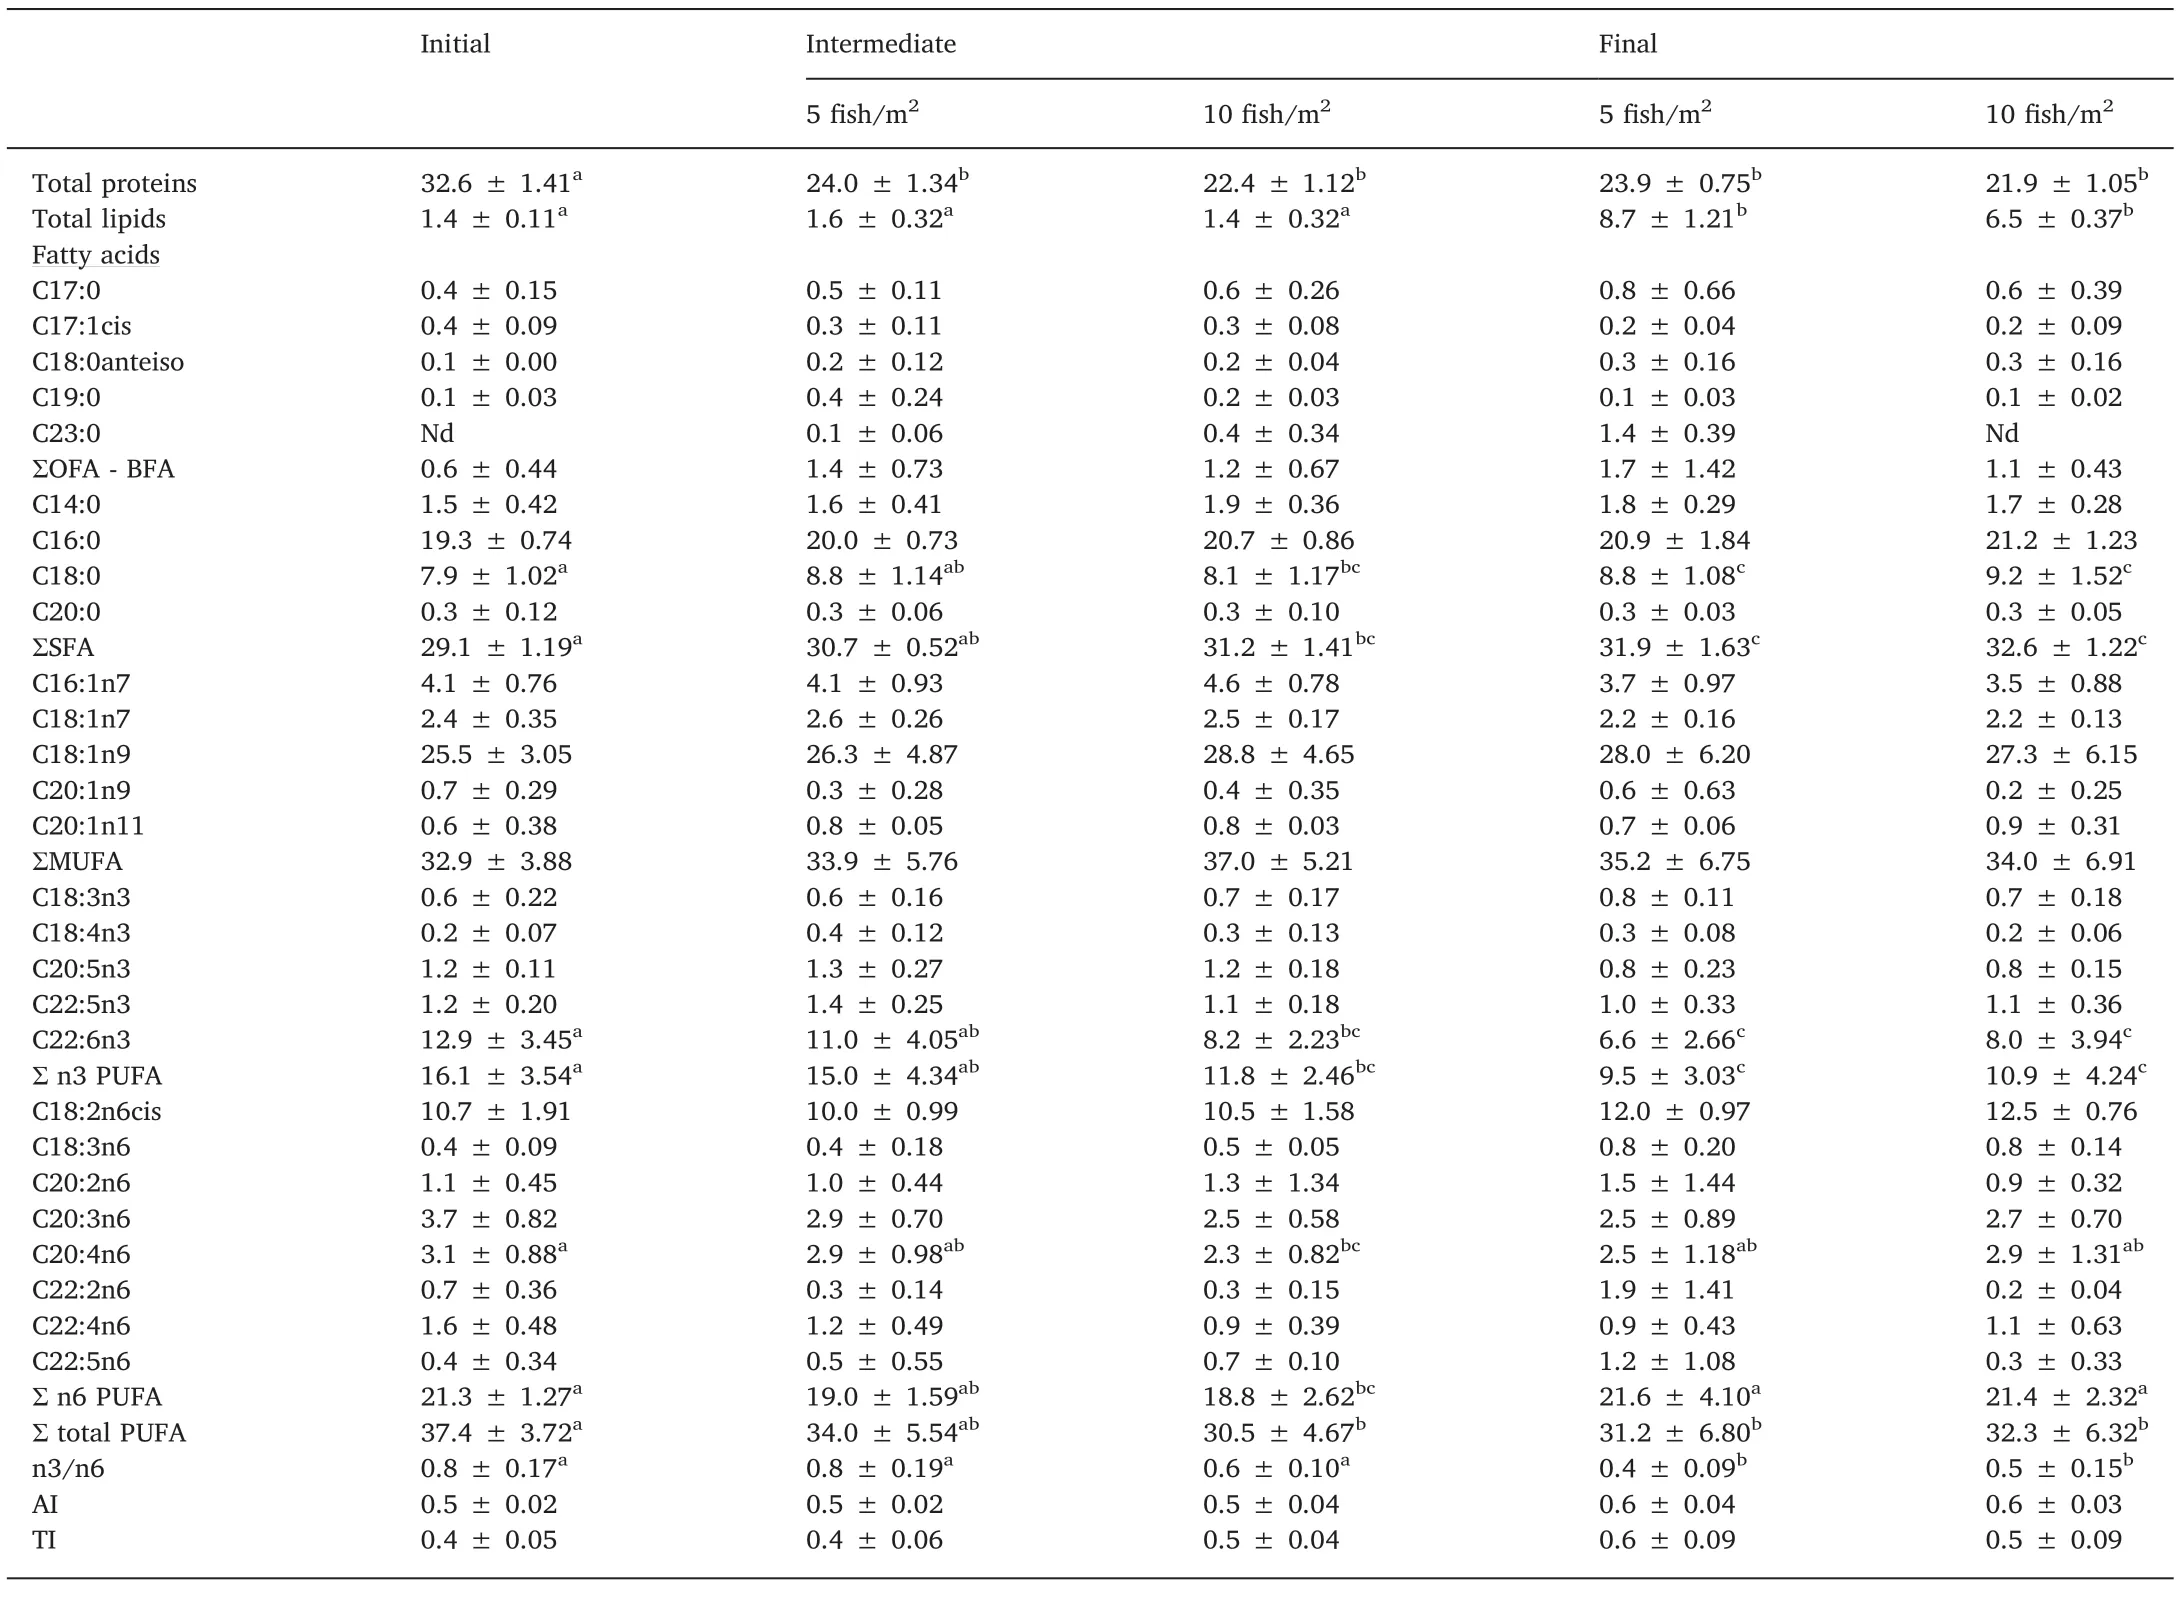
Table 3Total protein,lipid(%wet weight)and fatty acid prof iles(%of total lipids)of H.malabaricus juvenile f illets produced at two stocking densities(5 f ish/m2 and 10 f ish/m2).
Three nonlinear mathematical models relate f ish growth to age;these models have three parameters,which at least theoretically have biological importance (Freitas,2005;Enberg et al.,2008,pp.1564-1572).Various authors have suggested the use of nonlinear mixed models using both f ixed and random effects to increase their predictive accuracy(Schinckel&Craig,2002;Cao&Wang,2011).Using BIC and AIC tests(Table 1),we found that the logistic model best captured growth in weight-and length-at-age of H.malabaricus.The best-f itting adjusted model varies among species.For instance,in Nile tilapia Oreochromis niloticus,the logistic model best describes the morphometric growth under culture conditions(Ansah&Frimpong,2015).In the Neotropical aquaculture species tambaqui Colossoma macropomum,Mello et al.(2015)concluded that the Gompertz nonlinear regression model was most appropriate.Growth models for Neotropical carnivorous species have been assessed only for wild populations,with the von Bertalanffy model best describing growth of spotted surubim Pseudoplatystoma corruscans(Mateus&Petrere,2004),duckbill catf ish Sorubim cf.lima(Penha,Mateus,&Barbieri,2004),H.malabaricus(Tordecilla-Petro,Sánchez-Banda,&Olaya-Nieto,2005),and dorado Salminusbrasiliensis(Zuliani et al.,2016).The divergence in the best-supported growth model is a result of the specif ic growth pattern of the species under study(Sarmento et al.,2006),and also the sample size and frequency(temporal resolution)of growth measurements;that is,when the inf lexion point of the curve ranges from 0 to 1,the best adjustment will be obtained with the models of Brody and Gompertz.However,when it oscillates between 1 and 2,it will be obtained with the Gompertz or logistic models(Richards,1959).
Assessment of growth models for cultured H.malabaricus using the LRT showed that the mixed-model approach provided a better f it to the data than traditional modeling with only f ixed effects.Cao and Wang(2011)suggested the use of mixed-effects model increases the accuracy of predictions about growth.Craig and Schinckel(2001)developed mixed nonlinear models for porcine growth and showed more accurate estimates for parameters of functions for animal growth than traditional,f ixed-effects models.
The typical lifetime growth curve of f ish has a sigmoid shape,i.e.,growth during early life is slow and is followed by a period of acceleration,and then growth reaches its maximum around puberty,when deceleration occurs(Berg&Butterf ield,1976,p.240).Fig.2 shows this pattern for weight growth in trahira,in which absolute growth and the logistic curve were adjusted for the two stocking densities.At the lower stocking density(5 f ish/m2),the convex phase of the growth curve started earlier than at the higher stocking density(10 f ish/m2).However,the growth rate in the f ish at a higher stocking density increased until the sixth month of grow-out.Some authors have observed the same effect in other species,for example,Piaia and Baldisserotto(2000)for Rhamdia quelen and Salaro et al.(2003)for Hoplias lacerdae,reported that in captivity at high-density the f ish tended to gather for feeding,decreasing territorial behavior and cannibalism.In our study of Hoplias malabaricus,the survival rate was 69%at a density of 5 f ish/m2and 76%at 10 f ish/m2.
Growth models for farmed f ishes may be affected by environmental factors,particularly oxygen availability and temperature,as well as culture-dependent factors such as stocking density and feeding.To assess the growth curve for a candidate f ish for aquaculture,such as H.malabaricus,it is important to understand and manage culture variables in order to improve growth rate,and to determine the optimal costbenef it weight for harvest size(Kapetsky&Nath,1997,p.128;Gomiero et al.,2009).Grow-out performance of H.malabaricus during the one year-production cycle had similar outcomes for the two stocking densities,as can be seen in Table 2.This outcome has also been observed with the congeneric trahira species Hopliaslacerdae through 120 daysof growth(Salaro et al.,2003).The coefficients of variation for growth of H.malabaricus were higher than for other farmed carnivorous species,such as Clarias gariepinus(ranging between 0.38% and 6.5%,(Hengsawat,Ward&Jaruratjamorn,1997),and similar to other Neotropical species of the genus Pseudoplastytoma(CV ranging between 18 and 45%,Miranda&Ribeiro,1997;Turra et al.,2009).The mean weight after 11 months of grow-out did not differ signif icantly between the two densities,263.0 g and 246.7 g for 5 and 10 f ish/m2,respectively.Although the specif ic growth rate of H.malabaricus washalf that of Pseudoplatystoma catf ish(sorobim)(Scorvo-Filho,Romagosa,Ayroza,&Frascá-Scorvo,2008),an important Neotropical carnivorous farmed f ish,we note that the juveniles we used originated from wild broodstock which had not undergone genetic improvement.The high coeff icient of variation at the last weight measurement may ref lect the full range of phenotypic variation for the trait.After the eleventh month of rearing,including the winter months,f ish weighing more than 450 g were found among the trial f ish.The market demand for an individual portion(plate size)and the growth rate achieved in this study indicate the commercially interesting weight for trahira is between 500 and 600 g.Observation of f ish with higher growth rates under semi-intensive culture management suggests that H.malabaricus may have potential for improved growth by selective breeding.Domestication and selective breeding to improve feed conversion rate would address a factor critical for adoption of H.malabaricus for commercial aquaculture.
The extent of genetic variation found within and among populations provides the basis for a genetic improvement program,i.e.,phenotypic variation and underlying heritability for growth rate are functions of relevant genetic variation(Gjedrem&Baranski,2009).The establishment of a selective breeding program using genetically diverse populations has the potential to improve growth rate to market size for succeeding generations of H.malabaricus.
4.2.Nutritional aspects of farmed H.malabaricus
Regarding the body composition,total protein concentrations in f illets decreased through the experiment at both stocking densities;however,the values still remained higher than those for other species analyzed,such as Murray cod Macarllochella peelii peelii(Palmeri,Turchini,De Silva,2007),gilthead sea bream Sparus aurata(Senso,Suarez,Ruiz-Cara,&Garcia-Gallego,2007),Tiete tetra Brycon insignis(Tolussi et al.,2010),goldf ish Carassius auratus(Dal Bosco,Mugnai,Mourvaki E.,&Castellini,2012),and Nile tilapia(Ribeiro et al.,2014;Vieira,Hilsdorf,&Moreira,2012).The decrease in f illet protein may be due to utilization of protein as an energy source for growth,suggesting that use of a higher protein diet(>40%)may be appropriate for growout of H.malabaricus.
Lipid content is also an important aspect of f illet quality(Quinton,McMillan,&Glebe,2005).Fillets can be classif ied as“lean”when the lipid content is below 2.5%and as“semi-skimmed”between 2.5%and 10%(Bennion,1980,p.598;Jacquot,1961).In the present study,high concentrations of lipids in the muscle of H.malabaricus juveniles were such that the f illet would be classif ied as high-quality,in the semiskimmed range.The f illet fatty-acid prof ile showed few changes over time,but we noted an interesting content of SFAsand PUFAs.The major FAs in H.malabaricus juvenile f illets were:C16:0,C18:0,C18:1n9,C18:2n6(linoleic acid,LA),ARA(C20:4n6),and DHA.FAs of aquatic origin are characterized by the predominance of PUFAs,especially EPA(C20:5n3)and DHA(Arts,Brett,&Kainz,2009,p.380),as seen in our results.
Despite the increase of SFA observed in the f illets of f ish at harvest at both stocking densities,values remained lower than those found by Kasai et al.(2011)in H.lacerdae f ingerlings.On the other hand,total PUFA presented a signif icant decrease between the initial and later samplings at both densities due to decreasing n3 PUFA content,specif ically DHA.The percentages of total,n3 PUFAs/DHA,nonetheless is high and similar to those of H.malabaricus f illets from f ish captured from the wild(Gutierrez&Silva,1993;Petenuci et al.,2016;Torres,Zambiazi,Chiattone,Fonseca,&Costa,2012).The DHA content in H.malabaricus,when its freshwater origin is considered,is higher than many other economically important freshwater f ishes,including Nile tilapia(Vieira et al.,2012),common carp Cyprinus carpio(Živićet al.,2014),sábalo Prochilodus lineatus(Luzia,Sampaio,Castellucci,&Torres,2003),pintado Pseudoplatystoma corruscans(Martino,Cyrino,Portz,&Trugo,2002),peacock bass Cichla sp.(Inhamuns,Franco,&Batista,2009),and spotted pim Pimelodus maculatus,threespot leporinus Leporinus friderici,and dorado Salminus brasiliensis(Andrade,Rubira,Matsushita,&Souza,1995).
H.malabaricus juveniles had a high percentage of C18:2n6(almost 90%of total PUFAs),suggesting that they tend to accumulate n3 PUFAs,mainly DHA,in the f illet,even at high stocking densities and with a relatively low percentage of this FA in the diet.This FA ismainly found in soybean,corn,and sunf lower(Matsushita et al.,2006,pp.125-131),suggesting the inclusion of a higher proportion of these ingredients in the commercial diet,together with the low animal protein content,results in a low percentage of EPA and DHA,the main FAs of f ishmeal.Hence,the high percentage of C18:2n6 in the muscle tissue ref lects that of the diet.This FA is considered essential to freshwater f ishes and humans because it acts as the main precursor of arachidonic acid(ARA)(C20:4n6),also found in a reasonable percentage in the f illet of H.malabaricus.ARA is the precursor of many physiologically active compounds,such as prostaglandins,thromboxanes,and leukotrienes.In f ishes,production of these hormones can inf luence growth,vitellogenesis,immune response,and physiological response to environmental stress(Bell,Tocher,MacDonald,&Sargent,1995).Greater f ish consumption is associated with increased n3 PUFA intake and with an increase in the n3/n6 ratio,which plays a critical role in improved cognition and cardiovascular health in humans(Liu et al.,2017;Marik&Varon,2009).
In the present study,despite a decrease in the n3/n6 ratio at the end of the experiment,the values remained between 0.4 and 0.8.The optimal ratio of n3/n6 is not known for most organisms and is hypothesized to be species-specif ic(Sargent,1995).AI and TI showed very low values in comparison to those observed in other animals,such as Atlantic bluef in tuna Thunnus thynnus(AI=0.7)(Garaffo et al.,2011)and terrestrial livestock animalssuch asrabbit(0.7 and 0.99;Dal Bosco,Castellini,Bianchi,&Mugnai,2004)and poultry(0.49 and 0.88;Castellini,Bosco,Mugnai,&Pedrazzoli,2006).Among PUFAs,the main fatty acids with anti-atherogenic action(inhibiting platelet aggregation and decreasing plasma cholesterol concentration)are C18:2n6,C18:3n3,EPA and DHA,which are also known to have anti-thrombogenic effects(preventing the formation of clots in blood vessels).On the other hand,SFAs such as C14:0 and C16:0 are known as health risk factors(Lajous et al.,2013;Ulbritch&Southgate,1991).
5.Conclusions
The search for new native aquaculture species as an alternative to introduced ones has been on the agenda of ministries of agriculture in multiple Neotropical countries(Garcia-Trejo,Hurtado-Gonzalez,Soto-Zarazua,&Gutierrez-Yurrita,2014;Ross&Beveridge,1995).The trahira Hoplias malabaricus is distributed through many Neotropical countries.In Brazil,it has been captured in reservoirs and supplied to markets and after intramuscular bone removal,it is prepared for consumption using many different recipes.The results of this study indicated logistic as the best model to explain growth in weight-and length-at-age in trahira under aquaculture operations.And that density did not induce modif ied f illet protein or lipid deposition,including fatty acids.Trahira f illet composition showed high fatty-acid contents for n3 and n6 PUFAs,such as DHA,LA and ARA compared to other tropical aquaculture species.Therefore,market demand,adaptation to farming conditions,low requirement for dissolved oxygen,ready consumption of processed feed,considerable growth potential,along with high nutritional quality and superior meat f lavor,indicate that H.malabaricus is a suitable candidate for development of prof itable aquaculture operations in Central and South American countries.
Acknow ledgments
We gratefully acknowledge the support of Department of Water and Electric Energy stafffor their help during the development of thiswork.Also,we thank the Foundation for Supporting Teaching and Research for funding this work,Funding for Eric Hallerman's participation in this work was provided in part by the Virginia Agricultural Experiment Station and the Hatch Program of the National Institute of Food and Agriculture,U.S.Department of Agriculture.Emmanuel Frimpong provided useful comments on the draft manuscript.This work was developed as part of the full requirements for the Master of Science thesis of M.D.R.Faria in Biotechnology at the University of Mogi das Cruzes(UMC).A.W.S.H.and R.G.M.are recipient of CNPq productivity scholarship.
Appendix A.Supplementary data
Supplementary data to this article can be found online at https://doi.org/10.1016/j.aaf.2019.01.002.
 Aquaculture and Fisheries2019年3期
- Aquaculture and Fisheries的其它文章
- Waste production in aquaculture:Sources,componentsand managements in different culture systems
- Prokaryotic expression of goldf ish Tgf2 transposase with optimal codonsand its enzyme activity
- Molecular identif ication of oomycete species affecting aquaculture in Bangladesh
- Enhancing the immune response in the sea cucumber Apostichopus japonicus by addition of Chinese herbs Houttuynia cordata Thunb as a food supplement
- Estimating blue marlin(Makaira nigricans)sustainable yield in the Indian Ocean using a data-poor approach