
Statistical Analysis for Constant-stress Partially Accelerated Life Test with Interval Censored Data
2019-04-23 01:43:56LONGBingZHANGZhongzhan
LONG Bing,ZHANG Zhong-zhan
(1.School of Mathematics and Physics,Jingchu University of Technology,Jingmen,Hubei 448000,China;2.College of Applied Sciences,Beijing University of Technology;Beijing 100124,China)
Abstract:In this paper,a statistical analysis method is proposed to research life characteristics of products based on the partially accelerated life test.We discuss the statistical analysis for constant-stress partially accelerated life tests with Lomax distribution based on interval censored samples.The EM algorithm is used to obtain the maximum likelihood estimations(MLEs)and interval estimations for the shape parameter and acceleration factor.The average relative errors(AREs),mean square errors(MSEs),the confidence intervals for the parameters,and the influence of the sample size are discussed.The results show that the AREs and MSEs of the MLEs decrease with the increase of sample size.Finally,a simulation sample is used to estimate the reliability under di ff erent stress levels.
Key words:Interval censored samples;Partially accelerated life test;Accelerated factor;EM algorithm;Fisher information matrix
§1. Introduction
With the progress of science and technology,more and more products of high quality and high reliability have emerged.It is not easy to obtain the failure data of these products under normal conditions.Therefore,in order to shorten testing time or accelerate performance degradation,all test units or some of them are subject to stresses which are more severe than usual conditions.they are called accelerated life tests.If only a part of the products are put under accelerated condition,then the test is also called partially accelerated life test.In recent years,there are many literatures have recorded on the study of the statistical analysis of accelerated life test.
Based on the model of step-stress accelerated life test,Ali A.Ismail[1]obtained the maximum likelihood estimation and interval estimation of the parameters and acceleration factor for Weibull distribution under progressively hybrid censored samples.Under progressive type-I interval censored samples,Wu[2]discussed the step-stress accelerated life test of the k stress levels,obtained the parameter estimation of the exponential distribution model,and gave the optimal test scheme based on four criteria.Based on the model of step-stress accelerated life test,when the life of the products followed Burr-XII distribution,Abd-Elfattah A M[3]gave the maximum likelihood estimations of parameters and acceleration factor,and obtained the covariance matrix of the parameters.Ali A.Ismail[4]derived the maximum likelihood estimations of parameters for Weibull distribution,and designed the optimal test scheme.Under constantstress accelerated life test,Shi[5]studied the maximum likelihood estimation and Bayesian estimation of unknown parameters and reliability for exponential distribution with competing failure products.Ali A.Ismail[6]discussed the optimal scheme of Pareto distribution under constant-stress partially accelerated life test based on type-I censored samples.In addition,the statistical analysis of accelerated life test are also studied in the literatures[7−10].
The Lomax distribution is often called the Pareto distribution of type-II.Since the distribution includes monotonous increasing and monotonous decreasing failure rates,it plays an important role in the analysis of life test data in the fields of medical,biological and engineering science.In addition,it has been extensively used for reliability model and life testing.At present,many scholars have made extensive researches on the application of Lomax distribution in many ways,and have produced many achievements.For example,Balakrishnan and Ahsanullah[11]introduced some recurrence relations between the moments of record values from Lomax distribution.The order statistics from nonidentical right-truncated Lomax random variables have been studied by Childs[12].El-Din[13]studied Bayesian estimators of the Lomax model.Ghitany[14]studied Marshall-Olkin approach and extended Lomax distribution.Cramer and Schmiedt[15]studied progressively type-II censored competing risks data from Lomax distribution.
The characteristic of the accelerated life test is to put the products under the stress which is higher than normal.After obtaining the failure data,the life characteristics of the product under normal stress level are obtained by using the relationship between the product life and the stress level.In fact,the relationship between product life and stress level is not always known.In this case,partially accelerated life test can be considered.Statistical analysis of partially accelerated life test does not require accelerated models.It transforms the life from high stress level to normal stress level by means of acceleration factor,and then the statistical analysis is carried out.Partially accelerated life test has been applied to reliability statistical inference in recent years.In the test scheme,type-I censoring,type-II censoring,progressively type-II censoring and hybrid censoring are generally adopted.For these traditional censoring tests,the theoretical research system is relatively mature,and there are many related results.
In this paper,we are concerned with the statistical inference of constant-stress for Lomax distribution based on the interval censored samples.
The rest of this paper is organized as follows.In Section 2,the Lomax distribution is introduced as a failure time model and the test method is also described.In Section 3,we discuss the maximum likelihood estimation of the parameters.In Section 4,the iterative formulas for the unknown parameters are obtained by using the EM algorithm.In Section 5,we calculate the Fisher information matrix according to the lost information principle.Numerical simulations are carried out in Section 6.Concluding remarks and further studies are given in Section 7.
§2.Basic Assumptions and Model Description
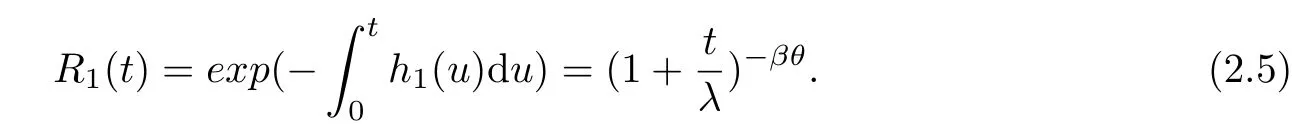
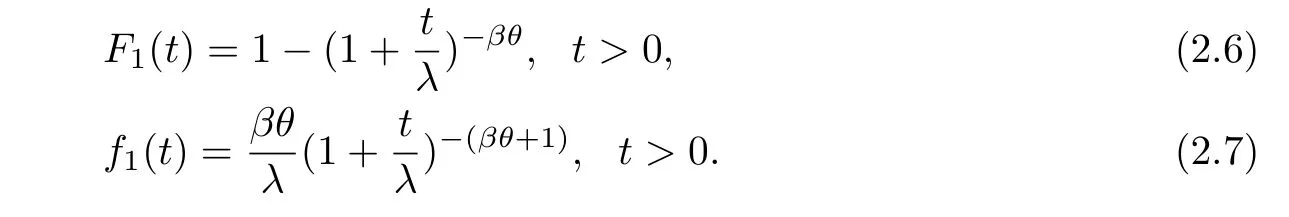
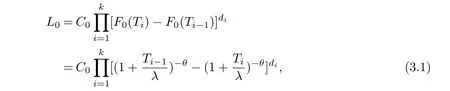
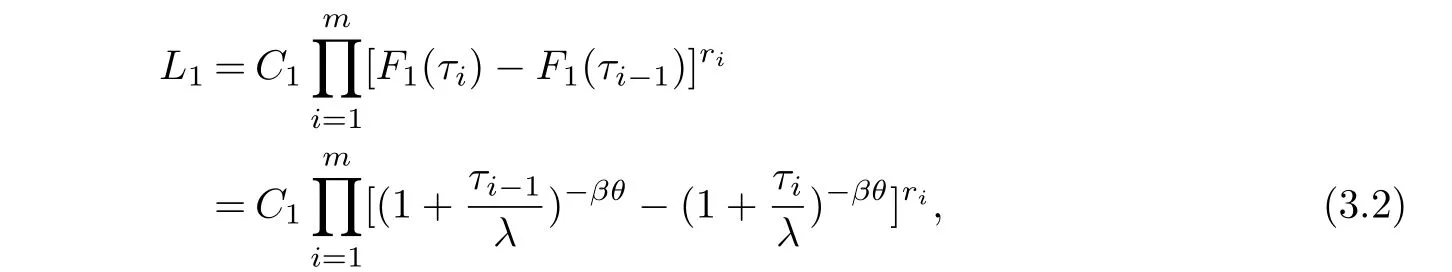
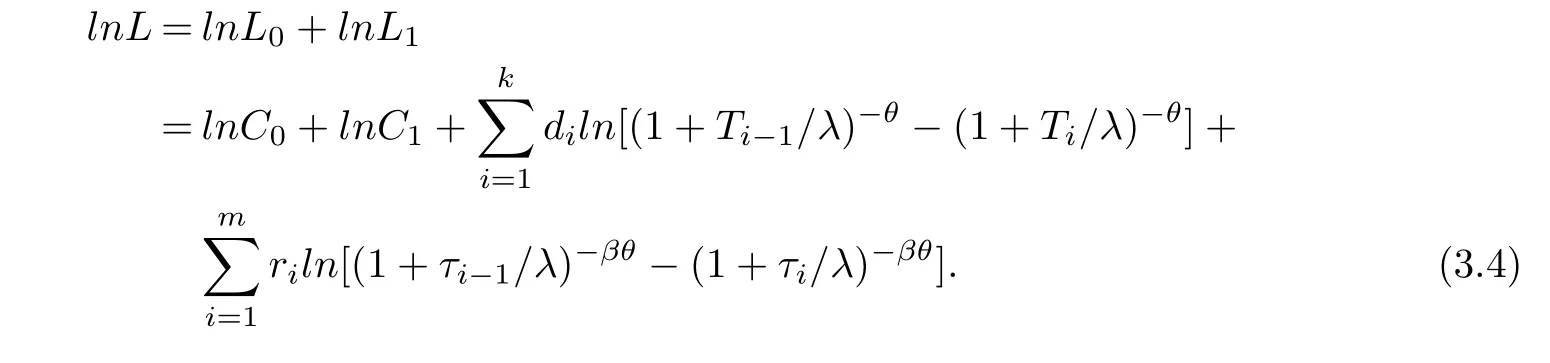
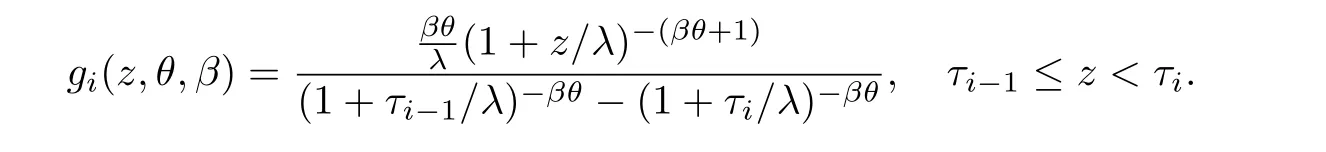
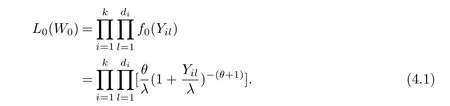
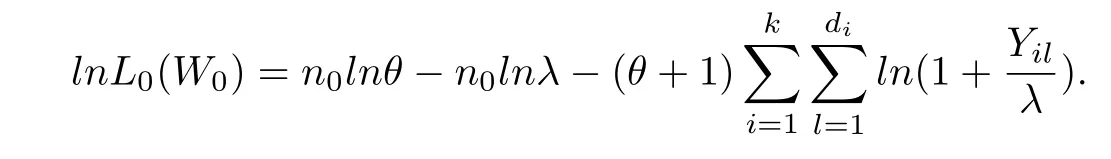
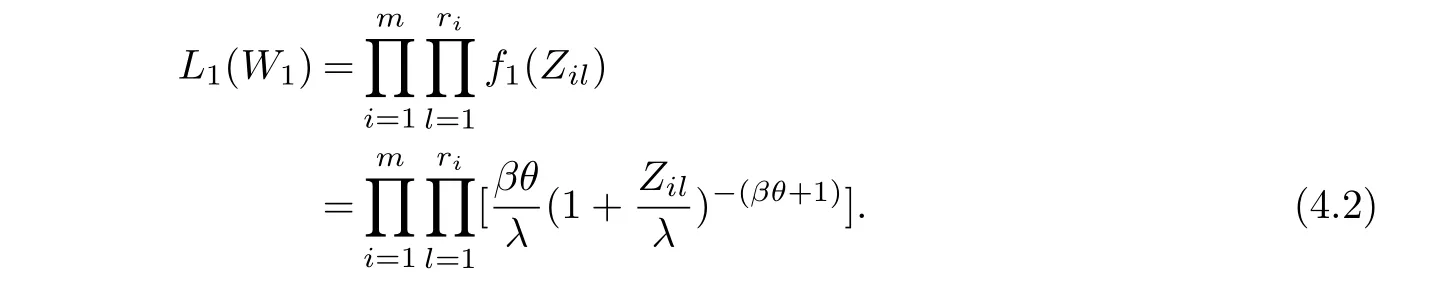
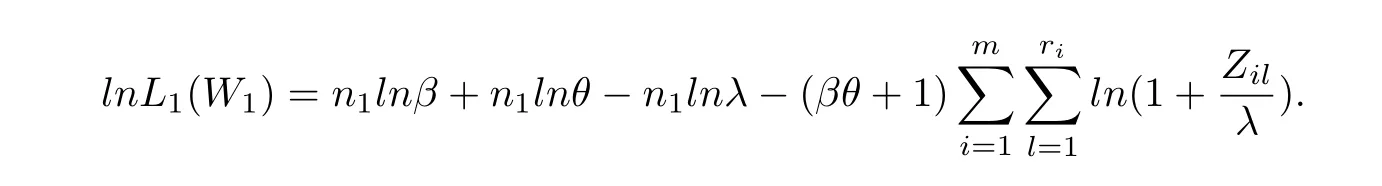
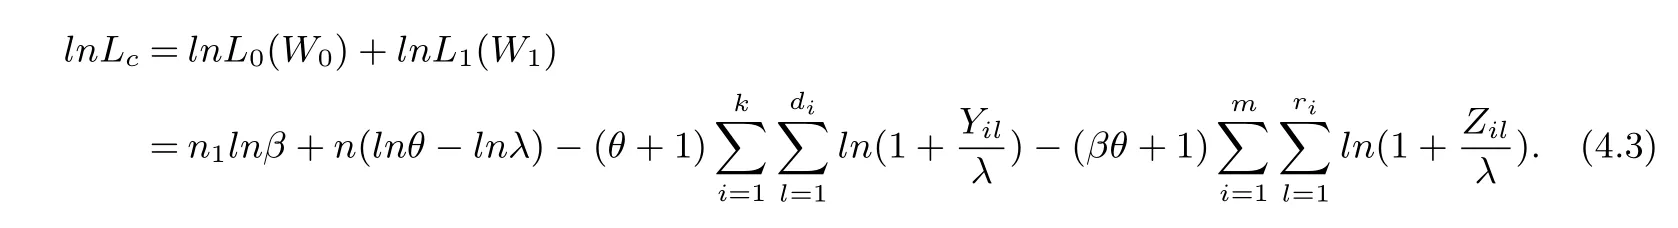
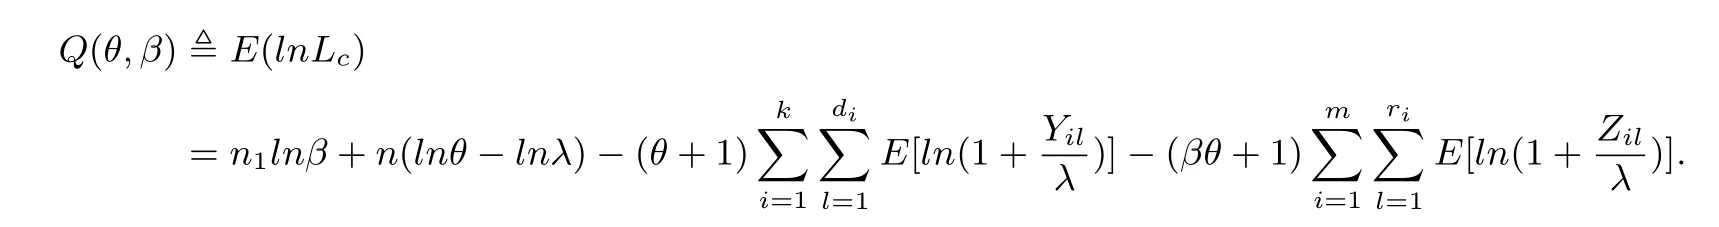
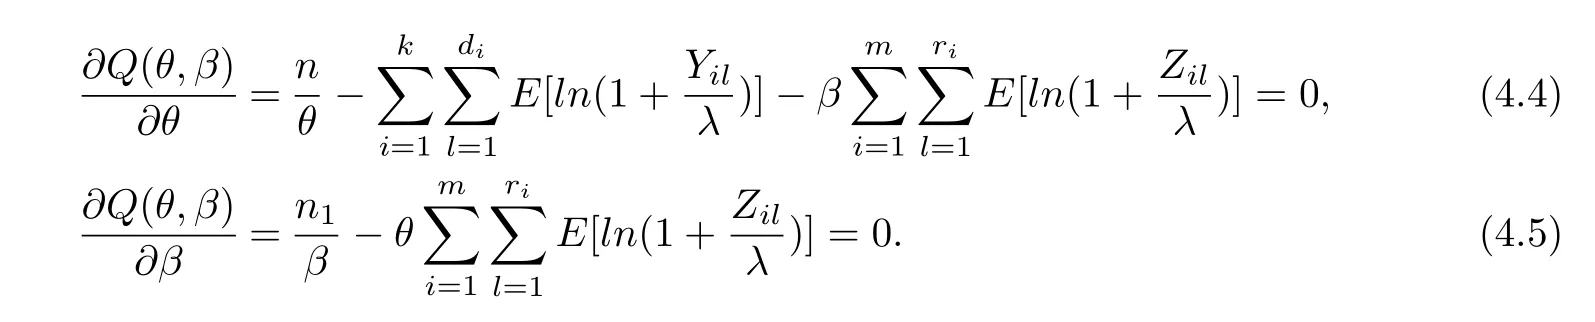
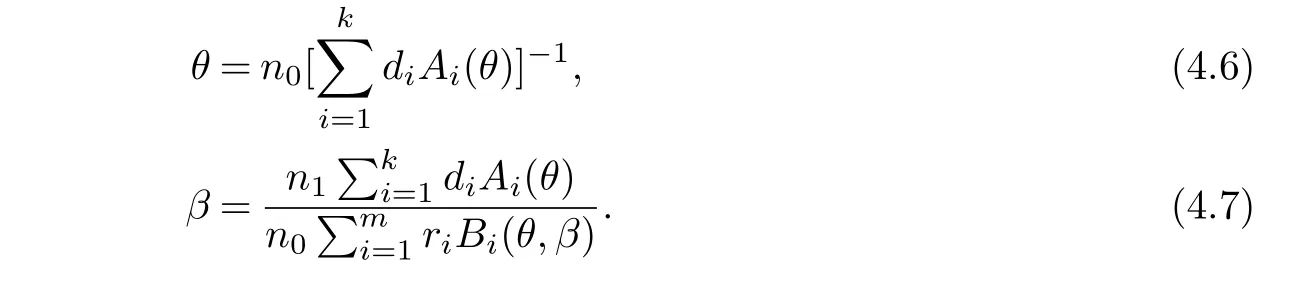
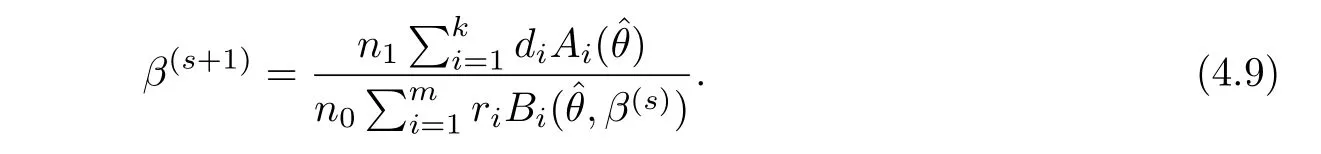
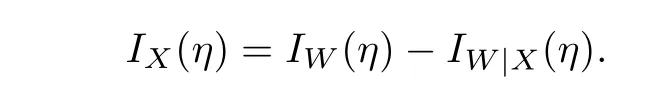
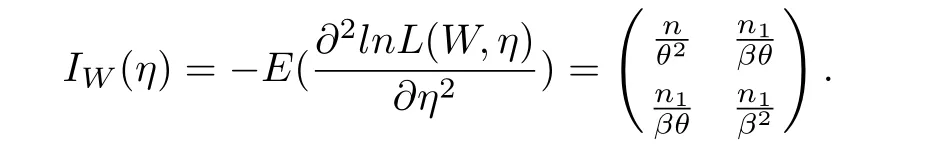
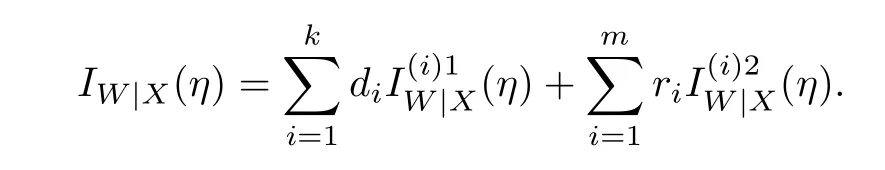
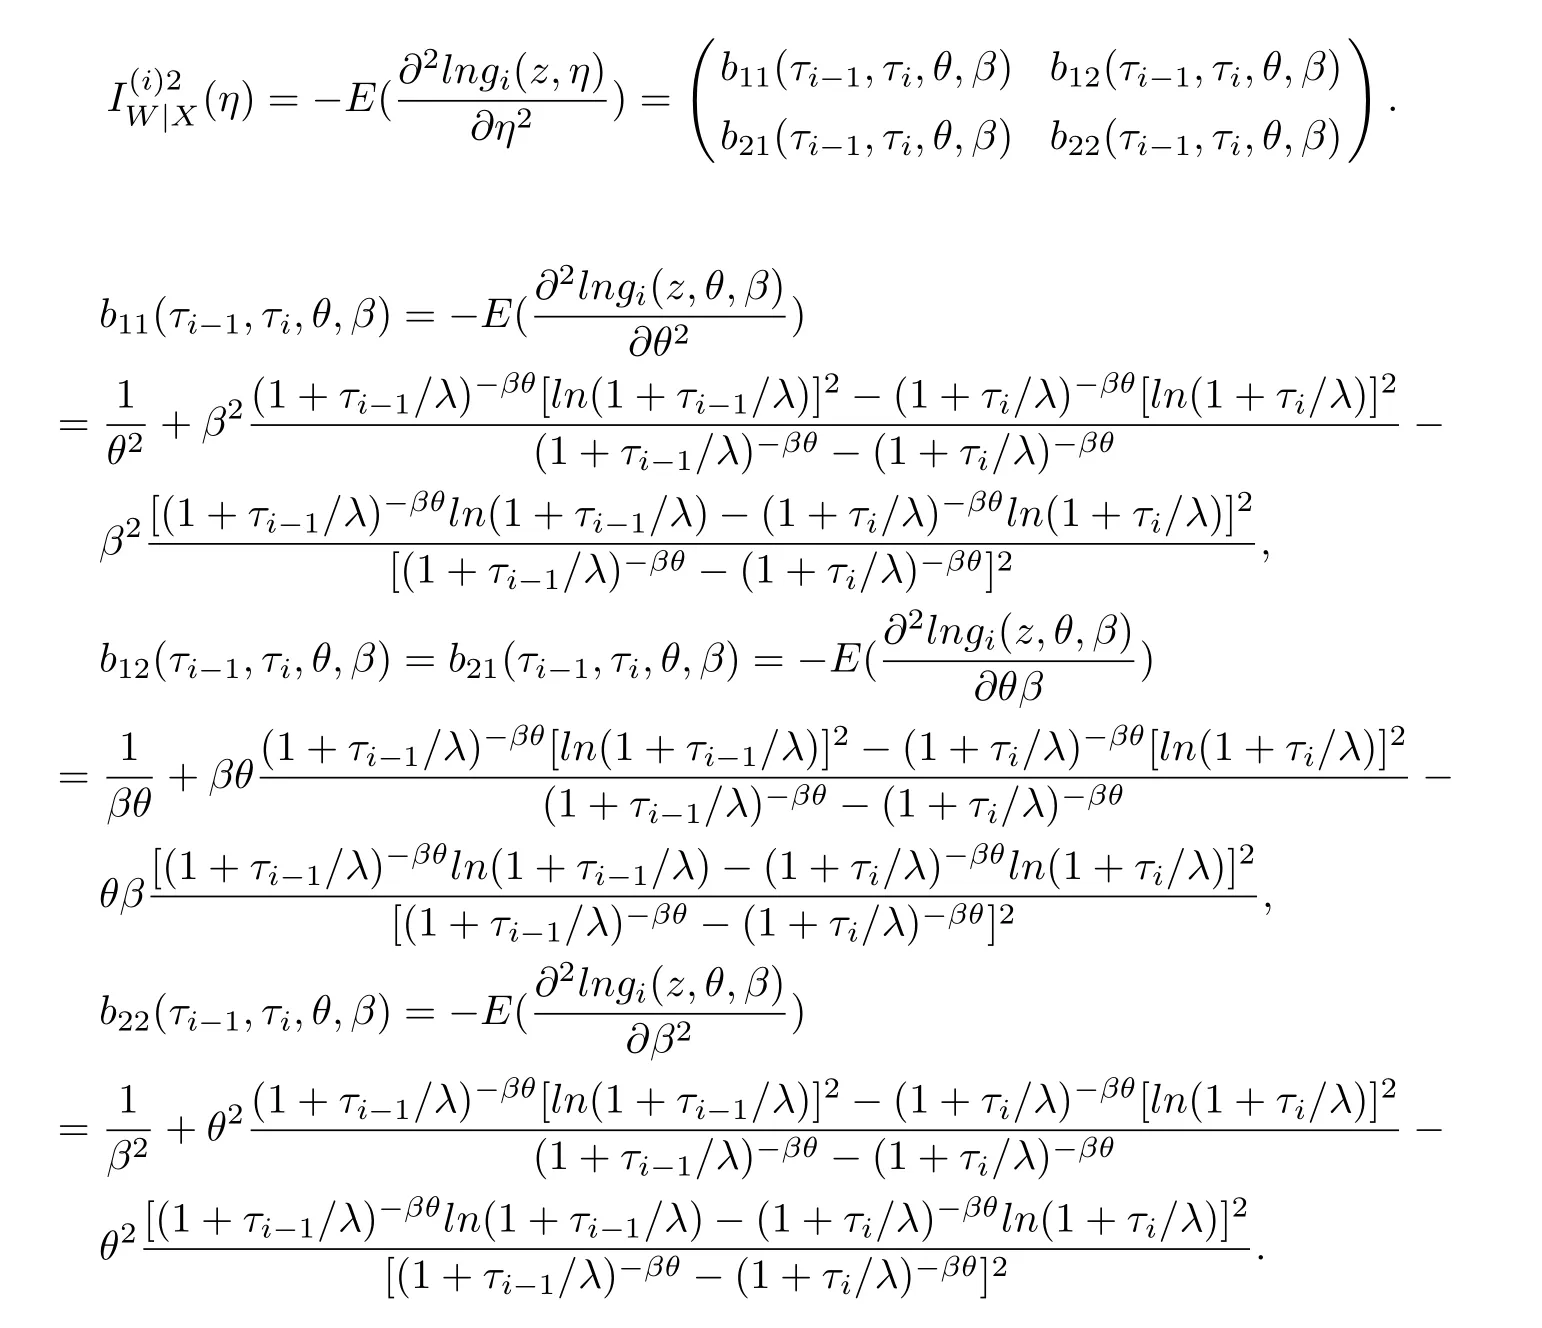
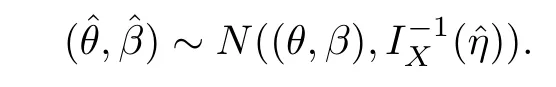
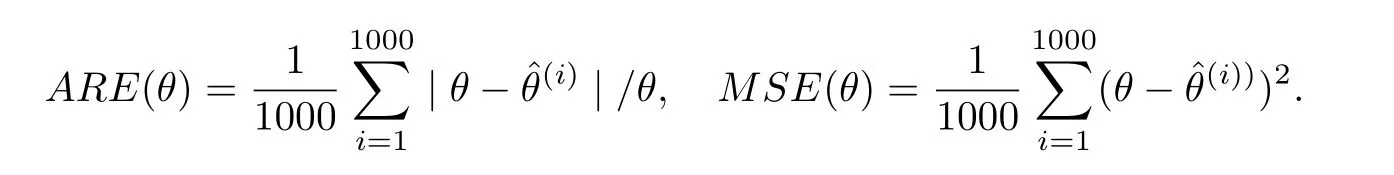
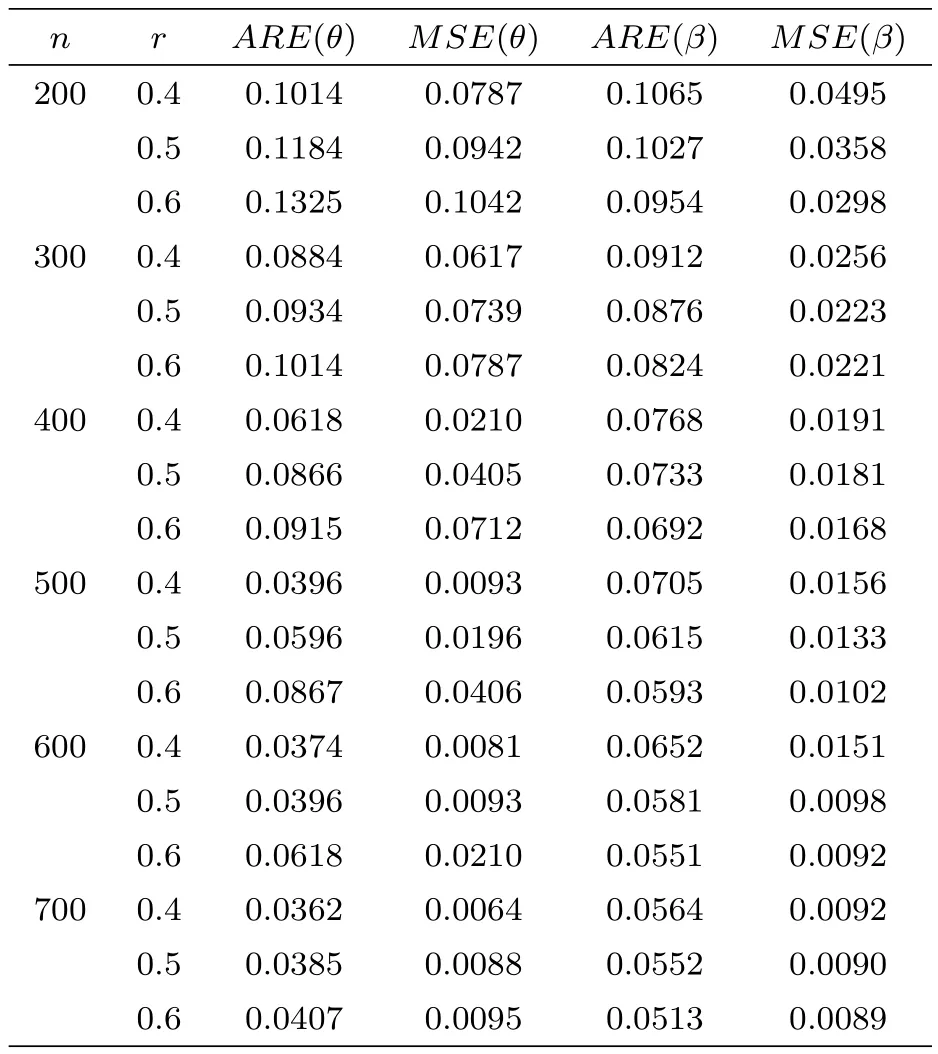
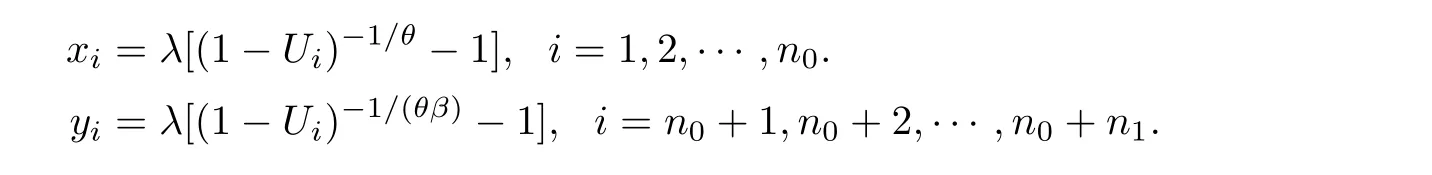
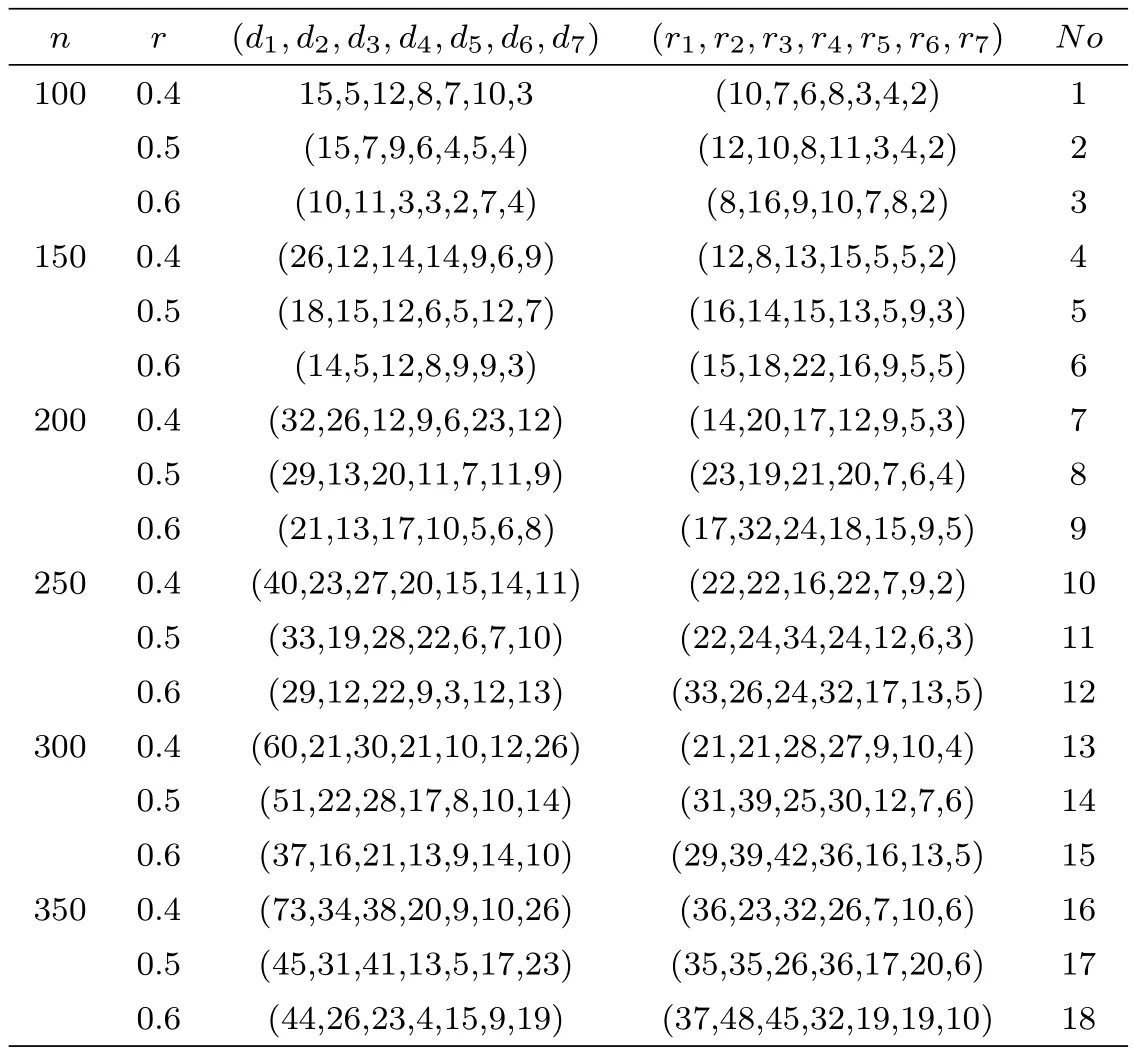
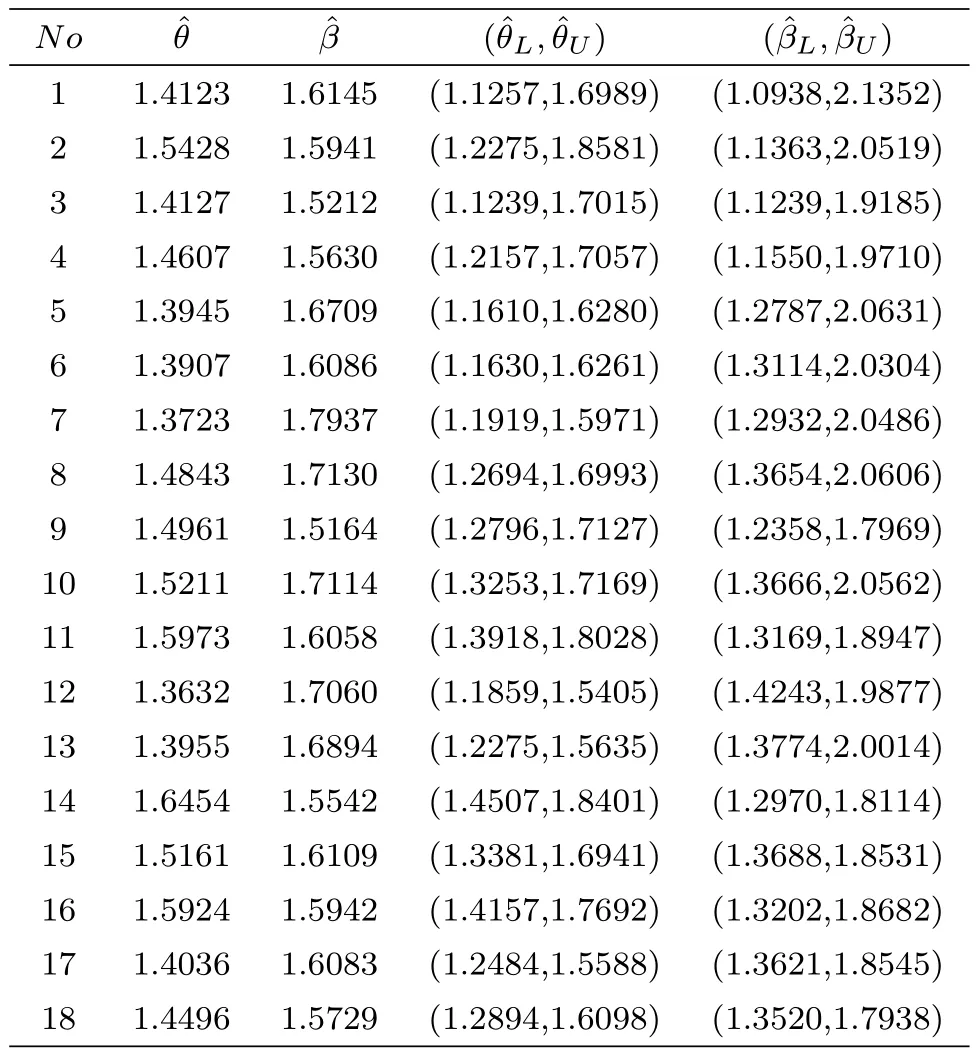
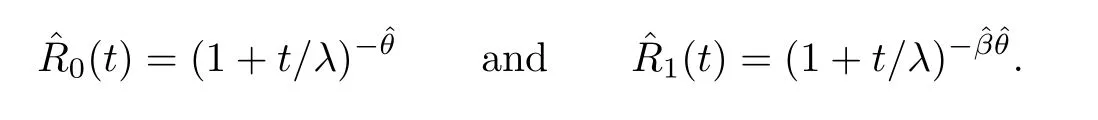
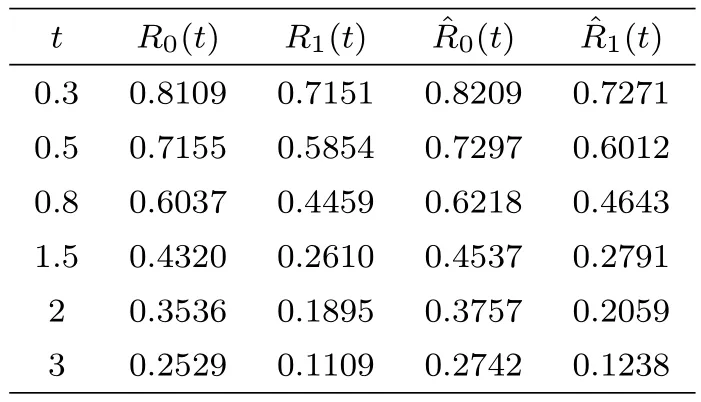
The test is carried out under 2 stress levels S0 (1)Under stress level S0,the failure time of products follows Lomax distribution,and its distribution function,density function and failure rate function are respectively here,λ>0,θ>0 they are called scale parameter and shape parameter,respectively.In this paper,we assume that the scale parameter is known. (2)Under stress level S1,the failure rate function of the products is where β(β >1)is acceleration factor. According to the relationship between failure rate function and reliability function,the reliability function of the products is Furthermore,the distribution function and density function of failure time for the products under stress level S1are obtained respectively as follows: Experimental model of partial acceleration life for constant-stress under interval censoring can be described as follows:selecting n0=n(1−r),(0 Under stress level S0,the time 0=T0 Under stress level S1,the time 0= τ0< τ1< ···< τm−1< τm=+∞ of observation were predefined,we found that risamples had failed in the interval[τi−1,τi)(i=1,2,···,m)at the time of observation τi. Next,we will make statistical analysis based on the above observed data. According to the previous model and life test scheme,the likelihood function of failure sample under stress level S0is where C0>0,and it has nothing to do with the parameter θ. While,the likelihood function of the failure sample under stress level S1is where C1>0,and it has nothing to do with the parameters θ,β. Therefore,at the same time,the life tests are carried out under two stresses S0and S1,the full likelihood function is given by The logarithmic likelihood function is obtained by taking logarithms on both sides of equation(3.3). The explicit expressions of θ and β cannot be obtained from the equations(3.5-3.6). Newton-Raphson method does not converge in some cases.EM algorithm is a good way to deal with missing data.Next,we use EM algorithm to estimate the parameters. Under stress level S0,denote Y=(Y1,Y2,···,Yk),Yi=(Yi1,Yi2,···,Yidi),and Yi(i=1,2,···,k)are vector representing the failure time of test products in intervals[Ti−1,Ti)(i=1,2,···,k),because there are no specific value.Therefore,they are regarded as missing data. In the same way,under stress level S1,we denote Z=(Z1,Z2,···,Zm),Zi=(Zi1,Zi2,···,Ziri),and Zi(i=1,2,···,m)are vector representing the failure time of test products in intervals[τi−1,τi)(i=1,2,···,m). According to the conditional density formula,the probability density function of Yil(l=1,2,···,di)can be obtained by The conditional density functions of Zil(l=1,2,···,ri)are Let W0=Y,W0is called the pseudo complete data under stress level S0.Based on pseudo complete data,the likelihood function is Its logarithmic likelihood function is Let W1=Z,W1is called the pseudo complete data under stress level S1.Based on W1,the likelihood function is The logarithmic likelihood function of equation(4.2)is At the same time,the life tests are carried out under two stresses S0and S1,the full likelihood function is given by The logarithmic likelihood function is Step E The expectation of(4.3)is Step M In order to maximize Q(θ,β),the first partial derivatives of θ and β are obtained by θ and β can be solved from the equations(4.4)and(4.5). Because Therefore According to the equation(4.6),the iterative formula of θ can be obtained by The final estimation of the parameter θ can be obtained after several iterations by using the equation(4.8),and it is denoted asˆθ. According to the equation(4.7),the iterative formula of β can be obtained by The final estimation of the parameter β can be obtained after several iterations by using the formula(4.9),and it is denoted asˆβ. The Fisher information matrix reflects a characteristic of the population distribution.It plays an important role in theoretical research of parameter estimation.In order to solve the problem of parameter estimation under incomplete data,Louis[16]put forward the lost information principle to calculate Fisher information matrix.Its basic principles are Denote η =(θ,β),W=complete data,X=observation data,IW(η)=complete information matrix,IX(η)=observation information matrix,IW|X(η)=lost information matrix.Thus,observation information matrix is In the case of complete data,the complete information matrix is given by Lost information matrix is given by The Fisher information matrix is calculated for the observational interval[Ti−1,Ti). The Fisher information matrix is calculated in the observational interval[τi−1,τi). The maximum likelihood estimations of the parameters asymptotically follow two-dimensional normal distribution.Its expectation is(θ,β),and covariance matrix is,whereis an inverse matrix of the observational information matrix. So Therefore,the asymptotic confidence intervals of the parameters θ and β with confidence level 100(1-γ)%can be obtained,respectively where U11and U22are the main diagonal elements of the covariance matrix,Zγ/2is the upper(γ/2)th percentile of a standard normal distribution. In this part,simulation studies are conducted to demonstrate the theoretical results of the estimation problem.The relative error and mean square error are used to discuss the properties of estimation results about shape parameter and acceleration factor,here In addition,the asymptotic covariance matrix of shape parameter and acceleration factor are obtained,and their 95%confidence intervals are also given. Table 1 Relative deviation and mean square error of the parameters The simulation process is as follows: Step 1 Designate the values of n and r. Step 2 Designate(λ,θ,β)=(5,2,1.5). Step 3 An independently and identically distributed sample(U1,U2,···,Un)is generated,and this sample follows uniform distribution U(0,1).Let Therefore,(x1,x2,···,xn0)and(yn0+1,yn0+2,···,yn0+n1)are 2 samples from the distribution functions(2.1)and(2.6),respectively. Step 4 Given observation point(T0,T1,···,T6,T7)=(0,0.5,1,2,3,4,7,+∞),(τ0,τ1,···,τ6,τ7)=(0,0.2,0.5,1,2,3,7,+∞),obtain the interval censored samples. Step 5 Based on the above interval censored samples,using the formulas(4.8-4.9)to calculate the maximum likelihood estimation of the parameters θ and β,respectively. Step 6 Step 3-5 are repeated 1000 times,and the relative deviation and mean square error of the two parameters are calculated. Step 7 The above process is repeated under di ff erent n and r,and the relevant data are listed in Table 1. Step 8 Designate λ =2,θ=1.5,β =1.6,18 interval censored samples are generated under di ff erent n and r,which are listed in Table 2. Step 9 Point estimations and 95%confidence intervals of the parameters θ and β are calculated,and the corresponding results are listed in Table 3. Table 2 Interval censored samples As we can see from Table 1,when n is fixed,average relative errors and mean square errors of the maximum likelihood estimations about the parameter θ increase gradually with the increase of r,however average relative errors and mean square errors of the maximum likelihood estimations about the parameter β decrease gradually.When r is fixed,average relative errors and mean square errors of θ and β decrease gradually with the increase of n,which shows that the maximum likelihood estimations have the properties of consistency and asymptotic normality. Table 3 Point estimations and 95%confidence intervals of θ and β From Table 3,we can see that the true values of parameters are located within the confidence intervals.With the increase of sample size n,the length of confidence intervals decreases correspondingly. The estimation of reliability function is an important problem in the theory of reliability.Weibull,Burr-XII,Pareto and Rayleigh distribution are quite suitable models in most practical applications and life testsmany scholars have estimated the reliability functions for these distributions.Next,we will give the estimation of the reliability function on Lomax distribution.According to the equations(2.1)and(2.5),the estimation of the reliability function under stress levels S0and S1are given respectively by Using the sample number 1 in Table 2,we get the estimation valuesˆθ=1.4123ˆβ=1.6145.For di ff erent t values,the estimations of the reliability function are given,and they are listed in Table 4 together with true values of reliability. Table 4 Estimation of reliability under di ff erent stresses Due to the high reliability of many products,it usually takes a long time to test under normal condition.Therefore,the reliability of the tested units can be estimated in a relatively short time when accelerated life test or partially accelerated life test is performed. In this paper,we discuss the maximum likelihood estimations of shape parameter and acceleration factor on Lomax distribution when the data come from partially accelerated life test.In fact,explicit expressions for maximum likelihood estimation of parameters cannot be obtained.Therefore,we use EM algorithm to get the estimated values of parameters by iterative formulas.The approximate confidence intervals of the parameters are obtained through the asymptotic distribution of the maximum likelihood estimation.The properties of estimation are discussed from the aspects of average relative error and mean square error based on Monte Carlo simulation.The property of estimator is better when the sample size is large.In addition,the reliability analysis of Lomax distribution for partially accelerated life test is a problem worthy of further research when the scale parameter is unknown.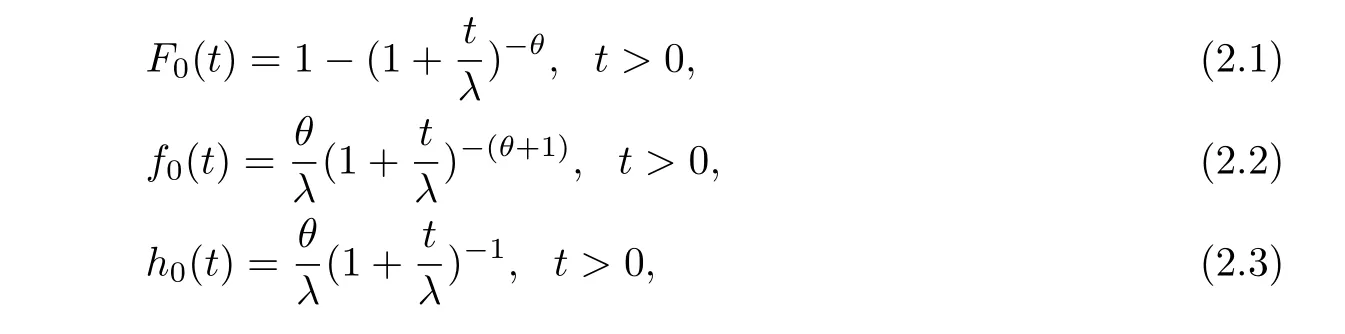

§3.Maximum Likelihood Estimations

§4.Maximum Likelihood Estimations Based on EM Algorithm


§5. Fisher Information Matrix


§6.Numerical Simulation
§7. Conclusions
 Chinese Quarterly Journal of Mathematics2019年1期