Analysis of OSA Syndrome from PPG Signal Using CART-PSO Classifier with Time Domain and Frequency Domain Features
N.Kins Burk Sunil ,R.Ganesan and B.Sankaragomathi
Abstract: Obstructive Sleep Apnea (OSA) is a respiratory syndrome that occurs due to insufficient airflow through the respiratory or respiratory arrest while sleeping and sometimes due to the reduced oxygen saturation.The aim of this paper is to analyze the respiratory signal of a person to detect the Normal Breathing Activity and the Sleep Apnea (SA) activity.In the proposed method,the time domain and frequency domain features of respiration signal obtained from the PPG device are extracted.These features are applied to the Classification and Regression Tree (CART)-Particle Swarm Optimization (PSO) classifier which classifies the signal into normal breathing signal and sleep apnea signal.The proposed method is validated to measure the performance metrics like sensitivity,specificity,accuracy and F1 score by applying time domain and frequency domain features separately.Additionally,the performance of the CART-PSO (CPSO) classification algorithm is evaluated through comparing its measures with existing classification algorithms.Concurrently,the effect of the PSO algorithm in the classifier is validated by varying the parameters of PSO.
Keywords:Obstructive sleep apnea,photoplethysmogram signal,time domain features,frequency domain features,classification and regression tree classifier,particle swarm optimization algorithm.
1 Introduction
With recent innovations,the computer-based analysis of signal is concerned with copious attention over the wide range of applications in the medical field,military purposes,industrial fields and others.A signal processing is mainly considered in the field of medical science for diagnosing the patients;the brain-computer interface assembly takes a vital role.Many equipments are available for generating signals from the human being for different purpose.In this paper,the respiratory signals of the human beings are analyzed to determine the respiratory syndrome.The chief goal is to detect the sleep apnea disease affected person’s by analyzing PPG signals.There are many kinds of respiratory disease that affects the people with all age groups.To detect the health of the respiratory system of a human being,a breathing sound should be observed [Bhoi,Sarkar,Mishra et al.(2012)] to sense the changes occurred in the sound.Simultaneously the type of disease could be identified from the characteristics of the sound like pitch,frequency,time period,amplitude,etc.[(Sara,Sarah,Stefan et al.(2014)].The presence of noise artifacts in the instruments are employed for the purpose of analyzing the changes in the breathing sounds which disturbs the system accuracy and the body movement changes also leads to effect of artifacts.Therefore these features must be eradicated prudently to perform accurate analysis.The effective computerized techniques are proposed for this purpose.Initially the computer-based analysis of breathing sound is presented by Pasterkamp et al.[Pasterkamp,Kraman and Wodicka (1997);Earis and Cheetham (2000)].The sound signals obtained from the instrument are usually analog and it should be transformed into digital form through the preprocessing techniques.Then the respiratory signals are labeled based on the features using a suitable classification algorithm.Obstructive sleep apnea (OSA) is a syndrome caused by the impulsive fall in air flow when a person sleeps and it is observed due to decrease in the oxygen saturation [Gutta,Cheng,Nguyen et al.(2018);Hassan (2016)].
OSA is a condition for the serious disorders like cardiovascular disease,stroke,fatigue which decreases a cognitive function and extend of day time sleepiness.Sleep Apnea is repetitive disorder of the upper side air pipes during sleeping.Hence oxygen desaturation and frequent awakening happens.A patient affected by sleep apnea may break off breathing for a small moment [Rekha,Kandaswamy and Ramanathan (2018)].It may persist for 10 seconds to 1 minute;then breathing continues again;this event occurs few times or many times while sleeping.Some other health risks such as high blood pressure,heart attack,obesity and diabetes are caused by OSA.OSA syndrome can be treated by reducing airway block and intensifying the amount of oxygen in the body.To analyze OSA,a typical device called Polysomnography (PSG) [Daurai,Nayak and Mudhalwadkar (2017)] is generally employed.It manipulates several factors like eye activities,heart rate,skeletal muscle activation,airflow,blood oxygen saturation and respiratory effort with the help of sensors.It involves more cost and labor.Electrocardiogram (ECG),Electroencephalogram (EEG),Electromyogram (EMG) data are also employed in this device to detect the respiration diseases.In ECG device,it is required to fit many electrodes on the skin to monitor the patient for a long time.The PSG device monitors oral-nasal airflow,blood oxygen saturation and chest-abdominal breathing and body position.Polygraphic is a method used for detecting OSA and recognized because of its economic advantage [Kins Burk Sunil,Ganesan and Sankaragomathi (2018)].EEG,EOG,and EMG data are not encompassed in this method.The signals obtained from polygraphy and PPG tool are similar to each other where the recorded signals are spotted.The Apnea Hypopnea Index (AHI) is calculated from the diagnosis and the respiratory signal is labeled as normal or sleep apnea.Anyhow there are some limitations in the PSG method such as the requisite of a knowledgeable technician,utilization of many electrodes and a laboratory preparation.The combined usage of Pulse oximetry device with Infrared (IR) video monitoring is an approach which seems to be economically high.The rough sections of the pulse oximetry indication are examined by the medical doctor and it is diagnosed through scrutinize the recorded IR video.However,in this method the doctor’s assignment is more.
In this work,the CPSO classification algorithm is presented and implemented in analyzing the respiratory signals to detect the manifestation of sleep apnea signal.The features from the classification algorithm are explored by employing the time domain and frequency domain features.The consequence of the extracted features for the classification performance is also exemplified in this work through the simulation results.The realization of the CPSO classification algorithm is performed to detect the respiratory syndrome.The existing works that reveals for diagnosing the sleep apnea disease and the features extraction in PPG signal are deliberated in the subsequent section.The proposed methodology with dataset used,preprocessing stage,feature extraction stage,classification stage is elucidated in Section 3.Section 4 portrays the implementation of the proposed method for detecting OSA and the performance metrics for each setting to validate the effectiveness of the proposed system.
2 Related works
Blood oxygen saturation (SpO2) signals to detect sleep apnea using neural network as a prognostic tool [Almazaydeh,Elleithy,Faezipour et al.(2013)].The goal of this work was to identify the sleep apnea presence through an automated approach on the basis of acoustic signal of respiration.The breathing sound was observed by Voice activity detection algorithm to find the acoustic respiratory signal energy while breathing and breathe hold.This paper determines the efficiency of VAD based energy by differentiating the apnea in breathing signal and the accuracy was high.Anyhow there are some limitations in real time detection which will be improved and attuned through the use of calibration procedures in FPGA.A novel [Deng,Wang,Sun et al.(2013)] approach for assessing the efficiency of stage matched intervention by observing Continuous Positive Airway Pressure (CPAP) with obstructive sleep apnea syndrome.This paper not only improves the intention formation but also enhance the treatment selfefficacy.There are some limitations such as implementation intricacy.Thus to improve this work the further enhancement will be carried out for better performance.
A new approach for OSA detection based on the ECG was implemented [Song,Liu,Zhang et al.(2016)].In this work to overcome the limitations present in the existing work the proposed technique of HMM hidden Markov model was implemented.This proposed work was mainly used to deliberate the temporal dependences of the segmented signal which leads to critical information loss.This paper achieves better sensitivity and specificity when compared to other existing approaches.In this approach there were some limitations which will recover to improve the accuracy after deep analysis of this method.The novel approach was focused mainly to detect the elbow gesture using EMG signals [Altın and Er (2016)].The filtering was done in EMG signals to eliminate the noise and it is essentially needed.The feature extraction was carried out for the wrist flexion and extension cases and from this features the classification was done with the hand movements based on the K nearest neighbor algorithm.This paper acquires better accuracy and its ability of classification technique was good than other research.There are some limitations like only monitoring of nerve roots and troubles from the neighborhood while surface electrodes are used.
Yang et al.[Yang and Li (2013)] used classification algorithm on the basis of decision tree for remote sensing image.This paper provides the source of 2010 satellite images of SPOT and TM fusion.The module of Rule Gen was used to optimize the classification method related to decision tree.The proposed method achieves better than other existing classification method.
Lázaro et al.[Lázaro,Gil,Deviaene et al.(2017)] modulated the 5 PPG-derived series and analyzed for the detection of obstructive sleep apnea.The outcomes shown the accuracy of 72.66% which is signifying the analyzed aspects are guaranteed the superior discovery of OSA from the signal of PPG.These outcomes have been recommended that the examined characteristics are hopeful for the perception of OSA from NB utilized only the PPG signal.Furthermore review in future has to be enlarged to progress the +P at the same time it has to evaluate the performance while investigating another pulmonary proceedings for example obstructive hypopnea and central also the mixed apnea/hypopnea.
Gutiérrez-Tobal et al.[Gutiérrez-Tobal,Alonso-Álvarez,Álvarez et al.(2015)] assessed a novel method for the pediatric OSAS diagnosis to decrease the problems associated with the state-of-the-art methods.The validation of the results is carried out by the bootstrap organization.In this work at home observation the airflow and the oxygen saturation is recorded for nearly 50 children.These innovative bands are reliable for the attainment of posterior respiratory and apneic events respectively.The combined information of spectrum from two innovative AF bands along with the ODI3 from SpO2 was beneficial for the diagnosis of OSAS in children.
In Aydore et al.[Aydore,Sen,Kahya et al.(2009)] the distinct features were extracted from the windows.The windows were labeled as wheeze and non-wheeze by an expert through visual analysis.Then,supervised classification was applied to calculate training and test errors.The proposed method is efficient when compared to other existing technique.A new approach was designated to facilitate the classification of sleep apnea syndrome with the help of wavelet transform and an ANN [Emin Tagluk,Akin and Sezgin (2010)];multi-resolution wavelet transform was used for separating the respiration signal as spectral components signals and then it was applied to inputs of ANN.Thus the neural network was organized to provide the output for classifying the patient’s situation.From the classification it was analyzed as OSA,CSA and MSA.The OSA was identified when there was a respiratory effort.
In Chang et al.[Chang,Huang,Chen et al.(2014)] Flexible Projected Capacitive Sensing Mattress (FPCSM) is presented to evaluate the health of the person.In this approach the projected capacitive sensing capability was used which is more efficient than other because it was not attached to the body.The FPCSM was not only used to monitor the gesture and moving behaviors;it was also screen the breathing condition while sleeping.To enhance this approach the optimal signal electrodes were selected when the channel reduction algorithm was conducted that meets the hitches occurring in the capacitive sensing signals.This proposed approach provides better feasibility than other due to its multiple synchronous measurements for different position of the body.
In Mendez et al.[Mendez,Ruini,Villantieri et al.(2007)] a video monitoring method is employed to detect OSA.They obtained video of sleeping event of a person and using a motion model,they detected the normal and abnormal respiration signals from the video.It does not require that the patient should sleep in a particular position.Moreover the performance is not affected by the camera lighting amount and camera position.A new novel approach was employed to select the informative features automatically for classification accuracy and also no necessities for the prior collection of features [Ghamisi and Benediktsson (2015)].This approach was mainly based on the incorporation of particle swarm optimization and genetic algorithm to acquire an efficient results;fitness value was taken from the support vector machine classifier where the samples with whole accuracy was presented.The proposed method was capable to discern among the road and background pixels which provides better performance metrics than other.Anyhow there are some drawbacks in PSO algorithm with optimization.Reşit Kavsaoğlu et al.[Reşit Kavsaoğlu,Polat and Recep Bozkurt (2014)] intended in utilizing Photoplethysmography (PPG) signal and the time signals for biometric authentication.
3 Proposed methodology
The various steps used in the proposed work are illustrated in Fig.1.The patient details,number of patients and the number of samples taken for each patient are given in Tab.3.The breathing signals of the patient obtained from the PPG device contain environmental noise artifacts.

Figure 1:Work flow of the proposed methodology
Initially the pre-processing stage is performed to remove the noise artifacts.Then,from the pre-processed signal,the time domain features and the frequency domain features are extracted by using suitable techniques.Then the extracted features are applied to the training feature set and testing feature set of the CPSO classification algorithm.Then the signal is labelled as Normal signal and SA signal according to the features.
3.1 Data set
The data set for this work is obtained from the Gowtham Hospital of Udumalaipet,Tamilnadu,India.The dataset was obtained from five patients,including two female patients and three male patients,by placing the electrodes in the abdominal area to record the PPG signals.Among them,two are normal persons and three of them were affected by sleep apnea.The signals were obtained from the patients throughout the night.The PPG signal is recorded at the sampling frequency of 128 Hz.The patients are let to sleep for around 7-8 hours while recording the PPG signals.Along with the PPG device,digital filters were employed to remove any artifacts and noise aroused due to the body movement and environmental factors.The PPG signal for normal respiration and sleep apnea is demonstrated along with their mean amplitude.The difference between these mean values is significant and it is observed that the mean amplitude of normal signal is higher than that of sleep apnea signal.The spectral density of these two signals is computed from the periodogram.It is inferred that the frequency component of the normal signal is predominant.
After recording the PPG signals,the signals were analyzed by the doctors according to the respiration scoring.Based on the doctors information,the PPG signals are saved for normal patients and as well as patients affected with sleep apnea during respiration arrest.Totally,1234 samples were obtained from five persons;among them,512 samples are of normal signals,and 722 samples contain sleep apnea.
3.2 Preprocessing stage
The signal obtained from the PPG device should undergone for pre-processing operation since it has several artifacts such as Massive baseline drift,Motion artifacts,Instabilities aroused by breathing activity,Instrumental noise artifact and Environmental noise artifact.The operations involved in the pre-processing stage are depicted in Fig.2.

Figure 2:Pre-processing steps
To take away baseline artifacts,moving average filter is taken in the proposed system.This filter is operated as high-pass filter to cart off the baseline from the higher frequency signal.The moving average filter works as follows.The recorded PPG signal is considered as a set of data samples.A moving average is computed from this signal by computing average of two or more samples from the set and replacing the first data sample by the average sample.This process is repeated for the consecutive sets until the end sample.The number of samples generated new data waveform matches the original signal.The equation of computing the moving average of a waveform is given in Eq.(1).

where a(s) denotes the averaged signal,s denotes data samples,ζ denotes smoothing factor and i(s) denotes original data samples.
Then the noise artifacts are removed by using the digital FIR Band pass filter with a cutoff frequency in the range of 0.01-40 Hz.
The noise-removed signal is passed to a differentiator to develop the first order and the second order derivative signals as given in the Eqs.(2) and (3).

3.3 Feature extraction
The feature extraction takes a key part in the classification of the respiratory signal.In this work,the significance of Time Domain (TD) features and Frequency Domain (FD) features of the PPG signal for the diagnosis of respiration disease is studied.The method of extraction of TD and FD features are illustrated in this section.
3.3.1 Time domain (TD) features
From the pre-processed PPG signal,21 time domain features are extracted as given in Tab.1.In the same way,eight TD features are extracted from the first derivative and seven features from its second derivative.Further,four features are obtained from first and second derivatives of the signal shown in Tab.2.
In the original PPG signal,the systolic peak,diastolic peak and dicrotic notch values are taken into an account as shown in Fig.3.In the first and the second derivatives of the PPG signal,there are first peak and first pit points before the systolic peak,which are denoted in Fig.4 as a1 and b1 respectively for the first derivative and as a2 and b2 for the second derivative signal.

Table 1:Characteristic features of PPG signal in time domain [Reşit Kavsaoğlu,Polat and Recep Bozkurt (2014)]
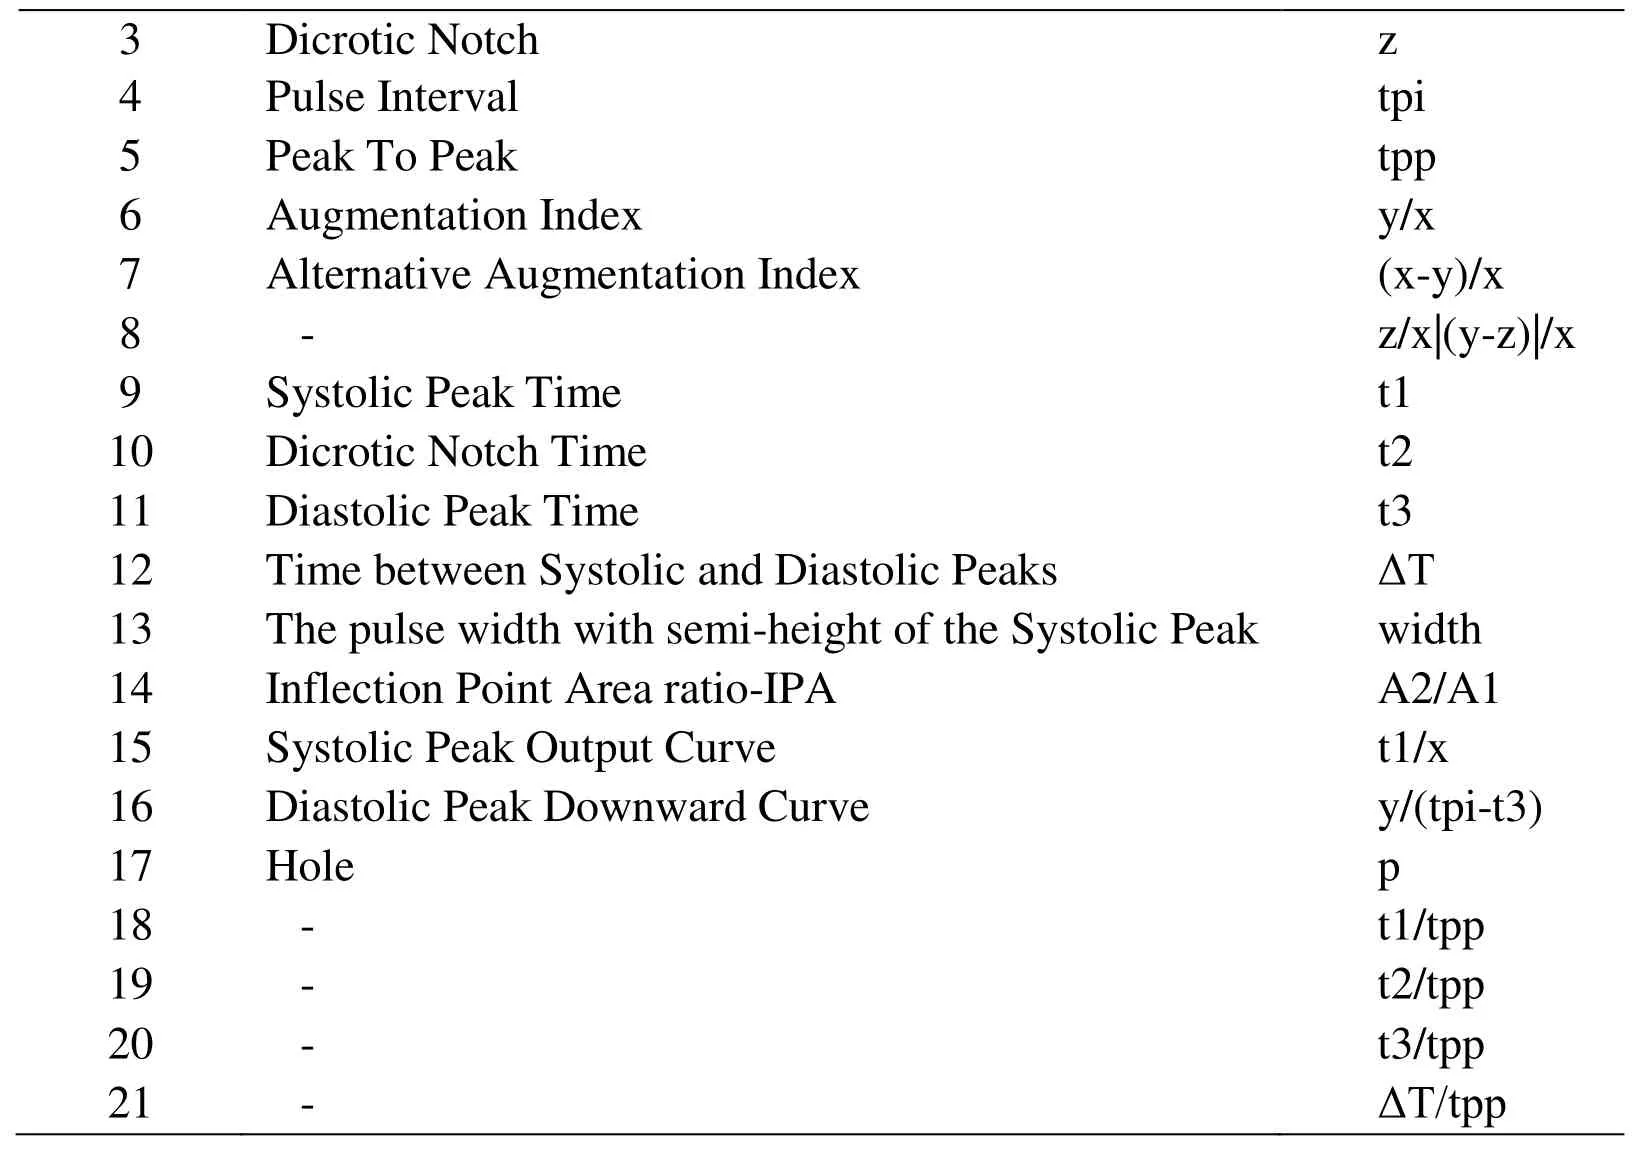
3 Dicrotic Notch z 4 Pulse Interval tpi 5 Peak To Peak tpp 6 Augmentation Index y/x 7 Alternative Augmentation Index (x-y)/x 8 - z/x|(y-z)|/x 9 Systolic Peak Time t1 10 Dicrotic Notch Time t2 11 Diastolic Peak Time t3 12 Time between Systolic and Diastolic Peaks ΔT 13 The pulse width with semi-height of the Systolic Peak width 14 Inflection Point Area ratio-IPA A2/A1 15 Systolic Peak Output Curve t1/x 16 Diastolic Peak Downward Curve y/(tpi-t3) 17 Hole p 18 - t1/tpp 19 - t2/tpp 20 - t3/tpp 21 - ΔT/tpp

Table 2:Characteristic features of first and second derivatives of PPG signal in time domain [Reşit Kavsaoğlu,Polat and Recep Bozkurt (2014)]
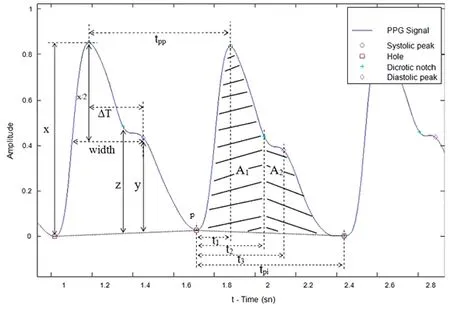
Figure 3:The characteristic features of PPG signal in time domain [Reşit Kavsaoğlu,Polat and Recep Bozkurt (2014)]

Figure 4:The characteristic features of the first and the second derivatives of the PPG signal in time domain [Reşit Kavsaoğlu,Polat and Recep Bozkurt (2014)]
3.3.2 Frequency domain (FD) features
The below specified features in frequency domain are extracted using the Auto-Regressive (AR) modelling scheme.AR scheme computes the Power Spectrum Density (PSD) of the pre-processed PPG signal.PSD is computed by calculating the factors of the linear system.PSD provides the distribution of the power signal with respect to the frequency [Reşit Kavsaoğlu,Polat and Recep Bozkurt (2014)].AR modelling scheme yields an equation that fits the given signal using the prior sample signals.

where n is the order of the AR model,i(s) denotes the input signal,rjdenotes real term coefficients of AR model,W(s) denotes the noise factor.From the coefficients of the second order AR model,the Dominant Frequency (DF) feature and the Strength of Dominant Frequency (SDF) are computed.From the PSD,the power in Very Low Frequency (VLF) region,Low Frequency (LF) region,High Frequency (HF) region and LF/HF are calculated.The Power Ratio (PR) feature is computed as the ratio of PSD in LF range to the PSD in HF range.Totally seven FD features are extracted in this step.
3.4 CPSO classification algorithm
The extracted features of the training dataset are applied for the learning phase in the CART combined PSO algorithm.Formerly the features of the testing dataset are applied to the classifier.Accordingly,the input signals are classified into normal signal and the sleep apnea signal based on the feature characteristics.CART is the machine-learning algorithm used in partitioning the given data sets based on the prediction approach.The dividing process is depicted in the form of a decision tree [Yang and Li (2013)].In CART classification algorithm,the data sequence vector Xiis divided into the several groups represented by a vector with n components,Ci={C1,C2,…..Cn} in the form of a tree with several nodes.Each node of the tree belongs to any component of the group vector Ci.The training phase of the classifier should decide the assignment of a node to the particular component in the group vector.Thus the data elements of Xiare allocated to any of the groups belong to the vector Ci.The child nodes of a parent node are further split into several nodes.The splitting of nodes at each step forms the divergence of branches of a tree.This process continues until the node turns out to be leaf node instead of a branch node.It is always anticipated in CART tree formation that the tree should possess comparatively small number of branches and midway nodes.
In this work,binary CART tree is considered where the feature vector of the given PPG signal are categorized into two vectors namely normal respiration signal and the Sleep Apnea signal.Each category covers the number of features which are the branches of the tree formed at the intermediate nodes,should be small enough to obtain the accurate results.This can be achieved by employing more training samples as much as possible.The set of forty TD features extracted in the previous stage are denoted as Ti={T1,T2,…..T40}.In the same way the set of seven FD features are denoted as Fi={F1,F2,…..F7}.Here the TD feature elements and FD feature elements are applied to the classifier individually and then jointly applied.This is to validate the significance of time domain features and the frequency domain features of the PPG signal for classifying the signal.The applications of feature types are followed in same manner as like training and testing phase.In binary CART tree,at each node two branches are generated such that the components of feature sets are chosen to one of the two classes (N) or (SA) with the objectives given below.
1.Minimizing the impurity index of the two classes at node,t which is represented as in Eq.(5).
2.Maximizing the difference of average impurity,(as given in Eq.(6)) attained by when the non-terminal node is sub-divided into two nodes tl1and tr1.

where,p(N|t)- Proportion of Tiand Fiallocated to class N.
p(SA|t)- Proportion of Tiand Fiallocated to class SA.
To improve the accuracy of the classification,in the proposed work CART is mutually used with the PSO algorithm.PSO is formed based on bird flocking behavior.In PSO,the individual particles are categorized into class known as swarm.In this method,the particle in the swarm is made to flow over a search space and to modify its location based on its own knowledge and the adjacent particles knowledge.Thus a particle determines the optimal location from its best position and its adjacent particle’s best position.A fitness function is involved in finding the optimum position of each particle [Ghamisi and Benediktsson (2015)].
In PSO,each particle is represented with some details.If the particle is represented by p,then the current location of p is denoted by ℒp,current velocity is represented by vp and the personal best location of p is represented by pbestp.Personal best location of a particle p is determined by the position having the largest fitness value,which means that the location is the best location among the locations met by that particle.The objective function is represented as f and the pbestpat the instant t is found as in Eq.(7).

The location of best particle () is represented as in Eq.(8).

Here T denotes the number of particles in the swarm.To find the personal best (pbest),the swarm is grouped into intersecting neighborhoods of particles.The location of best particle of every neighboring particle ℕi,is given by

From Eqs.(9) and (10),g best particle and t is location can be found by replacing ‘l’ by ‘T’.Here instead of considering the neighboring particle,the total swarm is taken into consideration.The velocity and position updating process in gbest PSO is given in Eqs.(11) and (12).

where w denotes the inertia weight,α1and α2are the acceleration constants and r1(t) andr2(t) are the random numbers selected in the range between 0 and 1.
In signal classification,as seen previously,the features set including TD and FD features are applied to the CPSO classifier.The feature sets Fijof u number of signals are denoted as follows.

Equation (13) and (14) denotes the feature vector containing extracted features from u number of signals.TDFijand FDFijdenote the ithTD and FD features of jthsignal respectively.The allocation of Fij∈{TDFij}+{FDFij} to the class N or SA is determined through the fitness function given in Eq.(15).

where γ1and γ2are constants.I(N,SA|t) and ΔI(N,S|g,N,SA|t) are given in (5) &(6).
Then the gbest ℒˆ(t) is found out and the positions and velocity of the particle (signal) j are updated.This process is repeated until the maximum number of iterations given.The proposed CPSO algorithm is illustrated in Fig.5.

CART-PSO Algorithm 1.For each signal,u 2.The extracted feature set is given to CART algorithm 3.For each feature(Fij ∈{TDFij}+{FDFij}),CART tree is constructed based on training.4.In CART tree,the portion of Fij is assigned to either of the two classes.5.Find out the impurity index using equation (5) 6.Then subdivide the non-terminal node and find out the difference of average impurity (equation (6)) at the sub-divided nodes.7.Allot Fij to class N or class SA using PSO algorithm.8.For t=1:m 9.For each particle (feature) Fij 10.Calculate fitness function,f as in equation (15) 11.Find the gbest and update best class to the particle.
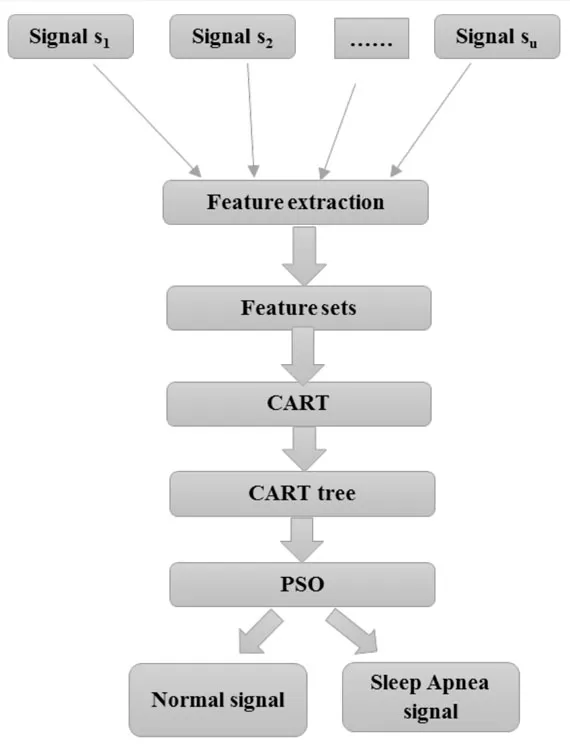
Figure 5:Process of CPSO algorithm
4 Simulation results
This section describes the implementation of the proposed work and the performance metrics computed in this work.The performance of the proposed methodology is compared with the other works.The impact of time domain features and the frequency domain features of the PPG signal is also examined evaluating the performance metrics under different settings.
4.1 Implementation of proposed work
The proposed CART with PSO based classification system is implemented in MATLAB and simulated with the dataset mentioned in Section 3.Different number of samples is obtained from the PPG device for five patients.The data samples are grouped into two sets,viz.,training set and testing set.Among the total number of samples,925 samples are taken for training phase and 309 samples are taken for testing phase.The samples taken for training and testing are applied to the various stages of the proposed work.In the pre-processing stage,the noise and the base line drift is removed.The sample signal and the corresponding power spectrum obtained from AR modelling are given in Figs.6 and 7.The time domain and frequency domain features are extracted for the signals grouped into training set and testing set.The features extracted for training and testing signals are applied to the classifier.The classification of signal by the proposed classifier is evaluated with the significance of type of extracted features.Therefore,the time and frequency domain features are applied separately and the results &performance measures are monitored.

Table 3:Distribution of dataset (Training set/Testing set)
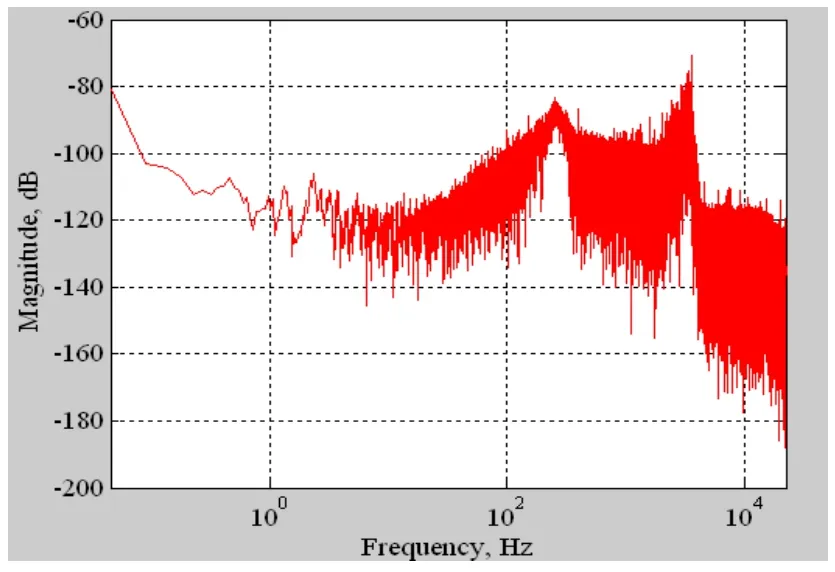
Figure 6:Input signal

Figure 7:Power spectrum of the input signal
For every case,the confusion matrix is formed with the TP (True Positive),TN (True Negative),FP (False Positive) and FN (False Negative) values.From these values,the classifier performance metrics like accuracy,sensitivity,specificity,precision,F1 score and kappa value are computed.To validate the effectiveness of the proposed classifier,the performance metrics are compared with other existing classifiers Support Vector Machine (SVM),Adaptive Neuro-Fuzzy Inference System (ANFIS) and Genetic Particle Swarm Optimization (GPSO) that are used in our previous works.
4.2 Result and discussion
The proposed CPSO classifier is evaluated not only by applying different kind of features,but also by changing the number of particles in swarm in the PSO algorithm.Tab.4 depicts the confusion matrix obtained from the classifier results by applying the TD features and the parameters of PSO is n=10,c1=0.5 and c2=0.5.The computed performance metrics are also tabulated in Tab.5.The accuracy of CPSO classification method is increased by 7.52%,4.95% and 2.88% comparing with SVM,ANFIS and GPS classifiers respectively.Similarly,the sensitivity is increased by 6.99%,5.22% and 4.17%;Specificity is increased by 7.95%,4.75% and 1.91%;Precision is increased by 9.50%,6.07% and 2.65%;F1 score is increased by 8.26%,5.65% and 3.41%;Kappa value is increased by 14.15%,8.95% and 5.03% comparing with SVM,ANFIS and GPSO classifiers respectively.Fig.8 shows the Region of Characteristics (ROC) curve obtained for the proposed classification algorithm and the existing algorithm.

Table 4:Confusion matrix with TD features when n=10,c1=c2=0.5

Table 5:Performance Measures with TD features when n=10,c1=c2=0.5

Figure 8:ROC curve for different classification algorithms when n=10 and TD features
Tab.6 describes the confusion matrix which is obtained from the classifier results by applying the FD features and the parameters of PSO is n=10,c1=0.5 and c2=0.5.The computed performance metrics also tabulated in Tab.7.The CPSO classification accuracy is increased by 5.43%,2.91% and 0.87% while comparing with SVM,ANFIS and GPSO classifiers respectively.

Table 6:Confusion matrix with FD features when n=10,c1=c2=0.5
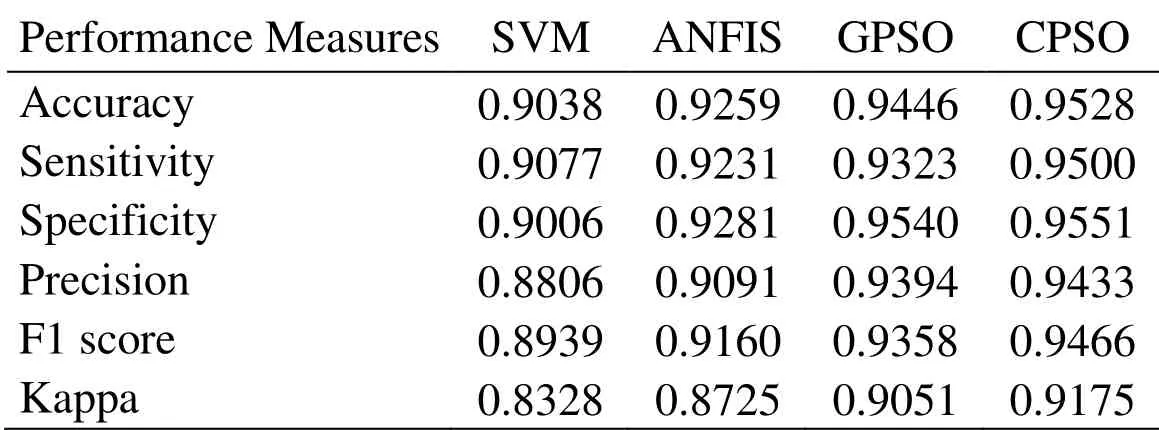
Table 7:Performance Measures with FD features when n=10,c1=c2=0.5
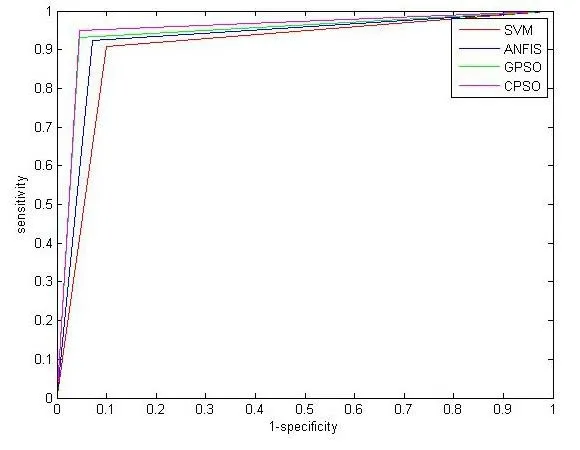
Figure 9:ROC curve for different classification algorithms when n=10 and FD features
Similarly,the sensitivity is increased by 4.66%,2.92% and 1.89%;Specificity is improved by 6.05%,2.89% and 0.11%;Precision is increased by 7.12%,3.76% and 0.42%;The F1 score is increased by 5.89%,3.34% and 1.15%;The Kappa value is improvised as 10.17%,5.16% and 1.37% comparing with SVM,ANFIS and GPSO classifiers respectively.Fig.9 illustrates the ROC curve attained for the proposed classification algorithm and the existing algorithm.
Tab.8 depicts the confusion matrix obtained from the classifier results by applying the TD and FD features and the parameters of PSO is n=10,c1=0.5 and c2=0.5.The computed performance metrics are also tabulated in Table 9.The accuracy of CPSO classification method is increased by 7.88%,5.3% and 3.22% comparing with SVM,ANFIS and GPSO classifiers respectively.Similarly the sensitivity is increased by 7.05%,5.25% and 4.22% comparing with SVM,ANFIS and GPSO classifiers;Specificity is increased by 8.55%,5.33% and 2.48% comparing with SVM,ANFIS and GPSO classifiers;Precision is increased by 10.34%,6.88% and 3.43% comparing with SVM,ANFIS and GPSO classifiers;The value F1 score is increased by 8.69%,6.07% and 3.82% comparing with SVM,ANFIS and GPSO classifiers;The Kappa value is increased by 14.78%,9.55% and 5.61% comparing with SVM,ANFIS and GPSO classifiers respectively.Fig.10 shows the ROC curve obtained for the proposed classification algorithm and the existing algorithm.

Table 8:Confusion matrix with TD and FD features when n=10,c1=c2=0.5

Table 9:Performance Measures with TD and FD features when n=10,c1=c2=0.5

Figure 10:ROC curve for different classification algorithms when n=10 and TD and FD features
Tab.10 depicts the confusion matrix obtained from the classifier results by applying the TD features and the parameters of PSO is n=15,c1=0.5 and c2=0.5.The computed performance metrics are also tabulated in Tab.11.

Table 10:Confusion matrix with TD features when n=15,c1=c2=0.5
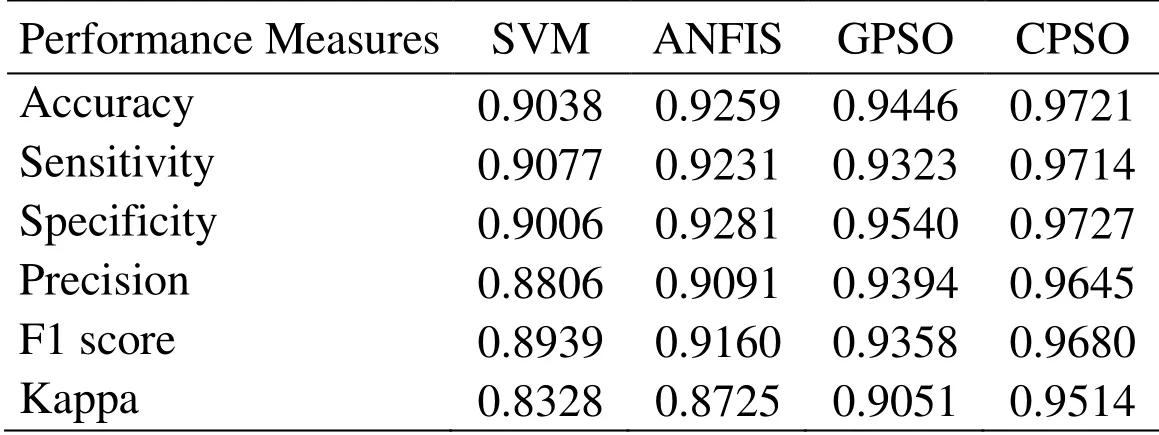
Table 11:Performance Measures with TD features when n=15,c1= c2=0.5
The accuracy of CPSO classification method is increased by 7.56%,4.99% and 2.92% comparing with SVM,ANFIS and GPSO classifier.Similarly,the sensitivity is increased by 7.02%,5.24% and 4.19%;Specificity is increased by 8%,4.8% and 1.96%;Precision is increased by 9.53%,6.1% and 2.68%;the value F1 score is increased by 8.28%,5.67% and 3.43%;Kappa value is increased by 14.24%,9.05% and 5.12% comparing with SVM,ANFIS and GPSO classifiers respectively.Fig.11 shows the ROC curve obtained for the proposed classification algorithm and the existing algorithm.
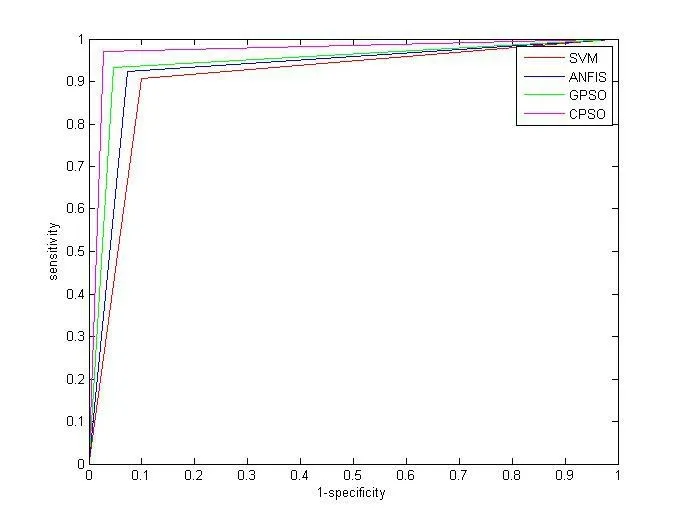
Figure 11:ROC curve for different classification algorithms when n=15 and TD features
Tab.12 depicts the confusion matrix obtained from the classifier results by applying the FD features and the parameters of PSO is n=15,c1=0.5 and c2=0.5.The computed performance metrics are also tabulated in Tab.13.

Table 12:Confusion matrix with FD features when n=15,c1=c2=0.5
The accuracy of CPSO classification method is increased by 7.53%,4.95% and 2.88% comparing with SVM,ANFIS and GPSO classifiers respectively.Similarly the sensitivity of this classification method is increased by 6.99%,5.22% and 4.17%;the specificity is increased by 7.95%,4.75% and 1.91%;the precision is increased by 9.5%,6.07% and 2.65%;the value F1 score is increased by 8.26%,5.65% and 3.41%;the Kappa value is increased by 14.14%,8.95% and 5.03% comparing with SVM,ANFIS and GPSO classifiers respectively.Fig.12 shows the ROC curve obtained for the proposed classification algorithm and the existing algorithm.
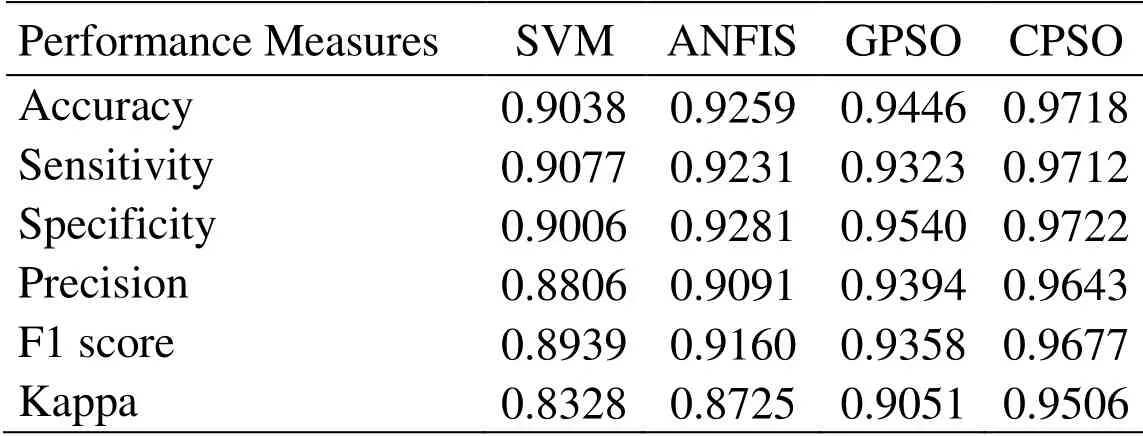
Table 13:Performance Measures with FD features when n=15,c1=c2=0.5
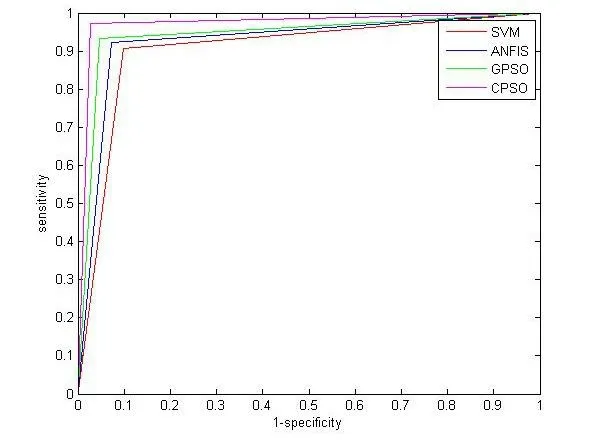
Figure 12:ROC curve for different classification algorithms features when n=15 and FD
Tab.14 depicts the confusion matrix obtained from the classifier results by applying the TD and FD features and the parameters of PSO is n=15,c1=0.5 and c2=0.5.The computed performance metrics are also tabulated in Table 15.The accuracy of CPSO classification method is increased by 8.60%,6% and 3.91% comparing with SVM,ANFIS and GPSO classifiers respectively.Similarly the sensitivity of this classification method is increased by 7.84%,6.04% and 4.99%;the specificity is increased by 9.21%,5.98% and 3.1%;the precision is increased by 11.16%,7.68% and 4.2%;the value F1 score is increased by 9.5%,6.86% and 4.59%;the Kappa value is increased by 16.17%,10.89% and 6.89% comparing with SVM,ANFIS and GPSO classifiers respectively.Fig.13 shows the ROC curve obtained for the proposed classification algorithm and the existing algorithm.

Table 14:Confusion matrix with TD &FD features when n=15,c1=c2=0.5
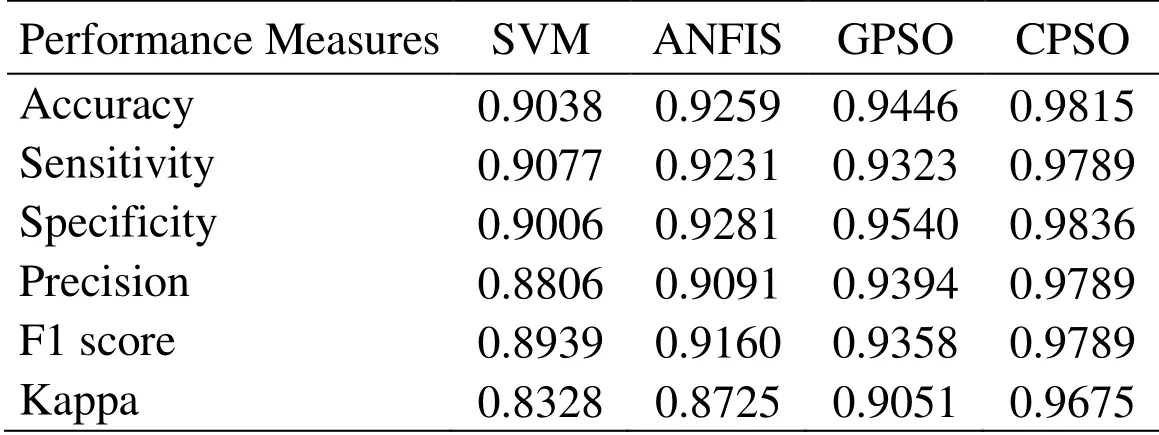
Table 15:Performance Measures with TD &FD features when n=15,c1=c2=0.5

Figure 13:ROC curve for different classification algorithms when n=15 and TD and FD features
Tab.16 depicts the comparison of performance parameters computed for the CPSO classifier by applying time domain features,frequency domain features and joint application of TD and FD features.In addition,the values obtained by changing the number of particles are also listed.
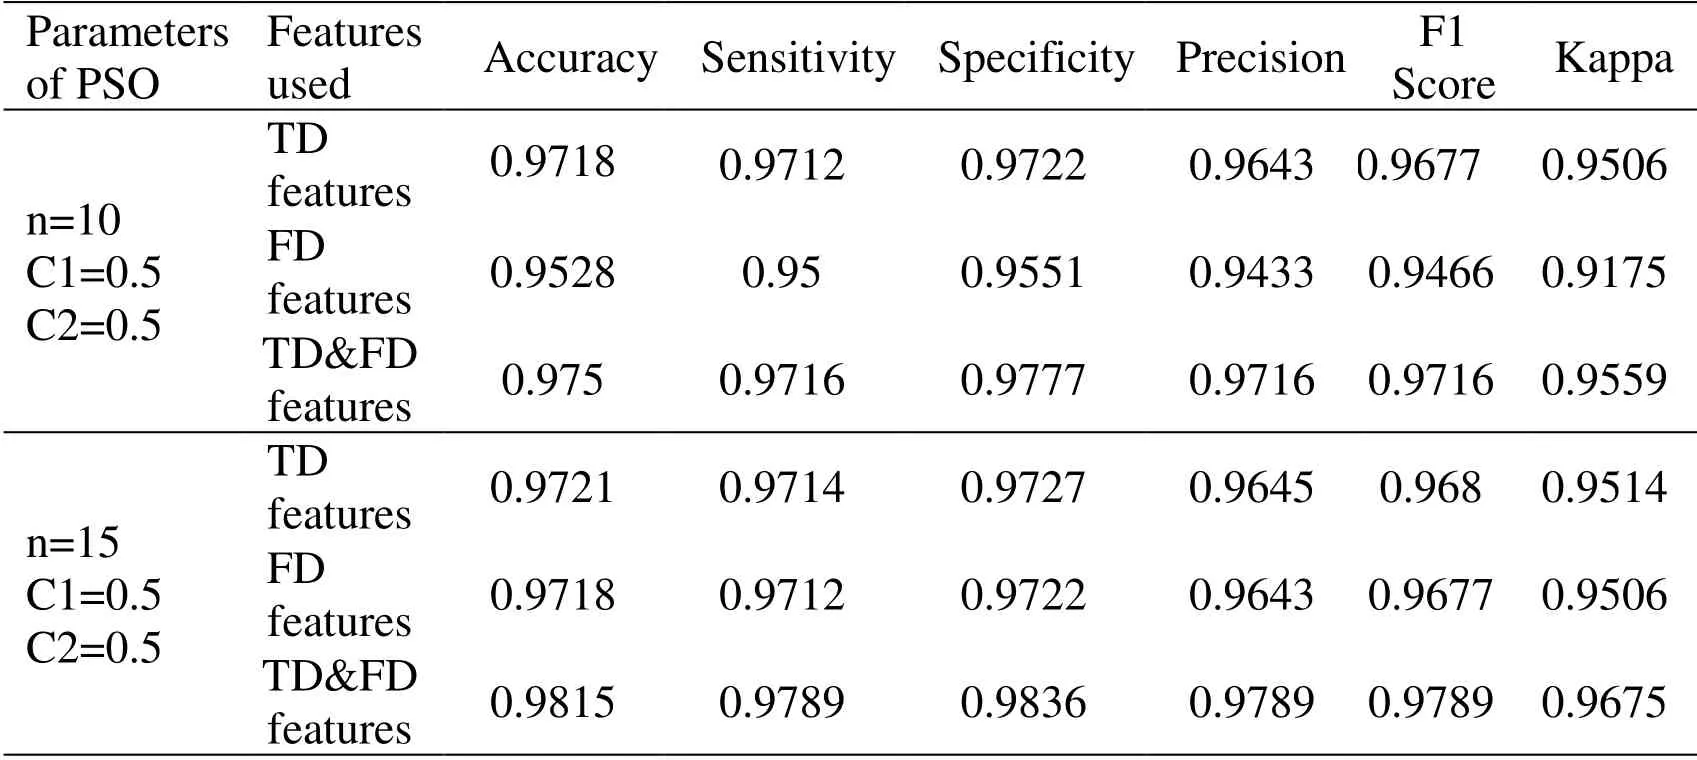
Table 16:Comparison of performance parameters
5 Conclusion
The efficiency of classifier algorithm in medical field for diagnosing disease should be of great importance for the truthfulness.With this intent,we presented an efficient classification algorithm using CART algorithm and PSO algorithm.The implementation of algorithm is accomplished with the set of 1234 PPG signals obtained for five patients.The proposed classifier is evaluated by comparing the results with our previous works employing SVM algorithm,GPSO algorithm and ANFIS algorithm.In addition,in the work,the analysis of the significance of features is realized by observing the performance for the application of time domain and frequency domain features.From the implementation,it is observed that the proposed classifier performs well comparing with the existing algorithms.
References
Almazaydeh,L.;Elleithy,K.;Faezipour,M.;Abushakra,A.(2013):Apnea detection based on respiratory signal classification.Procedia Computer Science,vol.21,pp.310-316.
Altın,C.;Er,O.(2016):Comparison of different time and frequency domain feature extraction methods on elbow gesture’s EMG.European Journal of Interdisciplinary Studies,vol.5,no.1,pp.35.
Aydore,S.;Sen,I.;Kahya,Y.P.;Mihcak,M.K.(2009):Classification of respiratory signals by linear analysis.2009 Annual International Conference of the IEEEEngineering in Medicine and Biology Society,pp.2617-2620.
Bhoi,A.K.;Sarkar,S.;Mishra,P.;Savita,G.(2012):Pre-processing of PPG signal with performance based methods.International Journal of Computer Application,vol.4,no.2,pp.251-256.
Chang,W.Y.;Huang,C.C.;Chen,C.C.;Chang,C.C.;Yang,C.L.(2014):Design of a novel flexible capacitive sensing mattress for monitoring sleeping respiratory.Sensors,vol.14,no.11,pp.22021-22038.
Daurai,B.;Nayak,P.;Mudhalwadkar,R.P.(2017):Sleep physiological parameter measurement for breath,chest and abdomen effort to detect apnea hypopnea.International Conference on Intelligent Computing and Control,pp.1-4.
Deng,T.;Wang,Y.;Sun,M.;Chen,B.(2013):Stage-matched intervention for adherence to CPAP in patients with obstructive sleep apnea:a randomized controlled trial.Sleep and Breathing,vol.17,no.2,pp.791-801.
Earis,J.;Cheetham,B.(2000):Current methods used for computerized respiratory sound analysis.European Respiratory Review,vol.10,no.77,pp.586-590.
Emin Tagluk,M.;Akin,M.;Sezgin,N.(2010):Classification of sleep apnea by using wavelet transform and artificial neural networks.Expert Systems with Applications,vol.37,no.2,pp.1600-1607.
Ghamisi,P.;Benediktsson,J.A.(2015):Feature selection based on hybridization of genetic algorithm and particle swarm optimization.IEEE Geoscience and Remote Sensing Letters,vol.12,no.2,pp.309-313.
Gutiérrez-Tobal,G.C.;Alonso-Álvarez,M.L.;Álvarez,D.;del Campo,F.;Terán-Santos,J.(2015):Diagnosis of pediatric obstructive sleep apnea:Preliminary findings using automatic analysis of airflow and oximetry recordings obtained at patients’ home.Biomedical Signal Processing and Control,vol.18,pp.401-407.
Gutta,S.;Cheng,Q.;Nguyen,H.D.;Benjamin,B.A.(2018):Cardiorespiratory model-based data-driven approach for sleep apnea detection.IEEE Journal of Biomedical and Health Informatics,vol.22,no.4,pp.1036-1045.
Hassan,A.R.(2016):Computer-aided obstructive sleep apnea detection using normal inverse gaussian parameters and adaptive boosting.Biomedical Signal Processing and Control,vol.29,pp.22-30.
Kins Burk Sunil,N.;Ganesan,R.;Sankaragomathi,B.(2018):GPSO based effective system for respiration disease detection.Taga Journal of Graphic Technology,vol.14,pp.700-709.
Lazaro,J.;Gil,E.;Deviaene,M.;Bailion,R.;Testelmans,D.(2017):Pulse photoplethysmography derived respiration for obstructive sleep apnea detection.Computing in Cardiology,vol.44,pp.1-4.
Mendez,M.O.;Ruini,D.D.;Villantieri,O.P.;Matteucci,M.;Penzel,T.(2007):Detection of sleep apnea from surface ECG based on features extracted by an autoregressive model.29th Annual International Conference of the IEEE Engineering in Medicine and Biology Society,pp.6105-6108.
Pasterkamp,H.;Kraman,S.S.;Wodicka,G.R.(1997):Respiratory sounds:advances beyond the stethoscope.American Journal of Respiratory and Critical Care Medicine,vol.156,no.3,pp.974-987.
Reşit Kavsaoğlu,A.;Polat,K.;Recep Bozkurt,M.(2014):A novel feature ranking algorithm for biometric recognition with PPG signals.Computers in Biology and Medicine,vol.49,pp.1-14.
Rekha,B.B.;Kandaswamy,A.;Ramanathan,R.M.P.L.(2018):Ensemble classification approach for screening of obstructive sleep apnoea using ECG.International Journal of Biomedical Engineering and Technology,vol.27,no.1/2,pp.139-150.
Sara,L.Z.;Sarah,B.;Stefan,S.;Josef,G.(2014):Breathing-phase selective filtering of respiratory data improves analysis of dynamic respiratory mechanics.Technology and Health Care,no.5,pp.717-728.
Song,C.;Liu,K.;Zhang,X.;Chen,L.;Xian,X.(2016):An obstructive sleep apnea detection approach using a discriminative hidden markov model from ECG signals.IEEE Transactions on Biomedical Engineering,vol.63,no.7,pp.1532-1542.
Yang,B.H.;Li,S.(2013):Remote sense image classification based on CART algorithm.Advanced Materials Research,vol.864-867,pp.2782-2786.
 Computer Modeling In Engineering&Sciences2019年2期
- Computer Modeling In Engineering&Sciences的其它文章
- A Graph-Based Reinforcement Learning Method with Converged State Exploration and Exploitation
- Context-Based Intelligent Scheduling and Knowledge Push Algorithms for AR-Assist Communication Network Maintenance
- Improved Particle Swarm Optimization for Selection of Shield Tunneling Parameter Values
- Solving the Nonlinear Variable Order Fractional Differential Equations by Using Euler Wavelets
- Numerical Simulation and Experimental Studies on Elastic-Plastic Fatigue Crack Growth
- Dynamic Response of Floating Body Subjected to Underwater Explosion Bubble and Generated Waves with 2D Numerical Model
