基于多通道数据流在线相关分析及聚类的闸站工程安全监测
包加桐,钱 江,张 炜,唐鸿儒※,汤方平
基于多通道数据流在线相关分析及聚类的闸站工程安全监测
包加桐1,钱 江2,张 炜1,唐鸿儒1※,汤方平1
(1. 扬州大学水利与能源动力工程学院,扬州 225127;2. 江苏省泰州引江河管理处,泰州 225321)
闸站工程自动安全监测可积累大量高质量监测数据,然而对这些数据的在线自动分析手段较为有限。该文提出一种针对多通道实时监测数据流的在线相关分析与聚类方法,以挖掘多个感兴趣测点通道数据流之间的联系。该方法能够在线快速计算数据流的统计特征,在计算数据流之间相关性度量的基础上,对多数据流进行自动聚类。以泰州高港闸站工程安全监测系统为例,针对扬压力、伸缩缝、温度等多类型共65个通道数据流进行在线相关分析与聚类,一次特征计算、分析与聚类总时长低于1 s,满足在线处理的实时性要求。该文提出的方法能够判断闸站工程渗压情况、伸缩缝与温度变化特性等,可有效发现潜在的工程安全问题或传感器故障。
聚类分析;在线系统;相关方法;闸站工程;安全监测;多数据流
0 引 言
闸站工程通常由分布在较大范围内的泵站、水闸、堤坝等多座水工建筑物组成。为了保障工程安全可靠运行,需要定期且准确地观测和分析水工建筑物的沉降、裂缝、渗压等,以能够及时掌握工程健康状况与薄弱环节,为后期加固维修提供可靠资料[1-2]。传统以人工定期观测方式为主,室外观测任务重、测量周期长、人为误差影响大,监测效率与精度无法保证。随着信息化与智能化要求的提高,充分利用先进传感器、网络、数据库等信息技术进行各类水工建筑物的安全自动监测成为必然选择[3-6]。
自动监测在观测频次、精度上的显著优势可以保证闸站工程安全状况的连续准确监测要求,能够长期记录各类监测数据,通过数据分析和比对,发现可能导致事故的异常参数并及时报警。在工程安全监测数据的在线分析时,通常是设定不同告警等级及相应的上下限阈值,当在线测量数据超出设定阈值范围时系统会执行相应的告警动作[3,7]。另一方面,由于各类监测数据被长期保存至数据库,系统一般会提供历史数据的查询与数据变化趋势对比界面或分析工具[8],采用的是离线查询与分析方式。例如多利用最小二乘法或改进的方法对工程安全监测数据进行建模[9-10],剔除离群点,最终用于数据预测[11]等。利用模糊数学对多个监测量的关系进行建模,并用于评估大坝的安全程度[12-13]。使用监测数据基于粗糙集与支持向量机、神经网络、空间相关系数等方法进行大坝变形分析及构建安全预警模型[14-17]。利用监测数据与安全监测模型进行工程渗流安全监测[18-19]等。可以看出,工程安全监测系统虽然积累了大量数据,对数据中有效丰富信息进行在线自动分析的手段还很有限。
工程安全监测系统从各类通道在线定时采集数据,产生了时间序列上的具有不同类别的多数据流。直接对多数据流进行分析可有效挖掘数据的特性。采用基于聚类的无监督学习方法[20-23]来分析多数据流是常用技术手段。例如文献[24]在对数据流聚类的基础上计算数据流全局演化属性并用于云虚拟主机的在线异常检测。文献[25]和文献[26]则分别采用了在线聚类方法来检测社交媒体数据流的主题和检测网络入侵行为。其他的应用领域包括图像分类[27],生物医学数据分析[28]等,然而相关方法在水利工程领域的应用却非常少见。因而,本文将多通道数据流的在线相关分析与聚类方法应用于闸站工程安全监测领域,通过在线挖掘多个感兴趣测点通道数据流之间的联系来发现潜在的工程安全问题或传感器故障,以期丰富基于阈值判断告警等常用的在线安全监测手段。
1 系统结构
闸站工程常态观测项目一般包括垂直位移、扬压力、引河河床变形、伸缩缝、水位以及流量等,观测工作应按照规定的项目、测次、顺序和时间进行现场观测。为了改进以人工定期观测为主的闸站工程安全监测工作,前期针对某闸站工程,研究开发了基于网络的安全监测系统[3]。从数据层面对系统结构进行了划分,如图1所示。数据采集层主要从工程安全监测数据采集箱和计算机监控系统中,汇集相关测点的实时数据,并通过数据发布接口提供给上层数据分析层调用和处理。数据服务层则通过开发功能服务及人机界面,供用户来观测系统中相关数据及分析结果。如图2所示,该系统已实现定时采集扬压力测管水位、伸缩缝、温度等各类数据,能够通过人机界面观测任意时间段内各个测点数据的历史变化曲线。且能够在发生测点数据越限或者指定时段内变化值越限时自动通过短信进行报警。

图1 闸站工程安全监测系统结构
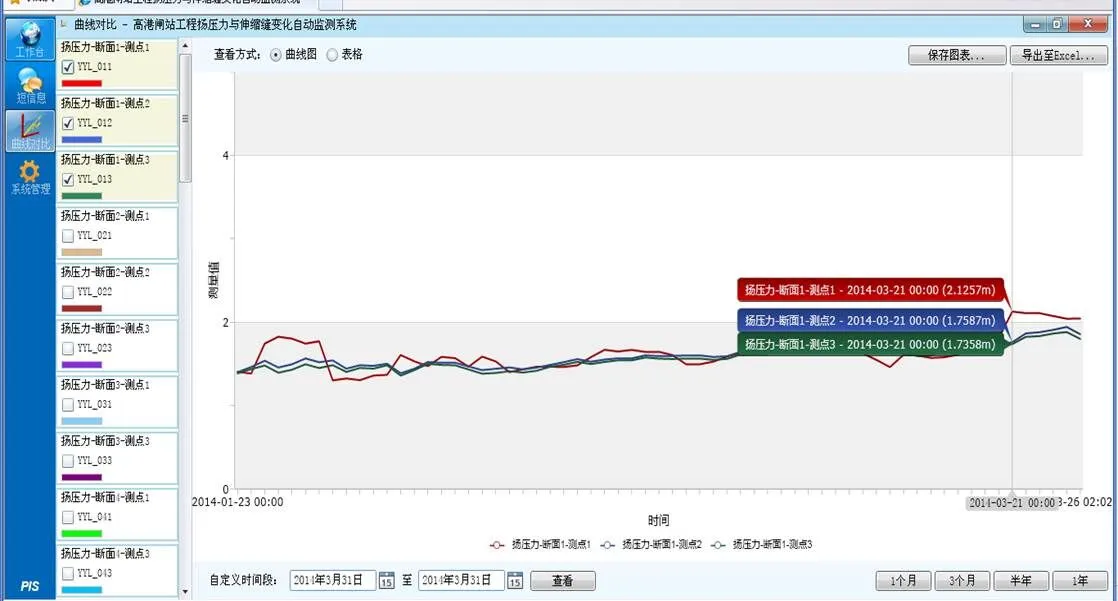
图2 安全监测系统人机界面
为了能够进一步挖掘感兴趣测点通道数据流之间的联系,自动发现潜在的工程安全问题或传感器故障,本文重点研究多数据流的在线相关分析与聚类方法。研究内容处于系统的数据分析层,主要包括多数据流获取、数据流统计特征计算、在线相关分析与聚类3个过程。多数据流的分析结果可进一步交由监测预警模块进行推理及执行预警动作。
2 多通道数据流在线分析
2.1 基本概念及数学描述


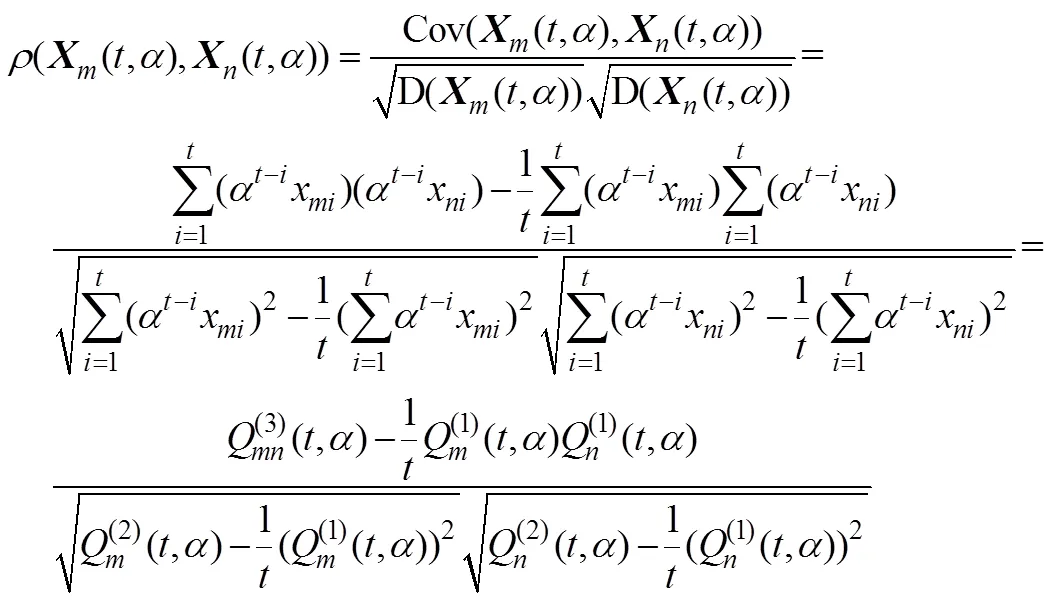
因此,为提高计算速度与节省存储资源,只需计算和存储数据流的统计特征。
2.2 数据流相关分析

2.3 数据流聚类
闸站工程安全监测会涉及众多不同类型测点的数据流。为在线将相关度高的数据流自动分组,以发现可能存在的工程安全问题或传感器故障,采用基于密度聚类的DBSCAN算法[30]对多数据流进行聚类,算法伪代码如下:
begin
end while
end if
end if
end for
end

3 案例及结果分析
3.1 案例简介

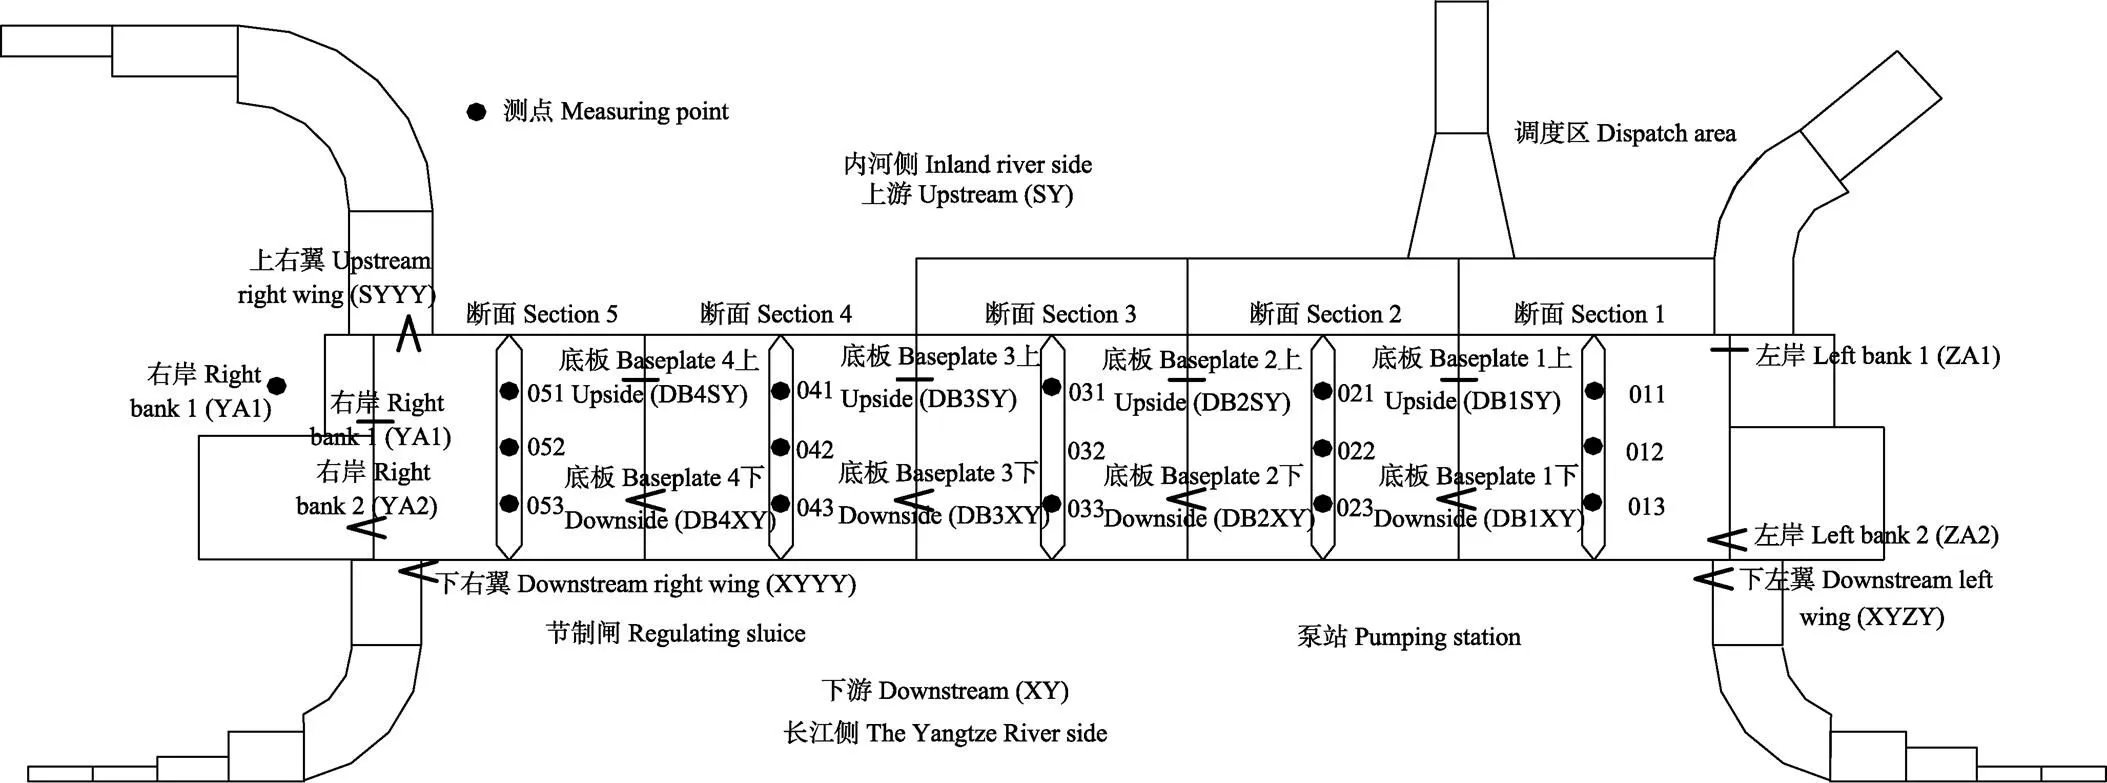
图3 泰州高港闸站工程安全监测测点布置
试验中选择2015年4月29日—2015年11月23日共209 d内存储于数据库的65个通道数据流进行在线回放分析。数据存储的频度是每个通道每小时记录1个数据点,因此待分析的每个通道的数据流的总长度为5 016。通过常规上下限值比较手段判断出YYL_022、YYL_041、YYL_042、WD_YA1_SS通道数据存在大量异常数据,因此不参与数据流的相关分析与聚类。试验中主要进行2类多数据流的相关分析与聚类:水位数据流(包含扬压力测管水位与上下游水位)与伸缩缝数据流(包含伸缩缝测点温度与缝隙大小)。数据流统计特征计算公式中,衰减系数取0.99。聚类算法中阈值取1,邻域半径取±0.9。当数据流相关系数>0.9时,称数据流之间具有强正相关性,相关系数<-0.9时称数据流之间具有强负相关性。在配置为Intel Core i5 @ 2.3 GHz CPU,4 GB内存的计算机上利用Visual C++ 6.0编程实现在线分析与聚类功能,平均处理1次多数据流的总时长低于1 s,满足实时性处理要求。
3.2 结果与分析
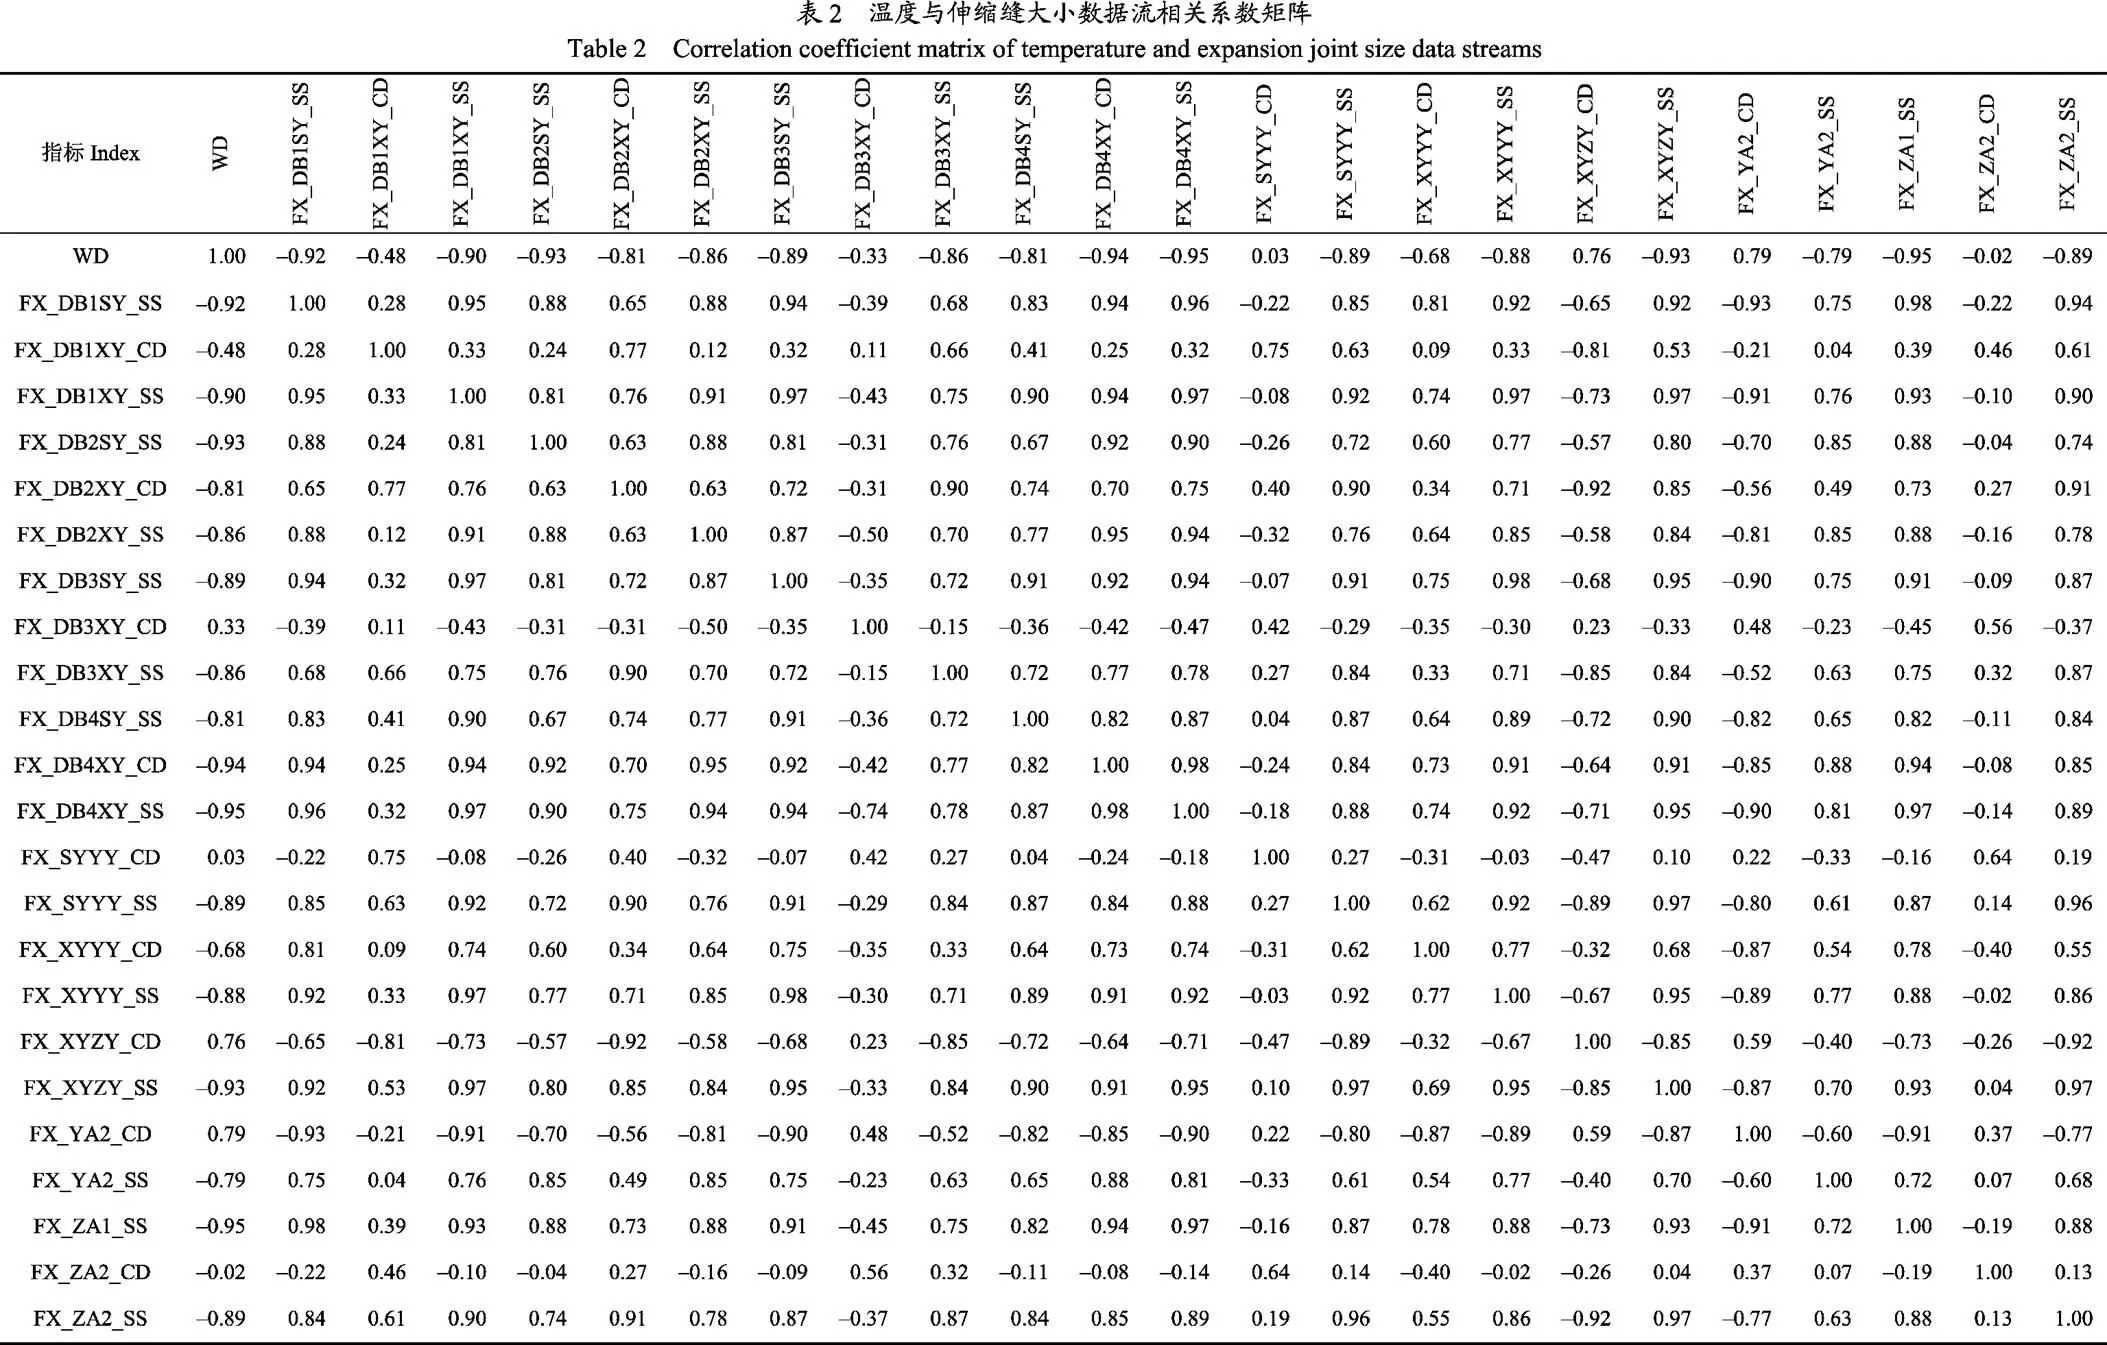
在线检测结果如图4、图5、表1和表2所示。表1与图4分别显示了回放至数据流最后1个数据点对应的离散时间点时,水位数据流的在线相关分析与聚类结果。表2与图5分别显示了伸缩缝数据流的相关分析与聚类结果。

表1 水位数据流相关系数矩阵
注:YYL表示扬压力,SW代表水位,011~XY为测点,见图3。
Note: YYL and SW represent uplift pressure and water level, respectively, 011-XY is measuring point, see in Fig.3.

图4 水位数据流聚类结果
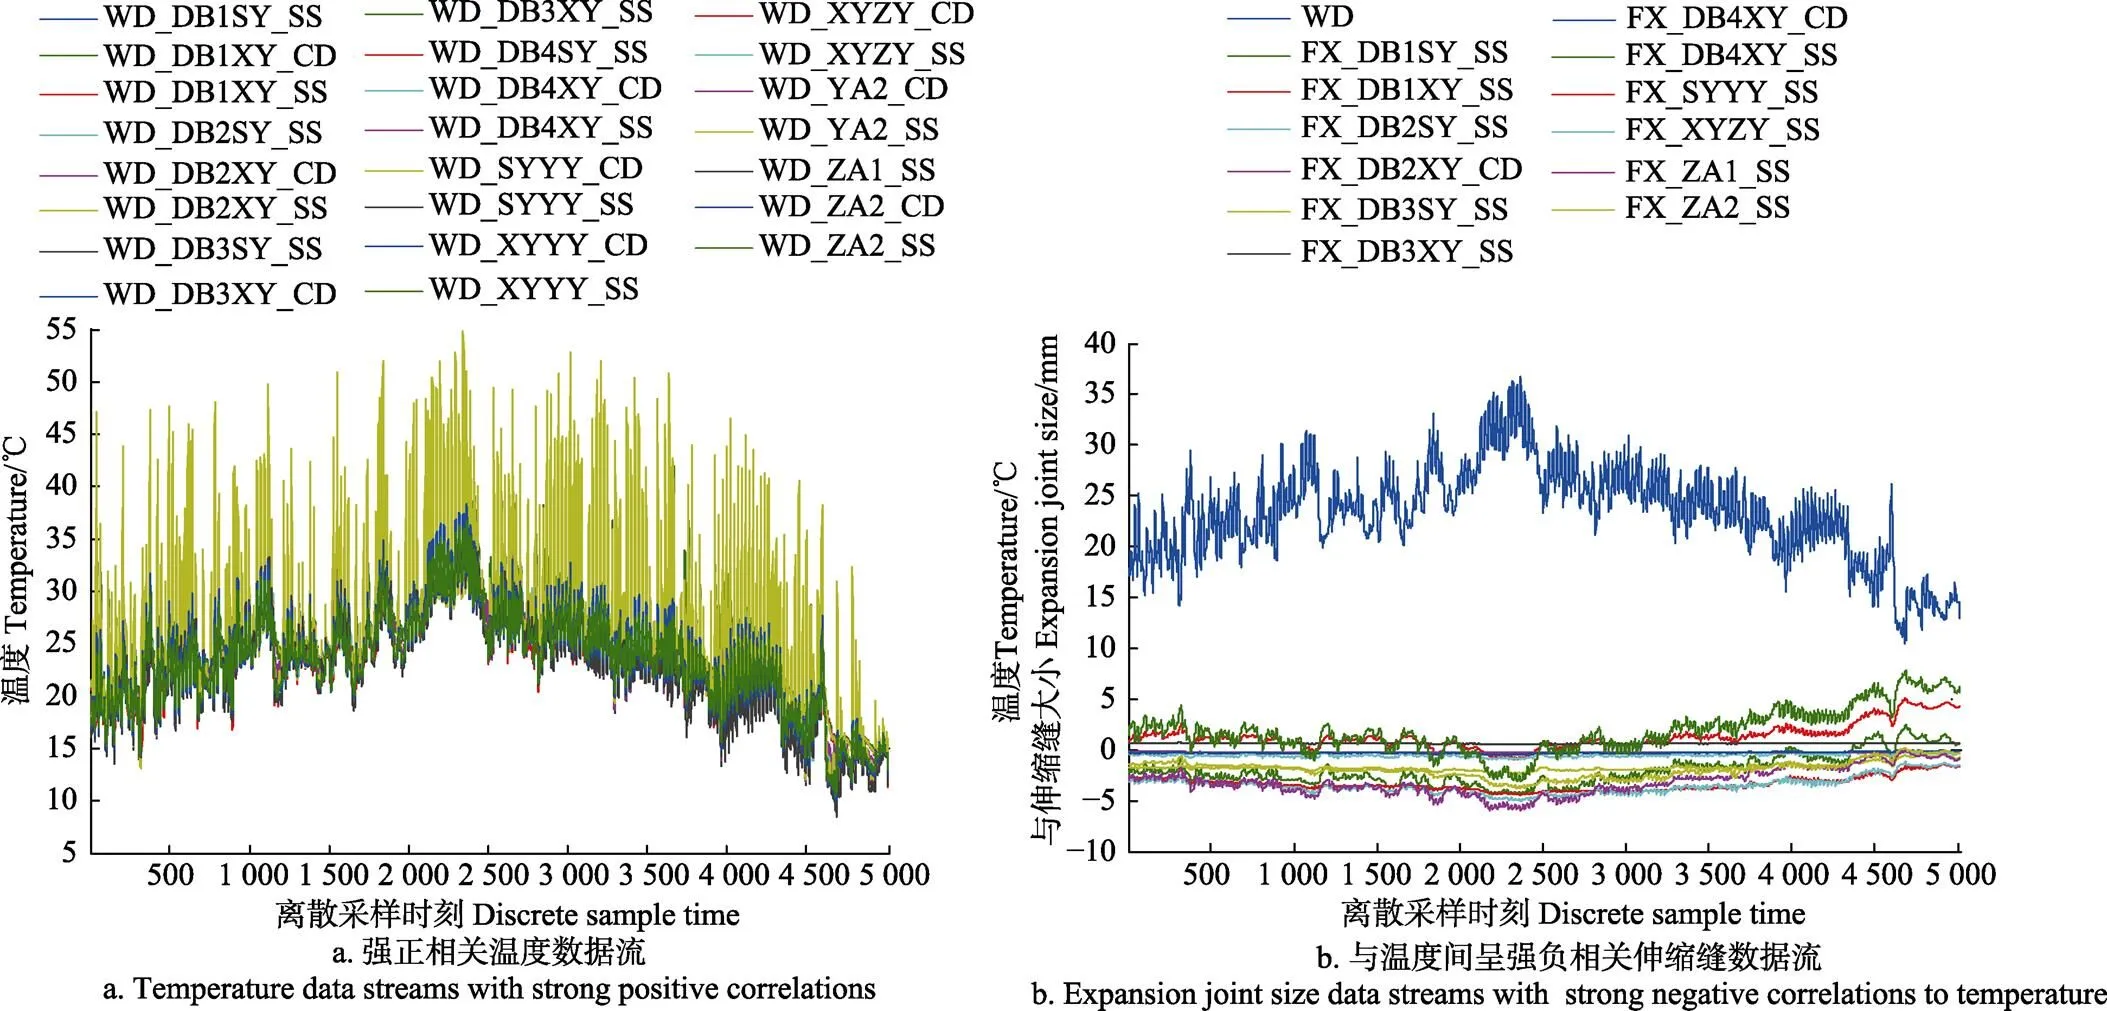
注:WD表示温度,FX表示伸缩缝,SS表示水平东西向,CD表示水平南北向,下同。
从表1可以查看到任意2个水位数据流的相关系数。图4a中各水位数据流被聚类为强相关的2类,除YYL_023、YYL_043测点外,布置于泵站工程5个断面上的扬压力测管的水位,表现出较强的相关性,属正常地下水渗透现象,并且与上下游水位SW_SY和SW_XY均不相关,表明闸站地基渗压大小与上下游水位无直接关系。图4b中的水位数据流被归为噪声点,YYL_YA1测点处扬压力测管安装于泵站工程右岸,与上游的内河和下游的长江相距较远,表现出非相关性;YYL_023测点处与下游侧长江距离较近,虽未达到强相关,相关系数值也达到0.81;且通过图4b中所示的波形可以看出,YYL_023测点处扬压力测管水位波动受长江水位波动影响较大,表明该测点处闸站地基可能出现渗漏,应加强观测。此外,YYL_043测点处的水位数据变化趋势较为异常,较大可能性是传感器测量故障导致,需进一步排查。可以看出,对扬压力测管水位与上下游水位数据流进行在线相关分析与聚类,可以有效判断闸站工程渗压情况及发现传感器故障。
表2显示了温度与各伸缩缝大小数据流的相关系数矩阵。经聚类后,如图5a所示各测点的温度数据流均表现为强相关性,图5b显示了与温度表现出强负相关的测点处伸缩缝大小数据流。其中,闸站工程各个断面连接处的底板向的水平伸缩缝隙大小与温度多表现出强负相关特性,其余测点处水平伸缩缝隙大小表现为弱负相关特性,相关系数取值均落在(-0.9,-0.8);除FX_DB2XY_CD和FX_DB4XY_CD外,向的水平错动缝隙大小与温度均未表现出强负相关特性。此外,试验中发现测点FX_XYZY_CD与FX_YA2_CD处缝隙大小变化与温度变化却表现出正相关,存在异常,需进一步排查原因。因此,对伸缩缝与温度数据流进行在线相关分析与聚类,可以挖掘出伸缩缝与温度的变化特性。对于所有被归类为噪声点的数据流,可被直接用于发现各类工程安全监测传感器的异常情况。
4 结 论
本文提出了一种对闸站工程自动安全监测系统中产生的多数据流进行在线相关分析与聚类的方法,详细给出了多数据流统计特征快速计算,基于统计特征的相关系数计算以及基于相关系数密度的聚类过程。在泰州高港闸站工程应用与试验,发现了工程5个断面上各扬压力测管水位表现出强正相关,反映出正常地下水渗透现象,其中1个扬压力测点处位置出现渗漏,1个扬压力测点处传感器出现了故障;发现各伸缩缝测点处温度表现出强正相关,水平伸缩缝隙大小与温度表现出强负相关,受温度变化影响明显,水平错动缝隙大小则受温度影响较小。表明了提出的多数据流在线相关分析与聚类方法可以有效挖掘多个感兴趣测点通道数据流之间的联系,自动发现潜在的工程安全问题或传感器故障,丰富了闸站工程安全监测数据的在线自动分析手段。该方法以数据为驱动,将多数据流进行在线自动分组,用户无需手动从大量测点列表中选取待分析对比的数据流,即可高效、全面且有针对性地查看异常数据流。数据流的自动分组结果,可直接用于分析得出工程相关特性或客观规律,以及发现存在的工程安全隐患。多数据流的聚类结果可利用规则库进行自动推理及执行预警动作,值得进一步研究。
[1] 顾昊,王霞. 自动监测技术在闸站工程变形观测中的应用[J]. 水利建设与管理,2015,35(3):56-59.Gu Hao, Wang Xia. Application of automatic monitoring technology in gate station[J]. Water Resources Development & Management, 2015, 35(3): 56-59. (in Chinese with English abstract)
[2] Shao Chenfei, Gu Chongshi, Yang Meng, et al. A novel model of dam displacement based on panel data[J/OL]. Structural Control and Health Monitoring, 2018, 25(1): e2037. doi.org/10.1002/stc.2037.
[3] 钱福军,唐鸿儒,包加桐,等. 基于互联网的水利枢纽工程安全监测系统开发[J]. 人民长江,2016,47(5):98-101. Qian Fujun, Tang Hongru, Bao Jiatong, et al. Development of safety monitoring system for water project based on internet[J]. Yangtze River, 2016, 47(5): 98-101. (in Chinese with English abstract)
[4] 金有杰,周克明,雷雨. 基于移动终端的大坝安全监测信息发布平台研究[J]. 人民长江,2017,48(8):92-96. Jin Youjie, Zhou Keming, Lei Yu. Research on dam safety monitoring information publishing platform based on mobile terminal[J]. Yangtze River, 2017, 48(8): 92-96. (in Chinese with English abstract)
[5] Yang Jie, Bao Tiandong, Liang Desheng, et al. Management information system for dam safety monitoring based on B/S structure[C]//International Conference on Information Science and Engineering, 2009: 2332-2335.
[6] Wang Ligang, Yang Xiaocong, He Manchao. Research on safety monitoring system of tailings dam based on Internet of Things[J/OL]. IOP Conference Series: Materials Science and Engineering, 2018, 322(5): 052007. doi.org/10.1088/1757- 899X/322/5/052007.
[7] 桂中华,张浩,孙慧芳,等. 水电机组振动劣化预警模型研究及应用[J]. 水利学报,2018,49(2):216-222.Gui Zhonghua, Zhang Hao, Sun Huifang, et al. Research and application of early warning model of vibration deterioration for hydroelectric-generator unit[J]. Journal of Hydraulic Engineering, 2018, 49(2): 216-222. (in Chinese with English abstract)
[8] 秦浩,李同春,唐繁,等. 基于MATLAB GUI的水电工程安全监测数据处理界面设计[J]. 水利水电技术,2016,47(4):70-74.Qin Hao, Li Tongchun, Tang Fan, et al. MATLAB GUI- based design of data processing interface for safety monitoring of hydropower project[J]. Water Resources and Hydropower Engineering, 2016, 47(4): 70-74. (in Chinese with English abstract)
[9] 杨杰,方俊,胡德秀,等. 偏最小二乘法回归在水利工程安全监测中的应用[J]. 农业工程学报,2007,23(3):136-140.Yang Jie, Fang Jun, Hu Dexiu, et al. Application of partial least-squares regression to safety monitoring of water conservancy projects[J]. Transactions of the Chinese Society of Agricultural Engineering (Transactions of the CSAE), 2007, 23(3): 136-140. (in Chinese with English abstract)
[10] 胡德秀,郭盼,陈诗怡,等. 基于最小截平方和估计的监测数据分析方法[J]. 数理统计与管理,2017,36(4):632-640.Hu Dexiu, Guo Pan, Chen Shiyi, et al. Analysis method of a water engineering safety monitoring data based on the least trimmed square estimation[J]. Journal of Applied Statistics and Management, 2017, 36(4): 632-640. (in Chinese with English abstract)
[11] 解建仓,王玥,雷社平,等. 基于ARIMA模型的大坝安全监测数据分析与预测[J]. 人民黄河,2018,40(10):131-134.Xie Jiancang, Wang Yue, Lei Sheping, et al. Analysis and prediction of dam safety monitoring data based on ARIMA model[J]. Yellow River, 2018, 40(10): 131-134. (in Chinese with English abstract)
[12] He Jinping, Shi Yuqun. Dam safety fusion evaluation based on fuzzy pattern recognition[C]// International Conference on Computer Science and Service System, 2011: 1177-1180.
[13] 崔少英,包腾飞,裴尧尧,等. 基于模糊数学的大坝安全监测数据处理方法[J]. 水电能源科学,2012,30(11):45-48.Cui Shaoying, Bao Tengfei, Pei Yaoyao, et al. Data processing of dam safety monitoring based on fuzzy mathematical approach[J]. Water Resources and Power, 2012, 30(11): 45-48. (in Chinese with English abstract)
[14] Su Huaizhi, Wen Zhiping, Gu Chongshi. An early-warning model of dam safety based on rough set theory and support vector machine[C]// International Conference on Machine Learing and Cybernectics, 2006: 3455-3460.
[15] Su Huaizhi, Chen Zhexin, Wen Zhiping. Performance improvement method of support vector machine-based model monitoring dam safety[J]. Structural Control and Health Monitoring, 2016, 23(2): 252-266.
[16] Gourine B, Khelifa S. Analysis of dam deformation using artificial neural networks methods and singular spectrum analysis[C]// Euro-Mediterranean Conference for Environmental Integration. Cham:Springer, 2017: 871-874.
[17] 胡添翼,游孟陶,陆天琳,等. 一种改进的空间相关系数在水库高边坡外观变形监测中的应用[J]. 长江科学院院报,2017,34(7):41-47,53.Hu Tianyi, You Mengtao, Lu Tianlin, et al. Application of an improved spatial correlation coefficient to exterior deformation monitoring of high slope in reservoir area[J]. Journal of Yangtze River Scientific Research Institute, 2017, 34(7): 41-47, 53. (in Chinese with English abstract)
[18] Chen Bo, Zhang Li, Qian Qiupei, et al. Research on the seepage safety monitoring indexes of the high core rockfill dam[J]. World Journal of Engineering and Technology, 2017, 5(3B): 42-53.
[19] Santillan D, Fraile-Ardanuy J, Toledo M A. Dam seepage analysis based on artificial neural networks: The hysteresis phenomenon[C]// International Joint Conference on Neural Networks, 2013: 1-8.
[20] Bai Liang, Cheng Xueqi, Liang Jiye, et al. An optimization model for clustering categorical data streams with drifting concepts[J]. IEEE Transactions on knowledge and data engineering, 2016, 28(11): 2871-2883.
[21] Puschmann D, Barnaghi P, Tafazolli R. Adaptive clustering for dynamic IoT data streams[J]. IEEE Internet of Things Journal, 2017, 4(1): 64-74.
[22] Kaneriya A, Shukla M. A novel approach for clustering data streams using granularity technique[C]// International Conference on Advances in Computer Engineering and Applications, 2015: 586-590.
[23] Amini A, Saboohi H, Wah T. A multi density-based clustering algorithm for data stream with noise[C]// International Conference on Data Mining Workshops, 2013: 1105-1112.
[24] Sauvanaud C, Silvestre G, Kaâniche M, et al. Data stream clustering for online anomaly detection in cloud applications [C]// European Dependable Computing Conference, 2015: 120-131.
[25] Comito C, Pizzuti C, Procopio N. Online clustering for topic detection in social data streams[C]// International Conference on Tools with Artificial Intelligence. USA: IEEE, 2016: 362-369.
[26] Yin Chunyong, Xia Lian, Wang Jin. Application of an improved data stream clustering algorithm in intrusion detection system[M]// James J, Park J, Chen S, et al. Advanced Multimedia and Ubiquitous Engineering. Cham: Springer, 2017: 626-632.
[27] Maulik U, Saha I. Automatic fuzzy clustering using modified differential evolution for image classification[J]. IEEE Transactions on Geoscience & Remote Sensing, 2010, 48(9): 3503-3510.
[28] Savkare S S, Narote A S, Narote S P. Comparative analysis of segmentation algorithms using threshold and K-Mean Clustering[C]// International Symposium on Intelligent Systems Technologies and Applications. Springer International Publishing, 2016: 111-118.
[29] Tu Li, Chen Ling, Zou Lingjun. Clustering multiple data streams based on correlation analysis[J]. Journal of Software, 2009, 20(7): 1756-1767.
[30] Ester M, Kriegel H P, Xu X. A density-based algorithm for discovering clusters a density-based algorithm for discovering clusters in large spatial databases with noise[C]//International Conference on Knowledge Discovery & Data Mining. USA: AAAI, 1996: 226-231.
Safety monitoring of sluice-pump station project based on online correlation analysis and clustering of multichannel data streams
Bao Jiatong1, Qian Jiang2, Zhang Wei1, Tang Hongru1※, Tang Fangping1
(1.225127,2225321,)
Sluice-pump station projects usually consist of many widely distributed hydraulic structures, such as pumping stations, sluices and dams. In order to ensure the safe and reliable operation of the project, it is necessary to observe and measure the settlement, expansion joints and seepage flow of hydraulic structures regularly and accurately. In this paper, an online correlation analysis and clustering method for multichannel real-time monitoring data streams was proposed. It aimed at finding the connections between data streams from multiple interested measuring channels, and automatically discovering potential project security problems and sensor failures. Firstly, the real-time data streams were continuously collected by recording sensor data from multiple measuring channels with the same frequency and aligning them on the time axis. Secondly, 3 statistical features of the data streams were incrementally calculated. By employing the statistical features, the calculation of correlation coefficients of any 2 data streams could only run in 0(1) time. Thirdly, the clustering algorithm of density-based spatial clustering of applications with noise was used in order to automatically find grouped data streams with strong correlations and noised data streams with weak or without correlations. By analyzing the clustering results according to project related characteristics and objective laws, potential project safety risks as well as sensor failures could be identified. Based on an earlier developed safety monitoring system for Taizhou Gaogang sluice-pump station project, the experiments were carried out to analyze and cluster multichannel data streams of uplift pressure, expansion joint and temperature online. It took less than 1 s to process multiple data streams for one time. The clustering results of the water level data streams revealed that the water levels in the uplift pressure tubes installed in 5 sections of the project had strong positive relations owing to the normal action of ground water penetration. Exceptionally, the variation of water level in 1 tube was highly affected by water level change of the Yangtze River, which means there existed an abnormal seepage in that position. The failure of 1 uplift pressure sensor was also found according to the clustering results. Besides, the clustering results of the data streams of expansion joint size and temperature could be explained by thermal expansion and contraction. Especially, the expansion joint sizes of most places in the east-west direction of the horizontal plane had strong negative correlations to the environment temperature while the ones in the other directions were less affected. All the data streams classified as the noises could be directly used to discover the abnormal situations of the corresponding sensors. In conclusion, the proposed method could effectively find the connections between the online data streams from multiple interested measuring channels, and discover potential project safety problems and sensor failures. It showed to be an effective way to supplement the online data analysis methods in the hydraulic area.
clustering analysis;online systems; correlation methods; sluice-pump station project; safety monitoring; multiple data streams
包加桐,钱 江,张 炜,唐鸿儒,汤方平. 基于多通道数据流在线相关分析及聚类的闸站工程安全监测[J]. 农业工程学报,2019,35(3):101-108. doi:10.11975/j.issn.1002-6819.2019.03.013 http://www.tcsae.org
Bao Jiatong, Qian Jiang, Zhang Wei, Tang Hongru, Tang Fangping. Safety monitoring of sluice-pump station project based on online correlation analysis and clustering of multichannel data streams [J]. Transactions of the Chinese Society of Agricultural Engineering (Transactions of the CSAE), 2019, 35(3): 101-108. (in Chinese with English abstract) doi:10.11975/j.issn.1002-6819.2019.03.013 http://www.tcsae.org
10.11975/j.issn.1002-6819.2019.03.013
TL364+.1;S277
A
1002-6819(2019)-03-0101-08
2018-05-12
2019-01-01
国家自然科学基金项目(51376155);江苏省重点研发计划项目(BE2015734);江苏省水利科技项目(2015050)
包加桐,副教授,博士,主要从事水利信息化、测控技术与智能系统研究工作。Email:jtbao@yzu.edu.cn
唐鸿儒,教授,博士,主要从事水利信息化、测控技术与智能系统研究工作。Email:hrtang@yzu.edu.cn

