
Local meteorology in a northern Himalayan valley near Mount Everest and its response to seasonal transitions
2019-01-05 02:00:58FangLinSunYaoMingMaZeYongHu
FangLin Sun , YaoMing Ma , ZeYong Hu
1. Key Laboratory of Land Surface Process and Climate Change in Cold and Arid Regions, Northwest Institute of Eco-Environment and Resources, Chinese Academy of Sciences, Lanzhou, Gansu 730000, China
2. China University of Chinese Academy of Sciences, Beijing 100049, China
3. Key Laboratory of Tibetan Environment Changes and Land Surface Processes, Institute of Tibetan Plateau Research,Chinese Academy of Sciences, Beijing 100101, China
4. CAS Center for Excellence in Tibetan Plateau Earth Sciences, Beijing 100101, China
ABSTRACT An automatic weather station (AWS) has been installed at the Qomolangma Station of the China Academy of Sciences(QOMS) since 2005, in a northern Himalayan valley near Mount Everest, with an altitude of 4,270 m a.s.ll. Nine years of meteorological records (2006-2014) from the automatic weather station (AWS) were analyzed in this study, aiming to understand the response of local weather to the seasonal transition on the northern slopes of Mount Everest, with consideration of the movement of the subtropical jet (STJ) and the onset of the Indian Summer Monsoon (ISM). We found: (1) Both the synoptic circulation and the orography have a profound influence on the local weather, especially the local circulation.(2) Southwesterly (SW) and southeasterly (SE) winds prevail alternately at QOMS in the afternoon through the year. The SW wind was driven by the STJ during the non-monsoon months, while the SE was induced by the trans-Himalayan flow through the Arun Valley, a major valley to the east of Mount Everest, under a background of weak westerly winds aloft.(3) The response of air temperature (T) and specific humidity (q) to the monsoon onset is not as marked as that of the nearsurface winds. The q increases gradually and reaches a maximum in July when the rainy period begins. (4) The alternation between the SW wind at QOMS and the afternoon SE wind in the pre-monsoon season signals the northward shift of the STJ and imminent monsoon onset. The average interval between these two events is 14 days.
Keywords: mountain meteorology; monsoon onset; Trans-Himalayan flow; orography influence
1 Introduction
The Himalayas have a profound influence on the atmosphere, both dynamically and thermodynamically, affecting the climate on local and global scales.Acting as a physical barrier to air flow, the Himalayas are a force for planetary-scale waves and significantly modify atmospheric circulation. During winter,the high Himalayas interact with the strong winds of the upper-level subtropical jet stream (STJ) (Webster and Chou, 1980; Moore and Semple, 2004;Schiemann et al., 2009). During summer, moist southerly flows from the Bay of Bengal have an impact on the Himalayas; and the subsequent release of latent heat plays an important role in amplifying the circulation of the South Asian Summer Monsoon (SASM)(Kennett and Toumi, 2005). The effect of large-scale circulation on local meteorology in the Himalayan region is therefore of particular scientific interest.
The Himalayas contain many glaciers and are the source of three of Asia's largest rivers (the Indus,Ganges, and Brahmaputra), which supply water to hundreds of millions of people. Existing observations indicate that the Himalayan region is sensitive to climate change (Gautam et al., 2013; Shah et al., 2015):for example, Himalayan glaciers have shown a remarkable retreating trend over the past century (Bolch et al., 2012; Veettil et al., 2016). The transport of polluted air masses rich in optically active aerosols to the Himalayan region may also affect the cryosphere by modifying snow reflectance and thus altering snowmelt rate and snow spatial coverage (Xu et al.,2009; Bonasoni et al., 2010; Yasunari et al., 2013).To understand climate change and air-pollutant transport in the Himalayan region, the investigation of local meteorology based on in-situ observations is necessary.
A series of meteorological studies have been undertaken in the high-altitude region near Mount Everest. On the south side of Mount Everest, a very persistent valley circulation was observed in the Khumbu Valley, based on continuous data over a full year (Ohata et al., 1981). The effect of the monsoon circulation on local weather in the same valley was analyzed using data from several automatic weather stations (AWSs) installed at altitudes from 3,400 to 5,090 m a.s.ll. Non-monsoon months were characterized by a strong daytime southerly up-valley breeze and a reversed nighttime flow; in contrast, during the monsoon, the southerly wind was stronger in the daytime and was even observed at night (Ueno et al.,2008; Bonasoni et al., 2010). On the north side of Mount Everest, observations in a south-north-oriented valley revealed no such typical valley circulation; and instead the local weather, specifically the wind pattern, is closely related to seasonal movement of the STJ (Sun et al., 2017). During non-monsoon months when the STJ lies over this region, a strong southwesterly wind prevails during the daytime, and the weather is dry; during the monsoon, the STJ moves northward, the local weather is free from the strong westerly flow in the daytime, and a southeasterly wind develops regularly in the afternoon. This wind pattern is persistent and is caused by the air flow in the Arun Valley, east of Mount Everest, according to numerical simulations (Sun et al., 2017).
The above studies have revealed a significant difference between the local weather on the two sides of Mount Everest, which is perhaps to be expected when considering the effects of topography. The wind pattern observed in the north, as well as its driving factors, is also helpful in explaining the distribution of air pollutants in this area, as reported by Cong et al.(2015); however, their results are based on one year's observations and on modeling and need to be supported by long-term meteorological data. The study by Sun et al. (2017) was based on two case studies, combined with numerical simulations, and left two questions to be addressed: (1) Is the penetrating flow in the afternoon a common phenomenon at Qomolangma Station of the China Academy of Sciences(QOMS)? (2) Is the southerly inflow in the Arun Valley a stable pattern throughout the year? Both Cong et al. (2015) and Sun et al. (2017) collected their observations at the Qomolangma Station (QOMS), where an AWS has operated since 2005. In this paper, we examine the multiyear meteorological records obtained at QOMS to investigate the characteristics of the local meteorology, focusing in particular on its response to seasonal transitions by identifying typical weather conditions in a single year, as well as analyzing the seasonal variations in meteorological components and averages calculated using long-term AWS records. Moreover, a similar strong daytime wind was observed at the north base camp of Mount Everest in the upper Rongbuk Valley, and its strength was found to be related to the evolution of the South Asian summer monsoon (Zhou et al., 2008; Zou et al., 2008; Ma et al., 2013).
2 Field observation and datasets
QOMS (28.36°N, 86.95°E) is located at the bottom of the lower Rongbuk Valley, 39 km to the north of Mount Everest, at an altitude of 4,270 m a.s.l. (Figure 1).The north-south-orientated valley has a flat bottom around QOMS, of about 1.5-km width; and ridges to the sides rise 600-900 m above the valley bottom.The valley makes an eastward U-turn in the north and joins the large Arun Valley, which crosses the Himalayan ranges to the east of Mount Everest. Tibetan villages and highland barley farms are located near QOMS,but the ground around the site is largely covered with sparse vegetation, sand, and cobblestones.
An AWS (MILOS 520, Vaisala, Inc.) with a Planet Boundary Layer (PBL) tower was installed at QOMS and started to operate in 2005, measuring air temperature, relative humidity, air pressure, incident radiation, wind speed, and wind direction at five levels (1.5, 3, 5, 10, and 20 m) every 10 minutes. Data from the 5-m level during 2006-2014 were used in this study to calculate the average annual variations of local climate; data from 2009 will be used to show some typical weather conditions in each season, owing to the high data availability for that year. Data availability is summarized in Table 1.
Note that local solar time (LST, Universal Time Coordinate + 6 h) is used throughout this work.

Figure 1 (a): topography of the Mt. Everest region, with locations discussed in the text: Arun Valley, Qomolangma station(QOMS). (b): Photos taken at QOMS (upper) and in the Arun Valley (lower)

Table 1 Availability (%) of Meteorological Data at QOMS, 2006-2014
3 Results
3.1 Seasonal transitions on the northern slopes of Mount Everest
The climate at high altitudes in the Himalayas is strongly influenced by the STJ. The seasonal meridional movement of the STJ controls the transitions between natural synoptic seasons (Schiemann et al.,2009; Bonasoni et al., 2010). Jet theory suggests that the monsoon onset is driven by the sudden shift of the STJ, following significant inhibition by the high-elevation Himalayas (Allaby 2010). Thus, the position of STJ, which can be estimated using zonal wind at 200 hPa, must be considered when analyzing local meteorology data at QOMS.
Climate over the central Himalayas broadly comprises the winter/non-monsoon and summer/monsoon seasons with intervening transition periods (pre- and post-monsoon). The non-monsoon and monsoon seasons commonly refer to periods from December to February and June to September, respectively (Shea et al., 2015). We calculated the mean annual variations of zonal wind at 200 hPa (NCEP/NCAR Reanalysis)over the Mount Everest region and the Indian Summer Monsoon Index (ISMIDX) (Wang and Fan,1999) for 2006-2014, as shown in Table 2. The mean U200 was highest from mid-November to early March, with a mean value over 50 m/s, indicating a strong influence of the STJ in winter; U200 was weak during the monsoon (ISMIDX larger than 0) from June to September. This pattern generally agrees with the common season definitions above.
3.2 Response of local weather to seasonal transitions
The response of local weather to seasonal transitions in the Himalayas varies with location, due to the influence of complex mountain orography on synoptic circulation and local weather. In the Khumbu Valley, on the southern slopes of Mount Everest,there is a significant change in precipitation and prevailing wind (Ueno et al., 2008; Bonasoni et al.,2010). In contrast, the most notable weather change on the northern slopes is the prevailing wind, with the rainy days not arriving until July (shortly after monsoon onset in June), probably due to the Himalayas'shading effect (Sun et al., 2017). Following the monsoon onset, the weather is warm, with little rain; the daily mean temperature (T) and specific humidity (q)gradually increase. Subsequently, T stops increasing in July and August due to the rainy weather during this period, while q rises rapidly to its peak (Figures 2b and 2c). Generally, the monsoon weather is warm and relatively wet, with a mean T and q of 10.3 °C and 7.2 g/kg, respectively, compared to winter values of-3.2 °C and 1.0 g/kg, respectively. The annual mean T is 3.7 °C. Detailed statistical results of these meteorological components are shown in Table 2. The precipitation is not shown, due to missing data; but personal experience has shown that most rain falls in July and August, consistent with the pattern of incident radiation that indicated mostly cloudy conditions during these two months.
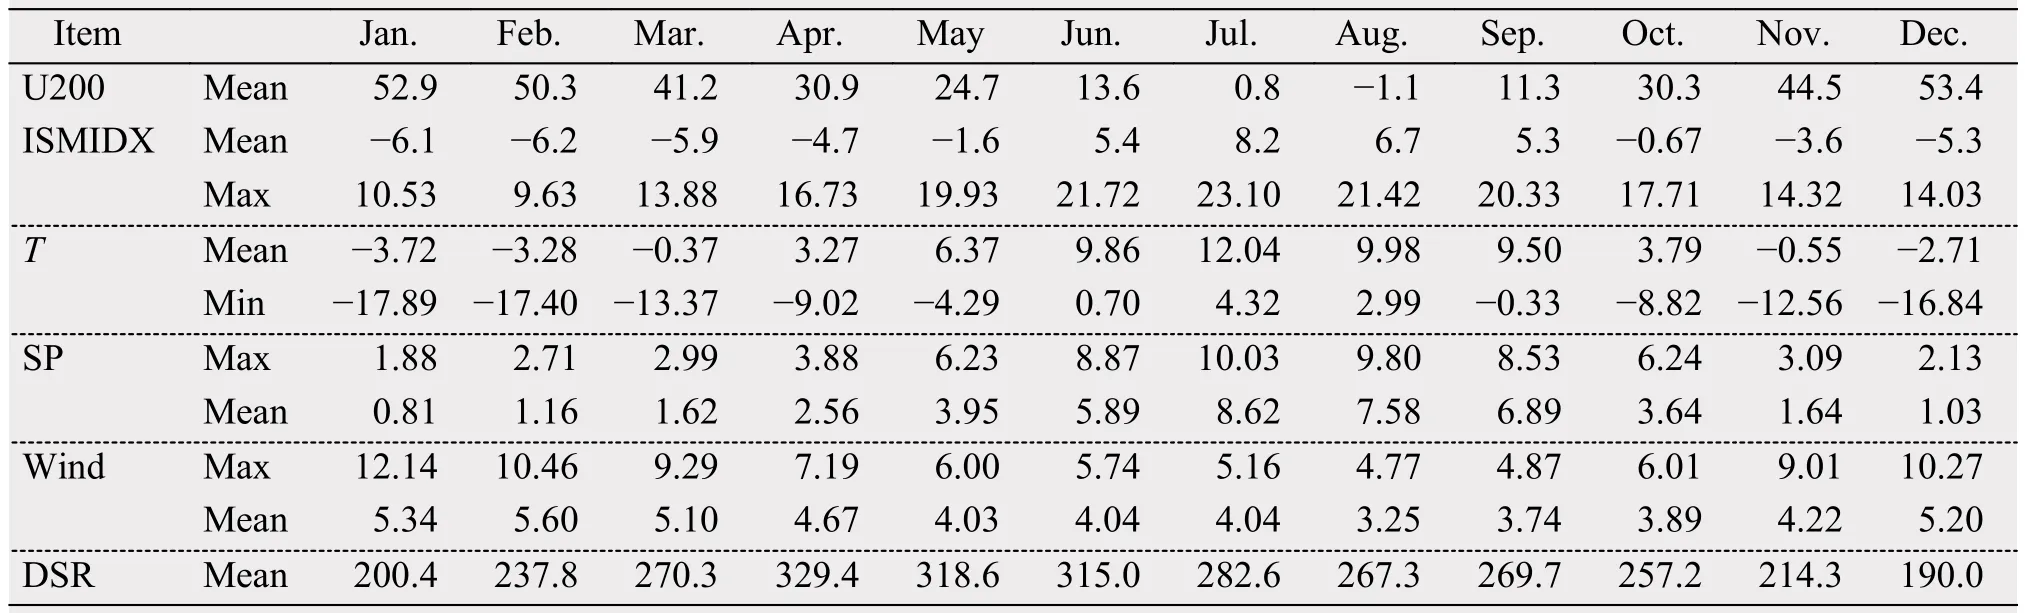
Table 2 Monthly climatological statistics values at QOMS, based on data during 2006-2014
The near-surface wind at QOMS presents significant seasonal changes. During most periods except for the monsoon season, southwesterly winds prevail in the afternoon (14:00-18:00 LST) and are especially strong in November and December, with a mean speed of 7.2 m/s. During the monsoon, the dominant wind in the afternoon is southeasterly and is strongest in June, with a mean speed of 7.8 m/s; and relatively weak in July and August, with a mean speed of 4.8 m/s(Figures 2d and 2e). The nighttime winds were relatively weak and northeasterly from July to early September, southwesterly at other times, thereby showing good consistency with the timing of the wet weather (Figures 2d and 2e). The occurrence of the daytime southwesterly winds at QOMS is closely related to variations in the strength of U200.
An explanation of the mechanism driving the seasonal variation in the daytime wind at QOMS has been proposed by Sun et al. (2017). The southwesterly wind in winter is obviously driven by the westerly wind of the upper-level STJ via downward momentum transfer, which occurs in the daytime when the lower atmosphere is heated by the ground and mixes with air aloft. Meanwhile, the daytime southeasterly wind during and around monsoon periods is caused by the strong southerly valley wind in the Arun Valley. This phenomenon is interesting: the cold air from the Arun Valley suddenly penetrates into the QOMS area when the winds at the upper levels are weak and the air over the north slopes is heated, to become warmer than air at the same levels over the Arun Valley. Our analysis of the 9-year meteorological records indicates that this phenomenon is common at QOMS, thus providing circumstantial evidence that the southerly inflow in the Arun Valley is a persistent pattern.
3.3 Typical weather patterns in different seasons
Analysis of the means of 9 years' data (shown in Figure 2) reveals that the main factors influencing the weather at QOMS are the monsoon, STJ position (upper-level winds), and valley winds in the Arun Valley.The annual variations of those meteorological components in a single year, for example, 2009 (Figure 3),can highlight some of these typical weather patterns more clearly. Here, we choose some case days for analysis, representing the following weather patterns:(1) high-wind days in winter, (2) transition from winter to pre-monsoon, (3) pre-monsoon days with SW wind, (4) late pre-monsoon days with both SW and SE winds, (5) early monsoon days with SE winds,and (6) rainy monsoon days with SE winds.
The winter at QOMS is cold, dry, and windy.Strong southwesterly winds usually develop in the afternoon but sometimes persist all day. Figure 4a shows an example of weather on February 24. There was a significant change in wind direction from north to southwest at 10:00 LST. The wind speed increased rapidly at the same time and had a mean value of 12 m/s in the afternoon. The southwesterly wind then continued with a persistent direction until the following day. The wind speed varied from 3 to 16 m/s and peaked in the early morning of February 25.
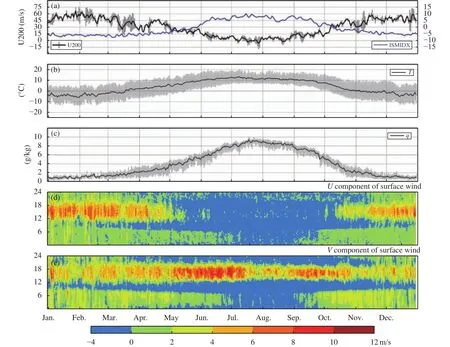
Figure 2 Temporal development of multiyear average (a) Indian Summer Monsoon Index (ISMIDX) and zonal wind at 200 hPa(U200). Mean values are in black, and standard deviations are in grey; (b) daily mean air temperature (T), 10-minute values are in grey; (c) specific humidity (q), 10-minute values are in grey; (d) U components; and (e) V components of surface winds at QOMS during 2009-2014; Y axis of (d) and (e) are hours of a day
After the end of winter, there was a short period from March 8 to 21 when U200 over Mount Everest dropped rapidly from approximately 60 to 20 m/s(Figure 3). At the same time, the pattern of near-surface winds at QOMS changed (Figure 4b): alternating between a nighttime southerly wind and daytime northerly wind on March 12, showing a typical diurnal variation of the mountain breeze, which was seldom observed completely in daytime as would be expected given the occurrence of a strong southwesterly(SW) or southeasterly (SE) wind. This calm weather did not continue during the following day. On March 13, a strong SE wind developed at about 15:00 LST,with a maximum speed exceeding 10 m/s. This SE wind occurred frequently during this period and appeared to have characteristics very similar to winds in monsoon season.
During pre-monsoon, the SW wind occurred regularly in the afternoon (Figure 4c). At the same time,the SE wind occurred occasionally in April and more often in May. The SW wind often occurred from 12:00 to 23:00 LST, while the SE wind occurred from 13:00 to 18:00 LST; however, on May 5, the SW wind stopped at 16:30 LST and rapidly shifted to the SE (Figure 4d).
The strong southwesterly wind in winter may affect the diurnal variations of T by mixing the near-surface air with the upper-level air, thereby compensating for the energy loss caused by nighttime radiational cooling, and also decreasing the near-surface water vapor mixing ratio. There was an obvious period with lower T and high q from 04:30 to 08:00 LST on February 24, coinciding directly with a pause in the southwesterly wind (Figure 4a). Moreover, the nighttime T on February 24/25 was considerably higher than that on March 12/13, despite similar downward shortwave radiation (DSR) values (Figures 4a and 4b).
In the pre-monsoon, both SW and SE winds significantly affected the near-surface q but in the opposite manner. The q usually decreased for the duration of the SW wind but increased during the SE wind(Figures 4c-4e). This observation supports the proposed mechanisms for these two kinds of strong day-time winds, whereby the SW wind by the westerly wind at upper levels and the SE wind is caused by the cold and wet inflow in the Arun Valley (Sun et al.,2017). There was no obvious increase in humidity during the period of SE wind (Figure 4f), probably because the air was already moist during the wet period.
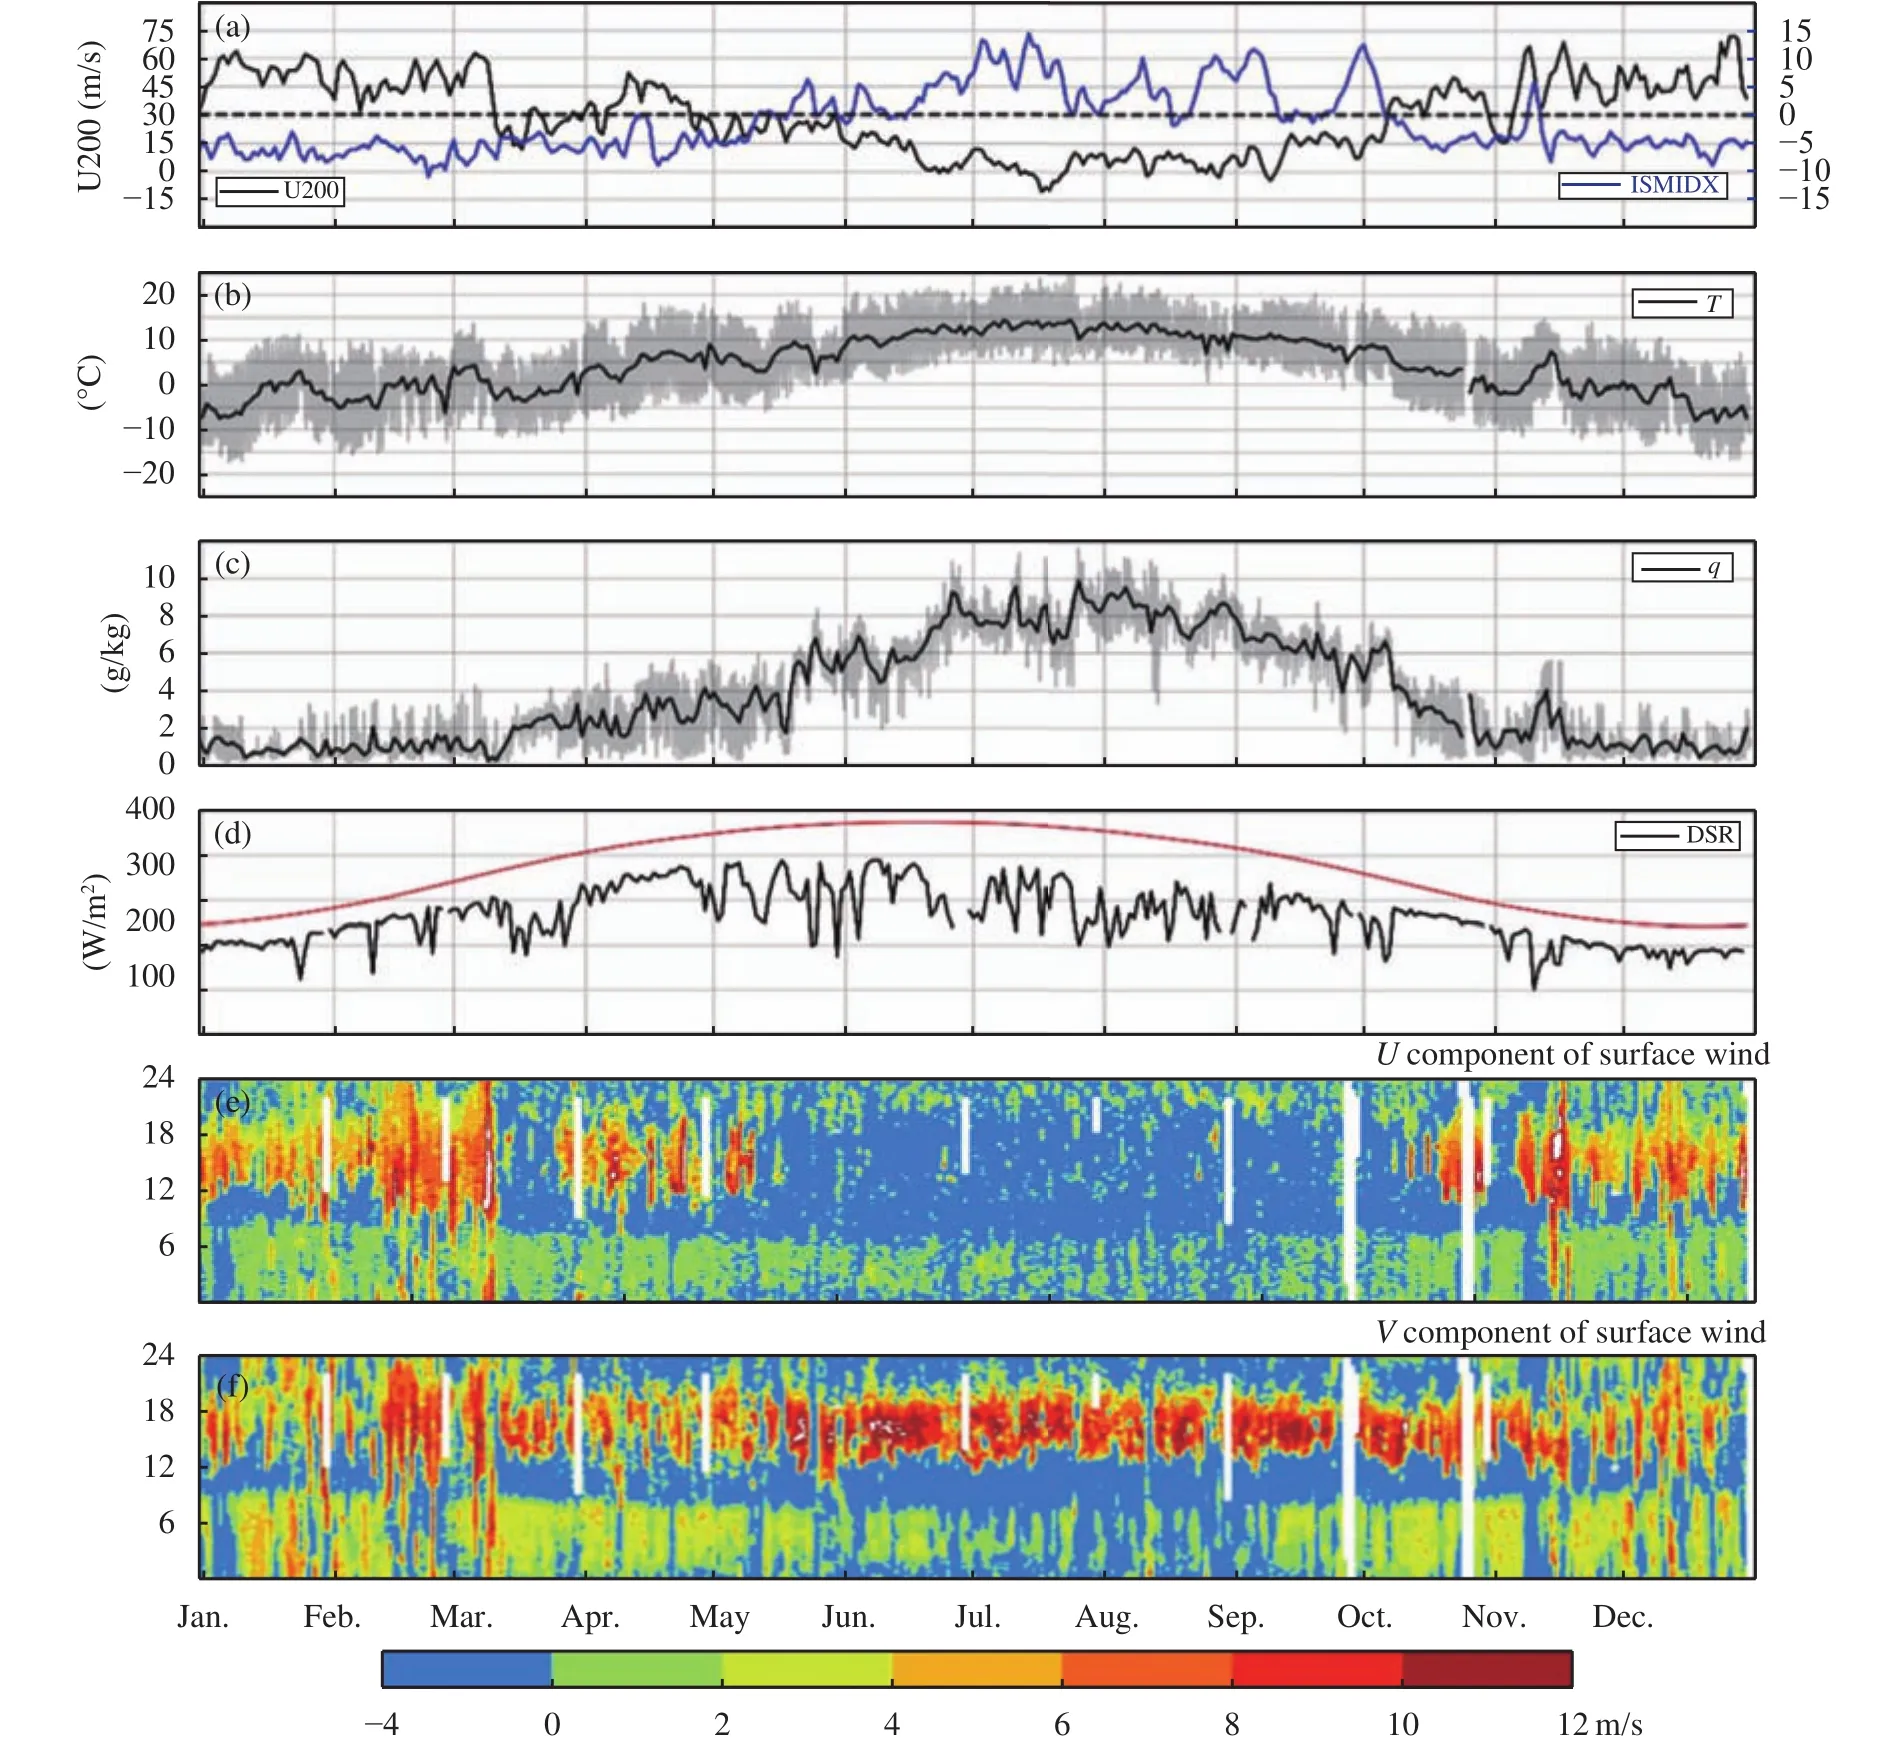
Figure 3 Temporal development of (a) Indian Summer Monsoon Index (ISMIDX) and zonal wind at 200 hPa (U200); (b) daily mean air temperature (T), 10-minutes values are in grey; (c) specific humidity (q), 10-minute values are in grey; (d) downward shortwave radiation (DSR); (e) U components; and (f) V components of surface winds at QOMS in 2009; Y axis of (d)and (e) are hours of a day. Red line on (d) is downward radiation on top of the atmosphere
4 Discussion and conclusions
The response of local weather to the seasonal transition on the northern slopes of Mount Everest is the main focus of this study. According to Sun et al.(2017), there are marked seasonal variations in nearsurface winds, with the changes driven largely by the STJ, owing to the relationship between monsoon onset and the shifting position of the STJ. Because of the region's high elevation, the STJ itself can affect the local weather during the non-monsoon period by inducing a strong SW wind near the ground surface.This wind is thought to suppress the influence of the southerly wind from the Arun Valley. The results of Sun et al. (2017) were based on case studies in the pre-monsoon and early monsoon seasons and are supported in the present study, based on interannual meteorological records from a local weather station.Thus, it can be concluded that the SE wind penetrating into the local area during the afternoon is a common phenomenon at QOMS during monsoon season.
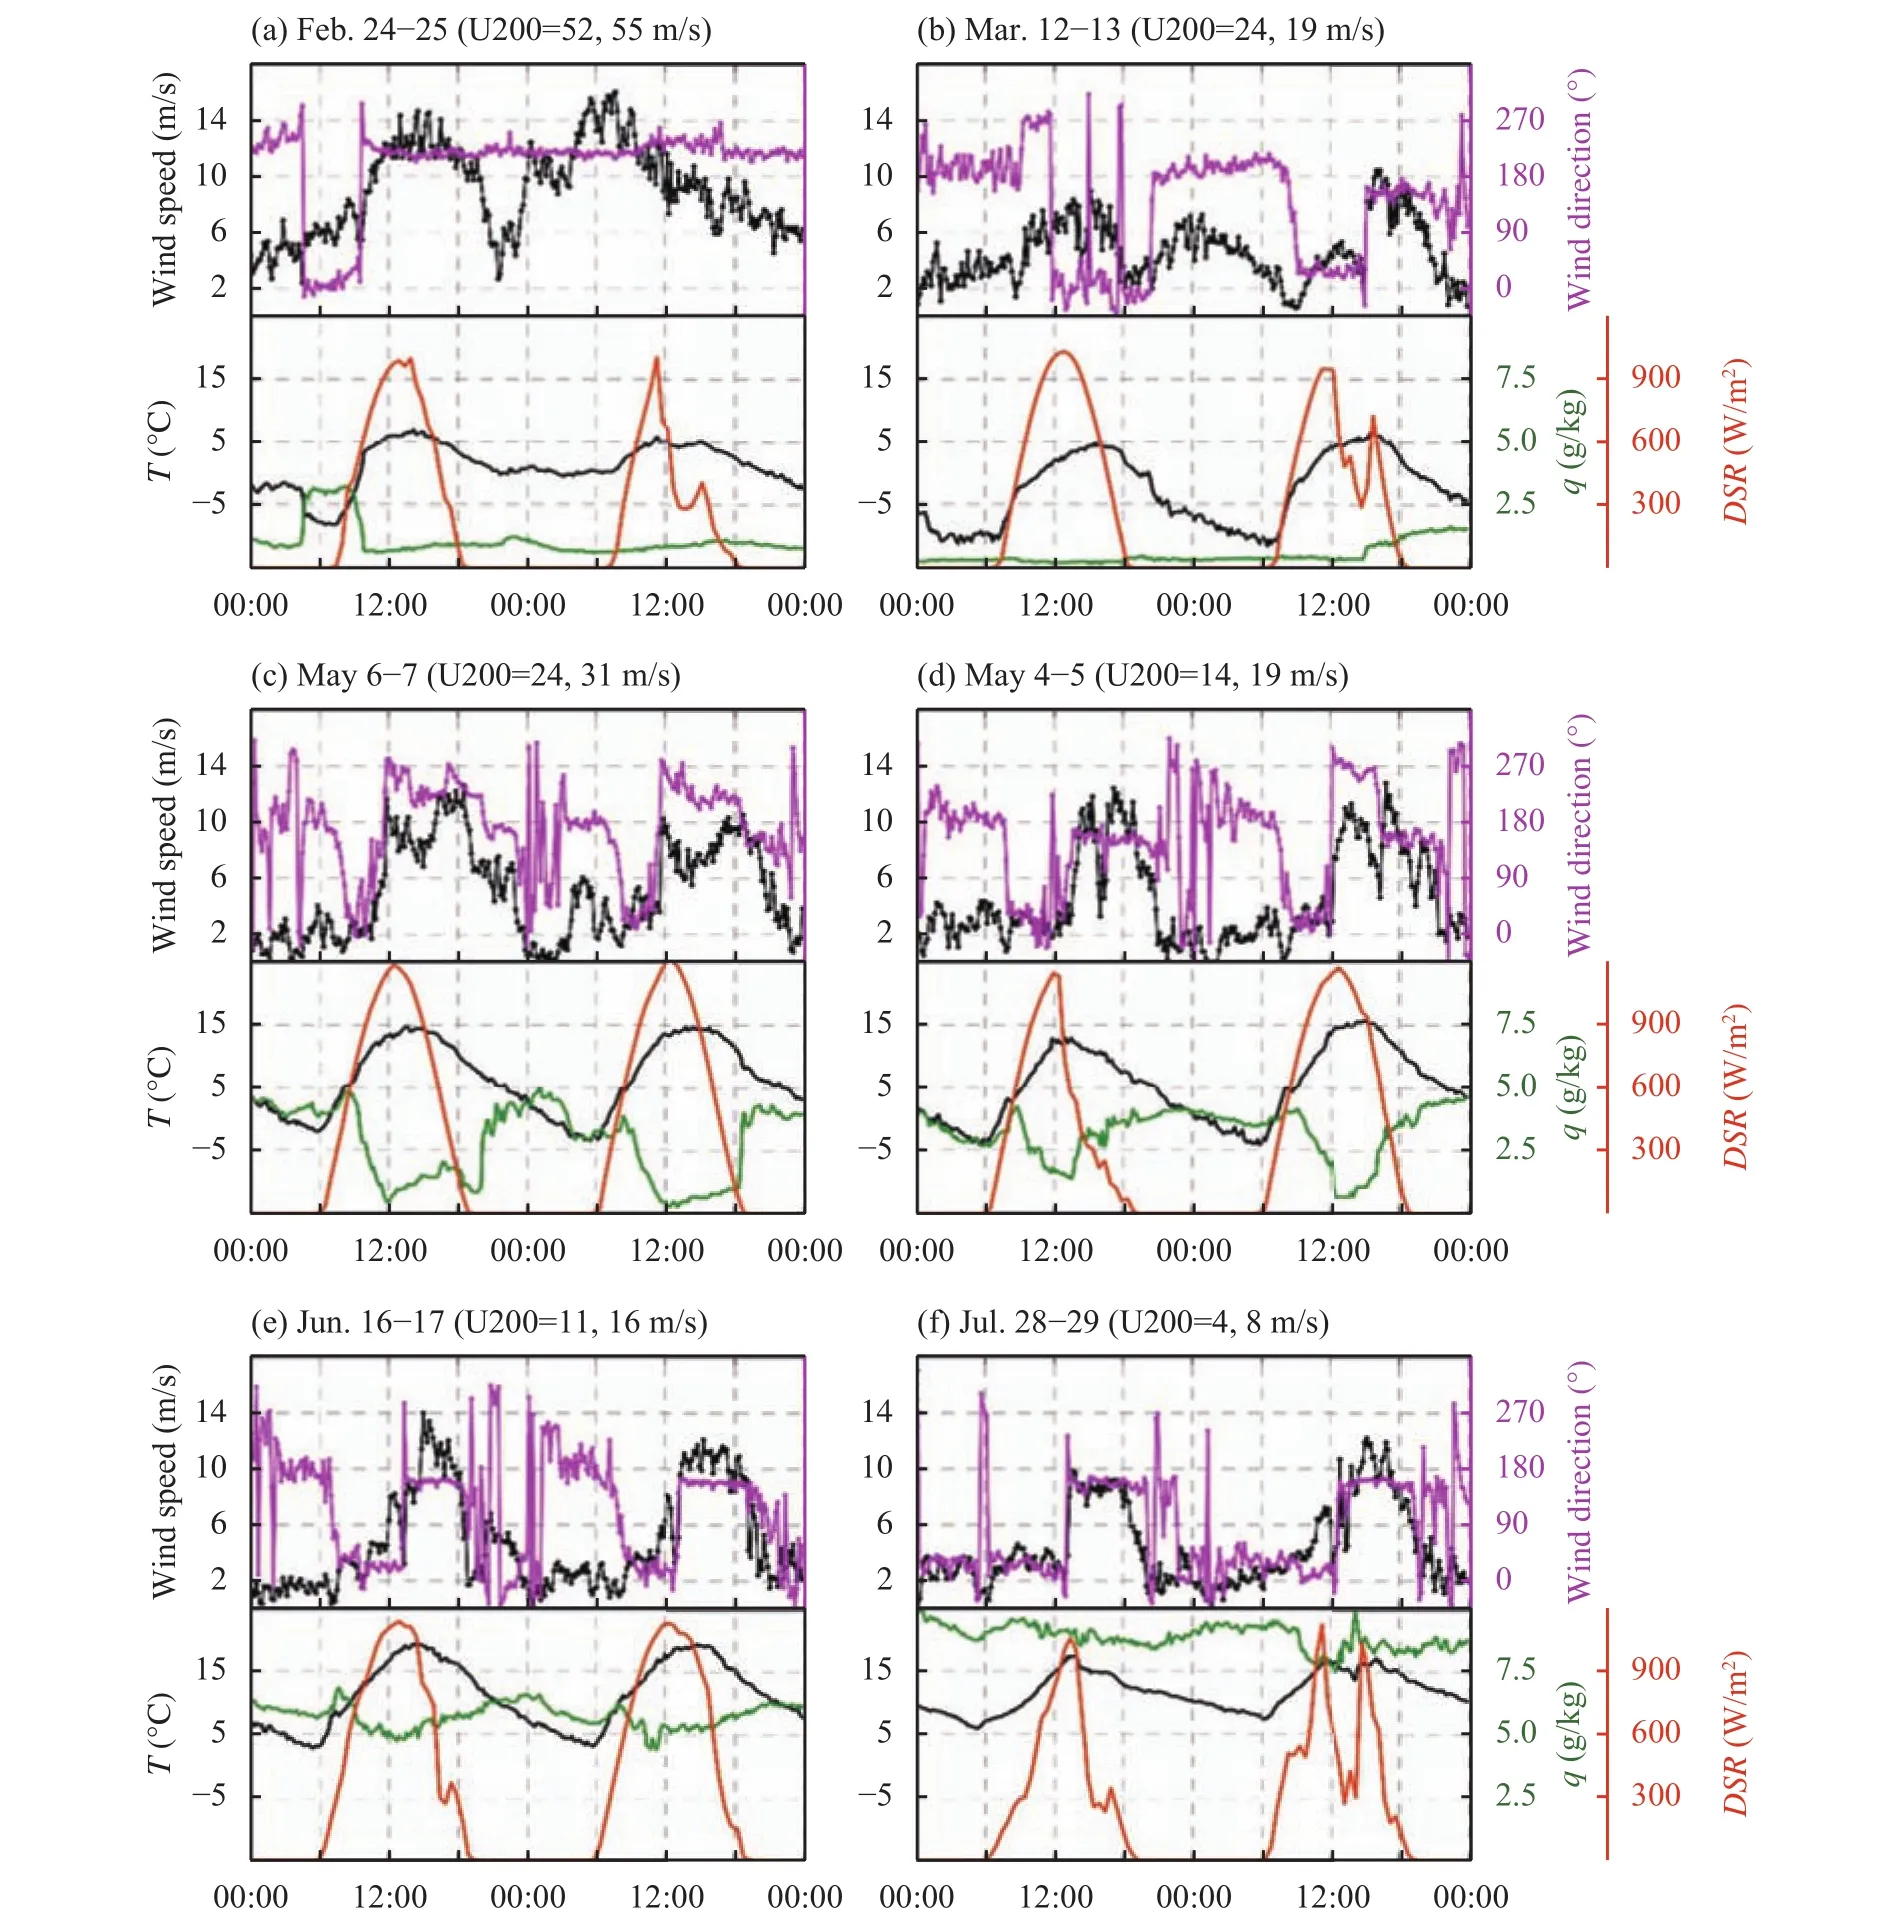
Figure 4 Typical diurnal variations of near-surface wind, air temperature (T), specific humidity (q), and downward shortwave radiation (DSR) in different seasons of 2009. The title of each subfigure shows the date and respective daily mean zonal wind at 200 hPa (U200)
Although the SW and SE winds at QOMS appear to be localized features, their mechanisms demonstrate the effect of the STJ on trans-Himalayan air flow through the Arun Valley. Sun et al. (2017) speculated there was a year-round southerly daytime inflow in the Arun Valley, which may drive the SE wind at QOMS under a synoptic pattern of weak upper westerly winds. This speculation suggests a close relationship between the SW wind caused by the westerly wind aloft and the SE wind at QOMS: When there is a strong westerly wind at upper levels, there is an SW wind at QOMS; but when the upper-level westerly wind is weak, the southerly inflow in the Arun Valley drives an SE wind at QOMS instead. Consequently, the SW and SE winds should then prevail alternately at QOMS in the afternoon through the year, as demonstrated in this study based on local multiyear meteorological records. Figure 2 shows that the SW prevailed at QOMS during most of the nonmonsoon season, while the SE prevailed at other times. On May 5, 2009, the immediate development of the SE wind following the cessation of the SW in the afternoon likely indicates that the near-surface winds are very sensitive to the change in winds aloft.
The long-term observations at QOMS may also indirectly suggest that the daytime southerly inflow in the Arun Valley is a perennial phenomenon, about which little is known due to the lack of in-situ observations in the valley; however, a stable daytime upvalley wind is expected in that valley, owing to the favorable topography. While under conditions with a weak westerly wind aloft, the wind in the Arun Valley can influence the local circulation at QOMS. This trans-Himalaya air flow is therefore very important in understanding the transport of water vapor and pollutants onto the Tibetan Plateau.
The cessation of the SW wind at QOMS and beginning of the continuous presence of the afternoon SE wind in the pre-monsoon season signal the northward shift of the STJ and imminent monsoon onset,due to the close relationship between daytime nearsurface winds and upper-level winds. Table 3 shows the exact date of the SW wind's end and monsoon onset. The interval between these two events is 14 days on average.
Generally, the response of T and q to the monsoon onset is not as marked as that of the near-surface winds. The q increases gradually and reaches a maximum in July when the rainy period begins at QOMS,in contrast to the weather on the southern slopes of Mount Everest, where the period of continuous precipitation begins soon after the monsoon onset (Ueno et al., 2008). Thus, despite the changes in synoptic circulation over this region after monsoon onset, there is a delay before the moist air reaches the southern foot of the Himalayas and crosses over the mountains.

Table 3 Dates of southwesterly wind's (SW) end and monsoon onset at QOMS, 2006-2014
In conclusion, this study provided a general description of the local meteorology in a northern Himalayan valley near Mount Everest and revealed at the same time the complexity of the weather in a mountainous region. Both synoptic circulation and orography have a profound influence on the local weather, especially the local circulation. Thus, the observation location itself should be considered when assessing the representativeness of the observations. Here,QOMS lies in a leeward valley in the northern Himalayan foothills, which in turn promotes relatively warm and dry weather, especially in the early monsoon; however, QOMS is also near the Arun Valley to the east and is significantly influenced by the daytime Arun up-valley wind. Therefore, our data from QOMS uniquely reflect a combined influence of leeward orography and trans-Himalayan flow through a major valley.
Based on these results, more observations should be collected in the nearby region to gain a comprehensive understanding of Himalayan meteorology and the transport of water vapor and pollutants over the mountains.
Acknowledgments:
This research was funded by the National Natural Science Foundation of China (41661144043,41005010, 41475010), the Strategic Priority Research Program (A) of the Chinese Academy of Sciences(Grant XDA20060101), and R & D Special Fund for Public Welfare Industry (meteorology), No.GYHY201406001. The authors thank the staff of QOMS, who provided lots of help in the field observation for this research or in data access.
 Sciences in Cold and Arid Regions2018年6期
- Sciences in Cold and Arid Regions的其它文章
- The 2018 Academic annual meeting of China Society of Cryospheric Science was held successfully in Foshan on November 17-18, 2018
- Academic Workshop of China Society of Desert in the Geographical Society of China successfully held in Changsha, Hunan Province
- Fossil Taiwannia from the Lower Cretaceous Yixian Formation of western Liaoning, Northeast China and its phytogeography significance
- Contrasting vegetation changes in dry and humid regions of the Tibetan Plateau over recent decades
- Simulation and prediction of monthly accumulated runoff,based on several neural network models under poor data availability
- Stable isotopes reveal varying water sources of Caragana microphylla in a desert-oasis ecotone near the Badain Jaran Desert