
Contrasting vegetation changes in dry and humid regions of the Tibetan Plateau over recent decades
2019-01-05 02:00:54RuiQingLiYanHongGaoDeLiangChenYongXinZhangSuoSuoLi
RuiQing Li , YanHong Gao , DeLiang Chen , YongXin Zhang , SuoSuo Li
1. Key Laboratory of Land-surface Process and Climate Change in Cold and Arid Regions, Northwest Institute of Ecoenvironment and Resources, Chinese Academy of Sciences, Lanzhou, Gansu 730000, China
2. Inner Mongolia Autonomous Regional Meteorological Observatory, Hohhot, Inner Mongolia 010051, China
3. Regional Climate Group, Department of Earth Sciences, University of Gothenburg, Gothenburg, Sweden
4. Institute of Tibetan Plateau Research, Chinese Academy of Sciences, Beijing 100101, China
5. National Center for Atmospheric Research, Boulder, Colorado, U.S.A.
ABSTRACT An overall greening over the Tibetan Plateau (TP) in recent decades has been established through analyses of remotely sensed Normalized Difference Vegetation Index (NDVI), though the regional pattern of the changes and associated drivers remain to be explored. This study used a satellite Leaf Area Index (LAI) dataset (the GLASS LAI dataset) and examined vegetation changes in humid and arid regions of the TP during 1982-2012. Based on distributions of the major vegetation types, the TP was divided roughly into a humid southeastern region dominated by meadow and a dry northwestern region covered mainly by steppe. It was found that the dividing line between the two regions corresponded well with the lines of mean annual precipitation of 400 mm and the mean LAI of 0.3. LAI=0.3 was subsequently used as a threshold for investigating vegetation type changes at the interanual and decadal time scales: if LAI increased from less than 0.3 to greater than 0.3 from one time period to the next, it was regarded as a change from steppe to meadow, and vice versa. The analysis shows that changes in vegetation types occurred primarily around the dividing line of the two regions, with clear growth(reduction) of the area covered by meadow (steppe), in consistency with the findings from using another independent satellite product. Surface air temperature and precipitation (diurnal temperature range) appeared to contribute positively (negatively) to this change though climate variables displayed varying correlation with LAI for different time periods and different regions.
Keywords: Tibetan Plateau; vegetation change; leaf area index; climate change
1 Introduction
Studies of vegetation changes could shed light on the extent to which climate change and human activity influence land surfaces and help to identify areas with land surface degradation such as desertification.With an average elevation of 4,500 m, human activity is much less over the Tibetan Plateau (TP) than regions with low altitudes. Therefore, climate change exerts increased impact on environmental change over the TP. In recent decades, substantial warming is occurring over the TP and the warming rate exceeds averages for the Northern Hemisphere and the same latitudinal zone (Liu and Chen, 2000; Wang et al.,2008). It is of particular interest both scientifically and socioeconomically to investigate whether or not changes in vegetation coverage occur over the TP in recent decades and how these changes, if any, are related to climate change.
Over the past decades, earlier spring green-up and longer growing seasons have been reported from in situ phenology observations. Parmesan and Yohe(2003) performed a meta-analysis of phenology trends of 172 species across the globe. They report a significant mean advancement of spring timing on the order of 2.3 days per decade. Goetz et al. (2005) studied the photosynthetic activity and growing season length across boreal North America, and significant changes were found for the tundra vegetation of the boreal zone. As the highest and largest plateau on earth, the Tibetan Plateau has a wide range of alpine grasslands that appear to be highly sensitive to environmental changes (Piao et al., 2006). One major difficulty in examining the long-term changes of vegetation over the TP lies in the fact that in-situ observations of land surface conditions are severely lacking due to the harsh environmental conditions, especially over the vast non-human area in the inner TP. Remotely sensed data such as satellite measurements become a logical alternative to provide a venue for understanding the changes in vegetation over the TP(Baret et al., 2013; Zhang et al., 2013b; Che et al.,2014).
Many studies have reported a greening trend over the Tibetan Plateau (TP) in recent decades using the Normalized Difference Vegetation Index (NDVI)measurements from various satellite sensors (Zhong et al., 2010; Piao et al., 2011; Song et al., 2011;Zhang et al., 2013b, 2014). However, inconsistencies exist among these measurements as to changes in the green-up dates. For example, Zhang et al. (2013b) examined the green-up dates over the TP in 1982-2011 using the GIMMS (Global Inventory Modeling and Mapping Studies) NDVI product as well as the SPOT-VGT (Satellite Pour I'Observation de la Terre-Vegetation) and MODIS NDVI products and found that the green-up dates advanced in the latter two products but retreated after 2000 in GIMMS, a finding that was also echoed by Piao et al. (2011). Shen et al. (2014) on the other hand noted little changes in the green-up dates in the same time period using the MODIS EVI (Enhanced Vegetation Index) dataset.Apparently, the inconsistencies can arise from using different time periods, different data products and even different methodology. While this current work was not aimed at reconciling the inconsistencies in the green-up dates, we would like to address one important but seldom studied issue: how changes in greenness were distributed in space and what might be the driving factors behind the changes.
Besides NDVI, LAI (Leaf Area Index) is another frequently used vegetation index for describing biomass states and changes. LAI is one of the most important input variables in land surface models because leaf area or vegetation coverage affects the radiative transfer process within the canopy as well as evapotranspiration from the surface that together modulate near-surface climate and atmospheric circulations (Kang et al., 2007). LAI has become a widely used variable for examining vegetation-ecosystem-climate interactions. Recently, several studies have examined LAI as simulated by vegetation models included in the CMIP3 and CMIP5 Global Climate Models (GCMs) (Bao et al., 2014; Li et al., 2015).The mean values of LAI are useful for quantifying vegetation coverage and their changes, and investigation of LAI would provide insight into possible shifts of vegetation types. In particular, not only could historical changes be evaluated and analyzed but also possible future changes under climate change scenarios could be projected, based on the CMIP model LAI outputs.
This study examines the spatial pattern of vegetation changes over the TP using the remotely sensed LAI datasets as well as the possible mechanisms behind the changes using reanalyzed climate datasets.The structure of the paper is as follows. Section 2 introduces the data and methods employed in this study.Section 3 presents the results. Section 4 discusses findings in the context of environmental change and anthropogenic influence. Section 5 provides the summary.
2 Datasets and methodology
Over the TP, vegetation usually starts to grow from May to June, matures in July to August, and decays in September to October. This study focuses on the growing season (GS) over the TP from May through October. We obtain and analyze in the subsequent section the averages of May-October as a proxy for GS vegetation abundance. The examined quantities include long term mean (climatology) and linear trend, as well as interannual variability during 1982-2012.
2.1 LAI Datasets
The Global Land Surface Satellite (GLASS) Leaf Area Index (LAI) product recently generated and released by Beijing Normal University (http://www.bnu-datacenter.com/, Liang et al., 2013) is used here.GLASS is a global LAI dataset for 1982-2012 with a temporal resolution of eight days. For 1982-2000, the LAI product was generated from the AVHRR reflectance and was provided in a geographic projection at the resolution of 0.05°. For 2001-2012, it was derived from the MODIS land surface reflectance(MOD09A1) and was provided in an Integerized Sinusoidal projection at the resolution of 1 km for each land tile of the globe. Intercomparisons of the GLASS LAI product with other existing global LAI products,including MODIS and CYCLOPES, indicate that the GLASS LAI product is (1) of higher quality and accuracy than the others and (2) the most spatially complete and temporally continuous LAI dataset (Liang et al., 2013; Xiao et al., 2014). The GLASS LAI product has also been used in evaluating LAI simulated by GCMs in CMIP5 (Bao et al., 2014).
Another LAI dataset analyzed here is the Geoland2 LAI. It is also a long-term LAI dataset for 1982-2012 that combines the NOAA/AVHRR LAI for the period of 1982-2000 and the SPOT/VGT LAI after 1999 (Baret et al., 2013). The same as GLASS,for the period of 1982-2000, it was derived from NOAA/AVHRR with a resolution of 0.05° in longitude and latitude. In the period after 1999, it was derived from SPOT/VGT with a spatial resolution of 1 km and temporal resolution of 10 days. It is a partly independent dataset from GLASS. Rather than GRNNs in GLASS, it was generated respectively by the Centre National d'Etudes Spatiales (CNES) and the Flemish Institute for Technological Research in Belgium (Vlaamse Instelling Voor Technologisch Onderzoek; VITO).
2.2 Vegetation types
The vegetation types are based on the digitized map from the 1:1,000,000 Vegetation Atlas of China for year 2001 (Editorial Board of Vegetation Map of China CAS, 2001). This atlas was compiled based on field observations, airborne remote sensing measurements, satellite images, and historical data in geology,pedology and climatology. Therefore, the atlas was supposed to represent the mean vegetation distribution for the period during which the field survey and data collection were conducted. Five major vegetation types (steppe, meadow, shrub-land, forest and cropland) are identified over the TP. There also exist other land cover types over the TP, such as desert,barren land, and water bodies. Since our focus is on vegetation and its changes, land cover types other than vegetation are not considered in this study.
2.3 Climate observations
The observed daily mean surface air temperature(Tmean), precipitation (Precip), and diurnal temperature range (DTR) are provided by the China Meteorological Data Sharing Service System at a spatial resolution of 0.5°×0.5°. These gridded data were compiled based on station observations collected and managed by the China Meteorological Administration (Shen et al., 2010; The National Meteorological Information Center, 2012).
2.4 Methodology
The maximum-value composition technique was firstly adapted to obtain the monthly data from the sub-monthly data intervals. Each of the LAI datasets were scaled to a resolution of 0.05° latitude by 0.05°longitude and a temporal resolution of one month spanning the time period 1982 to 2012. To be consistent with the 0.5° resolution of the observed meteorological data (Tmean, Precip and DTR), LAI datasets were again regridded to 0.5° grid through area average interpolation during attributions part (section 3.3).
The consistency between vegetation type and mean GS LAI during 1982-2012 from GLASS dataset was evaluated quantitatively by a coincidence rate defined as:

where Rijis the coincidence rate for the ith (i = 1-5)vegetation type within the jth (j = 1-32) LAI interval defined in Table 2; Aij is the area of the ith vegetation type within the jth LAI interval; and ALAIjis the area of the jth LAI interval of growing season. The results are listed in Table 1. For LAI in 0.0-0.3 and 0.3-1.4,steppe and meadow dominate respectively. For LAI in 1.4-2.5, the vegetation is mixed and consists of meadow, shrub-land, and to a lesser extent forest. For LAI greater than 2.5, forest emerges as the dominant vegetation type. However, forest occupies quite a small area mainly along the southeastern edges and is not one of the major vegetation types over the TP.Also, cropland or shrub-land is not the dominant vegetation type for any of the LAI intervals. A clear boundary does exist between steppe (forest) and the combined meadow, shrub-land and cropland as represented by LAI of less than and greater than 0.3(2.5), respectively (Table 1). Based on LAI, we divide the entire TP into two regions of interest (ROIs) as presented in Figure 1c along the aforementioned clear boundary. The first one (ROI1) corresponds mainly to the northwestern TP with LAI smaller than 0.3 and is covered primarily by steppe. The second one (ROI2)encompasses mainly the southeastern TP with LAI larger than 0.3. ROI2 has meadow as its major vegetation type although other vegetation types also exist.
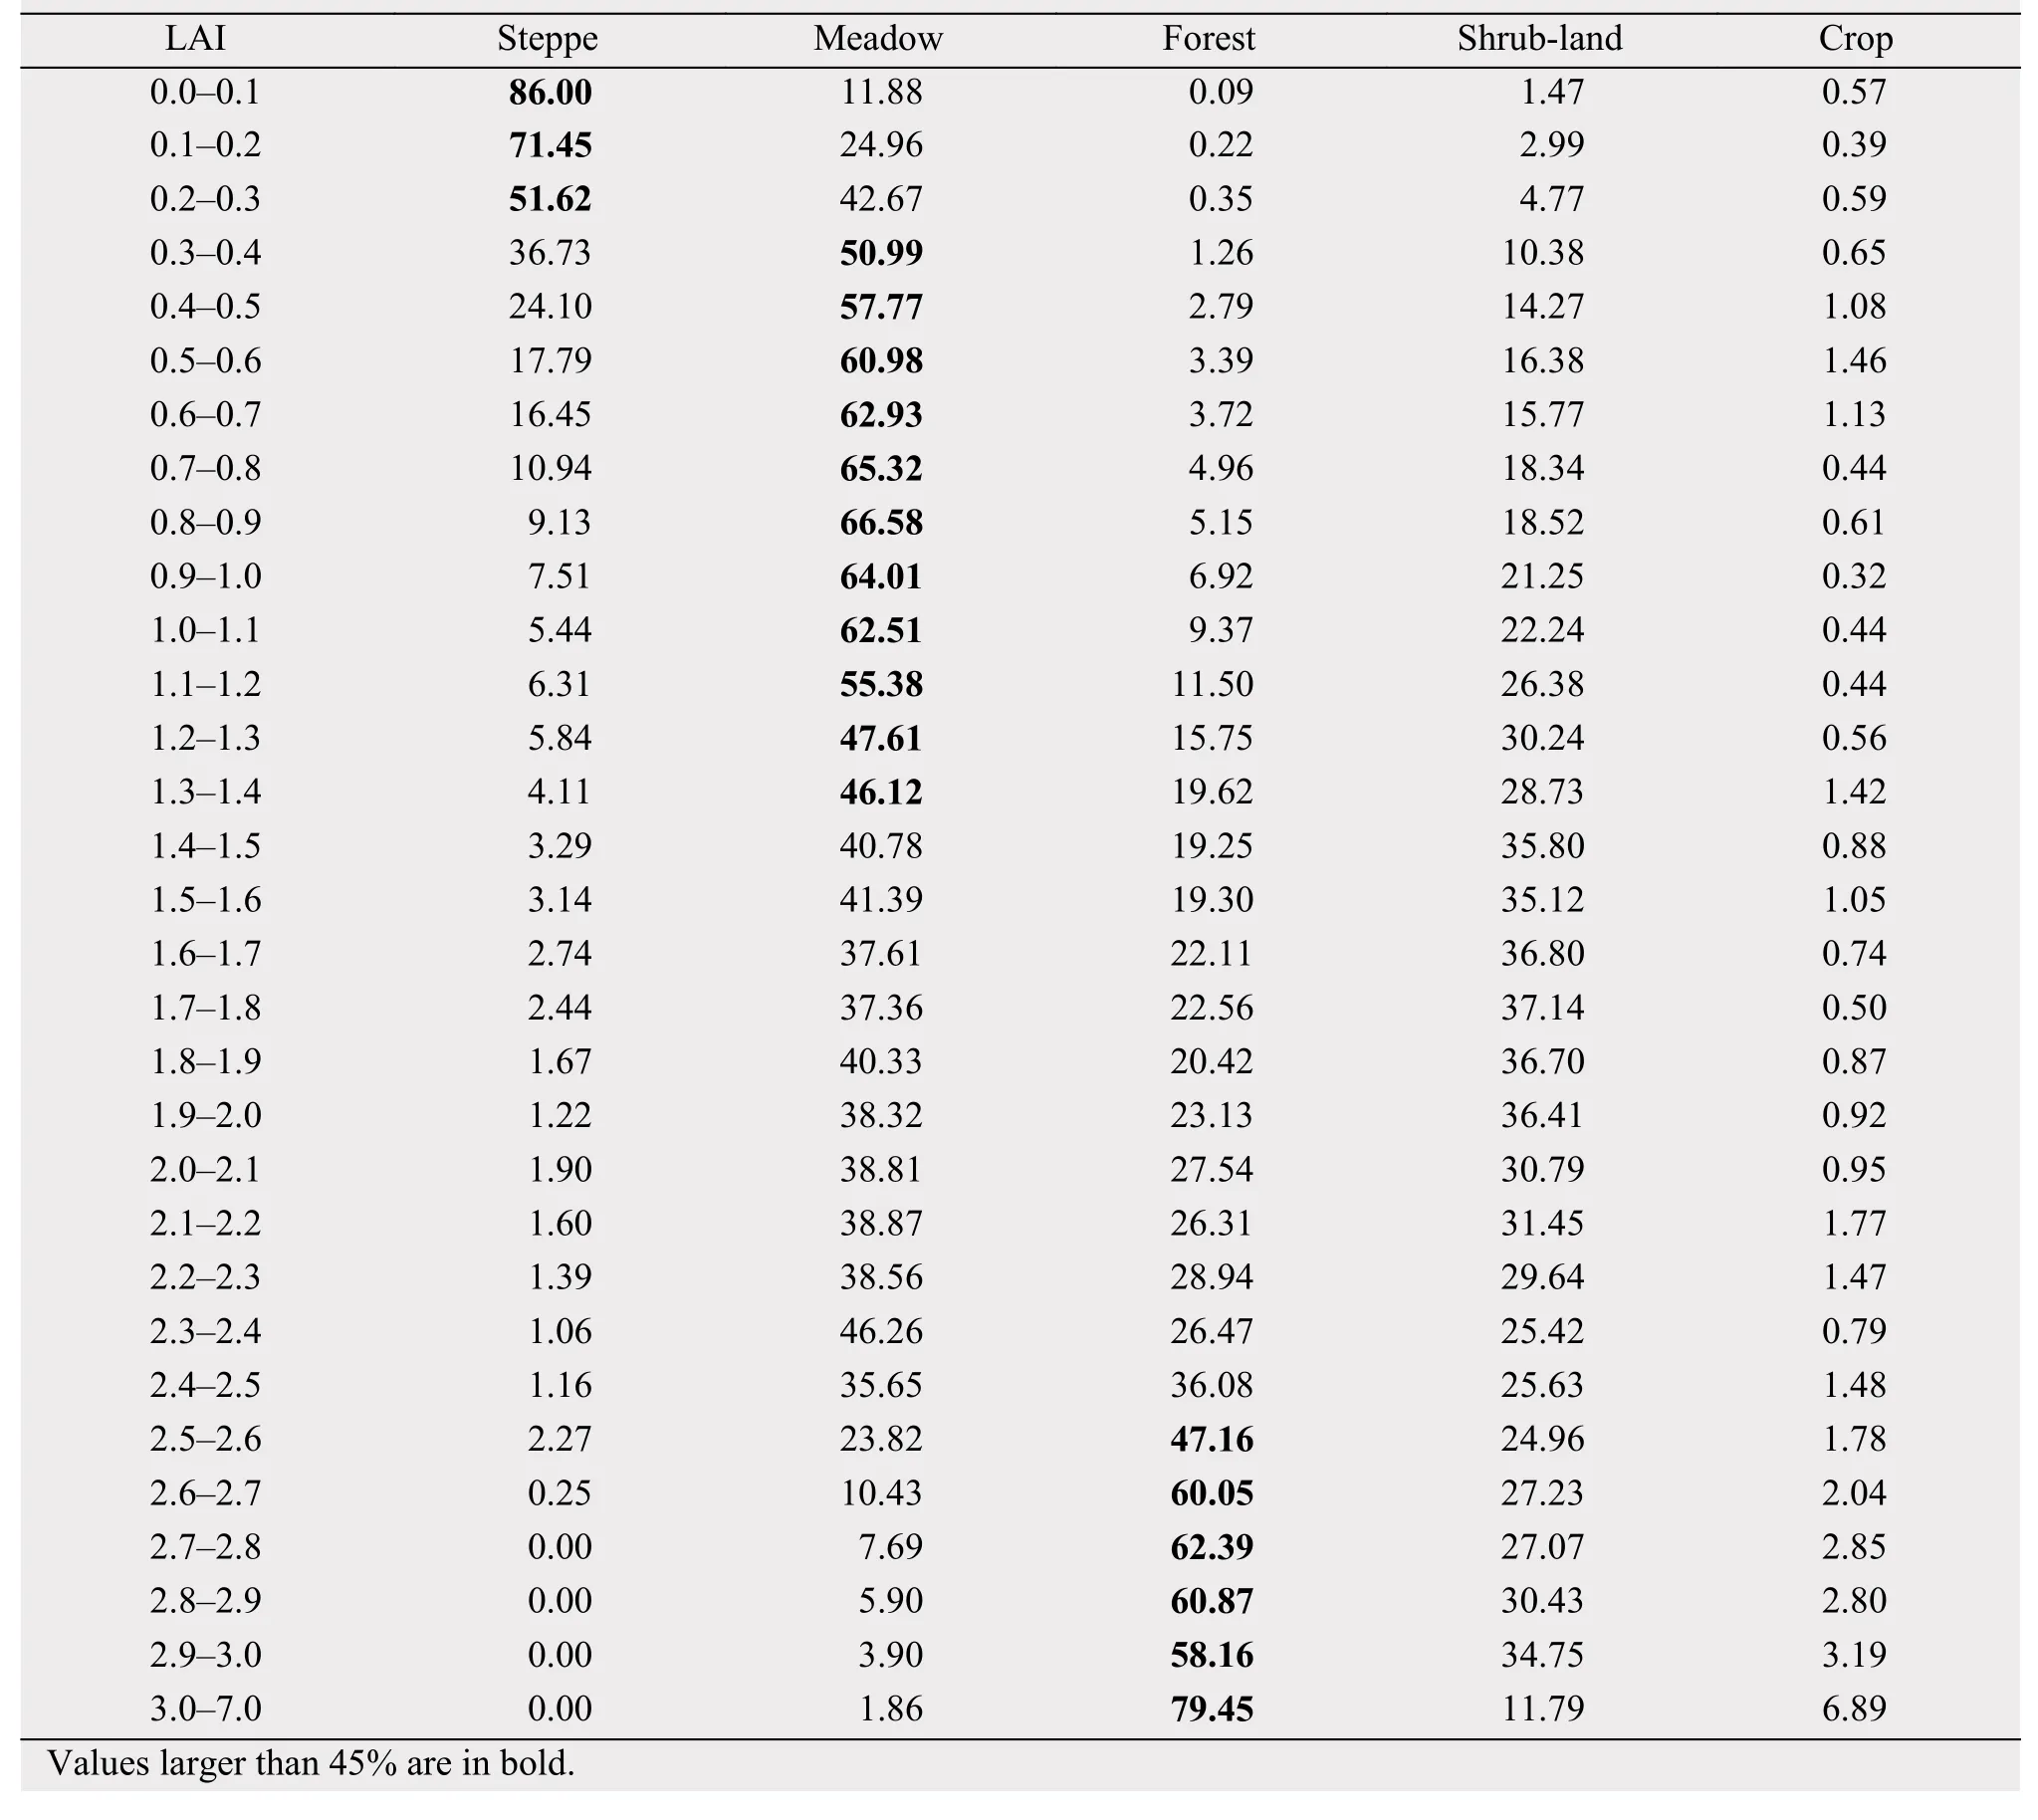
Table 1 Percentage of vegetation covers (coincidence rate) as a function of the GS LAI intervals
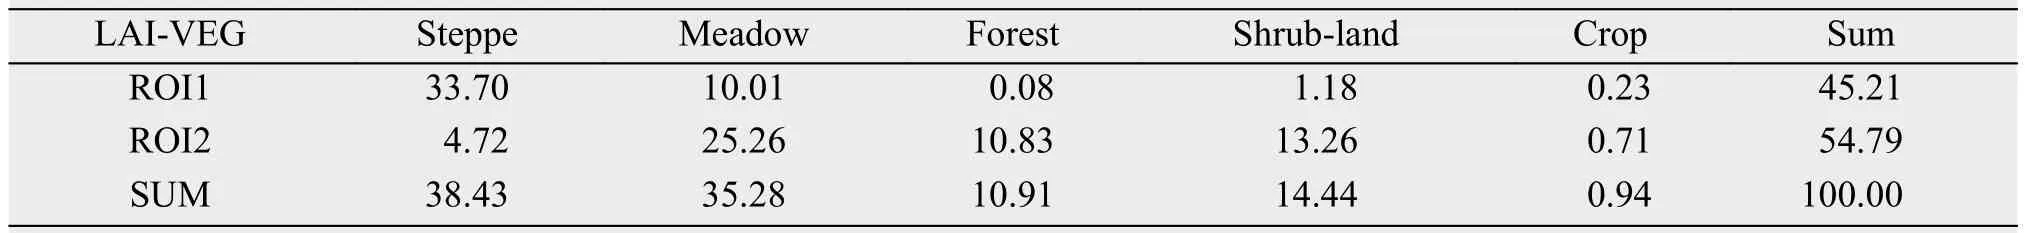
Table 2 Percentage of areas covered by each vegetation type in GS over ROI1 and ROI2 (Unit: %)
3 Results
3.1 Spatial patterns of annual mean precipitation,vegetation types and LAI and their correspondence
Annual mean precipitation over the TP during 1982-2012 shows a clear southeast-northwest gradient of more than 1,000 mm/a in the southeast to less than 200 mm/a in the northwest (Figure 1a). This gradient in precipitation suggests that the entire TP could be divided into an arid/semi-arid northwestern region and a humid/semi-humid southeastern region using a threshold of 400 mm/a (Yang et al., 2011) as indicated by the black line in Figure 1a.
The five major vegetation types over the TP are distributed approximately in juxtaposition from the northwest to the southeast (Figure 1b). Steppe and meadow are the dominant vegetation types over the TP and occupy about 38.4% and 35.3% of the entire vegetated area, respectively (Table 2). Shrub-land,forest and cropland are located primarily over the southeastern TP and together occupy about 26.3% of the vegetated area, much less than the areal coverage by either steppe or meadow. Thus, based on the distributions of vegetation types, the TP could be roughly divided into two regions: steppe dominated northwest and meadow dominated southeast and a dividing line is shown in Figure 1b.

Figure 1 Spatial distributions of (a) annual mean precipitation (mm) during 1982-2012 and the 400 mm dividing line, (b) major vegetation cover types and the dividing line between steppe- and meadow-dominated regions, (c) GS LAI during 1982-2012 and the LAI=0.3 dividing line, and (d) the dividing lines from (a) (blue), (b) (red)and (c) (green). The vegetation cover types map was released in 2001 as an average since 1950
LAI ranges from 0 to 7 and larger LAI is located over the southeast while smaller LAI is found over the northwest (Figure 1c), which suggests a clear correspondence in spatial patterns between LAI (Figure 1c)and vegetation types (Figure 1b) in that larger (smaller) LAI corresponds to meadow (steppe) dominated region. Interestingly, the division lines between the arid/semi-arid climate zone with annual precipitation less than 400 mm and the humid/semi-humid climate zone with annual precipitation more than 400 mm,between the steppe and meadow dominated vegetation types, and between LAI larger and less than 0.3 agree with each other quite well (Figure 1d). Differences among these three division lines appear to fall within the interannual variability of precipitation in 1982-2012 as presented in Figure 2a. All these suggest that (a) the existence of a division line is a robust feature and any changes in the division line would indicate changes in vegetation and climate at least in the vicinity of the division line and (b) precipitation plays an important role in shaping the spatial vegetation pattern (Brovkin, 2002) not only in density (as represented by LAI) but also in types. Hereafter, we denote the northwestern (southeastern) TP as the dry region ROI1 (the humid region ROI2).
3.2 Interannual and inter-decadal variabilities
Figure 2a presents the yearly dividing line from 1982 to 2012 using the annual mean precipitation of 400 mm as the previously defined threshold. The line gradually migrates westward with time during the period but interannual variations are also evident as reflected by eastward retreat in the abnormal dry years and westward acceleration in the abnormal wet years. The yearly dividing line based on LAI (Figure 2b)exhibits a more consistent but much slower westward migration than that based on precipitation. This indicates that changes in vegetation involve a slower and more stable process than those in precipitation and likely other climate variables as well. A temporal correlation at 0.55 (statistically significant at 0.001 significance level) between the annual percentage coverage of ROI2 defined by the area with LAI >0.3 and that by precipitation >400 mm indicates a significant correspondence between LAI and precipitation at an annual time scale (Figure 2c).
To examine inter-decadal variations, we divide 1982-2012 into three nearly equally spaced decades,i.e., 1982-1991, 1992-2001, 2002-2012, and investigate the decadal means. For precipitation (Figure 3a),the dividing lines for the first and second decades are located at nearly the same location while the dividing line for the third decade clearly migrates westward compared to the first two decades, pointing to a wetting trend during 1982-2012 primarily over the intersection of the dry and humid regions that is defined as the overlapping area between the first and the third decades.
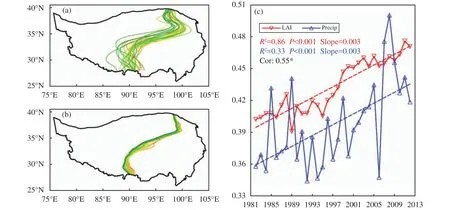
Figure 2 Yearly locations of the dividing lines determined by (a) annual precipitation of 400 mm and (b) LAI of 0.3. Time series and linear trends of the areal coverage percentage of the humid region ROI2 in relation to the entire TP as determined by LAI (red lines) and precipitation (Precip, blue lines) are presented in (c). The time period is 1982-2012 and for the growing season. In (a) and (b), the yellow lines represent the earlier years while the green lines represent more recent years. In (c), coefficient of determination R2, statistical significance p-value, regression coefficient and correlation are indicated
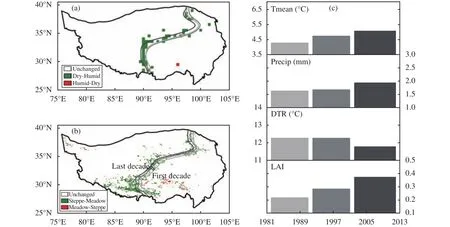
Figure 3 Decadal locations of the dividing lines determined by (a) annual precipitation of 400 mm and (b) LAI of 0.3. Decadal means of Tmean, Precip, DTR and LAI over the intersection of ROI1 and ROI2 are presented in (c). The time period in 1982-2012 and the three decades are 1982-1991, 1992-2001, 2002-2012.In (a) and (b), the light gray, the light black, and the dark black lines represent the first, second, and third decade, respectively
Over the entire 1982-2012 period, the linear trend of LAI is 0.22/10a for the dry ROI1 while it is 0.05/10a for the humid ROI2, suggesting that more greening has taken place in the dry region than in the humid region. The decadal means based on LAI (Figure 3b)also show a gradual but steady westward migration of the dividing line from the first decade to the third decade, pointing to a westward expansion of the meadow dominated ROI2 and reduction of the steppe dominated ROI1 primarily over the intersection of the two ROIs. During 1982-2012, 7.42% of ROI1 that is adjacent to ROI2 and covered by steppe in the first decade is replaced by meadow in the last decade. On the contrary, only 1.03% of ROI2 that is covered by meadow in the first decade is replaced by steppe in the last decade and the replacement has occurred mainly in the interior of ROI2. Since LAI for meadow is larger than that for steppe, the replacement of steppe by meadow in parts of ROI1 could have contributed to a larger positive change and trend in LAI for ROI1 than for ROI2. Yang et al. (2004) report that meadow is the most stable vegetation type over the TP among all vegetation types, followed by steppe and shrub-land. Thus, the identified vegetation type shift in parts of ROI1 from steppe to meadow may indicate improvement in vegetation coverage over the TP in recent decades. The opposite replacement from meadow to steppe happens primarily in the interior of ROI2 but to a much lesser extent.
The above findings based on the GLASS LAI dataset are further supported by analyses using another LAI dataset, the GeoLand2 LAI dataset, for the same time period. The results presented in Figures 4c and 4d show the greening trend over the TP and the replacement of steppe by meadow over the intersection of the two ROIs. The annual variabilities of two regions areas for two datasets are presented on the left of Figure 4. Area of the arid (humid) region decrease(increases) gradually in the three decades. To demonstrate the decadal change, change of the last decade(2003-2012) compared to the first decade (1982-1991) are presented on the right hands of Figure 4.Two datasets show a prevailing increase (decrease) of the humid (arid) region areas in the intersection between arid and humid regions indicating an (a) expansion (shrink) of the Meadow (Steppe) in recent decade. To summarize, two LAI datasets reveal a greening trend and the replacement of steppe by meadow over the intersection of the two ROIs,however inconsistency still exists among available datasets because of the coherence between different sensors.
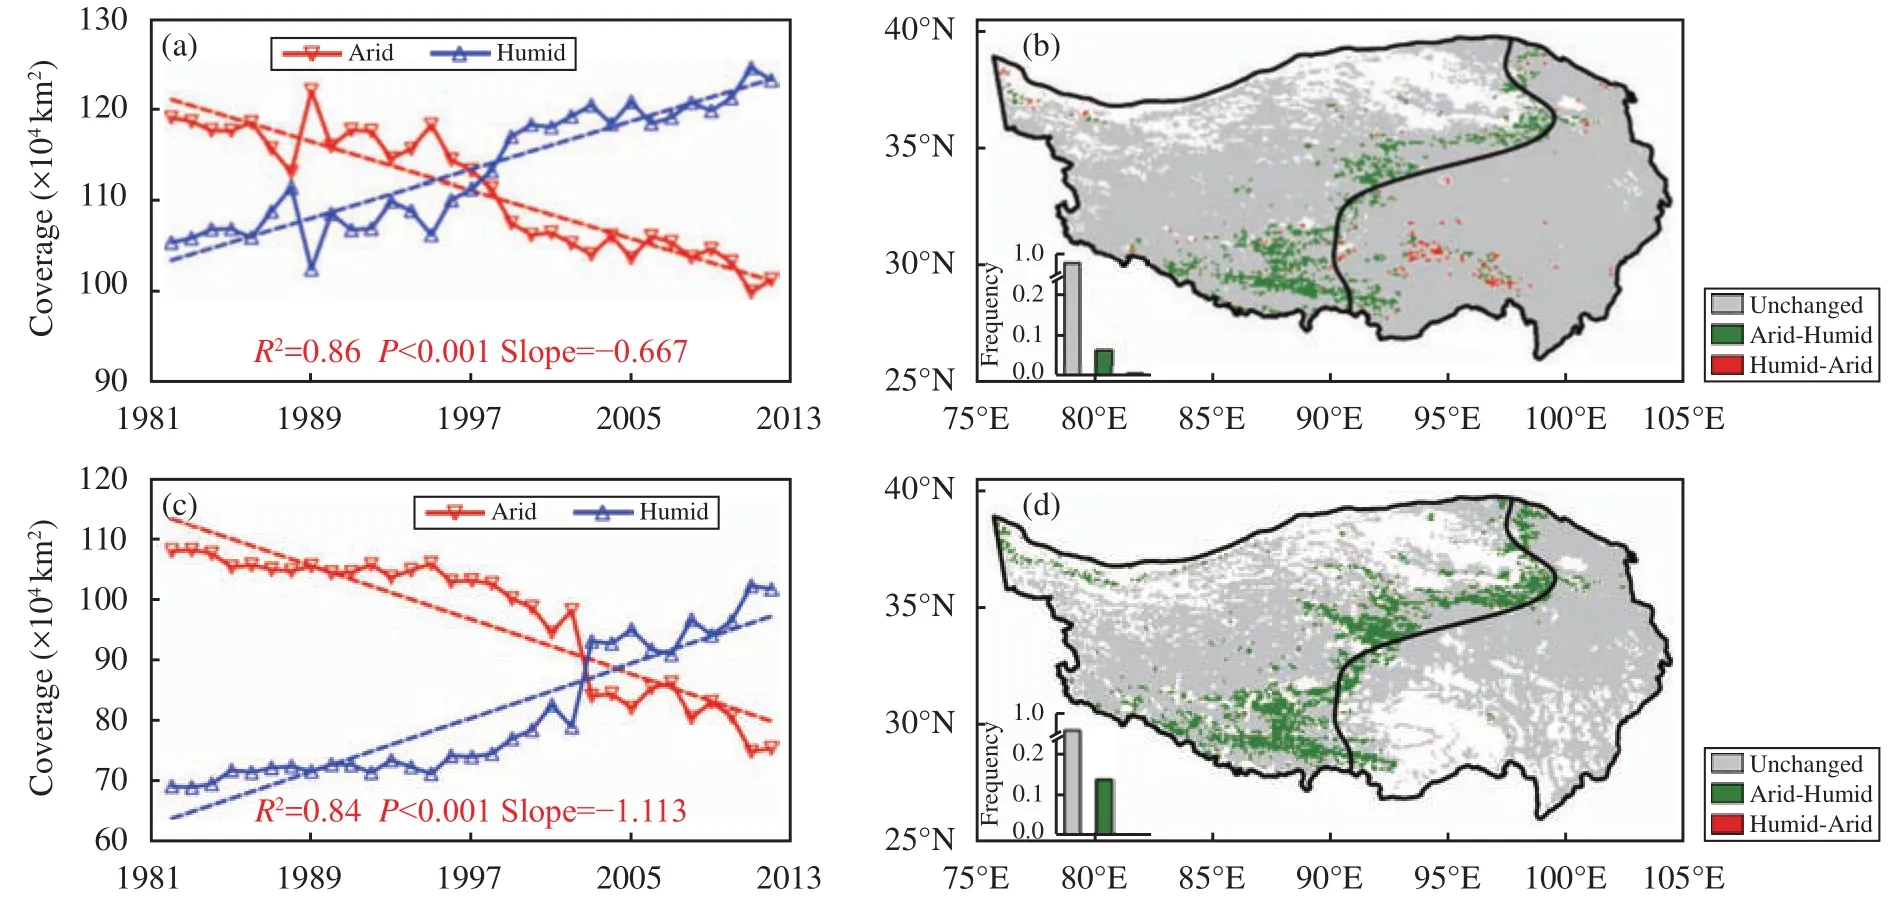
Figure 4 Time series of the yearly areas of arid and humid regions during 1982-2012 (a, c) and spatial distributions of the shift between steppe and meadow in the last decade (2003-2012) compared to the first decade (1982-1991) for GLASS LAI (a, b) and GeoLand2 LAI (c, d). Coefficient of determination R2, statistical significance p-value,and regression coefficient for the arid region are indicated in (a) and (c). Green shadings in (b) and (d) denote the locations where steppe was replaced by meadow and red shadings denote the locations where meadow was replaced by steppe
3.3 Connection between LAI changes and climate change
To explore the possible causes for decadal changes in LAI, we examine here decadal changes in climate variables focusing on the intersection of the two ROIs where major changes tend to take place.Table 3 presents the correlation and it shows that Tmean, precipitation and DTR are all statistically significantly correlated with LAI over the entire period.The correlation for precipitation is slightly higher in magnitude than that for Tmean and DTR. Also for precipitation and DTR, the last two decades correspond to much higher and statistically significant correlation than the first two decades, indicating a stronger influence of precipitation and DTR on LAI in recent two decades. On the other hand, Tmean exhibits much lower correlation in the last two decades than in the first two decades, likely suggesting the reduced influence of Tmean on LAI in recent two decades. In terms of actual changes, Tmean steadily increases with each decade while precipitation and DTR show little changes in the first two decades but significantly increases in the case of precipitation and decreases in the case of DTR in the last decade (Figure 3c).LAI displays a steady increase with each decade(Figure 3c). It appears that in the first decade the change impacts of Tmean on LAI are dominant while in the last decade the change impacts of precipitation and DTR become more important, which leaves the middle decade as the transition period.
During 1982-2012, the areal coverage of ROI1(ROI2) steadily increases (decreases) although interannual variations exist as noted before (Figures 4a,4c). Gao et al. (2014) and Gao et al. (2015a) reported a sharp shift in Tmean and precipitation over the TP around 1997/1998 and gave the different roles of the climate variables in influencing vegetation changes between the first and the last decades, also divided 1982-2012 into two periods using 1997/1998 as the cut-off year and analyze climate means and linear trends in the two periods for the dry and humid regions. Tables 4 and 5 list the means and linear trends of LAI, precipitation, Tmean and DTR averaged separately over the ROIs and over the TP for 1982-1997 and 1998-2012, respectively. It can be seen that mean LAI, precipitation and Tmean (DTR) all increases(decreases) in 1998-2012 compared to 1982-1997 for both ROIs (Table 4) but large differences in the linear trends are evident between the two ROIs (Table 5)as described in the following.
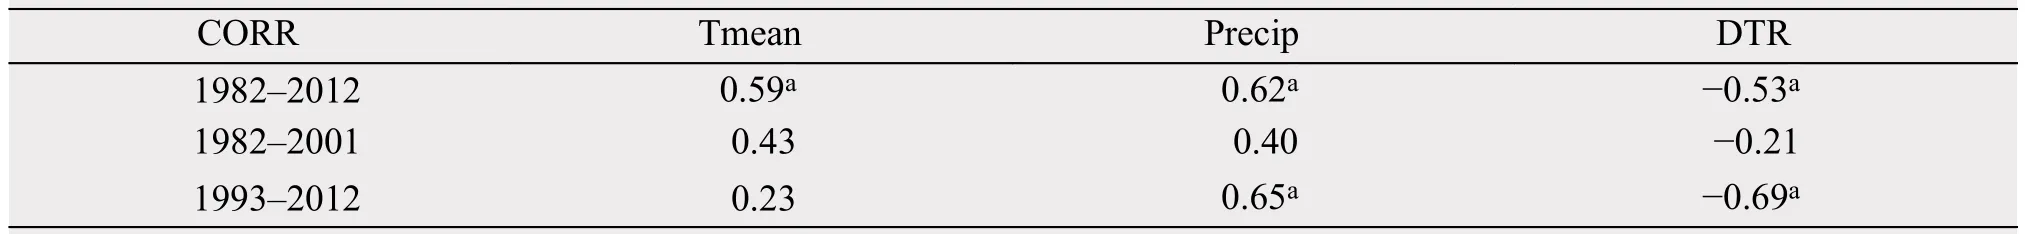
Table 3 Temporal correlation of annual LAI with annual mean surface air temperature (Tmean), precipitation (Precip),and diurnal temperature ranger (DTR) in the three decades (1982-2012), the first two decades (1982-2001)and the last two decades (1993-2012). Correlation coefficients that are statistically significant at the 0.001 level based on the two-tailed t-test are marked with a
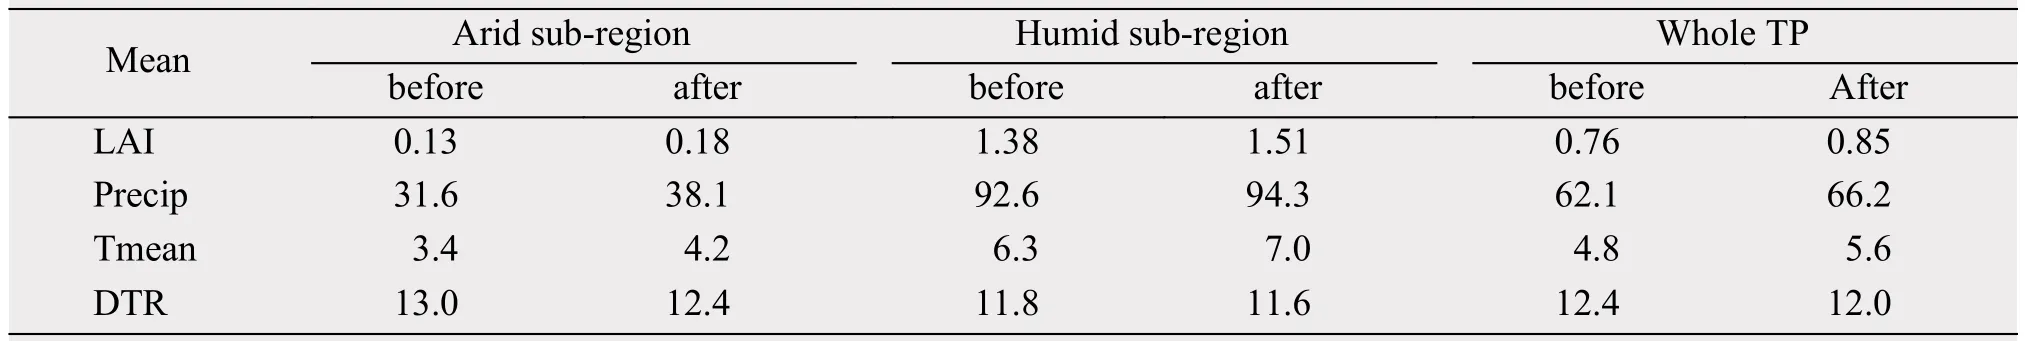
Table 4 Means before and after 1997/1998 (i.e., 1982-1997 and 1998-2012) of GS LAI and three climate variables over the two subregions and the entire TP (Precip: precipitation; Tmean: mean surface air temperature; DTR: diurnal temperature range. Unit for Precip is mm, unit for Tmean and DTR is °C)
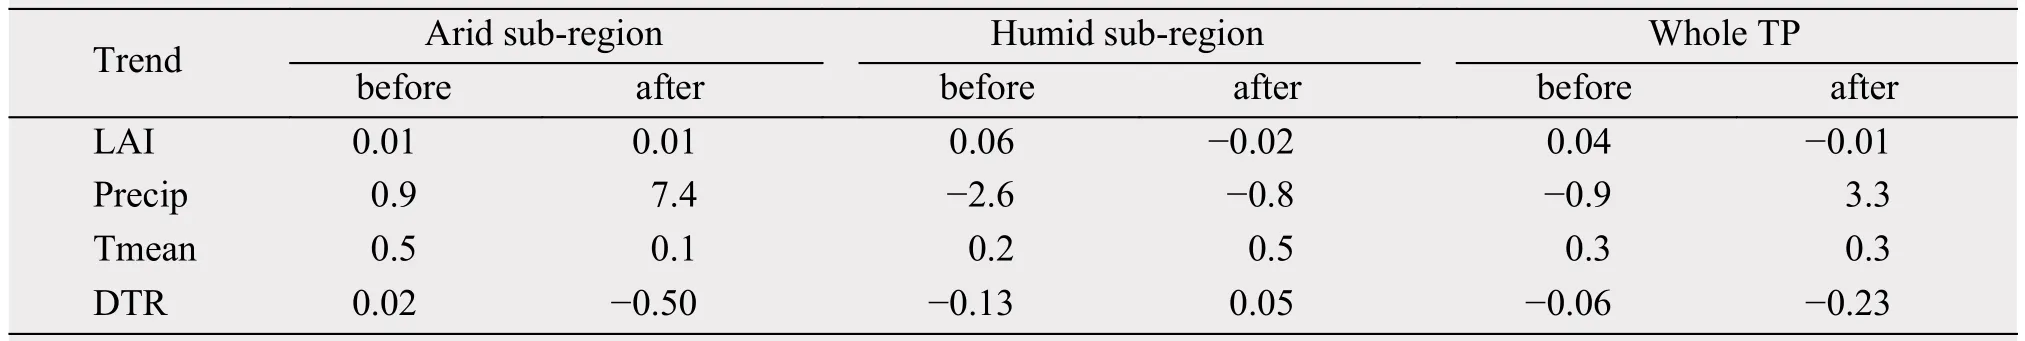
Table 5 Same as Table 4 except for the linear trends of the variables for 1982-1997 and 1998-2012 (Unit for Precip is mm/10a,unit for Tmean and DTR is °C/10a)
Relatively small positive linear trends of LAI are found for ROI1 for both periods, whereas for ROI2 the linear trend is strongly positive for the first period but negative for the second period (Table 5). Precipitation shows a wetting (drying) trend for ROI1 (ROI2)for both periods but more (less) for the second period.Tmean trends are all positive although the warming trend is smaller (larger) for ROI1 (ROI2) for the second period compared to the first period. DTR displays a small positive trend for the first period but large negative trend for the second period for ROI1 while the opposite is true for ROI2. This analysis seems to suggest that for ROI1, the impacts of decreased warming on LAI in the second period compared to the first period is enhanced by decreased DTR but opposed by increased wetting which together may result in little changes in LAI between the first and second periods; while for ROI2, the impacts of increased warming in the second period compared to the first period is strengthened by decreased drying opposed by increased DTR which together may give rise to reduced LAI for the second period compared to the first period.
Vegetation increase can affect regional climate through two contrasting and co-existing mechanisms:one is a warming effect through reducing the albedo and absorbing more net radiation due to greening, the example of which is greening Sahara (Muschitiello et al., 2015) or Arctic (Jeong et al., 2012, 2014); the other one is a cooling effect through enhancing evapotranspiration due to greening (Shen et al., 2015). The warming effect will reinforce warming while the cooling effect will oppose warming but the final outcome will depend on the competition of the two mechanisms. The different Tmean linear trends for two periods over ROI1 and ROI2 may be a result of the competition between the two mechanisms in the arid and humid regions. Radiation and water requirements are necessary in vegetation growing. Over humid ROI2 where thick vegetation grows, water limitation does not exist. Radiation change owing to the albedo reduction effect beats the enhancement of evapotranspiration showing a greater warming rate. On the contrary, over the arid ROI1 with spare vegetation and enough net surface radiation, effect of water changes dominates. The cooling mechanism attributing to enhanced evapotranspiration leads to the slower warming rate. Averaged over the whole TP, the two mechanisms may have reached a balance, which is indicated by the fact that the warming rates of Tmean during two the periods are similar.
4 Conclusions
Vegetation changes over arid and humid regions of the TP during 1982-2012 were analyzed using the GLASS LAI satellite dataset. Based on the distributions of annual mean precipitation, major vegetation types, and LAI, the TP was divided into a humid southeastern region (ROI2) dominated by meadow with annual mean precipitation more than 400 mm and the mean LAI larger than 0.3, and a dry northwestern region (ROI1) covered mainly by steppe with annual mean precipitation less than 400 mm and the mean LAI smaller than 0.3. The dividing lines of annual precipitation for 400 mm and LAI for 0.3 corresponded well to each other on the interannual and inter-decadal time scales. LAI (0.3) was subsequently used as a threshold for examining vegetation type changes: the shift from steppe to meadow took place whenever LAI increased from less than 0.3 to greater than 0.3, and vice versa.
This analysis shows that changes in vegetation types occurred primarily in the intersection of the dry and humid ROIs where major changes in climate variables also occur. Clear growth (reduction) of the area covered by meadow (steppe) in the intersection of the two ROIs was identified, consistent with findings from using another independent satellite product. Surface air temperature and precipitation (diurnal temperature range) contributed positively (negatively) to vegetation changes though climate variables displayed varying correlation with LAI for different time periods and different regions. It appeared that during the three decades of 1982-2012 the change impacts of surface air temperature on LAI were dominant in the first decade while in the last decade the change impacts of precipitation and DTR became more important.
5 Discussions
The TP is characterized by a complex topography with elevations ranging from 2,000 m to 8,000 m. A majority of the high mountain ranges on the TP are located in the northwesten ROI1. Gao et al. (2015a)reported a terrain dependent P-E changes over the TP related to precipitaiton changes. The larger vegetation change over ROI1 than ROI2 identified in this work appears to be consistent with the "pumping" theory proposed by Wu et al. (2013): warming near gound surface triggers stronger uplift that in turn transports more warm air parcels to higher elevations which facilitates the generation of more precipitaiton and subsequently the growth of vegetation there.
In addtion to climate change, human activity could also bring changes to the vegetation over the TP in a profound way (Zhang et al., 2013b). One example is the implementation of a series of national policies for grassland protection and conservation that has already benefited vegetation growth in some areas over the TP (Zhou et al., 2009; Xu et al., 2011). On the other hand, such human activity as overstocking of livestock, poor livestock management, and excessive soil disturbance from small mammals, could result in vegetation degradation (Lin et al., 2010) and the degree of degradation depends heavily on the population density (Cui et al., 2007; Xu et al., 2011). Thus,the eastern TP with a relatively large population ought to suffer more from human activity than the vast nortwestern TP.
Besides climate change and human activity, rooteating animals could be another reason for vegetation degradation. These animals live underground and survive by eating grass roots. Vegetation roots plays an improtant role in maintaining surface soil liquid water capacity on the TP (Gao et al., 2015b). The continuous eating of vegetation roots would greatly reduce the surface soil water and could lead to longterm vegetation degratdation. In this work, the areas with vegetation degradation identified using the GLASS LAI dataset and to some degree the Geo-Land2 LAI dataset correspond mainly to less populated areas around the headwater of the Three Rivers(the Yellow, Yangtze and Mekong rivers) basins. Interesingly, many of these areas showing vegetation degradation are actually located in counties that report being overrun by rats and special insects according to farmers and yearbooks (Yang et al., 2006;Dong et al., 2012). It seems quite likely that root-eating animlas might have contributed more to vegetation degradation than human activity over some parts of the TP.
Acknowledgments:
We thank the Center for Global Change Data Processing and Analysis of Beijing Normal University for the GLASS LAI dataset. This work is jointly supported by National Natural Science Foundation of China (91537105, 91537211,41322033), the Opening Research Foundation of Key Laboratory of Land Surface Process and Climate Change in Cold and Arid Regions, and the Chinese Academy of Sciences (LPCC201504). D. Chen is supported by Swedish VR, STINT, BECC and MERGE, as well as SNIC through S-CMIP.
 Sciences in Cold and Arid Regions2018年6期
- Sciences in Cold and Arid Regions的其它文章
- The 2018 Academic annual meeting of China Society of Cryospheric Science was held successfully in Foshan on November 17-18, 2018
- Academic Workshop of China Society of Desert in the Geographical Society of China successfully held in Changsha, Hunan Province
- Fossil Taiwannia from the Lower Cretaceous Yixian Formation of western Liaoning, Northeast China and its phytogeography significance
- Local meteorology in a northern Himalayan valley near Mount Everest and its response to seasonal transitions
- Simulation and prediction of monthly accumulated runoff,based on several neural network models under poor data availability
- Stable isotopes reveal varying water sources of Caragana microphylla in a desert-oasis ecotone near the Badain Jaran Desert