Numerical modeling of deep-seated landslides interacting with man-made structures
Giovanni Barla
Politecnico di Torino,Torino,Italy
Keywords:Deep-seated landslides Man-made structures Landslide-structure interaction Monitoring of landslide movement Numerical modeling
A B S T R A C T This paper describes the interaction between deep-seated landslides and man-made structures such as dams,penstocks,viaducts,and tunnels.Selected case studies are reported first with the intent to gain insights into the complexities associated with the interaction of these structures with deep-seated landslides(generally referred to as deep-seated gravity slope deformations,DSGSDs).The main features,which characterize these landslides,are mentioned together with the interaction problems encountered in each case.Given the main objective of this paper,the numerical modeling methods adopted are outlined as means for increase in the understanding of the interaction problems being investigated.With the above in mind,the attention moves to an important and unique case history dealing with the interaction of a large-size twin-tunnel excavated with an earth pressure balance(EPB)tunnel boring machine(TBM)and a deep-seated landslide,which was reactivated due to the stress changes induced by tunnel excavation in landslide shear zone.The geological and geotechnical conditions are described together with the available monitoring data on the landslide movements,based on the advanced and conventional monitoring tools used.Numerical modeling is illustrated as an aid to back-analyze the monitored surface and subsurface deformations and to assist in finding the appropriate engineering solution for putting the tunnel into service and as a follow-up means for future understanding and control of the interaction problems.The simulation is based on a novel time-dependent model representing the landslide behavior.
1.Introduction
Deep-seated landslides(generally referred to as deep-seated gravity slope deformations,DSGSDs)are large mass movements.They are found in most rock types,with discontinuous and poorly defined lateral boundaries,large volumes,great thickness,and relatively low rate of movements over long periods.They occur as“saggings”in metamorphic,igneous,or layered sedimentary rocks in alpine areas,and as “lateral spreads”in areas with structurally complex formations(e.g.clays and clayey shales in the Italian Apennines),as described by Agliardi et al.(2012).
The interest of this paper is on DSGSDs,when they interact with man-made structures,typically dams,penstocks,viaducts,and tunnels.In these cases,the attention moves to understand through simulation method show a DSGSD is displaced,generally at a constant deformation rate,along a shear surface and more frequently through a shear zone.In cases,these structures are “passive”,meaning that they undergo the movement imposed by the landslide.In other cases,typically for a tunnel during excavation,the tunnel is “active”and may “reactivate”the landslide.
In line with the main topic covered in this paper,the purpose is to illustrate the critical role of computation methods in the understanding of these complex problems.A few selected case studies taken from personal experience will be described first,focusing on the relevant aspects regarding the interaction of the man-made structures with deep-seated landslides,also underlining the numerical modeling methods used to investigate the problem.
Then,the case history of a large-size twin-tunnel(each tube is 15.6 m in diameter),excavated by using an earth pressure balance(EPB)tunnel boring machine(TBM)along the new highway recently built in Italy,parallel to the A1 Highway between Bologna and Florence,will be considered.Tunneling took place through complex rock formations such as argillites(Argille a Palombini,APA),claystones(Brecce Argillose Poligeniche,BAP),and highly clayish sandstones(Scabiazza,SCA).
Numerical modeling has been applied with close attention to the monitoring data obtained on the ground surface and at depth,during tunnel excavation.The need to properly use numerical methods in engineering practice is discussed.This implies that the results of the model reflect the observed in situ behavior and,in case of tunnels,the opening response realistically.The outcomes of the engineering studies performed are underlined with the objective to find the solution needed for the tunnel in the long term.
2.Case studies
The interest here is on DSGSDs,when these interact with man made structures,typically in this paper dams,penstocks,viaducts,and tunnels.A few examples taken from the work performed by the author are briefly reported in the following,with the main intent to highlight some of the typical conditions encountered and the problems met.
2.1.Dams
The subject of interaction between dams and landslides is well documented(Schuster,2006)with the description of selected case studies of dams on landslides(by landslide types).Notable cases are reported in which dams have been built on landslides or landslides have occurred in foundations or abutments either during construction or after completion of the dam.
In the following,two dams constructed in Italy are mentioned(Fig.1):the Beauregard Dam and the Pian Palù Dam.The first dam is a “gravity arch in concrete”dam,built between 1951 and 1957 in the Valgrisenche Valley,Aosta(Anidel,1952a,1961a).The second dam is a“concrete block dam”,constructed between 1951 and 1957 in the Noce Valley,Trento(Anidel,1952b,1961b).It is important to remind here,in order to underline the time of constructions of these two dams,that the Vajont landslide occurred on 9 October 1963(Barla and Paronuzzi,2013).
The interest for these two dams stems from the fact that they both interact with a DSGSD.However,at the time of design and during construction,the awareness that the two dams were interacting with deep-seated landslides on the left side abutment was completely different.In the first case(Beauregard Dam),the archgravity dam was constructed and only during the first impounding of the lake,landslide movements took place resulting in severe damages of the dam.In the second case,the designer became aware of the presence of the deep-seated landslide and the dam was built using large concrete blocks with friction joints,able to withstand large deformations.
The Beauregard Dam(Fig.2)is a symmetric 132 m high concrete arch-gravity dam with double curvature,resting on a concrete abutment that distributes the load over the rock foundation and forms the gorge plug.The horizontal sections are arches of variable thickness due to the adoption of a polycentric line for the intrados,more curved in the abutment zone.The thickness of the dam at the abutments varies linearly from 5 m at the crest to 50 m at the bottom.The DSGSD is a massive slowly moving landslide impinging on the dam at the landslide toe.The fractured rock mass of the landslide is composed of gneiss and mica-schist with prasinite intercalations belonging to the Gran San Bernardo Series.
As depicted in the schematic cross-section of Fig.3,a significant portion of the slope undergoes deformations and extends approximately 1500 m in height from the toe(1700 m a.s.l.)to the mountain ridge(3200 m a.s.l.).Numerous internal scarps,ridge and trough morphology,open tension cracks and trenches characterize the landslide.A main head scarp trending E-W with a relief of about 150 m is present in the northern sector of the landslide and is interpreted as the day-lighted portion of the main DSGSD surface.

Fig.1.Locations of the Beauregard and Pian Palù dams.Views of the sites.

Fig.2.Cross-section of the Beauregard Dam(left)and a view of the reservoir in 1962(right)(Anidel,1952a,1961a).
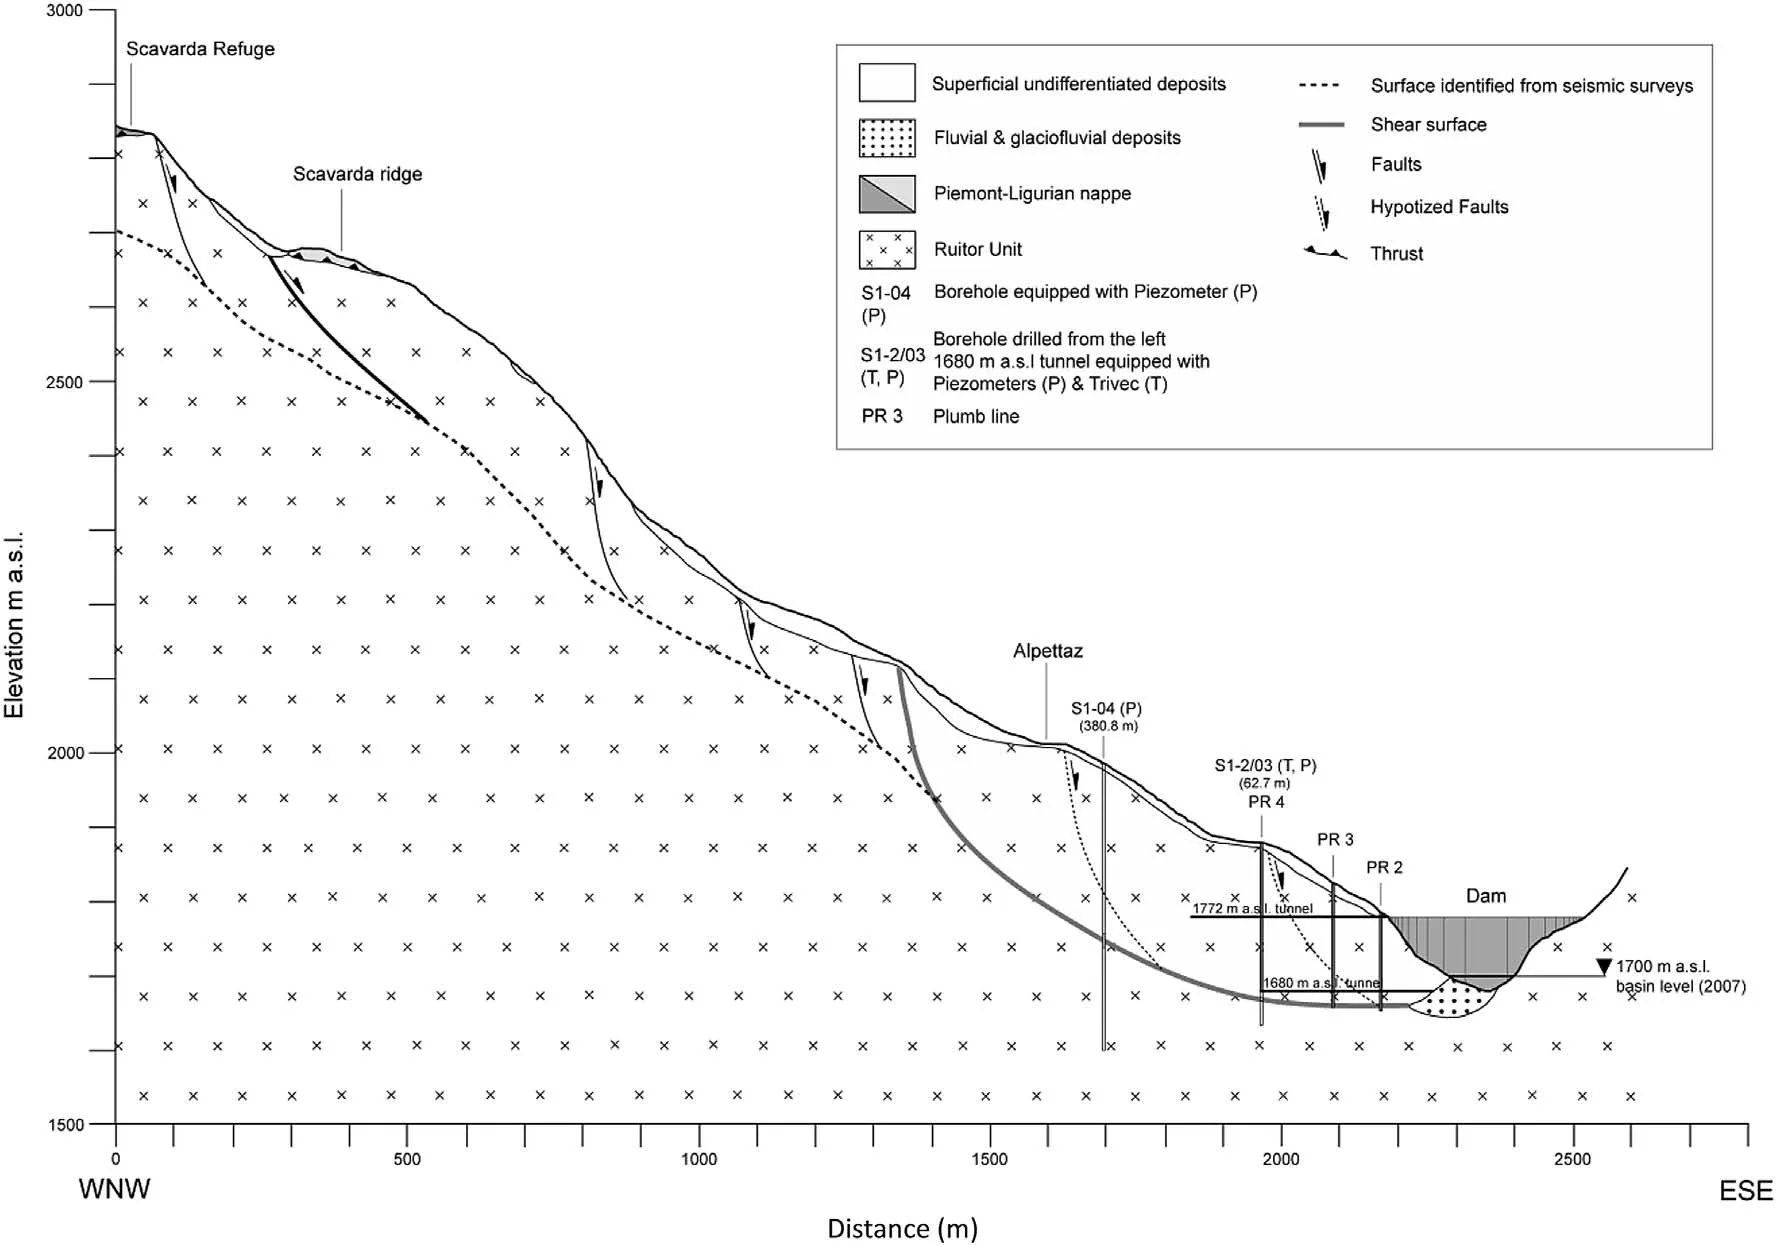
Fig.3.Cross-section showing the main features of the Beauregard DSGSD in relation to the dam(Engl et al.,2014).
Continued loading of the left dam abutment has caused some closure of the arch with deformation and cracking developing on the downstream side.Deformations with the reservoir taken down below elevation 1705 m(65 m approximately below the design reservoir level)continued at a rate of 5 mm per year.Typically,a yearly response with a displacement rate increase in June generally takes place,so that the ltalian Dam Authority declared in 2004 that“the dam should be dismissed unless effective means were found to slow down the slope movement”(Barla et al.,2006,2010).
The Pian Palù Dam(Fig.4)is a rectilinear axis gravity dam with a height of 50 m above the general foundation plane.It is formed of dry concrete blocks roughly squared(4 m×4 m×4 m in size),placed according to vertical columns with the aim to form triangular spurs normal to the upstream and downstream faces.Between the concrete blocks,joints are interposed which are filled with sand.The vertical columns are separated with frictional joints.In this manner,the overall dam structure is capable of absorbing without damage the expected deformation consisting of both settlements and horizontal displacements,due to the interaction with the left side slope Cima delle Mandiole landslide and to different reservoir levels(Catalano et al.,2000;Picarelli and Russo,2004).
The bedrock at the site consists of paragneiss,mylonitic orthogneiss and quartzite.The left abutment of the dam in particular is formed of heavily fractured rock masses.Fig.5 illustrates the cross-section of the DSGSD,where slope movements take place along a basal shear zone,located up to 200 m below the ground surface.As described in Agliardi et al.(2012),the shear zone is curved upslope and nearly planar below the lower part of the slope.The presence of an active wedge bounded by scarps and counterscarps in the upper part of the slope is underlined.

Fig.4.A view of the Pian Palù Dam nearly completed(left).The “vertical columns”(right)(Photographs from the Trento Province Archives).
Monitoring data show that following an increase in slope movement,which was accompanied by the first impounding of the reservoir in 1960,the landslide has been undergoing slow movements of the slope toe at an average rate of displacement of 5-6 mm per year.However,a sudden increase in displacement rates was reported in 1977 following extreme rainfalls and snow melting.This was accompanied by an upward tilting of the left-hand side of the dam,with a total vertical displacement of up to 10 mm.It is worth to mention that this event well demonstrated once again the suitability of the design solution adopted.
Numerical modeling studies of the Beauregard landslide have been carried out with two-dimensional(2D)plane strain continuum methods,with both the finite difference method(FDM)and the finite element method(FEM)(Barla et al.,2006;Barla,2010).Limit-equilibrium stability analyses have been performed based on a stochastic approach(Miller et al.,2008).Also three-dimensional(3D)mixed continuum-discontinuum methods(Kalenchuk,2010)were applied.In addition,the time-dependent deformations of the basal shear zone were studied with the 2D creep equilibrium analysis method-CrEAM proposed by Engl et al.(2014).
In the case of the Pian Palù Dam,numerical modeling in 2D conditions was performed with the FDM.A Mohr-Coulomb elastoplastic model including ubiquitous joints was used in order to account for rock mass anisotropy.The interest here stems from the fact that the simulation accounted for the evolution of the slope in time and included all the relevant surface rock mass features inferring the landslide kinematics(Agliardi et al.,2012).
2.2.Penstocks
A DSGSD extending over an area of 5.5 km2(Fig.6),with a total height of 1300 m from the crest to the toe,is near the village of Rosone,in the Orco Valley(Gran Paradiso massif),Piedmont Region,some 50 km N-NW of the city of Torino,where the Rosone Hydropower Station is located.Granite and gneiss rock masses outcrop in the area,where the levels of mica-schist and chloriteschist are also present.At the toe of the slope,on the east side,the 100 MW hydropower station is located,which provides electricity to the city.

Fig.5.Cross-section showing the main features of the Cima di Mandiole DSGSD in relation to the Pian Palù Dam(Agliardi et al.,2012).

Fig.6.Penstocks interaction with a DSGSD.Schematic drawing(left)and photograph of the penstocks with evidence of deformations(right).Rosone Hydropower Station.
A 15.8 km long headrace tunnel,in the upper part of the deepseated landslide,takes the water from the Ceresole Reale Reservoir to a forebay and then,with a head of 800 m,down to the hydropower station,through two surface penstocks.As shown in Fig.6,these penstocks are along the slope on its east side and undergo continuous deformations due to the interaction with the landslide.
The western portion of the DSGSD(Ronchi in Fig.6)represents a highly advanced evolution stage of deformation,with the original rock very disrupted.The central sector(Perebella in Fig.6)is in a preliminary stage of deformation with the rock mass significantly disjointed(a discontinuum),whereas the eastern sector,which interacts with the penstocks(Bertodasco in Fig.6),undergoes continuous gravitational movements,with a rate of displacement at the toe of 6-7 mm per year.
Comprehensive geological and geomechanical investigations were carried out at various times on this landslide(Forlati et al.,2002).A real-time continuous performance monitoring is at present active in the area.The motivations for these studies are the presence of the hydropower station and,at the toe of the DSGSD,of a road taking people in the upper part of the valley.In addition,to be mentioned is that in the past,along the slope,inhabited villages were present,which in 1957 needed to be relocated.
Also for this deep-seated landslide,numerical modeling studies were carried out.Both the distinct element method(DEM)and the FDM were used in order to highlight the possible modes of instability(Barla and Chiriotti,1995).In addition,nonlinear,time dependent analyses with the FEM were performed in order to interpret the slow movement and the gradual loss of rock mass mechanical properties with increasing deformation by means of a viscoplastic constitutive law,allowing for strain softening(Forlati et al.,2001).
2.3.Viaducts
The case of linear structures standing on the ground surface,such as viaducts and bridges,and crossing a landslide is of great interest in relation to the planning and selection of the alignment for a road,a railway line,or a highway.Alignment constraints are of different nature.In the past,for example,this was certainly the case in Italy in 1956,when building work began for the Autostrada A1,or“Autostrada del Sole”,the highway connecting Milan with Naples via Bologna,Florence,and Rome(Fig.7).
At that time,the administrations wanted this infrastructure,connecting the major cities from North to South of Italy,to be completed as quickly as possible.Furthermore,very limited understanding of the geological and geotechnical conditions along the route was indeed available.At present,although better tools can be used for investigation,testing,monitoring,and design analyses,the constraints in the selection of the alignment are mostly related to the morphology of the territory and,in a number of cases,the choice to keep the new road near the existing one.
A typical recent case is the A1 Variant,a deviation of the Autostrada A1,which opened to traffic on 23 December 2015.The entire project covers a length of 62 km,of which 37 km involved adding a third lane on each side of the existing A1 and 25 km the construction of the new section,most of which consists of viaducts and tunnels,the longest tunnel being 8.7 km in length.The new section runs parallel to the central part of the A1.The earlier motorway remains open,providing an alternative route.

Fig.7.The Autostrada A1(Italy)during construction along the Apennines in instability-prone areas.Construction of two lane viaducts(Photographs from Rivista Autostrade,1960).
Keeping with linear structures such as viaducts and bridges,it is of interest to also mention here cases where these structures built in the past need yet to be maintained into service,although interacting with DSGSDs.This is indeed the case of the Autostrada A3,or“Autostrada Napoli-Pompei-Salerno”.A remarkable example is the Olivieri Bridge shown in Fig.8,near Salerno,which was built between 1961 and 1964.The left abutment of this bridge(right in Fig.8)interacts with a DSGSD.
Here again numerical modeling with the FEM in particular is currently applied for design purposes.The interest however moves,in cases,more toward the simulation of the response of the engineering structures with both static and dynamic analyses in seismic conditions.Not to be disregarded are the applications for foundation studies and the analysis of ground-structure interaction problems with the deep-seated landslides,when interacting with such structures,as for the bridge in Fig.8.
2.4.Tunnels
The most relevant case of interaction with DSGSDs to be discussed in this paper deals with tunnels.In reality,tunnels should possibly be excavated under landslides and avoid any interference with them.In cases,however,deep-seated landslides are undergoing very small movements that are not easily observed or it is not possible for a number of constraints to change the tunnel alignment.As already noted,in cases,infrastructures are built near the existing ones or the morphology of the territory may not allow for choosing a different,more favorable alignment in order to avoid unstable areas along the route.
It is known that with the excavation of a tunnel,stress redistribution takes place in the surrounding ground resulting in the development of plastic shear strains and plastic zones.If the tunnel is located within the deep-seated landslide or sufficiently close to its shear zone,tunneling might become very difficult and in cases landslide movements can be triggered,with the result that the landslide,even if “dormant”,is “reactivated”.The author has experienced a few of such cases.In line with the scope of the present paper and before presenting in the following section a case history,two case studies will be briefly described.
The Val di Sambro Tunnel is a large-size twin-tunnel(each tube with 160 m2cross-section)along the A1 Variant of the Autostrada A1,previously mentioned.This tunnel was excavated full face by using conventional methods with a systematic fiberglass dowels reinforcement of the face and of the tunnel surrounding,with the final lining always kept very close to the advancing tunnel face(Lunardi and Barla,2014;Barla,2016a).Tunneling took place along the alignment(new tunnel)shown in the plane view of Fig.9.It is noted that F1-a1g,F2-a1h,and F3-a2h represent,in this simplified geomorphological map,deep-seated landslides.

Fig.8.The Autostrada A3(Italy).The Olivieri bridge,example of a structure in service,with the left abutment(right in the photograph)interacting with a DSGSD.
Fig.10 shows a schematic geological cross-section of the deepseated landslide F2-a1h.The rock mass excavated is the Monghidoro Flysch,formed of sandstone-mudstone layers with thickness ranging from very thin(centimetric)to thick(metric).The sandstone to mudstone ratio is basically greater than one,although in cases this ratio is smaller than one,with the pelitic components prevailing over sandstone.In most cases,the rock mass quality at the tunnel face was poor to very poor,with geological strength index(GSI)values in the range of 25-30.
With the aim to illustrate the interaction of the tunnel with the landslide,the interferometric synthetic aperture radar(InSAR)has been used,which has become an operational tool for monitoring ground movements.Compared to traditional surveying techniques,InSAR has the advantage of offering a high density of measurement points over large areas.
Advanced In SAR techniques,such as PSInSAR(Ferrettiet al.,2001)and SqueeSAR(Ferretti et al.,2011),developed in the last decade,provide high-precision time series of movement that allow to highlight typical displacement patterns,such as changes in ground movement over time as well as seasonal uplift/subsidence cycles.
Fig.11 shows the permanent scatterers(PSs),obtained by a SqueeSAR analysis of the RADARSAT S3 dataset for the period from March 2003 to April 2012.The PSs correspond to infrastructure elements(such as buildings,streets,railway lines,antennas,and metallic structures)or natural elements(rocky outcrops,debris,etc.)located on the ground surface.Also shown with different colors in Fig.11 are the velocities in mm per year in the time interval under observation.
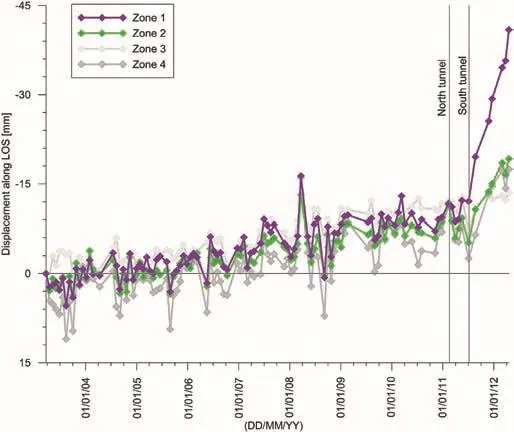
Fig.12.Displacement history along the line of sight vs.time.Permanent scatterers in Zones 1-4 of Fig.11.
It is straightforward to plot in Fig.12 the displacement along the line of sight(LOS)versus time for the PSs in Zones 1-4 shown in Fig.11.By keeping in mind that the two tubes were excavated concurrently with one face preceding the other of 80-100 m approximately,the plot shows a close link between tunnel excavation and landslide movements on the ground surface.It is important to underline that the analysis of the satellite data is in accordance with the data obtained with a robotic topographic network on the ground surface by using automated total stations.

Fig.11.Permanent scatterers obtained by a SqueeSAR analysis of the RADARSAT S3 dataset for the period from March 2003 to April 2012.The twin-tunnel is also shown.
In addition,conventional monitoring of the subsurface displacements by inclinometers(Fig.10)confirms the trend shown.As surface displacement rates of 2-3 mm per year were monitored with no tunnel excavation,with the tunnel face approaching the monitoring targets/inclinometers of interest,these values increased abruptly.
Landslide monitoring data became progressively available,together with observation and convergence monitoring in the two tubes of the tunnel.Systematic geological mapping was taking place during face advance.Also a geotechnical properties database was available,which was derived from a comprehensive laboratory-testing program carried out at the design stage and during tunnel excavation.
With all these data becoming available,numerical modeling in 2D and 3D conditions could be carried out.The intent was to back analyze the early data of surface displacements,essentially based on InSAR and robotic total stations(TSTs)monitoring,and below surface movements from inclinometer data,in order to gain insights into the interaction between tunnel excavation and surface movements(Barla et al.,2015;Barla,2016b).
The St.Oyen Road Tunnel is in the Aosta Valley(Italy),along the road,which runs to the well-known Great Saint Bernard Tunnel connecting Italy to Switzerland.Severe difficulties were met during excavation of the tunnel as a deep-seated landslide was being approached.As shown in Fig.13,following the crossing of a river with a low cover,the tunnel was to underpass a deep-seated landslide.
With a 120 m2tunnel cross-section,excavation was being done through a rock mass formed of a fractured mica-schist,in generally poor geomechanical conditions,with the GSI value in the range of 30-35.Systematic fiberglass dowels were used for face stabilization and fore poling installation on the tunnel perimeter was taking place systematically.The primary lining consisted of heavy steel sets and a 30 cm thick shotcrete lining.
Fig.14 shows a seismic longitudinal profile obtained with a geophysical survey performed from the ground surface and based on the seismic refraction method with tomography,in addition to boreholes drilled from the ground surface. The deep-seated landslide was interpreted as formed with glacial deposits consisting of silt, sand and gravel,superposed on breccia with rock blocks in a silty sand matrix and fluvio-glacial deposits(moraine).The tunnel was excavated mostly in fractured mica-schists,with a mixed face condition,in most cases with the fluvio-glacial deposits on the top heading.
Excavation was carried out successfully up to the Zone 2 shown in Fig.14,where the tunnel cross-section was mostly in fractured mica-schists and fluvio-glacial deposits.As illustrated in Fig.15,in Zone 2,the tunnel cross-section underwent very large deformations mostly on the right sidewall,moving to the left side.As shown,most of the tunnel section collapsed extending for nearly a 30 m length toward the face.No injuries did occur given that the instability took some time to be triggered and workers could leave the site when the first signs of instability started to develop.

Fig.13.A view of the deep-seated landslide(left).A schematic map of the area where also shown are the tunnel and the landslide(right).The colors underline the surface morphology.

Fig.14.Longitudinal seismic refraction profile along the tunnel axis(left).P-wave velocity(km/s)together with the stratigraphy of a borehole drilled from the ground surface(right).

Fig.15.Photograph of the tunnel collapse extending toward the face.
It is of interest to underline here that the tunnel did not interact directly with the deep-seated landslide inducing surface movements.However,the complex geological and geomechanical conditions encountered along the tunnel axis,which are closely related to the existence of the deep-seated landslide,created the instability,given that the excavation sequence and the stabilization measures adopted revealed not to be adequate to cope with the difficult conditions met.
Significant efforts have been made in the last few years for understanding deep-seated landslide mechanisms through more advanced methods of surface and subsurface investigations for characterization purposes.In fact,in addition to advanced geophysical techniques and novel methods for geological geomechanical mapping,new monitoring methods such as laser imaging detection and ranging(LIDAR),radar interferometry,both satellite(InSAR)and ground-based(GBINSAR),and TST are available.These are formidable aids to conventional monitoring tools that at present can also be automated.
In addition,numerical models have made significant steps forward through either continuum or discontinuum modeling of landslides in both 2D and 3D conditions,with increased interest in understanding of the DSGSDs behavior.These models can be used to simulate landslide response against monitoring data,with a tendency toward the interpretation of temporal data as a basis of early warning systems(EWS).
It is clear that our ability to cope with a variety of problems has been enhanced through the years.Today numerical modeling is applied at the design stage and during construction.However,the problem to properly use numerical methods in engineering practice remains and most of all the need is always to demonstrate that the results of models reflect the observed in situ behavior.
The increase of computer power facilitates the use of numerical methods in rock engineering.However,not in all cases modeling goes hand in hand with investigations in the laboratory or in the field,as it should.
3.Case history
The intent is now to present a case history and deal with different aspects of the problem,from when asked to provide a quantitative assessment of the phenomena being observed to the technical solution finally adopted.Reference is again made to the A1 Variant of Autostrada A1,in central Italy,and specifically to a section of 250 m length of the Sparvo Tunnel,a twin-tunnel recently excavated with a 15.62 m diameter Herrenknecht EPB TBM(Fig.16).
3.1.Preliminary
The 2.6 km long Sparvo Tunnel comprises two tubes,with a centerline distance ranging between 30 m and 60 m,each having a final diameter of 13.6 m(2 lanes of 3.75 m each and an emergency lane of 3.75 m,plus lateral clearance and sidewalls).The final lining consists of prefabricated,steel reinforced concrete segments of 70 cm thick and 2 m long.The gap between the excavation diameter and the lining extrados is filled with a fast setting two component grout.
The rock complex formations met along the tunnel length are the APA Formation,consisting of clay and argillites,the BAP Formation,mostly claystones,and the SCA Formation,with highly clayish sandstones.Tunneling took place along a typical area of the Apennines characterized by the presence of“dormant”deep-seated landslides.Fig.17 shows the area of interest with the twin-tunnel tubes,the north tube excavated first(on the right)followed by the south tube(on the left).
3.2.Surface and subsurface displacements
The attention in the following is dedicated to the surface and subsurface displacement monitoring data based on both conventional and advanced methods and collected as tunneling of the two tubes was taking place.In addition to the results of the topographic measurements that referred to a number of targets on the ground surface and the available inclinometer data from boreholes installed in the area,the results obtained with a SqueeSAR analysis of the RADARSAT S3 dataset were also used.

Fig.16.Case history.A1 Variant of Autostrada A1 in Italy(left),where the 2.5 km long Sparvo Tunnel has been excavated by using a 15.62 m diameter Herrenknecht EPB TBM(right).
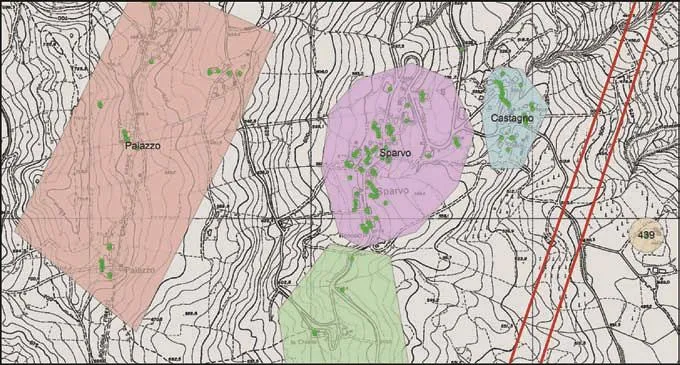
Fig.17.Area of interest for the Sparvo Tunnel.The two parallel red lines show the two tubes.
Fig.18 illustrates the points(PSs)monitored between May 2003 and September 2015 for four different areas(Zones 1-4)on the ground surface,while the plot of Fig.19 gives the corresponding displacement history.It is clear that the excavation of the north tube induced a sudden increase of the displacements along the LOS in Zones 1 and 2,which apparently continued with the same displacement rate when the south tube reached the same zones.
The advantage offered with this dataset is that it is also possible to see the trend of behavior of the deep-seated landslide prior to tunnel excavation,with a rate of displacement of 5.4-4.1 mm per year for the same Zones 1 and 2.This is in clear contrast with the rate of displacement measured following the transition of the tunnel face in the same zones,which is up to 50-100 mm per year.
Given the observed trend of behavior,based on the displacement history from the RADARSAT S3 dataset,which indeed demonstrates the “reactivation”of the deep-seated landslide along the slope,it is of interest to see the plot shown in Fig.20.The observed surface displacement histories measured at a number of topographic targets(S0,S1,S2,S3,S4,S5,and S6)let one better underline the deep-seated landslide response as tunnel excavation was taking place.

Fig.18.RADARSAT S3 dataset for the period from May 2003 to September 2015 in Zones 1-4.
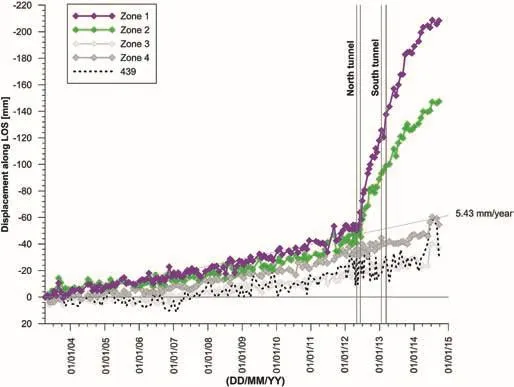
Fig.19.Displacement history of permanent scatterers on the ground surface due to tunnel excavation.
It is noted that in both cases,tunnel excavation results in surface horizontal displacements downslope with a maximum of 130 mm following the excavation of the north tube and 70mm following the transition in the same zone of the south tube.In addition,one can see that as the north tube moves ahead with respect to the target points and prior to the arrival of the south tube,the displacements continue at a rate of 7-8 mm per month,significantly greater than that observed prior to tunnel excavation.
3.3.State of stress in the segmental lining
A direct consequence of the reactivation of the deep-seated landslide and of the observed surface and subsurface displacements is the change in the state of stress in the segmental linings.It was therefore necessary to determine the hoop stresses in the lining of both the tunnel tubes.
This was done by the over coring method with doorstopper measurements and four strain gage rosettes,positioned at 45°one from the other.Measurements were performed at 15 cm and 45 cm depths from the lining intrados.In general,measurements were done at the sidewalls,hinges and crown.Also the flat jack tests and over coring tests were carried out with large-size diameter holes at the tunnel intrados.
Based on the hoop stresses determined within the segments,along the tunnel length,under the assumption of a linear internal stress distribution in the lining,the internal stress characteristics,bending momentMand axial thrustN,could be computed.TheMNplots for both the tubes could then be derived in order to assess the loading conditions.As depicted in Figs.21 and 22,it is clear that higher stresses are present in the north tube,with a few points near the strength domain(for a safety factor of 1),with respect to the south tube.
It is of interest to underline the interaction between the DSGSD and the twin-tunnel with the plot shown in Fig.23,where the bending moment in the segmental lining is shown superposed on the ground surface displacement distribution.The maximum bending moment in the segmental lining occurs in the north tube(downslope),in the zone where the landslide displacements are the highest.
3.4.Numerical modeling
In order to gain insights into the understanding of the interaction between the twin-tunnel and the deep-seated landslide,also in view of the state of stress in the segmental lining,as previously outlined(Figs.21 and 22),numerical analyses in 2D conditions were carried out by the FDM and the FLAC code(Itasca,2014).
The objective was to back-analyze the observed time-dependent behavior of the deep-seated landslide including the response of the tunnel.This was done by using the time-dependent elasto-viscoplastic model SHELVIP(stress hardening elasto-viscoplastic).This model,proposed by Debernardi and Barla(2009),was independently implemented in FLAC.It was used to represent the behavior of the shear zone,while the APA Formation,out of this zone,was assumed to behave according to an elastoplastic constitutive model with the Mohr-Coulomb yield criterion.
It is worth to mention here that the SHELVIP constitutive model was derived from the classical theory of elastoplasticity by adding a viscoplastic component based on the Perzyna’s overstress theory.Time-independent plastic strains develop only when the stress point reaches the plastic yield surface defined by the Drucker-Prager criterion shown in Fig.24.Similarly,the time-dependent viscoplastic strains develop if the effective stress state exceeds a viscoplastic yield surface,which is also defined by the Drucker-Prager criterion.A clear definition of each time-dependent behavioral feature is made possible by a single constitutive parameter.There are 11 parameters in the model,including 2 elastic,4 plastic,and 5 viscoplastic parameters.
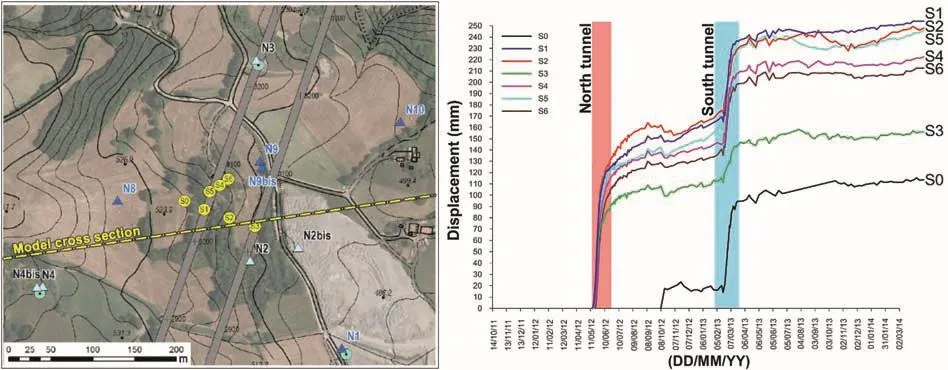
Fig.20.Displacement histories(right)of the targets on the ground surface(left).

Fig.21.Lining capacity plot(bending moment M vs.axial thrust N)for the north tube.
The trace of the cross-section considered for purpose of 2D modeling in plane strain conditions is shown in Fig.18.This crosssection is located in the area where the interaction between the deep-seated landslide and the twin-tunnel was more significant given the surface and subsurface monitoring data available and that the induced stresses in the segmental lining were the highest(Fig.20).
Fig.25 shows a detail of the 2D FDM model and of the geological cross-section used for modeling,which accounts for the available data from bore hole logging in the area.The deep-seated landslide is underlined by a 10 m thick shear zone.The inset gives a detail of the grid in the vicinity of the two tunnels.
It is important to note that special care was taken in the definition of the extent of the FDM model,in order to avoid the influence of boundary constraints.In addition,attention was devoted to the selection of an appropriate grid size,in order to describe the ground response around the two tunnels and not to impair the mobilization of the deep-seated landslide along the shear zone.In fact,this shear zone was carefully discretized.
The tunnel is located at 100 m depth approximately,with the in situ stress ratio(K0= σh/σv)equal to 1.5,i.e.the vertical stressσvis gravity-dependent,while the horizontal stressσhis 1.5 times the vertical stress.The groundwater table is 10 m below the ground surface and the analyses were run without considering any water flow toward the tunnel.
The numerical FDM analyses were carried out according to the following simulation sequence:
(1)The first step consisted in the initialization of the in situ state of stress and in the simulation of the evolution of the slope to obtain the present geometry,starting from the horizontal plane.These steps were performed with the ground(APA Formation)behaving as elasto-perfectly plastic.Then the shear zone was activated,also behaving as elasto-perfectly plastic,but with strength parameters progressively reduced up to a nearly mobilized condition of the DSGSD.

Fig.22.Lining capacity plot(bending moment M vs.axial thrust N)for the south tube.

Fig.23.Displacement plot based on the available RADARSAT S3 dataset.The correlation with the maximum bending moment in the lining segments along the twin tunnel is also shown.
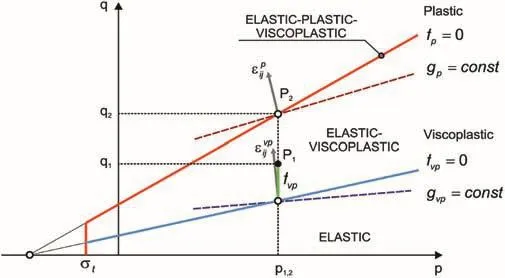
Fig.24.Yield surfaces and stress fields in the q-p plane for the SHELVIP constitutive model(Debernardi and Barla,2009).
(2)Then,the time-dependent behavior according to the SHELVIP model was activated for the shear zone and the analyses were run under gravity only,up to obtaining a rate of displacement for the entire deep-seated landslide of 5 mm per year as from the RADARSAT S3 dataset.It is important to underline once again that,based on the monitoring data available,this was the rate of displacement prior to landslide reactivation due to tunneling.

Fig.25.Cross-section considered with a detail of the FDM grid adopted.
(3)Subsequently,the excavation of the north tube was simulated allowing for 35%stress relief on the tunnel contour prior to the segmental lining installation,when a complete stress relief was permitted.This simulation step was carried out allowing for the time-dependent elasto-viscoplastic behavior of the shear zone according to the SHELVP model.The time-dependent analysis continued for the time interval(approximately 220 d)elapsed prior to the excavation of the south tube.
(4)Finally,the excavation of the south tube was simulated by using the same sequence as for the north tube.The time dependent elasto-viscoplastic analysis was then carried out for the time interval elapsed(approximately 270 d)prior to the stress determinations in the segmental linings of the two tubes as described above.
It is of interest to illustrate the approach adopted in Step 2 in relation to the use of the SHELVIP model and be able to reproduce the observed rate of displacement of the DSGSD prior to tunnel excavation.It is clear that this is a rather difficult step in the computation process,in particular when a complex time dependent constitutive model is used and only a few creep test results are available for the APA.
A back-analysis approach was used,starting with the constitutive parameters of the SHELVIP model at the laboratory scale up to obtaining a rate of displacement for the target points on the ground surface approximately equal to5-6mm per year,as observed prior to tunnel excavation.With this being done success fully,the excavation of the north tube was simulated in accordance with Step 3,followed by excavation of the south tube as described above for Step 4.
The results obtained are shown in Fig.26 by comparing the computed and monitored displacement histories.It is noted that the monitored displacements are the surface displacements of the target points(S0,S1,S2,S3,S4,S5,and S6)resulting from the topographic measurements as already shown in Fig.20.In addition,also shown in Fig.26 is the head displacement history at the inclinometer N4.

Fig.26.Comparison of computed(SHELVIP)and monitored displacement histories on the ground surface.
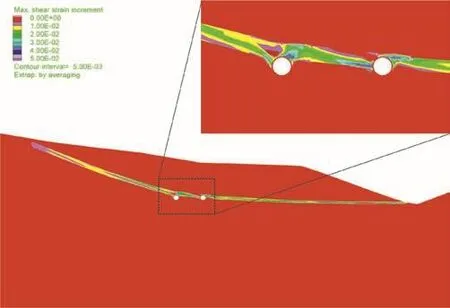
Fig.27.Maximum shear strain increment around the north(right)and south(left)tubes.
Fig.27 illustrates the computed plastic strains that do occur in the shear zone,where the time-dependent behavior takes place.When looking with care around the two tubes,plastic shearing occurs around the north tube at the crown,at both the hinges and the invert,whereas for the south tube,this takes place prevalently at the crown.It is the intersection of the openings with the shear zone that determines the structural response of the segmental lining.
With this in mind,it is of interest to pay attention to the computed internal stress characteristics,bending momentMand axial thrustN,in the segmental linings of the two tubes.Under the assumption that the segmental lining behaves according to a linearly elastic constitutive model,these characteristics are plotted in Fig.28 for the two tubes.
It is clearly shown that the computed values are in line with the stress characteristicsMandNdetermined with the doorstopper measurements.In addition,the significantly different structural responses of the two tubes are well underlined,this being due to the significantly different interactions of the two tubes with the deep-seated landslide,as well illustrated in Fig.27.
It is of interest to underline here,as shown in Fig.29,that the stresses in the segmental lining of the north tube giveNandMvalues reaching the limit condition.It is noted that this tube significantly interacts with the deep-seated landslide through the shear zone(Fig.27),with the clear need to take appropriate actions.
3.5.Concluding remarks
Based on the results illustrated,the decision was reached to adopt appropriate reinforcement measures in the tunnel along the 250 m length of interest(Fig.23).The interaction with the deepseated landslide was shown to occur and the stresses acting in the segmental linings were thought not to be acceptable for putting the tunnel into service and for appropriate long-term performance.Fig.30 gives on the left a sketch of the reinforcement structure to be installed in the north tube.

Fig.28.Axial thrust N and bending moment M in the segmental linings.Comparison of the computed values and the results obtained with the doorstopper determinations.
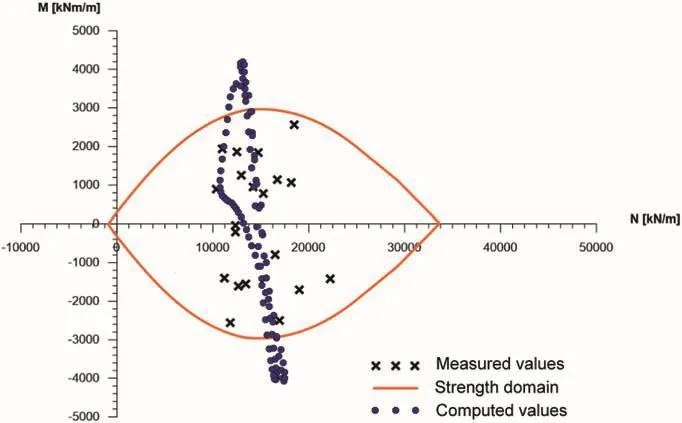
Fig.29.Axial thrust N and bending moment M in the segmental linings.Comparison of the computed and measured values.
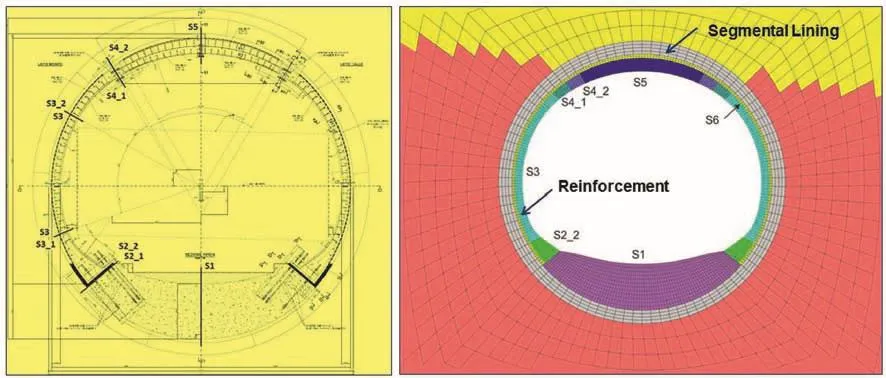
Fig.30.Reinforcement structure(left).FDM model adopted for the predictive analyses of the long-term behavior(right).
As illustrated,the reinforcement measures consisted in placing in each tube a structural ring,composed of two steel plates of different thicknesses,one at the extrados(i.e.in contact with the existing overstressed segmental lining)and the other at the intrados(i.e.forming the inner surface of the final tunnel to be put into service).
These plates were connected by means of steel ribs properly spaced and the empty space between them was filled with high strength concrete.These rings were formed with steel plates of different thicknesses,at the crown and sidewalls,in all cases connected to a very thick concrete invert arch.These reinforcement measures were adopted and the tunnel was put into service.
Numerical modeling was again used to analyze the expected response to the proposed reinforcement measures and to carry out predictive analyses on its long-term behavior,always based on the time-dependent elasto-viscoplastic model calibrated as described above.It is of interest to put the attention on the FDM model of the lining and of the reinforcement shown again in Fig.30.
Predictive analyses were carried out to analyze the tunnel performance vs.time,for a total duration of 50 years,under an assumed rate of displacement for the DSGSD of 5-6 mm per year,i.e.the deep-seated landslide is to behave in the long term as prior to the excavation of the tunnel.A monitoring program has been implemented and is currently used in the tunnel and on the ground surface.The results obtained with numerical modeling will provide a continuous real-time comparison with the monitoring data as a basis for future actions and measures to be undertaken,if needed.
4.Conclusions
The interaction of deep-seated landslides(DSGSDs)with man made structures,which occurs in a number of engineering applications,has been described,although other important impacts,typically with inhabited areas and historical sites,were not considered.This would obviously have opened other relevant is sues regarding investigation studies,real-time investigative monitoring,management of the areas at risk,adoption of mitigation strategies,and civil protection measures.
A few cases of DSGSDs interacting with man-made structures,typically dams,penstocks,viaducts,and tunnels,were illustrated.In these cases,the question was how a deep-seated landslide is displaced,generally at a constant deformation rate,along a shear surface and more frequently through a shear zone.In cases man made structures are “passive”,meaning that they undergo the movement imposed by the landslide.In other cases,typically for a tunnel during excavation,the tunnel is “active”and may “reactivate”the landslide.
The interaction of tunnels with deep-seated landslides was discussed with a case history of a landslide reactivated during TBM excavation through complex geological formations.Following a few preliminary remarks on the geological and geo mechanical conditions,the surface and subsurface monitoring data,obtained as tunneling of the two tubes was taking place,were illustrated with both conventional and advanced monitoring methods.In particular,the results of a SqueeSAR analysis of the RADARSAT S3 dataset were considered.
Due to tunnel excavation,surface horizontal displacements occurred downslope with a maximum of 130 mm following the excavation of the north tube and 70 mm following the arrival in the same zone of the south tube.Displacements took place as the north tube moved ahead with respect to the target points and prior to the arrival of the south tube.This occurred with a rate of displacement equal to 7-8 mm per month,significantly greater than that prior to tunnel excavation,and continued when the displacement rate increased dramatically with the second tube excavation.
It was shown that a direct consequence of the reactivation of the deep-seated landslide and of the observed surface and subsurface displacements is the change in the state of stress in the segmental linings of both the tunnel tubes.Based on the hoop stresses determined within the segments,along the tunnel length,the internal stress characteristics,bending moment and axial thrust,could be computed.Higher stresses were present in the north tube,with a few points near the strength domain.
In order to gain insights into the understanding of the interaction between the twin-tunnel and the deep-seated landslide,also given the stresses in the segmental lining,the FDM was used to carry out numerical analyses in 2D conditions.The observed time dependent behavior of the deep-seated landslide was back analyzed including the response of the twin-tunnel.This could be done with the advanced time-dependent elasto-viscoplastic model SHELVIP previously adopted in simulations of tunnels in squeezing conditions.
The modeling was undertaken with two main objectives.On one hand,the reactivation of the deep-seated landslide due to tunnel excavation was to be represented accounting for the onset of surface and subsurface displacements due to the north tube excavation.Then,the following time interval,when the landslide was moving at a nearly constant displacement rate,had to be properly simulated.Also the impact on the landslide due to the south tube had to be represented.With the modeling performed,this could be done successfully in a realistic manner,keeping in mind the complexity of the problem under study.
The simulation performed allowed to shed light on the interaction of the deep-seated landslide with the twin-tunnel,in relation to the deformational response of the two tubes and to the state of stress in the segmental linings.It was demonstrated,through realistic modeling,that this computed state of stress was well in the range of the values determined with in situ testing.
In this manner,based on the internal stress characteristics,bending moment and axial thrust in the segmental linings could be determined with confidence,in order to be able to subsequently analyze and validate the reinforcement measures adopted for putting the tunnel into service.
Conflicts of interest
The author wishes to confirm that there are no known conflicts of interest associated with this publication and there has been no significant financial support for this work that could have influenced its outcome.
Acknowledgements
The author would like to thank Dr.Daniele Debernardi and Dr.Andrea Perino for the help in carrying out the numerical analyses regarding in particular the case history illustrated in the paper.In addition,to be acknowledged is the support of Spea Ingegneria Europea SpA and Società Autostrade per l’Italia SpA.
 Journal of Rock Mechanics and Geotechnical Engineering2018年6期
- Journal of Rock Mechanics and Geotechnical Engineering的其它文章
- Estimates for the local permeability of the Cobourg limestone
- Radial consolidation characteristics of soft undisturbed clay based on large specimens
- Influence of data analysis when exploiting DFN model representation in the application of rock mass classification systems
- Hydro-mechanical behavior of an argillaceous limestone considered as a potential host formation for radioactive waste disposal
- A simplified approach to assess seismic stability of tailings dams
- Finite element analyses of slope stability problems using non-associated plasticity
