
Estimates for the local permeability of the Cobourg limestone
2018-12-20 11:11Selvaduraiowacki
A.P.S.Selvadurai,A.Głowacki
Department of Civil Engineering and Applied Mechanics,McGill University,Montréal,QC,H3A 0C3,Canada
Keywords:Cobourg limestone Permeability Steady state tests Hydraulic pulse tests
A B S T R A C T Argillaceous limestone formations are being proposed as sites suitable for constructing a deep geologic repository for storing low-to intermediate-level nuclear waste in southern Ontario,Canada.The Cobourg limestone is characterized by a visual appearance of heterogeneity resulting from light gray calcite nodular regions interspersed with dark gray calcite-dolomite-quartz partings containing a clay component.This paper presents the results of experiments conducted to determine the permeability of both the light gray and the dark gray species of the Cobourg limestone.The permeabilities were successfully estimated from both steady state and hydraulic pulse tests conducted using specially designed miniature water entry ports,which were epoxied to the surface of the rock sample containing cavities drilled into the rock species of interest.The results show that the dark gray species of the Cobourg limestone has a permeability that is roughly one order of magnitude greater than the light gray calcite species.
1.Introduction
Permeability of rock formations is a key parameter of geoenvironmental interest when a deep geologic repository(DGR)is being considered for either the long-term geologic disposal or the monitored retrievable storage of hazardous nuclear wastes.The permeability of rocks,at the initial stages,can influence the groundwater in flow into the excavation to construct the repository and,in the long term,permeability can influence radionuclide migration by advective flow due to cross-repository hydraulic gradients.The Canadian proposals for the storage of low-to intermediate-level non-heat emitting nuclear waste call for the construction of a DGR in the argillaceous sedimentary formations of southern Ontario(OPG,2011a).The Cobourg limestone is one of the sedimentary formations that is considered suitable for the construction of a DGR.Although several barrier systems,including metallic waste containers and engineered geologic barriers,will be used in a DGR setting,the containment capability of the host rock is an important component of the multi-barrier concept to minimize the release of radionuclides to the environment.It is estimated that,in the case of the proposed DGR in Ontario,Canada,the containment efficiency should be such that the total amount of radioactivity remaining in the repository and likely to be released after 10,000 years,due to natural decay of waste containers,will be less than the ambient radioactivity levels in the shale rock overlying the proposed DGR(OPG,2016).
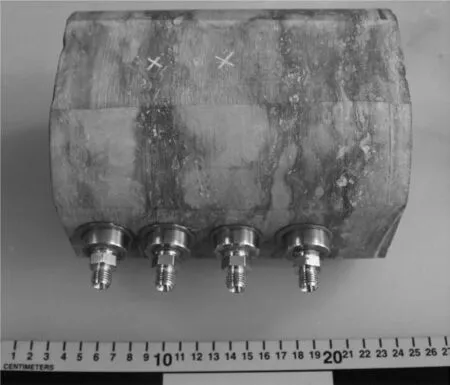
Fig.1.Cobourg limestone heterogeneous matrix composed of light gray carbonate species and dark gray argillaceous species with installed four mini-port connectors.
The objective of this research is to examine in detail the permeability of the identifiable geologic materials that give the Cobourg limestone the external appearance of heterogeneity.Fig.1 shows the typical fabric that is observable in core specimens of the Cobourg limestone recovered from an outcrop in Bowmanville,Ontario.Visually,the rock displays heterogeneity resulting from the interspersed fabric of a calcite and dolomite richlight gray,nodular limestone(referred to as the light gray species)separated by adark gray calcite-dolomite argillaceous partings(referred to as the darkgray species).There is some evidence of a nominal orientation of stratification but this can vary from sample to sample and depends on the spatial arrangement of the fabric.Hence,the research aims to examine the permeability of thelight gray nodular limestoneand thedark gray calcite-dolomite argillaceous partings,by performing specially designed experiments where miniature water entry ports are installed on the individual rock species.Microscale tests of permeabilities in heterogeneous rock samples at the laboratory scale are rare(Tsang et al.,2012)largely because they are difficult to perform.Tchelepi et al.(1993)investigated the dispersion concentration heterogeneity of millstone and limestone using acoustic measurements and the dispersion of acoustic waves was used to measure permeability.These researchers were able to produce permeability maps by using mini-permeameter tests on cuboidal samples measuring 4.5 cm in side length.Soltani et al.(2009)proposed a method to characterize the core-scale permeability profile along the flow axis by saturating samples(38 mm in diameter and 80 mm in length)with low-and high-viscosity fluids and using computed tomography(CT)images to capture the moving front in order to compute the permeability profiles along the flow axis.These authors also provided a useful review of articles published from 1956 to 2005,which outlines various techniques to characterize permeability heterogeneity from core-to reservoir-scale.The estimation of the laboratory scale permeability heterogeneity in a limestone sample measuring 15 cm×15 cm×5 cm was investigated by Hadia et al.(2012)using a water flooding method and continuous pressure measurements at various locations on the surface of the sample.The pressure variations were matched with computational simulations to arrive at the permeability distribution within the sample.Selvadurai and Selvadurai(2010)successfully used a surface permeameter to measure the permeability variation in a cube of Indiana limestone measuring0.5m×0.5 m×0.5 m.A specially designed permeameter was placed on the surface of the cubic specimen at 54 different locations.These authors have documented their experimental procedures to allow other researchers to reproduce the test approach and give a thorough rationale on the applicability and difficulties involved when selecting relevant scales of interest to permeability estimation,which can range from the crustal level(dimensions of the order of 0.5-5 km),the borehole scale(30-300 m),to the laboratory scale(5-15 cm).Other investigations related to hydraulically heterogeneous rocks involve mathematical and computational modeling techniques with underlying stochastic influences of permeability on flow and transport.References to studies on these topics can be found in Gelhar(1993),Hu et al.(2002),Selvadurai and Selvadurai(2010,2014)and Nicolaides et al.(2015).
The current research will determine the differences in permeability within the individual species of the Cobourg limestone with a visual heterogeneity in order to identify the preferred pathways of fluid migration.The results will be important for gauging the efficiency of the Cobourg limestone to act as a natural geologic barrier to mitigate radionuclide migration.The measurement of the bulk permeability of the Cobourg limestone has been attempted both in the field and in the laboratory.Straddle packer tests have been conducted in boreholes measuring 150 mm in diameter and the measured horizontal permeability was approximately 10-21m2(OPG,2011b).Several laboratory investigations have also been reported in the literature,for example,Vilks and Miller(2007)conducted steady state permeability tests on cylindrical samples measuring 25 mm in diameter and 20 mm in length subjected to triaxial stress states.Their results gave permeability values ofKh≈1.1×10⁻²¹m2along the nominal bedding planes andKv≈1.9×10⁻²²m2perpendicular to the bedding plane.Further studies of the geomechanical properties of Cobourg limestone are given by Raven et al.(1992),Golder Associates Ltd(2003),Mazurek(2004),Gartner Lee Ltd(2008)and Selvadurai(2018a).A detailed technical summary of the Cobourg limestone can be found in the report by OPG(2011b).
Of particular interest to the work reported here are the studies conducted by Selvadurai et al.(2011),Selvadurai and Jenner(2013)and Selvadurai and Najari(2016)to determine the bulk permeability of the Cobourg limestone using one-dimensional axial flow,radial flow and cavity flow steady state and hydraulic pulse tests on cylindrical samples measuring up to 150 mm in diameter and 278 mm in length.Nasseri et al.(2013)conducted a series of pulse decay tests on the Cobourg limestone samples measuring 50 mm in diameter and 125 mm in length using a triaxial geophysical imaging cell;ultrasonic sensors were employed to determine the impact of the thermal loading and deviatoric stresses on the permeability.Selvadurai and Najari(2017)also discussed the thermal influences on the permeability characteristics of the Cobourg limestone.In many of these investigations,the experiments focus on the evaluation of the“bulk”permeability values that essentially average out any permeability contrast between the individual species.The estimation of the effective permeability in relation to the dominant flow pathways is an important consideration in the assessment of subsurface flows,particularly in the intact far field remote from a DGR.
2.Theoretical background
The fundamental law governing fluid flow through an isotropic homogenous saturated porous medium was proposed by Darcy(1856)and detailed accounts of the developments applicable to both isotropic and stratified porous media were given by Harr(1962),Bear(1972),Selvadurai(2006)and Bear and Cheng(2010).We restrict attention to Darcy flow in isotropic porous media and to low Reynolds number flows governed by the gradient of the reduced Bernoulli potential,consisting of the pressure potential ΦP(x,t)and the datum potentialΦD(x,t).Assuming that the fluid pressures in the porous mediump(x,t)when conducting a hydraulic pulse test are larger in comparison to the datum potential,Darcy’s law can be written as
where v(x)is the velocity vector(L/T)or specific discharge(Darcy’s velocity),Kis the permeability(L2),μis the dynamic viscosity of water(M/TL),∇is the gradient operator,x is a position vector,andtis the time variable.The use of Darcy’s law can be extended to include inhomogeneous rock,by assuming that at the local scale(e.g.a fluid entry point),the permeability is isotropic;justification for this is further explained in the paper by Selvadurai and Selvadurai(2014),who considered fluid flow in heterogeneous porous media.The fluid transport characteristics of low permeability rocks(K<10-19m2)are more conveniently estimated using transient hydraulic pulse tests,where the fluid pressure in the porous saturated region is governed by the piezoconduction equation developed by Brace et al.(1968)(see also Bear,1972;Selvadurai and Carnaffan,1997;Selvadurai,2000),and can be represented as
where ∇2is Laplace’s operator;andSis the storativity(LT2/M),which can be expressed in the following form:

whereCpsis the compressibility of the porous skeleton(LT2/M),Cwis the compressibility of the pore fluid(LT2/M),nis the porosity of the medium,andαis the Biot coefficient defined by
whereCsis the compressibility of the solid phase in the Cobourg limestone(LT2/M).A technique for estimating the Biot coefficient of very low-permeability rocks such as the Cobourg limestone was discussed by Selvadurai(2018b).
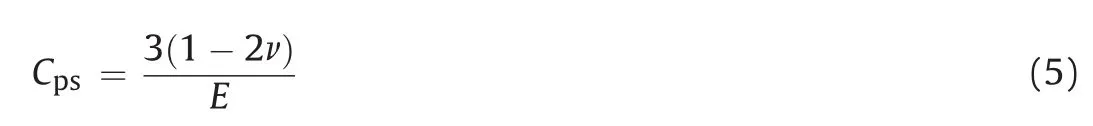
The compressibility of the porous skeletonCpsis related to the Young’s modulus(E)and Poisson’s ratio(ν)as follows:
In a hydraulic pulse test,the pressure field in the porous domainVcan be subjected to null Dirichlet (SD)and null Neumann boundary (SN)conditions applicable to specified boundaries of the domain,i.e.

where n is the outward unit normal vector,andSDandSNare the subsets ofSon the boundary ofV.In addition,the boundarySCof the cavityVC,which is pressurized to perform the hydraulic pulse tests,is subjected to the following boundary conditions:
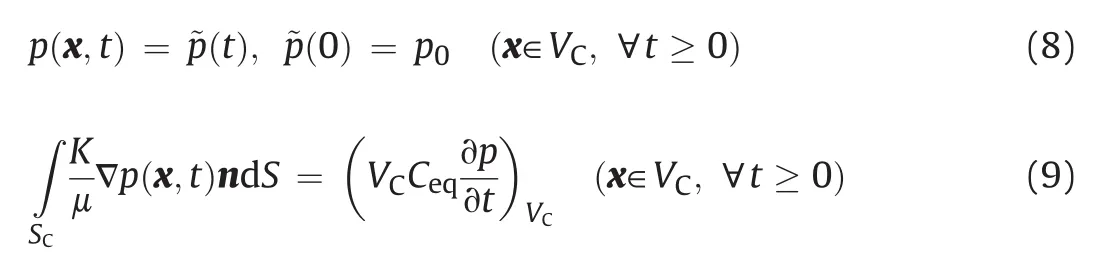
where~p(t)is the time-dependent pressure field in the cavity,andCeqis the compressibility of the fluid within the cavity.Studies conducted by Selvadurai and Ichikawa(2013)dealt with how the air fraction in the pressurized fluid in the pore space influences the performance of hydraulic pulse tests and the studies by Najari and Selvadurai(2014)have identified the influence of trapped air in the pressurized fluid cavity on the performance of the hydraulic pulse tests.These studies demonstrate that both trapped and entrained air can have a significant influence on the pulse decay pattern,which ultimately influences the interpretation of permeability from experimental results.If there is trapped air in the pressurized volume of water and connections(i.e.tubing,valves,etc.),the compressibility of the pressurized volume should account for the air-water mixture.The presence of air bubbles in the pressurized volume of water will slow the decay of the transient pulse,leading to an interpretation of permeability lower than the actual value.The air content can be accounted for by introducing an equation for the compressibility of the gas- fluid mixture developed by Selvadurai and Najari(2015):

whereφis the non-dimensional air fraction defined as the volume of the air bubble fraction divided by the total volume of pure water and the air bubble fraction,his Henry’s constant,andPis the absolute air pressure(M/T2L).In this particular case,Henry’s constant can be assumed to be zero since the rate of dissolution of air in the water is slower than the absolute pressure change in the system.A computational solution of the above developments is used to estimate the permeability of the Cobourg limestone from the decay of the pressure pulse within the pressurized cavity.The assumption of mechanical and hydraulic isotropy at the locations where the local permeabilities are estimated is a requirement for the interpretation of the test results.
3.Cobourg limestone
The Cobourg limestone occurs in the Middle Ordovician carbonate formation located in the Great Lakes region of southern Ontario,Canada.The Cobourg limestone is characterized as an argillaceous limestone composed of calcite with minorcomponents of dolomite,quartz and illite and traces of chlorite,pyrite and feldspar(INTERA,2011).It is heterogeneous in color with dark to light gray coarse grained patches and the nominally identifiable bedding planes of the argillaceous limestone phase(INTERA,2011).The two distinctive species primarily consist of a light carbonate nodular material and a dark argillaceous parting material(see Fig.1).The clay mineral content,illite and mica of Ordovician limestones is variable and ranges from 12%in the Cobourg formation to 0%in the underlying formations(INTERA,2011).The chemical analysis of each species(light gray phase and dark gray phase)was carried out in connection with this research program in order to clearly identify the minerals and quantities found in each species.Powder and solid samples were prepared for X-ray fluorescence(XRF)and X-ray diffraction(XRD)analyses,typically representing the light gray or dark gray species;the results show that the light gray species contained calcite(85%),quartz(8%)and dolomite(5%)and the dark gray species contained calcite(51%),quartz(22%),dolomite(16%),albite(3%),microcline(3%)and muscovite(1.5%).In the dark gray phases,the clay content was found to be 2.4%(illite,kaolinite and a trace of montmorillonite),whereas in the light gray phases,the clay content was approximately 0.3%.
The porosity(n)was obtained using a vacuum saturation sequence and gave avalue ofn=0.006.The porosity in the Cobourg limestone tends to vary and the typical physical and geomechanical properties are presented in Table 1.It should be noted that in earlier research publications,the Cobourg limestone was also referred to as the Lindsay limestone.Scanning electron microscope(SEM)photographs showed that the majority of pores are located in the dark gray argillaceous partings,as shown in Fig.2.It is therefore likely that the bulk permeability of the Cobourg limestone can be influenced by the permeability and spatial distribution of the argillaceous partings.
The developments presented in connection with the analysis of the hydraulic pulse tests require information pertaining to the skeletal deformability characteristics of the light gray and dark gray species of the Cobourg limestone,which arise in the definition of storativity given by Eq.(3).Experiments were conducted to determine the bulk moduli of the Cobourg limestone,consisting of a light gray species and a dark gray species,which are easily observed onthe surface of the prepared rock cylinders and enhanced by surface wetting.Uniaxial compression tests were conducted on specifically selected cylindrical samples of 24.2 mm in diameter and 36.7 mm in length of both the light gray and the dark gray species,which had been oven-dried(at 40°C).The moisture content is likely to correspond to humidity levels in the laboratory,but for the purpose of the experiments,the moisture levels were regarded as close to the air-dried condition.The axial and radial strains of the miniature samples were measured using two sets of strain gauges that were epoxied orthogonal to each other.Although the miniature samples did not conform to the sample sizes used in conventional rock testing,the International Society for Rock Mechanics(ISRM)standard for uniaxial compressive strength and deformability testing of rock sample(ISRM,2007)was followed.Such small samples were the result of the available volume of each species of the host rock from which they were extracted/cored,with fluctuations in the properties that are possible due to non-representative volume element(Selvadurai,2018b).The axial load was applied using two(rigid)plates on the load frame of a standard apparatus used in materials testing,with a load capacity of 250 kN.Trial samples were first tested to estimate the unconfined compressive strength(UCS)of each phase of the Cobourg limestone.Each sample was loaded and unloaded up to 33%of the UCS(i.e.≈20 kN).The loading and unloading rates were specified at 0.05 mm/min(0.0013 s-1).Altogether 4 samples were tested(2 light gray and 2 dark gray)and the results are presented in Table 2.From these results,the modulus of elasticityECand Poisson’s ratio νCof the light gray species were calculated as 52 GPa and 0.31,respectively,with a bulk modulusKC=42.8 GPa.Similarly,the modulus of elasticityEAand Poisson’s ratioνAof the dark gray species were calculated as 39 GPa and 0.29,respectively,with a bulk modulusKA=28 GPa.Other estimates of the bulk modulus for the bulk skeletal compressibility are given by Selvadurai(2018b).The compressibilities of the two species are reasonably close to the respective volume fractionsVCandVAapplicable to the separate species but cannot be assigned by considering only the argillaceous content in the two.The light gray carbonate species can be regarded as a distinct phase,whereas the dark gray species can contain both carbonates,quartz and clay.Photographic records of thick sections of the Cobourg limestone(Hekimi,2013)indicate that the volume fraction of the dark gray argillaceous partings can vary from 0.48 to 0.56.Considering the variability of the two species,it is reasonable to assume that the volume fractions are roughly equal,i.e.VC=VA≈0.5.We can estimate the effective elastic constants for the Cobourg limestone,using the theory of composite materials applicable to two-phase elastic media,and considering the developments presented by Christensen(1979),the effective bulk modulus of the two phase rock can be obtained from

Table 1 Geomechanical and physical properties of the Cobourg limestone.

Fig.2.Zoomed picture of interface(delimited by dotted line)between light gray(calcite)and dark gray(argillaceous)species on the CLS1-34 mm sample(Cobourg limestone sample 1 with diameter of 34 mm),where black areas represent the micropores/channels,which are located predominately in the dark gray species.
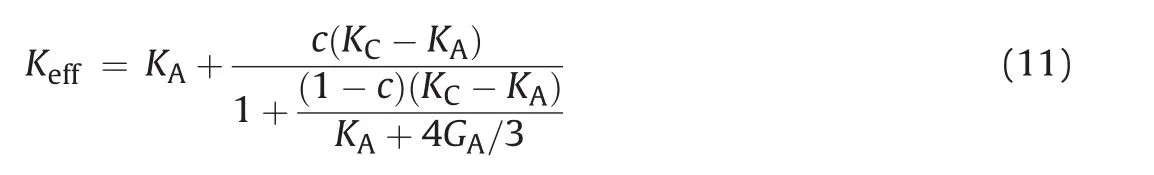
wherec=VC/(VC+VA)≈0.5;KCcorresponds to the bulk modulus of the light gray phase;KAcorresponds to the bulk modulus of the dark gray phase;andGAcorresponds to the shear modulus of the dark gray phase obtained from the modulus of elasticityEAand Poisson’s ratio νA.Using the experimental data presented previously,Eq.(11)gives an effective bulk modulus forKeff≈37 GPa,which approximately corresponds to the average of the bulk moduli estimated for the light and dark gray species.
Although the results did show a difference,in terms of the compressibility estimates,for the two species,it did not yield any significant difference in calculated permeabilities,when compared to the results obtained using the effective bulk modulus(Keff)value.Hence,when estimating the permeability using pressure decay test results and Eqs.(3)-(5),the effective bulk modulus value was utilized.Therefore,all permeability results presented in this research were based on the effective bulk modulus.
4.Experimental facilities and procedures
The Cobourg limestone used in this experimental research was obtained from a block acquired from the St.Mary’s Quarry inBowmanville,Ontario.The block was wet cored,perpendicular to the bedding plane,using a diamond tipped corer.The cored sample was then cut to length and four flat surfaces were created in order to attach the mini-port connector and to provide stability.The finished sample was approximately 150 mm in diameter and 185 mm in length,with no visible superficial cracks or defects(see Fig.1).
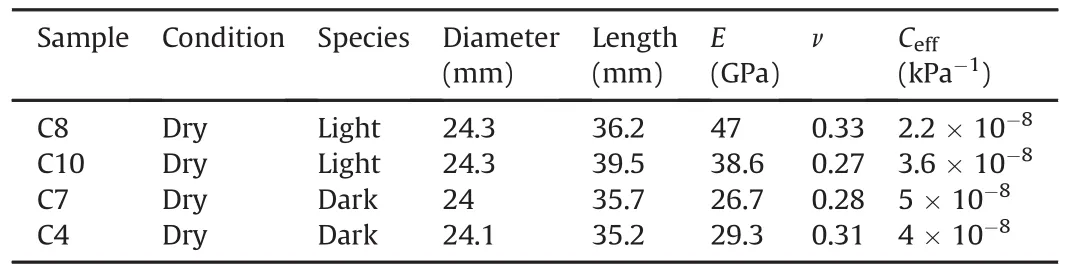
Table 2 Species specific mechanical properties of Cobourg limestone.
4.1.Installation of the water entry mini-port connector
To adequately test the light gray region mottled with the dark gray partings,a special water entry port had to be developed.A stainless steel fitting was constructed using Swagelok fitting,a stainless steel disc and industrial epoxy(see Fig.3a and b).The stainless steel disk was machined to size and a 0.25′national pipe thread(NPT)was made in the center,so that the fitting can be tightened into the disk.The 0.25′NPTs between the stainless steel disk and the fitting were coated with epoxy to prevent water/air from accessing the threads.The stainless steel disk had machined circular grooves on the surface where the epoxy was applied(see Fig.3c)in order to increase the bonding between the metal and epoxy.The water entry port was allowed to dry for 24 h before it was installed on the Cobourg limestone(see the ensuing section).The selected epoxy(Hilti)was based on previous experience and complementary testing(see Section 4.3)of three commonly available epoxies:Bondofibreglass resin,Hilti Hit-RE 500 and LePage marine epoxy.The results of pressure decay tests on these epoxies show that the Hilti epoxy maintained the most stable pressure over time and hence was selected to be used for this research.Furthermore,the possibility of a chemical reaction of the epoxy(Hilti Hit-RE 500)with the Cobourg limestone surface was tested on a cubic sample(see Fig.3d).The results from 4 tests showed that pressure buildup was possible with no signs of delamination of the water entry port from the surface,confirming that the method of installation was adequate.
4.2.Installation process
The locations chosen for installation of the water entry port had to be dry,clean,and free of defects and any contaminating oil or grease.Inordertotest the permeability of the two geologic species of the Cobourg limestone,7 locations were selected in either the light gray species(3 locations)or the dark gray species(4 locations)on the surface of the rock sample based on visual surface inspection.A water entry port was epoxied to a selected location and allowed to dry for 24 h.Using a 4 mm diameter drill bit,a hole was drilled through the epoxy and into the sample(see Fig.3b),to a depth of 11.1 mm.A vacuum venturi pump mounted with a long needle was used to clear the remaining debris within the formed cavity.The water entry port was then connected to a pipe fitting cross assembly(see Figs.4 and 5).The pipe fitting cross assembly and the water entry port connector were de-aired using the vacuum venturi pump(-75 kPa)for 3 h.Additionally,a long needle with a syringe was used to extract any remaining accessible air bubbles.

Fig.4.The experimental arrangement of the Cobourg limestone cuboid inside the water tank.
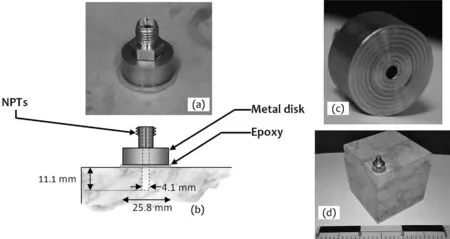
Fig.3.Details of the mini-port connector:(a)Mini-port connector epoxied onto a stainless steel plate to verify the pressure drop across the epoxy layer,(b)Details of the cavity and water entry port,(c)Machined circular grooves on the water entry port,and(d)complementary tests on Cobourg limestone cube.
Pulse pressure decay tests are transient;it is therefore important to ensure that all connecting fittings,tubes and epoxied pieces are well sealed.This was achieved by pressure rating all the components up to at least 600 kPa(three times the pulse pressure that was applied in a test)and observing the pressure drop with time(less than 0.8%drop in 5000 s was observed).
4.3.Complementary testing of the water entry port
Prior to the general testing of the Cobourg limestone light gray and the dark gray species,a series of complementary tests was performed to assess the feasibility of using the proposed testing technique.To this end,a water entry port was epoxied to a stainless steel plate(see Fig.3a)and a series of pulse tests was performed to determine the pressure decay of the pressurizing system and the effectiveness of the epoxy seal.
The results of the water entry port bonded to the stainless steel plate demonstrated that the room temperature influences the pressure decay curves.Hence,a stainless steel pipe fitting cross assembly with the epoxy fitting at one end(see Fig.3a)was placed in a water tank.The experimental procedure as well as the detailed results can be found in Głowacki(2017).In summary,these complementary experiments prompted the adoption of a more controlled system(i.e.submerging the sample and fittings in a water tank,see Fig.4)to attenuate the temperature fluctuations.Furthermore,the laboratory was sealed against air drafts and the room temperature was controlled with air conditioners.Once the water entry port was attached to the sample and submerged in the water tank,the influence of the ambient temperature changes affecting the pressure decay curves was reduced,especially if the duration of the pressure pulse decay tests was kept short(i.e.5000 s).
4.4.Testing sequence:pulse decay

Fig.5.Schematic view of the typical experimental arrangement.
The Cobourg limestone specimen with the pipe fitting cross assembly was submerged in a water tank(see Fig.4)for two weeks to allow for the saturation and for the temperature of the specimen to reach the temperature of the water inside the tank.Each testing location was vacuumed at-75 kPa for 24 h before testing followed by a 24 h period for dissipation of any residual negative pressure buildup.Using a high precision pump(Quizix QX-6000),a flow rate of 0.5 mL/min was initiated to pressurize the lines,the pipe fitting cross assembly and the water entry port(see Fig.5).The pressure buildup was recorded(see Fig.6)and used to estimate the air fraction(φ)in the system using numerical modeling.Once the desired pressure of 200 kPa was reached(on average 50 s),pumping was stopped by closing the inlet valve controlling the in flow of water.The pressure decay within the cavity was monitored using a pressure transducer(Honeywell,TJE-200PSI)and the signal was relayed to the DAQ software(DASYLabv.13).The test was terminated by opening the de-airing valve for 15 s to release the remaining pressure.Any residual pressure in the sample was allowed to dissipate,with a rest period that varied between 15 h and 30 h.This rest period was based on the complementary experimental results,which showed that a cavity pressure,initially pressurized up to 200 kPa,would decay after 15 h to near datum(zero pressure).The tests on the Cobourg limestone sample continued until repeatability in decay pressure was reached(on average 7 tests were required per location)(see Fig.7).
4.5.Testing sequence:steady state
The submerged Cobourg limestone sample was allowed to rest for a period of one month between the hydraulic pulse tests and the steady state tests.Each testing location was then vacuumed for 24 h and allowed to reach stable conditions for a week prior to testing.Using a pump(Quizix QX-6000),a steady state pressure of 100 kPa was set and maintained continuously.The in flow pressure as well as the cumulative volume of water pumped into the specific location was monitored and recorded via the pump’s DAQ(Pump-Works).This volume was then used to estimate the flow rate that was necessary to maintain a constant pressure of 100 kPa and the results were used in a computational model(COMSOL™)to obtain the permeability.The test was terminated once a steady flow rate was reached(on average 1.5 d,see Fig.8)by stopping the pump and opening the de-airing valve to release the pressure.The pipe fitting cross assembly was then removed from one location and connected to an adjacent location,with a rest period of 24 h between tests.All manipulations were done under water in order to avoid the introduction of air pockets or bubbles.The applicability of steady state tests was verified by calculating the Reynolds number for Cobourg limestoneRe=1.4×10⁻¹¹-2.9×10⁻¹¹,based on the pore throat diameter,which falls within the laminar flow regimeRe≪n,wheren=0.006,and the rationale was provided in Selvadurai and Selvadurai(2010).

Fig.6.Pressure buildup vs.time for the Cobourg limestone at location 4(dark argillaceous species).
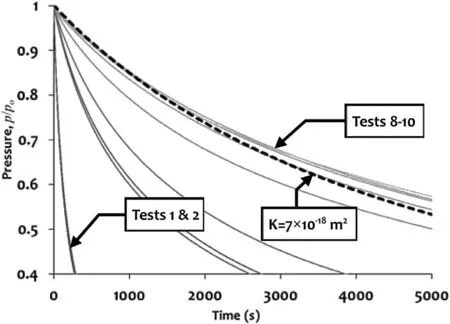
Fig.7.Pressure decay vs.time for the Cobourg limestone at location 1(light carbonate species).The dotted line represents the computational model solution for a permeability of K=7×10-18m2.
5.Computational procedure

Fig.8.Volume in flow vs.time for the Cobourg limestone at location 5(dark gray species).The dotted line represents the time span over which the flow rate was estimated.

Fig.9.Schematic view of the simplified axisymmetric computational model with boundary conditions used for pulse decay permeability estimations.
Modeling of the hydraulic pulse decay pressures was achieved using the finite element software COMSOL™;validation for using this particular software can be found in Selvadurai and Selvadurai(2010),Selvadurai and Suvorov(2012,2014)and Selvadurai and Najari(2013,2015).The finite element model used to simulate the current experiment was axisymmetric(about thez-axis)and the numerical model,along with the mesh and boundary conditions,is presented in Fig.9.The boundary conditions used for the computational modeling have to take into consideration the epoxy sealed sections of the surfaces under the water entry port(Neumann condition)as well as the surfaces of the specimen subjected to a specified pressure(Dirichlet condition),particularly the surfaces of the pressurized cavity where water is injected.The air fraction accounted for in Eq.(10)was estimated by analyzing the pressure buildup curves.For more details and the rationale for the modeling and estimation of the percentage of air fraction,readers can refer to Najari(2013)and Selvadurai and Najari(2013,2015,2016).In summary,the percentage of air fraction was varied in the numerical model for the pressure buildup and adjusted until the numerical result matched the experimental curves(see Fig.6).The computational model of the water reservoir,as shown in Fig.10a,corresponds to the volume of pressurized water available for pulse decay in the sample once the inlet valve is closed(i.e.post pressure buildup).The water volume was modeled as a material with porosityn=1 and permeabilityK=1×10-12m2.The volume of water was initially assigned a pressure of 200 kPa,corresponding to the initial volume of pressurized water in the sample and tubes.The water parameters used in the computational model were:the dynamic viscosityμ=0.001 Pa s,compressibility of waterCw=4.54×10⁻¹⁰Pa-1and the densityρ=998 kg/m3.Based on the previously obtained estimates for the bulk permeability of Cobourg limestone,an initial value ofK=1×10-22m2was selected for the model(Selvadurai et al.,2011).The pressure decay in the water reservoir obtained from the computational solution was then compared to the experimental results(see Fig.7).If the results did not match,the permeability of the rock in the numerical model was adjusted and recomputed.Additional three-dimensional(3D)numerical models were constructed,in which certain cavities were removed(see Fig.10b and c);these results were used to ascertain the influence of neighboring cavities as well as the geometry of the sample.The computed results show that modeling the exact experimental cavity pattern(i.e.K=5.21×10⁻²⁰m2)in 3D differs from a reduced cavity two-dimensional(2D)model(i.e.K=5×10-20m2)by about4%;this result was considered insignificant when compared to differences in results between adjacent locations.Additionally,an axisym metric2D model was more time-efficient and computation ally less demanding.

Fig.10.Schematic view of the 3D computational model used to check the geometric influence of neighboring cavities on the pulse decay permeability estimations:(a)Assigned boundary condition to the model with removed cavities;(b)Modeling of pressure distribution(gray slices)and flow lines of an exact geometry with four cavities as used in the experimental setup;and(c)Modeling of pressure distribution(gray slices)and flow lines in a geometry with two cavities.
The radius of influence of the pulse decay front was also investigated computationally(see Fig.11)by applying a pulse of 200 kPa and modeling the distance that this front reached in 5000 s.The results show that as long as a radius of 3 cm or more was maintained between adjacent cavities,there was negligible influence on the pressure decay(less than 2%after 5000 s).
The modeling of the steady state pressure test at each location was done in a manner similar to that reported in Selvadurai and Najari(2015).The experimentally determined stable flow rate was assigned to the surface of the cavity in the numerical model and the pressure within the cavity was calculated.The iterations were repeated,by adjusting the permeability of the rock domain in the numerical model,until the numerically computed cavity pressure and applied flow rates matched the experimental values.As a result,the assigned permeability for the rock domain in the numerical model was the permeability at the particular location on the sample.
6.Data interpretation

Fig.11.Numerical computation of the normalized pressure decay curves vs.normalized radial distances for various times;selected pressure lines(1 s,10 s,100 s,1000 s-5000 s)and the radius of influence are shown,where a is the cavity radius(2.05 mm)and pois the initial cavity pressure(200 kPa).
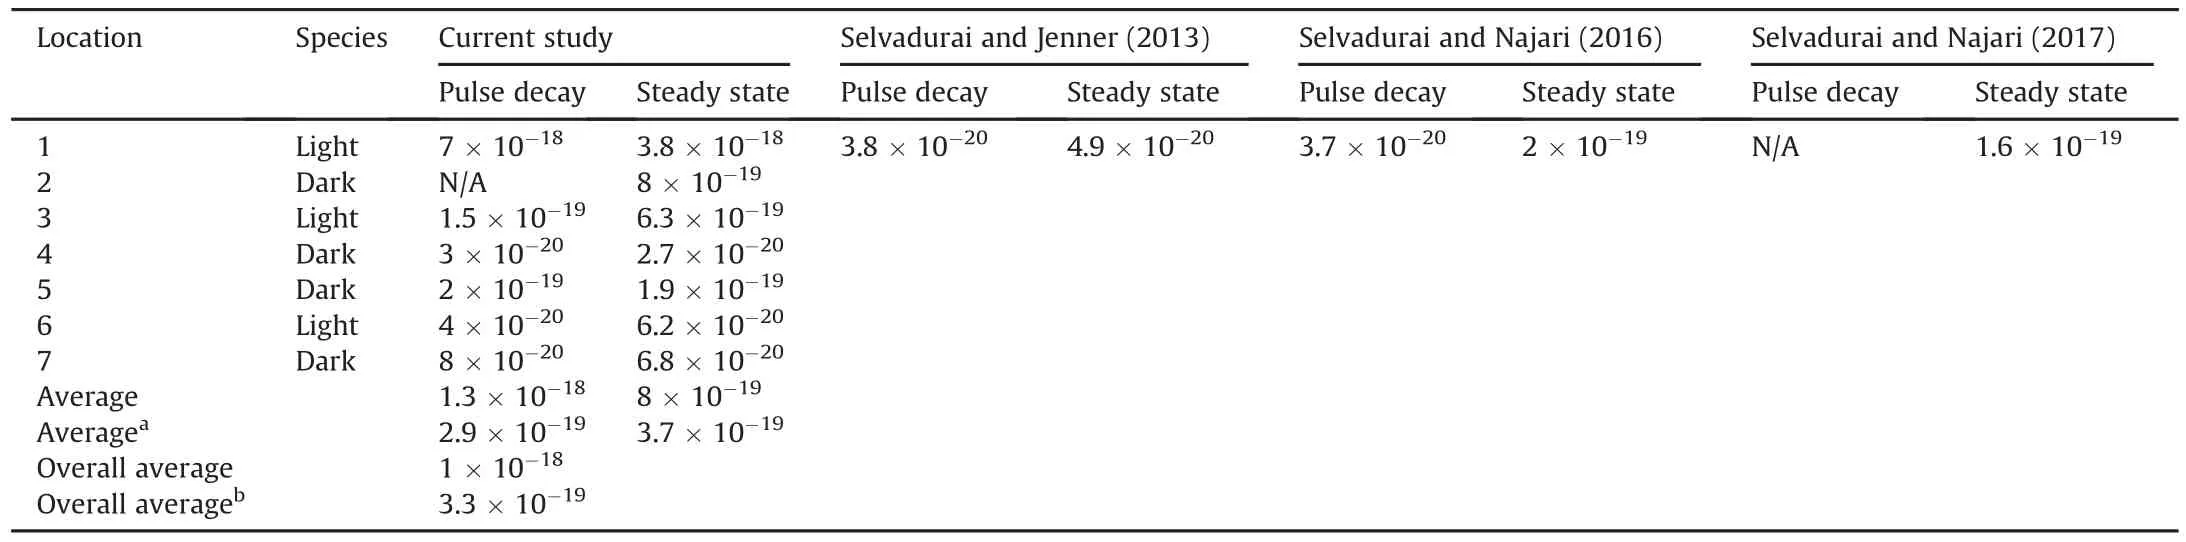
Table 3 Permeability results for the current study and the results from literature on Cobourg limestone(m2).

Fig.12.Close up view of the location 1 on the Cobourg limestone;the crack formed near the mini-port connector was accentuated by wetting the surface with water.
The permeabilities of the specific species found in the Cobourg limestones have not been measured before.Hence,the results from this study can only be compared to overall bulk permeabilities from other research on the same rock formation.Furthermore,the comparison between the pulse decay and steady state results offers an insight into the reliability and precision of the two testing methods.The results obtained from this research program have been tabulated according to species and testing methods and the averages compared to published results(see Table3)with a percent difference of 1%between the averages of the current results and the literature results.The pulse decay results from location 2 are not presented because the fitting at that location was damaged during the 3rd test.Also,since only 2 pulse tests were performed,the results were not considered to be representative.Furthermore,after all tests were completed on the Cobourg limestone cuboid and it was removed from the water tank,a visible crack had formed close to the water entry port connector at location 1(see Fig.12),which provides an explanation for the higher permeability values obtained at this location.The average results obtained in the current study compare well to the results from previously published literature and fall reasonably close considering the natural material variability and heterogeneity.In certain locations,there was a significant lack of correlation between the pulse tests and the steady state tests(i.e.locations 3 and 5).In these cases,by analyzing the pulse decay curves for a shorter time period,the estimated permeability gave values closer to the results obtained from steady state tests.This can be explained by a rapid and uncontrolled increase(i.e.+0.25°C in 5000 s)in the water tank temperature,which impeded the pulse decay,hence making the estimated permeability lower(see Fig.13).It can be observed from the surface that the dark species exhibits a higher permeability than the light gray species;however,without a thorough investigation of the porous medium into which each cavity was drilled,such a claim remains weak and offers a benchmark for further detailed studies with either micro X-ray CT,microscopic analysis or chemical analysis.
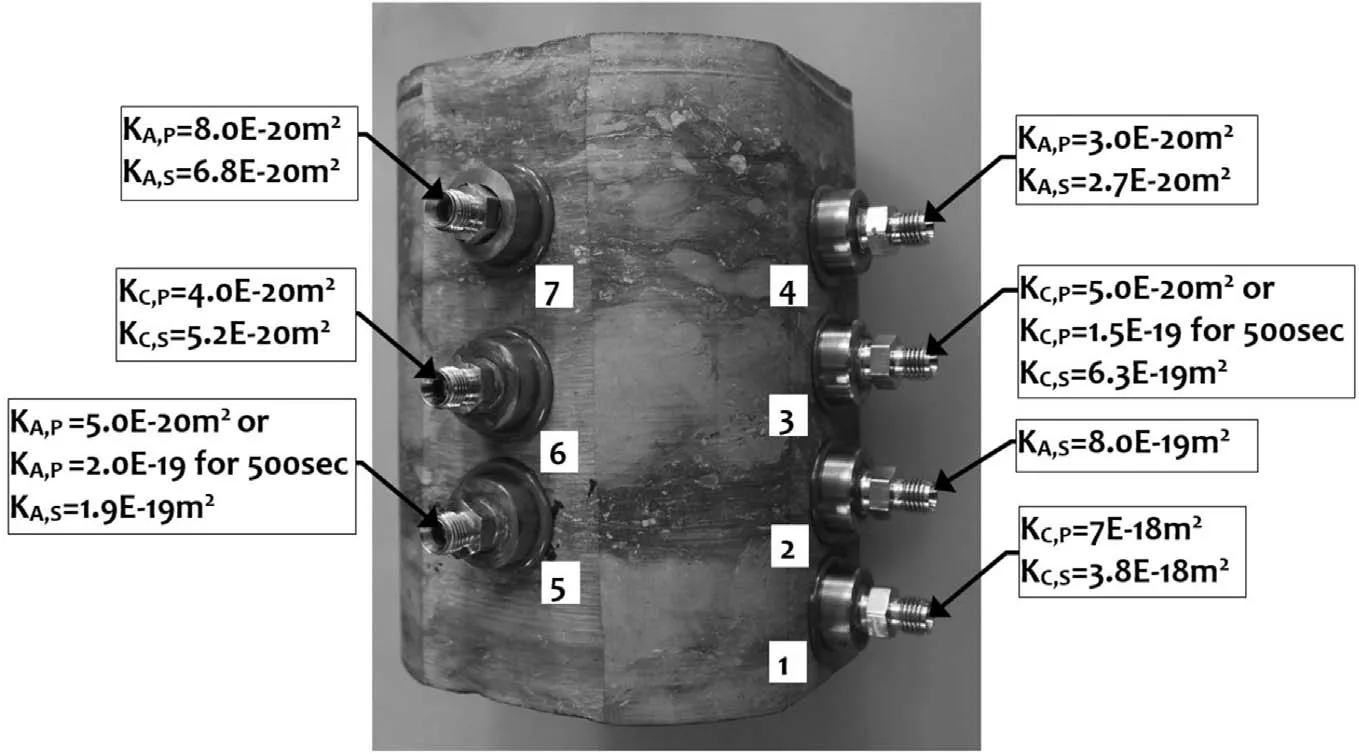
Fig.13.The Cobourg limestone with mini-port connectors epoxied onto rock species with either a light gray or dark gray limestone.The permeabilities are based on pulse tests and steady state tests.Subscript C is for the carbonate light gray material,A is for the dark gray argillaceous material,S is for the steady state test,and P is for the pulse decay test.
7.Discussion and conclusions
To complement the results obtained from hydraulic pulse tests,a series of steady state pressure tests was performed in order to confirm the accuracy of the pule test results.These results are presented in Fig.13.The results are promising from the point of view of determining hydraulic heterogeneity by using a precision pump,an epoxied and inexpensive miniature water entry port.Additionally,with the steady state method,it was possible to estimate permeabilities as low as 2.7×10⁻²⁰m2on very precise locations of the heterogeneous limestone.This procedure provides a means to determine the permeability of different species within a heterogeneous specimen,giving greater insight into which areas of a rock have a greater facility for fluid flow.
The aim of this research was to verify if there was any observable difference in permeability between the species of the Cobourg limestone using the results from the hydraulic pulse decay and steady state tests.The current research is particularly relevant for a DGR,in order to determine how much water is transported,given a specified gradient and an accurate estimation of the permeability;such information can then be used for designing a repository in order to estimate the flows on a century scale.The results show that the permeability of the species composing the Cobourg limestone falls within a range of 7×10-18-2.7×10⁻²⁰m2.Based on the results,there is one order of magnitude difference between the light gray regions and the dark gray regions(see Fig.13),excluding the location 1 results due to the discontinuity(i.e.crack).These results are supported by results on the estimation of permeability on Cobourg limestone cylinders subjected to triaxial failure stresses(Selvadurai and Głowacki,2017),where it was shown that the dark argillaceous species is the weaker material and tends to form pathways for fluid flow during failure.The accuracy of the current results for estimating the permeability of specific species can be improved by testing a larger sample with more water entry ports installed,as well as determining the exact species into which the cavity is drilled.However,the latter is difficult as CT-scanning cannot be performed on large submerged samples.The water entry port proposed in this study to measure localized permeability heterogeneity was quite effective,inexpensive and can be installed in laboratory settings as well as in situ.
Conflicts of interest
We wish to confirm that there are no known conflicts of interest associated with this publication and there has been no significant financial support for this work that could have influenced its outcome.
Acknowledgements
The authors are grateful to the reviewers for their constructive comments that lead to improvements in the presentation of the research material.The work reported in the paper was supported by NSERC Discovery and Strategic Grants awarded to the first author.The second author is grateful for the studentship support provided by a McGill Engineering Doctoral Award,FQRNT and the SAAQ.The authors would like to thank Mr.John Bartczak,Senior Technician,Civil Engineering Laboratory,McGill University for his valuable assistance and expertise in preparing the experimental facilities and Mrs.Sally Selvadurai for her editing of the manuscript.
 Journal of Rock Mechanics and Geotechnical Engineering2018年6期
- Journal of Rock Mechanics and Geotechnical Engineering的其它文章
- Numerical modeling of deep-seated landslides interacting with man-made structures
- Radial consolidation characteristics of soft undisturbed clay based on large specimens
- Influence of data analysis when exploiting DFN model representation in the application of rock mass classification systems
- Hydro-mechanical behavior of an argillaceous limestone considered as a potential host formation for radioactive waste disposal
- A simplified approach to assess seismic stability of tailings dams
- Finite element analyses of slope stability problems using non-associated plasticity